5.1 summary
TRANSCRIPT
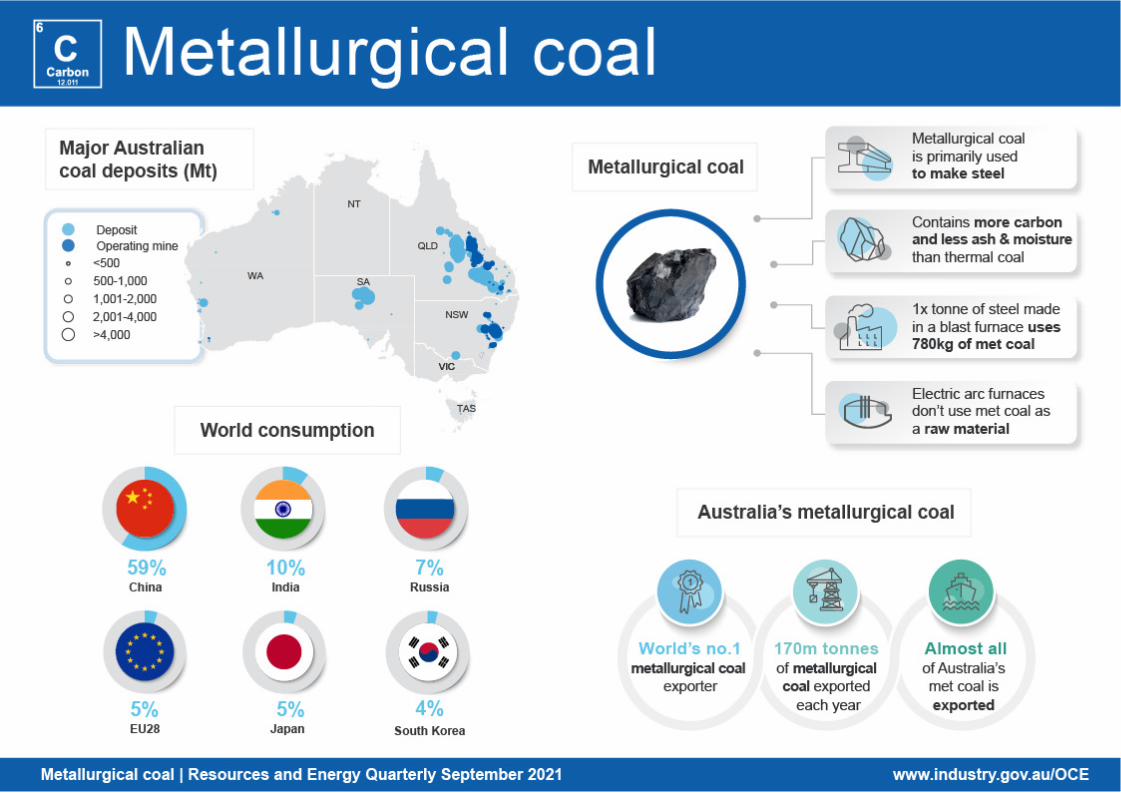


5.1 Summary Metallurgical coal prices have hit new peaks in recent months, as supply
shortages meet rebounding global industrial production. The Australianpremium hard coking coal (HCC) price is forecast to ease from anaverage US$162 a tonne in 2021 to US$159 a tonne in 2022 andUS$152 a tonne by 2023.
Australia’s exports are forecast to rise from 171 million tonnes in2020–21 to 186 million tonnes by 2022–23. Supply chains disrupted byChina’s informal import restrictions have largely reorganised(see Australia section).
Australia’s metallurgical coal export values are forecast to reverse mostof their recent decline, rebounding from $23 billion in 2020–21 to$30 billion by 2022–23.
5.2 World trade A gap has opened in metallurgical coal supply chains in recent months, with recent rapid demand growth yet to be matched on the supply side. Supply remains disrupted by the COVID-19 pandemic and associated containment measures, which have affected mines and transport. The re-organisation of supply chains following the imposition by China of informal import restrictions on Australian supply has added to the complexity, at a time when significant COVID-19 disruptions persist.
Consumer sentiment around the world is picking up — especially in Europe and the United Kingdom — where industrial activity also now appears to be gaining momentum. Purchases and production of cars and other manufactured products is rising, and the large build up of savings across many advanced Western nations over the last 18 months could fuel a potential spending boom as economic normality is restored.
Nonetheless, it is expected that prices will ease back from their recent peaks. Much of the recent surge in demand is ‘pent-up’: caused by the closure of significant steel/auto making capacity over much of 2020. As the wave of catch-up production is achieved, demand pressure on steel (and thus metallurgical coal) is likely to ease from its current peak.
5.3 World imports China’s imports are levelling off as prices lift
The Chinese Government has announced an intention to curb the nation’s steel output, with a goal to constrain volumes in 2021 to 2020 levels. The strength of the global recovery and pent-up demand for cars and other manufactured goods may put pressure on this policy, with steel output having risen in the first half of 2021. Import volumes have trended down in recent months (Figure 5.1), partly due to high prices and partly as a correction from very strong growth in 2020. Import volumes nonetheless remain strong in annual terms (Figure 5.2).
One factor likely to weigh on steelmakers is the recent surge in prices for metallurgical coal. Domestic supply in China has not been able to entirely fill the gap left by the absence of imports from Australia, forcing more imports from Russia, Canada and the US. This has come at a cost to China’s steelmakers: prices for high quality metallurgical coal have been above US$215 a tonne during the June and September quarters of 2021.
India’s metallurgical coal imports are set to recover
India is the world’s second largest steel producer and second biggest metallurgical coal buyer, and is estimated to have imported 51 million tonnes in 2020. This is down from 58 million tonnes in 2019, reflecting the effects of the COVID-19 pandemic on Indian steelmaking. In recent months, the Indian Government has announced an easing of containment measures, as the spike in COVID-19 cases in the June quarter abated. Investment plans that were previously disrupted have now been restored, with large Indian steelmakers announcing projects worth a total of US$11 billion over the next five years (though final investment decisions are yet to be made in many cases).
Indian steelmaking (and thus the importation of metallurgical coal) is consequently expected to rebound, rising slowly in the final quarter of 2021 and more rapidly from early 2022. Imports are forecast to reach 75 million tonnes by 2023 (Figure 5.2). Australia is well placed to supply much of this extra demand.
48Resources and Energy Quarterly September 2021

Japanese and South Korean imports are recovering slowly Japan is the world’s third largest metallurgical coal importer, despite a fall in imports during 2020. Some of this loss is expected to be made up as COVID-19 vaccinations roll out and steelmaking rebounds. However, post-COVID restarts will occur against a backdrop of long-term decline in Japanese steelmaking, with two major producers expected to permanently retire some capacity. Japan’s metallurgical coal imports are not expected to reach their pre-COVID levels, despite increasing slightly to around 45 million tonnes annually over the outlook period.
South Korea is the world’s fourth largest metallurgical coal importer, buying 34 million tonnes in 2020. This is about 10% below the level of 2019. Imports are expected to lift slightly over the outlook period, with steel needs being met partly from domestic steel inventories.
5.4 World exports US export volumes are in a partial recovery US supply remained largely stagnant through much of the first half of 2021, with some mines affected by labour shortages and disputes. The US has long been the world’s second largest exporter of metallurgical coal after Australia, despite relatively high production costs (Figure 5.3). US metallurgical coal exports are expected to grow modestly in 2021, partially reversing the sharp fall of 2020. However, little growth is expected from 2022. As the demand surge from Europe passes, high production costs in the US metallurgical coal industry and high transport costs to Asia will place the US at a structural disadvantage, particularly in Asia where the market is growing fastest (Figure 5.4).
Russia’s exports are recovering, supported by new infrastructure Russian exports are expected to recover from a 2020 low of 30 million tonnes to reach 37 million tonnes by 2023 (Figure 5.4). Russian coal is cheap to produce (Figure 5.3) and has low sulphur, making it suited for emerging Asian markets where pollution laws are becoming more stringent. A large quantity of new transport capacity is also expected to come online between 2022 and 2024 (see Thermal coal chapter).
Figure 5.1: China’s metallurgical coal imports, year-on-year change
-5
-4
-3
-2
-1
0
1
2
3
Australia Russia Canada Mongolia UnitedStates
Rest ofworld
World
Milli
on to
nnes
Feb-21 Mar-21 Apr-21 May-21 Jun-21
Notes: China customs released combined January/February data for 2021. Source: Bloomberg (2021); China customs (2021)
Figure 5.2: Metallurgical coal imports
0102030405060708090
100
China Japan SouthKorea
Taiwan India EU27M
illion
tonn
es
2019 2020 2021f 2022f 2023f
Notes: f Forecast. Source: IHS (2021); Department of Industry, Science, Energy and Resources (2021)
49Resources and Energy Quarterly September 2021

Mongolia’s exports remain subject to conditions in China Mongolian exports have partially recovered from a sharp fall during 2020, when trade was disrupted by Chinese efforts to contain the COVID-19 pandemic. Exports are expected to increase over the outlook period, from 26 million tonnes in 2020 to 33 million tonnes by 2023. Exports should be supported by recent tariff cuts in China under the Asia-Pacific Trade Agreement, and by the completion of a key railway connecting mines in Mongolia with buyers in northern China.
Exports from Canada could partly fill China’s Australia gap In response to China’s informal restrictions on Australian exports, Canada (among other coal exporting countries) has increased its exports to China. However, exports overall have been recently affected by forest fires, which have disrupted supply routes that feed export terminals in Vancouver. Teck, a major supplier, has already advised that previous export guidance will not be met as a result, with the bulk of the country’s fire season still yet to come. Conditions are nonetheless improving for Canadian exporters, with exports forecast to lift to 36 million tonnes by 2023 (Figure 5.4).
Figure 5.3: Metallurgical coal (including hard coking, PCI and semi-soft) global cost curve, FOB
0
20
40
60
80
100
120
140
160
0 50 100 150 200 250 300 350
US$
a to
nne
Million tonnesAustralia Russia US Canada Mozambique Mongolia RoW
Notes: FOB is Free on Board. RoW is rest of world. Source: AME Group (2021); Department of Industry, Science, Energy and Resources (2021)
50Resources and Energy Quarterly September 2021

Figure 5.4: Metallurgical coal exports
0
40
80
120
160
200
Australia US Canada Mongolia Russia Mozamb.
Milli
on to
nnes
2019 2020 2021f 2022f 2023f
Notes: f Forecast Source: IHS (2021); Department of Industry, Science, Energy and Resources (2021)
Mozambique’s exports will take time to recover Mozambique’s exports fell sharply in 2020, to an estimated 3 million tonnes, as low prices severely affected the country’s relatively high cost producers. Exports are forecast to recover to 7 million tonnes by the end of the outlook period, supported by improved global demand, the ramp up of Vale’s Moatize mine, and by upgrades to the Nacala logistics corridor rail line and port.
5.5 Prices Metallurgical coal prices volatile on China uncertainty
Metallurgical coal prices have continued to surge (Figure 5.5), driven up by tight supply and rising demand. Trade flows are expected to remain in their current alignment over the outlook period, with a price premium set to continue for metallurgical coal produced outside Australia. It is expected this price premium will weaken over time, with buyers across key markets including Korea, Taiwan, Japan and India all seeking to bring coal
Figure 5.5: Metallurgical coal prices, monthly
0
50
100
150
200
250
300
350
2012 2013 2014 2015 2016 2017 2018 2019 2020 2021
US$
a to
nne
Australian HCC Low Vol PCI Semi-soft
Notes: HCC stands for hard coking coal. PCI stands for pulverized coal for injection. Source: Platts (2021)
Figure 5.6: Metallurgical coal prices - Australian Prime Hard vs US Low Vol, FOB
050
100150200250300350400
2014 2015 2016 2017 2018 2019 2020 2021U
S$ a
tonn
eAustralian prime hard coking US Low Vol
Source: IHS (2021). Low vol = low volatile coking coal. Orange marker indicates approximate timing of informal import restrictions from China.
51Resources and Energy Quarterly September 2021

deliveries forward to meet increased demand from steelmakers. The diversion of Australian coal from China to other markets is now effectively complete, with the previous surplus of Australian supply now largely redirected.
Metallurgical coal prices are expected to remain volatile over the final quarter of 2021. Potential weather events over autumn remain the most significant upside risk to prices, with the potential to disrupt shipping from Queensland. Some broad upward price pressure is also expected to persist, as global steelmaking continues to scale up. The premium Australian HCC price is forecast to average US$162 a tonne in 2021, easing to US$159 a tonne in 2022, and US$152 a tonne 2023 (Figure 5.7).
On the downside, potential cuts in Chinese steelmaking have become more likely over the last few months. Any such cuts would likely take price pressure off non-Australian metallurgical coal, reducing the price differential (Figure 5.6) and potentially enabling further cost rebalance between China and ex-China markets.
5.6 Australia Metallurgical coal export earnings are on a strong trend Australian exports have now integrated into new supply chains, with no impact on volumes evident in the wake of the informal import restrictions imposed by China. Prices have also recovered significantly (Figure 5.7). Australian coal demand has risen significantly in South Korea (up by 56% between January and June 2021) and Japan (up by 65% between January and June 2021). European importers have also sought greater access to Australian supply, seeking to capitalise on its lower price relative to US supply.
Higher demand from India is expected to add further to pressure on Australian exports over the outlook period, with buyers in Japan, South Korea and Taiwan also expressing interest in greater supply in the December quarter. The build-up of Australian metallurgical coal inventories — which followed the commencement of Chinese import restrictions — has now largely cleared, with trade volumes fully restored.
Figure 5.7: Australian premium HCC spot price, quarterly
0
50
100
150
200
250
300
2013 2015 2017 2019 2021 2023
US$
a to
nne
Source: Platts (2021); Department of Industry, Science, Energy and Resources (2021)
Figure 5.8: Australia’s metallurgical coal export values, monthly
0
1
2
3
4
Jul-19 Jan-20 Jul-20 Jan-21 Jul-21$b
Metallurgical coal export earnings Export earnings from China
Largescale global lockdowns commence
Informal import restrictions commence
Source: ABS (2021) International Trade, Australia 5454.0
52Resources and Energy Quarterly September 2021
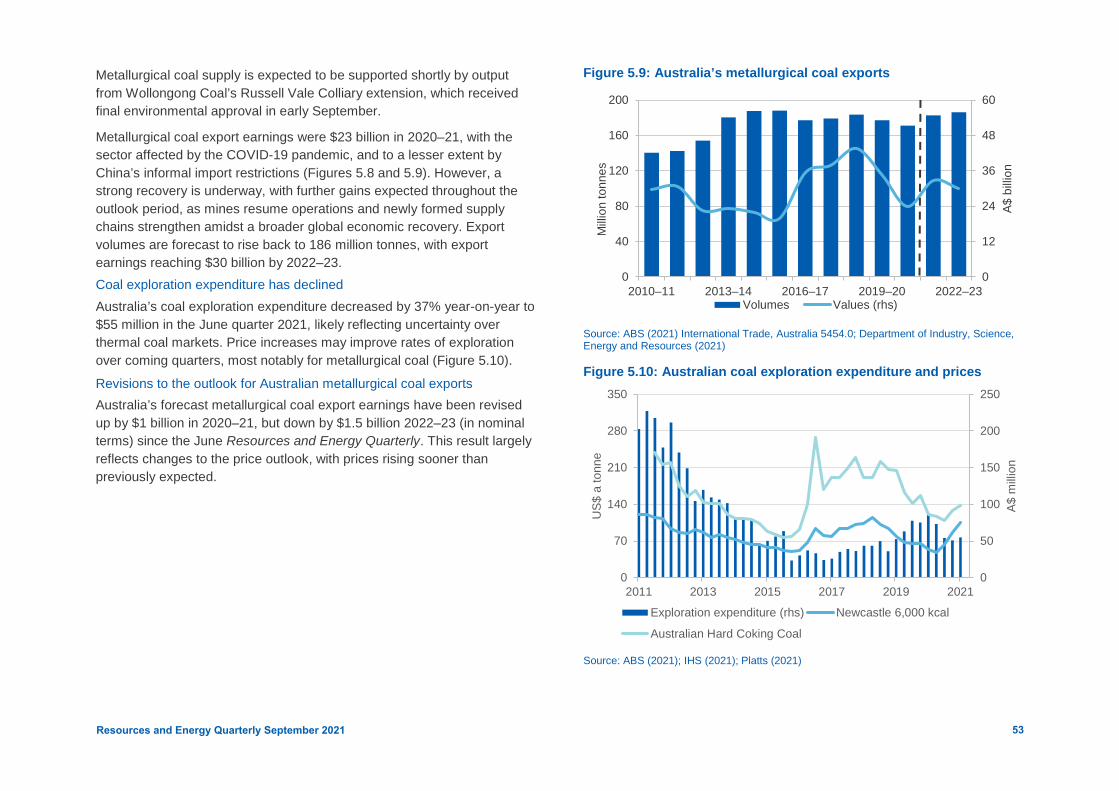
Metallurgical coal supply is expected to be supported shortly by output from Wollongong Coal’s Russell Vale Colliary extension, which received final environmental approval in early September.
Metallurgical coal export earnings were $23 billion in 2020–21, with the sector affected by the COVID-19 pandemic, and to a lesser extent by China’s informal import restrictions (Figures 5.8 and 5.9). However, a strong recovery is underway, with further gains expected throughout the outlook period, as mines resume operations and newly formed supply chains strengthen amidst a broader global economic recovery. Export volumes are forecast to rise back to 186 million tonnes, with export earnings reaching $30 billion by 2022–23. Coal exploration expenditure has declined Australia’s coal exploration expenditure decreased by 37% year-on-year to $55 million in the June quarter 2021, likely reflecting uncertainty over thermal coal markets. Price increases may improve rates of exploration over coming quarters, most notably for metallurgical coal (Figure 5.10). Revisions to the outlook for Australian metallurgical coal exports Australia’s forecast metallurgical coal export earnings have been revised up by $1 billion in 2020–21, but down by $1.5 billion 2022–23 (in nominal terms) since the June Resources and Energy Quarterly. This result largely reflects changes to the price outlook, with prices rising sooner than previously expected.
Figure 5.9: Australia’s metallurgical coal exports
0
12
24
36
48
60
0
40
80
120
160
200
2010–11 2013–14 2016–17 2019–20 2022–23
A$ b
illion
Milli
on to
nnes
Volumes Values (rhs)
Source: ABS (2021) International Trade, Australia 5454.0; Department of Industry, Science, Energy and Resources (2021)
Figure 5.10: Australian coal exploration expenditure and prices
0
50
100
150
200
250
0
70
140
210
280
350
2011 2013 2015 2017 2019 2021
A$ m
illion
US$
a to
nne
Exploration expenditure (rhs) Newcastle 6,000 kcal
Australian Hard Coking Coal
Source: ABS (2021); IHS (2021); Platts (2021)
53Resources and Energy Quarterly September 2021
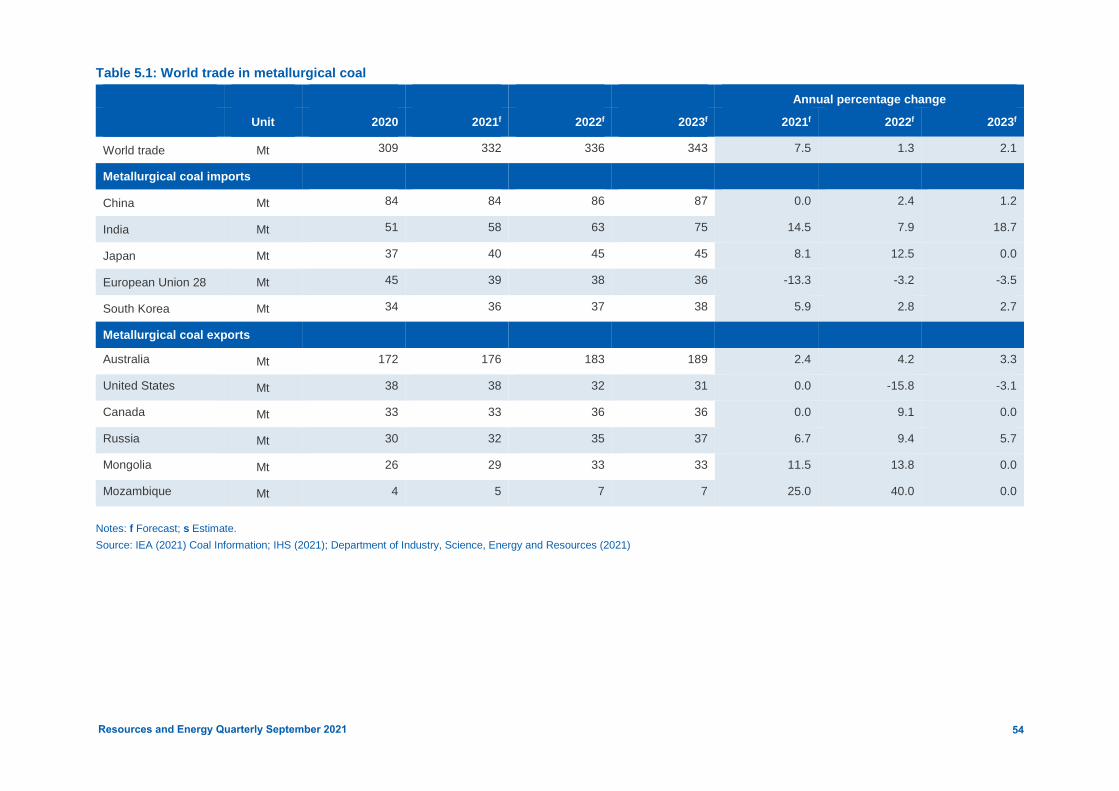
Table 5.1: World trade in metallurgical coal
Annual percentage change
Unit 2020 2021f 2022f 2023f 2021f 2022f 2023f
World trade Mt 309 332 336 343 7.5 1.3 2.1
Metallurgical coal imports
China Mt 84 84 86 87 0.0 2.4 1.2
India Mt 51 58 63 75 14.5 7.9 18.7
Japan Mt 37 40 45 45 8.1 12.5 0.0
European Union 28 Mt 45 39 38 36 -13.3 -3.2 -3.5
South Korea Mt 34 36 37 38 5.9 2.8 2.7
Metallurgical coal exports
Australia Mt 172 176 183 189 2.4 4.2 3.3
United States Mt 38 38 32 31 0.0 -15.8 -3.1
Canada Mt 33 33 36 36 0.0 9.1 0.0
Russia Mt 30 32 35 37 6.7 9.4 5.7
Mongolia Mt 26 29 33 33 11.5 13.8 0.0
Mozambique Mt 4 5 7 7 25.0 40.0 0.0
Notes: f Forecast; s Estimate. Source: IEA (2021) Coal Information; IHS (2021); Department of Industry, Science, Energy and Resources (2021)
54Resources and Energy Quarterly September 2021

Table 5.2: Metallurgical coal outlook
Annual percentage change
World Unit 2020 2021f 2022f 2023f 2021f 2022f 2023f
Contract pricese
– nominal US$/t 125 163 159 152 22.8 3.8 -4.4
– reald US$/t 129 163 156 145 18.7 1.3 -6.8
Spot pricesg
– nominal US$/t 125 162 159 152 29.3 -2.2 -4.3
– reald US$/t 130 162 155 145 25.0 -4.4 -6.6
Australia Unit 2019–20 2020–21s 2021–22f 2022–23f 2020–21s 2021–22f 2022–23f
Production Mt 183 170 188 192 -7.1 10.9 1.9
Export volume Mt 177 171 183 186 -3.5 6.7 1.9
– nominal value A$m 34,245 23,360 32,809 30,004 -31.8 40.5 -8.5
– real valuei A$m 35,458 23,801 32,809 29,492 -32.9 37.8 -10.1
Notes: d In 2021 US dollars. e Contract price assessment for high-quality hard coking coal. i In 2020–21 Australian dollars. f Forecast. g Hard coking coal fob Australia east coast ports. s Estimate. Source: ABS (2021) International Trade in Goods and Services, Australia, 5368.0; Department of Industry, Innovation and Science (2021); Platts (2021)
55Resources and Energy Quarterly September 2021