5.1 environmental pollution in coastal areas of india pollution in coastal areas of india 237 a...
TRANSCRIPT

Ecotoxicology and ClimateEdited by P. Bourdeau, J. A. Haines, W. Klein and C. R. Krishna Murti@ 1989 SCOPE. Published by John Wiley & Sons Ltd
5.1 Environmental Pollution inCoastal Areas of India
R. SEN GUPTA, SUGANDHINI NAIK AND V. V. R. VARADACHARI
5.1.1 ADDITIONS FROM LAND
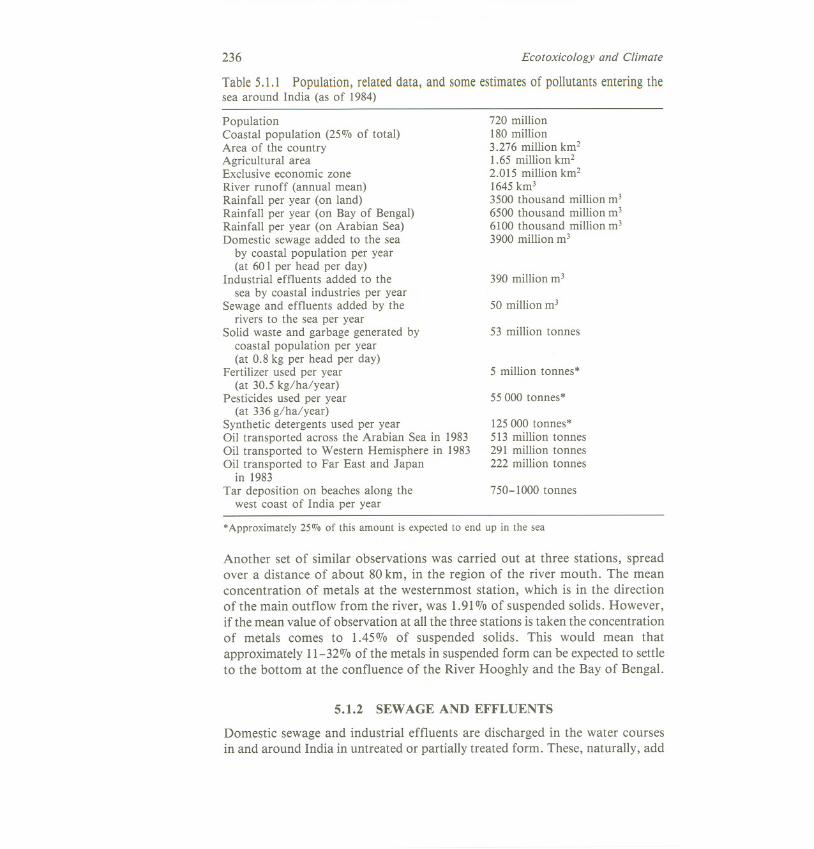
The chemistry and biology of coastal waters are very vulnerable to additionsof biodegradable and stable compounds from land. It has been estimated (Qasimand Sen Gupta, 1983) that in 1984, 5 million tonnes of fertilizers, 55 000 tonnesof pesticides, and 125000 tonnes of synthetic detergents were used in India (Table5.1.1). Roughly about 25% of all these can be expected to ultimately end upin the sea every year. Some of these substances are biodegradable while othersare persistent. Their cumulative effect over a long period could be quite harmfulto the coastal marine environment. These effects are, as yet, not very perceptibleover all the Indian coast. But near a few big cities and industrial conglomeratesthe effects are, indeed, becoming near disastrous. In the 15 years from 1959to 1974phosphate-phosphorus concentration in the nearshore waters of Bombayincreased from 0.82 to 1.13 {tmol/I, i.e. by about 40% (Sen Gupta andSankaranarayanan, 1975). The present concentration (1984) is around 2 {tmol/I(Zingde, 1985). The dissolved oxygen concentration decreased from 4.71 ml/Ito near zero in 1983 (Parulekar et al., 1986). High values of phosphate-phosphorus have also been observed at nearshore Madras (Sen Gupta,unpublished data).
Similar situations can be expected to have taken place with regard to sometoxic heavy metals. Indian rivers annually add about 1600 million tonnes ofsediment to the seas around (Holeman, 1968), a major portion of which canbe expected to settle in the nearshore regions. Most of the heavy metals aretransported to the sea this way. This can be illustrated by our observations inthe estuarine regions of River Hooghly. These were carried out in Septemberwhen the freshwater runoff, and consequently suspended solids, can be expectedto be maximum. Several heavy metals were analysed in suspended sediments,collected by filtering a large volume of water, from two stations every threehours over two tidal cycles in the final 125km stretch of the river. The meanconcentrationof metals cameto 2.14070of suspended solids on a wet weight basis,
235
236 Ecotoxicology and Climate
Table 5.1.1 Population, related data, and some estimatesof pollutants entering thesea around India (as of 1984)
PopulationCoastal population (25070of total)Area of the countryAgricultural areaExclusive economic zoneRiver runoff (annual mean)Rainfall per year (on land)Rainfall per year (on Bay of Bengal)Rainfall per year (on Arabian Sea)Domestic sewage added to the sea
by coastal population per year(at 60 I per head per day)
Industrial effluents added to thesea by coastal industries per year
Sewage and effluents added by therivers to the sea per year
Solid waste and garbage generated bycoastal population per year(at 0.8 kg per head per day)
Fertilizer used per year(at 30.5 kg/ha/year)
Pesticides used per year(at 336 g/ha/year)
Synthetic detergents used per yearOil transported across the Arabian Sea in 1983Oil transported to Western Hemisphere in 1983Oil transported to Far East and Japan
in 1983Tar deposition on beaches along the
west coast of India per year
720 million180 million3.276 million km21.65 million km22.015 million km21645 km33500 thousand million m36500 thousand million m36100 thousand million m33900 million m3
390 million m3
50 million m3
53 million tonnes
5 million tonnes*
55000 tonnes*
125000 tonnes*513 million tonnes291 million tonnes222 million tonnes
750-1000 tonnes
*Approximately 25070 of this amount is expected to end up in the sea
Another set of similar observations was carried out at three stations, spreadover a distance of about 80 km, in the region of the river mouth. The meanconcentration of metals at the westernmost station, which is in the directionof the main outflow from the river, was 1.91070of suspended solids. However,if the mean value of observation at all the three stations is taken the concentrationof metals comes to 1.45070of suspended solids. This would mean thatapproximately 11-32070of the metals in suspended form can be expected to settleto the bottom at the confluence of the River Hooghly and the Bay of Bengal.
5.1.2 SEWAGE AND EFFLUENTS
Domestic sewage and industrial effluents are discharged in the water coursesin and around India in untreated or partially treated form. These, naturally, add
Environmental Pollution in Coastal Areas of India 237
a variety of pollutants which include, among others, certain toxic heavy metalsand metalloids. The total volume of all discharges from the environs of Bombayis around 365 million tonnes (MT) per year (Sabnis, 1984). Similar dischargesfrom the environs of Calcutta are around 350 MT every year (Ghose et al., 1973).These figures would, perhaps, help towards ascertaining the total volume ofdomestic sewage and industrial effluents generated and released in India.
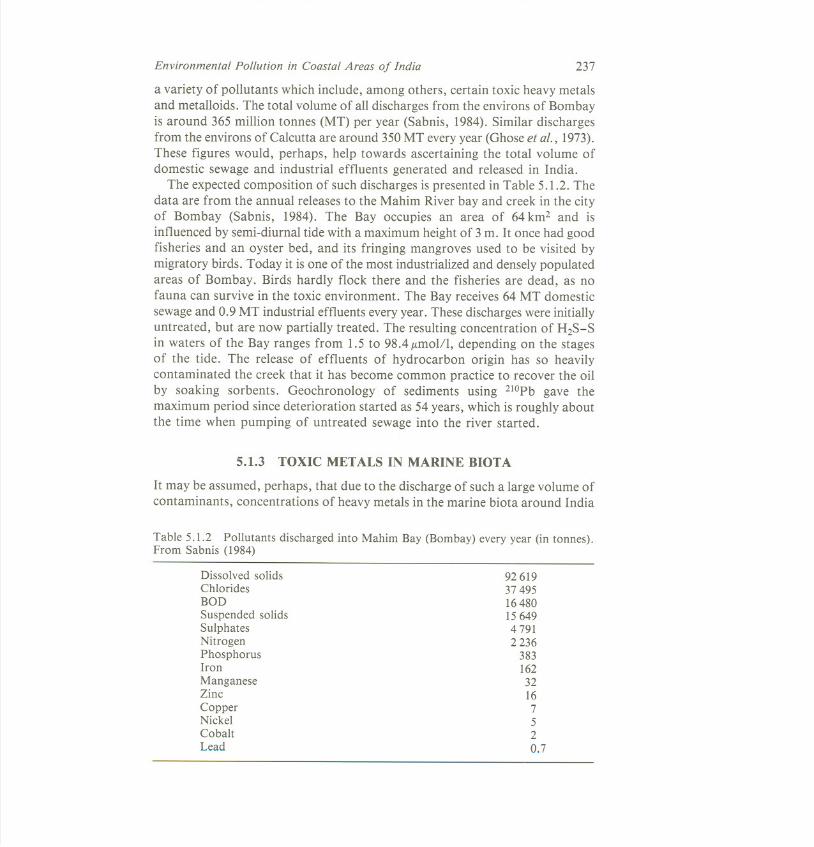
The expected composition of such discharges is presented in Table 5.1.2. Thedata are from the annual releases to the Mahim River bay and creek in the cityof Bombay (Sabnis, 1984). The Bay occupies an area of 64 km2 and isinfluenced by semi-diurnal tide with a maximum height of 3 m. It once had goodfisheries and an oyster bed, and its fringing mangroves used to be visited bymigratory birds. Today it is one of the most industrialized and densely populatedareas of Bombay. Birds hardly flock there and the fisheries are dead, as nofauna can survive in the toxic environment. The Bay receives 64 MT domesticsewage and 0.9 MT industrial effluents every year. These discharges were initiallyuntreated, but are now partially treated. The resulting concentration of H2S-Sin waters of the Bay ranges from 1.5 to 98.4 /tmol/I, depending on the stagesof the tide. The release of effluents of hydrocarbon origin has so heavilycontaminated the creek that it has become common practice to recover the oilby soaking sorbents. Geochronology of sediments using 210Pb gave themaximum period since deterioration started as 54 years, which is roughly aboutthe time when pumping of untreated sewage into the river started.
5.1.3 TOXIC METALS IN MARINE BIOTA
It may be assumed, perhaps, that due to the discharge of such a large volume ofcontaminants, concentrations of heavy metals in the marine biota around India
Table 5.1.2 Pollutants discharged into Mahim Bay (Bombay) every year (in tonnes).From Sabnis (1984)
Dissolved solidsChloridesBODSuspended solidsSulphatesNitrogenPhosphorusIronManganeseZincCopperNickelCobaltLead
92 61937495164801564947912236
38316232167520.7
238 Ecotoxicology and Climate
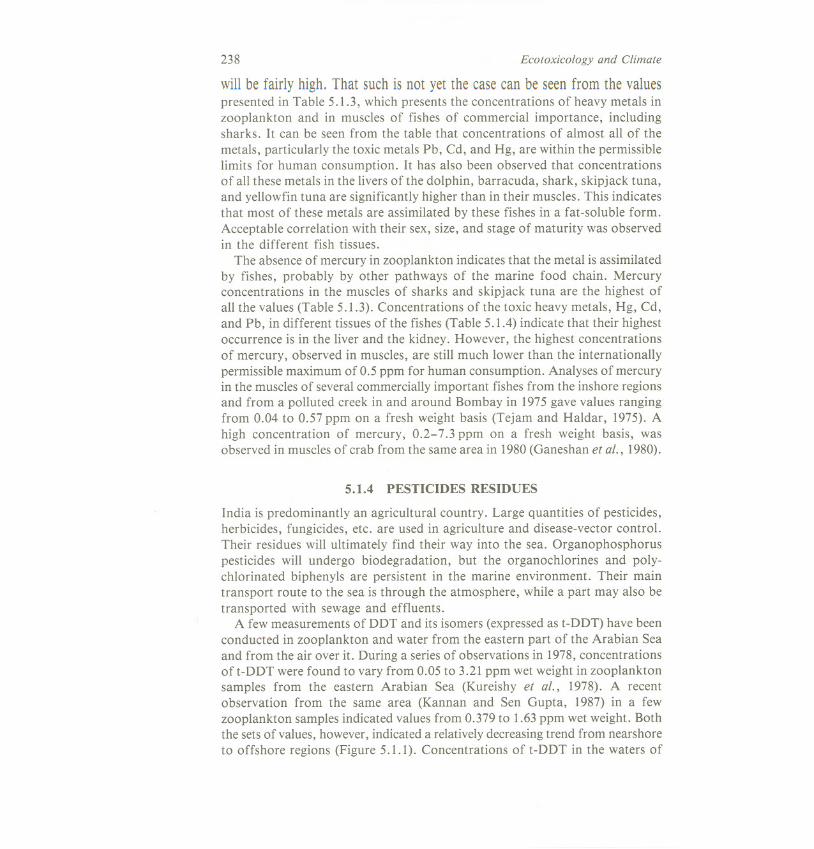
will be fairly high. That such is not yet the case can be seen from the valuespresented in Table 5.1.3, which presents the concentrations of heavy metals inzooplankton and in muscles of fishes of commercial importance, includingsharks. It can be seen from the table that concentrations of almost all of themetals, particularly the toxic metals Pb, Cd, and Hg, are within the permissiblelimits for human consumption. It has also been observed that concentrationsof all these metals in the livers of the dolphin, barracuda, shark, skipjack tuna,and yellowfin tuna are significantly higher than in their muscles. This indicatesthat most of these metals are assimilated by these fishes in a fat-soluble form.Acceptable correlation with their sex, size, and stage of maturity was observedin the different fish tissues.
The absence of mercury in zooplankton indicates that the metal is assimilatedby fishes, probably by other pathways of the marine food chain. Mercuryconcentrations in the muscles of sharks and skipjack tuna are the highest ofall the values (Table 5.1.3). Concentrations of the toxic heavy metals, Hg, Cd,and Pb, in different tissues of the fishes (Table 5.1.4) indicate that their highestoccurrence is in the liver and the kidney. However, the highest concentrationsof mercury, observed in muscles, are still much lower than the internationallypermissible maximum of 0.5 ppm for human consumption. Analyses of mercuryin the muscles of several commercially important fishes from the inshore regionsand from a polluted creek in and around Bombay in 1975gave values rangingfrom 0.04 to 0.57 ppm on a fresh weight basis (Tejam and Haldar, 1975). Ahigh concentration of mercury, 0.2-7.3 ppm on a fresh weight basis, wasobserved in muscles of crab from the same area in 1980(Ganeshan et al., 1980).
5.1.4 PESTICIDES RESIDUES
India is predominantly an agricultural country. Large quantities of pesticides,herbicides, fungicides, etc. are used in agriculture and disease-vector control.Their residues will ultimately find their way into the sea. Organophosphoruspesticides will undergo biodegradation, but the organochlorines and poly-chlorinated biphenyls are persistent in the marine environment. Their maintransport route to the sea is through the atmosphere, while a part may also betransported with sewage and effluents.
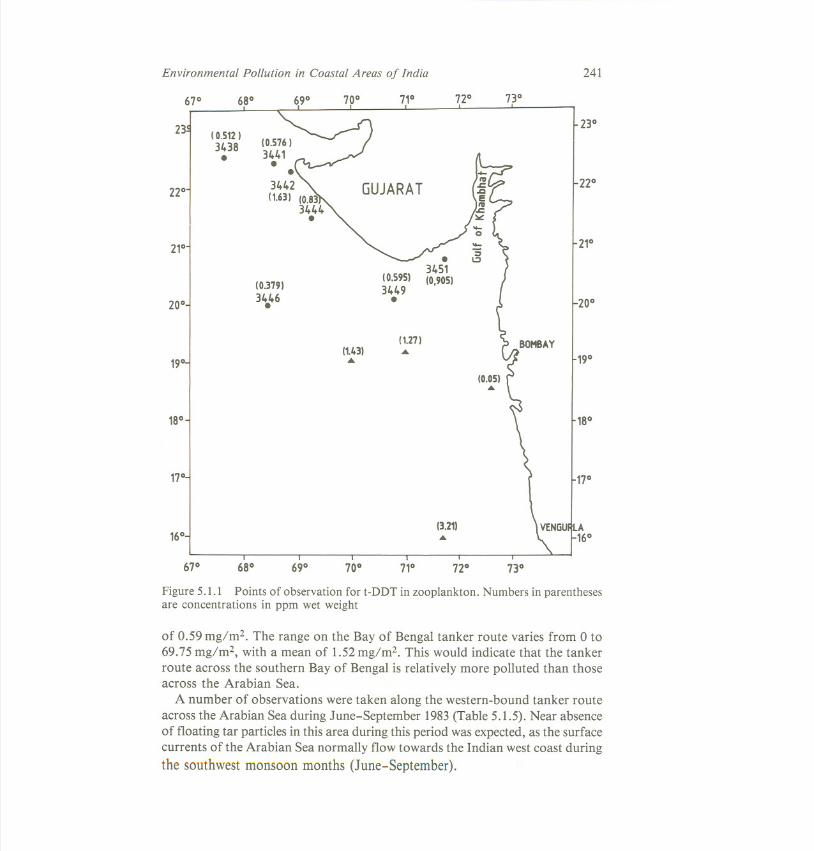
A few measurements of DDT and its isomers (expressed as t-DDT) have beenconducted in zooplankton and water from the eastern part of the Arabian Seaand from the air over it. During a series of observations in 1978, concentrationsof t-DDT were found to vary from 0.05 to 3.21 ppm wet weight in zooplanktonsamples from the eastern Arabian Sea (Kureishy et al., 1978). A recentobservation from the same area (Kannan and Sen Gupta, 1987) in a fewzooplankton samples indicated values from 0.379 to 1.63 ppm wet weight. Boththe sets of values, however, indicated a relatively decreasing trend from nearshoreto offshore regions (Figure 5.1.1). Concentrations of t-DDT in the waters of
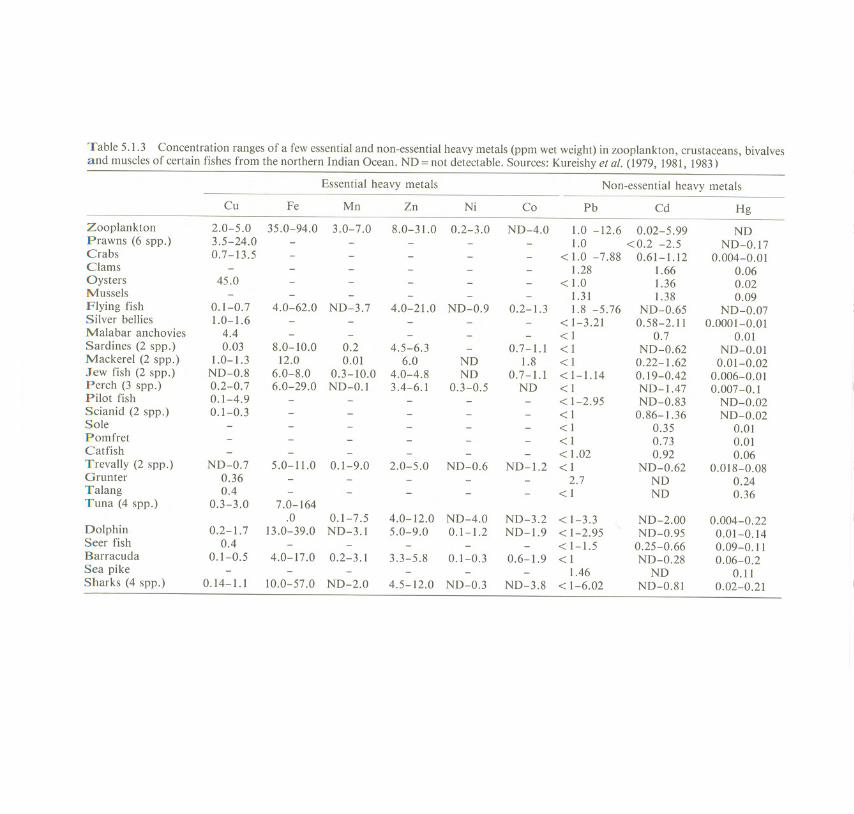
Table 5.1.3 Concentrationrangesof a fewessentialand non-essentialheavymetals(ppmwetweight)in zooplankton,crustaceans,bivalvesand musclesof certainfishesfrom the northernIndian Ocean.ND= not detectable.Sources:Kureishyet at. (1979,1981,1983)
Essential heavy metals Non-essentialheavy metalsCu Fe Mn Zn Ni Co Pb Cd
Zooplankton 2.0-5.0 35.0-94.0 3.0-7.0 8.0-31.0 0.2-3.0 ND-4.0 1.0 -12.6 0.02-5.99 NDPrawns (6 spp.) 3.5-24.0 - - - - - 1.0 < 0.2 -2.5 ND-0.17Crabs 0.7-13.5 - - - - - <1.0 -7.88 0.61-1.12 0.004-0.01Clams - - - - - - 1.28 1.66 0.06Oysters 45.0 - - - - - < 1.0 1.36 0.02Mussels - - - - - - 1.31 1.38 0.09Flying fish 0.1-0.7 4.0-62.0 ND-3.7 4.0-21.0 ND-0.9 0.2-1.3 1.8 -5.76 ND-0.65 ND-0.07Silver bellies 1.0-1.6 - - - - - < 1-3.21 0.58-2.11 0.0001-0.01Malabar anchovies 4.4 - - - - - <1 0.7 0.01Sardines (2 spp.) 0.03 8.0-10.0 0.2 4.5-6.3 - 0.7-1.1 <1 ND-0.62 ND-O.OlMackerel (2 spp.) 1.0-1.3 12.0 0.01 6.0 ND 1.8 <1 0.22-1.62 0.01-0.02Jew fish (2 spp.) ND-0.8 6.0-8.0 0.3-10.0 4.0-4.8 ND 0.7-1.1 <1-1.14 0.19-0.42 0.006-0.01Perch (3 spp.) 0.2-0.7 6.0-29.0 ND-O.l 3.4-6.1 0.3-0.5 ND <1 ND-1.47 0.007-0.1Pilot fish 0.1-4.9 - - - - - < 1-2.95 ND-0.83 ND-0.02Scianid (2 spp.) 0.1-0.3 - - - - - <1 0.86-1.36 ND-0.02Sole - - - - - - <1 0.35 0.01Pomfret - - - - - - <1 0.73 0.01Catfish - - - - - - < 1.02 0.92 0.06TrevaIIy (2 spp.) ND-0.7 5.0-11.0 0.1-9.0 2.0-5.0 ND-0.6 ND-1.2 <1 ND-0.62 0.018-0.08Grunter 0.36 - - - - - 2.7 ND 0.24Talang 0.4 - - - - - <1 ND 0.36Tuna (4 spp.) 0.3-3.0 7.0-164
.0 0.1-7.5 4.0-12.0 ND-4.0 ND-3.2 <1-3.3 ND-2.00 0.004-0.22Dolphin 0.2-1.7 13.0-39.0 ND-3.1 5.0-9.0 0.1-1.2 ND-1.9 < 1-2.95 ND-0.95 0.01-0.14Seer fish 0.4 - - - - - <1-1.5 0.25-0.66 0.09-0.11Barracuda 0.1-0.5 4.0-17.0 0.2-3.1 3.3-5.8 0.1-0.3 0.6-1.9 <1 ND-0.28 0.06-0.2Sea pike - - - - - - 1.46 ND 0.11Sharks (4 spp.) 0.14-1.1 10.0-57.0 ND-2.0 4.5-12.0 ND-0.3 ND-3.8 < 1-6.02 ND-0.81 0.02-0.21

240 Ecotoxicology and Climate
the eastern Arabian Sea were from 0.06 to 0.16 ng/l while those in the air overthe same area varied from 0.93 to 10.9 ng/m3 (Tanabe and Tatsukawa, 1980).These observations would clearly indicate that residues of organochlorines inthe marine environment of the Arabian Sea are cause for concern.
5.1.5 PETROLEUM HYDROCARBONS
In 1983 the global marine transport of oil was 1206 MT, of which 513 MT(42.5070of the total) was shipped from the Gulf countries (British Petroleum,1984; Sen Gupta and Qasim, 1985). The main routes of marine transport ofoil from the Gulf countries are across the Arabian Sea. One of these is throughthe Mozambique Channel around South Africa to the Western Hemisphere;while the other is along the west coast of India, around Sri Lanka, across thesouthern Bay of Bengal, through the Malacca Strait to the Far East, includingJapan. In 1983, 291 MT of oil was shipped to the Western Hemisphere and222 MT to the Far East, including Japan, from the Gulf countries. This, coupledwith increasing emphasis on offshore oil exploration in many countries in thearea, makes the northern Indian Ocean very vulnerable to oil pollution.
Oil pollution is caused both by accidents and by operational discharges, e.g.tanker disasters, ballast water, and bilge washings. The presence of about 75%of oil in the marine environment is due to operational discharges. Fortunately,only a few tanker disasters have occurred along these routes so far.
The effects of oil pollution on the sea are: presence of oil slicks;dissolved/dispersed petroleum hydrocarbons; floating petroleum residues (tarballs); and tar on beaches. A total of 6689 observations on oil slicks and otherfloating pollutants revealed positive results for oil slicks on 5582 or 83.5% ofthe total (Sen Gupta and Kureishy, 1981).
A summary of observations on floating petroleum residues (tar balls) fromthe surface of the Arabian Sea is presented in Table 5.1.5. The concentrationsvary in time and space; they are occasionally very high along the tanker routes.In the Arabian Sea the concentrations range from 0 to 6.0 mg/m2 with a mean
Table5.1.4 Rangesand averageconcentrationsof a few toxic heavymetals(ppm wetweight) in different body parts of fishes from the northern Indian Ocean. ND = notdetectable. Source: Kureishy et al. (1979, 1981, 1983)
BodyMercury Cadmium Lead
parts Range Average Range Average Range Average
Muscle ND-0.36 0.07 ND-3.24 0.59 1- 3.43 1.11Liver ND-0.04 0.01 1.2-87.3 20.18 1-17.62 3.8Gill ND-0.03 0.016 ND-0.76 0.42 1-7.0 3.14Heart ND-0.08 0.026 ND-1.91 0.54 1-3.4 1.36
Kidney ND-0.04 0.015 0.38-36.69 9.02 1-69.46 8.61Gonads ND-0.03 0.015 ND-8.06 1.25 1-4.76 1.36
Environmental Pollution in Coastal Areas of India
67° 68° 69° 70° 71°
2310.512)3438.
22°
21°
20°
10.37913446.
10.59513449.
19°,11.103)...
(1.27)...
18°
17°,
16°
67° 68° 69° 70° 71°
241
72° 73°
23°
22°
21°
20°
19°
18°
17°
13.21)....
72° 73°
Figure 5.1.1 Points of observation for t-DDT in zooplankton. Numbers in parenthesesare concentrations in ppm wet weight
of 0.59 mg/m2. The range on the Bay of Bengal tanker route varies from 0 to69.75 mg/m2, with a mean of 1.52mg/m2. This would indicate that the tankerroute across the southern Bay of Bengal is relatively more polluted than thoseacross the Arabian Sea.
A number of observations were taken along the western-bound tanker routeacross the Arabian Sea during June-September 1983(Table 5.1.5). Near absenceof floating tar particles in this area during this period was expected, as the surfacecurrents of the Arabian Sea normally flow towards the Indian west coast duringthe southwest monsoon months (June-September).

242 Ecotoxicology and Climate
Table5.1.5 Dissolved/dispersedhydrocarbons,particulatepetroleumresidues(tarballs)in, and transport of oil across the Arabian Sea. ND= not detectable; PI = presenceindicated
*lndicates data from the west-bound tanker route. The rest are from the east bound tanker route
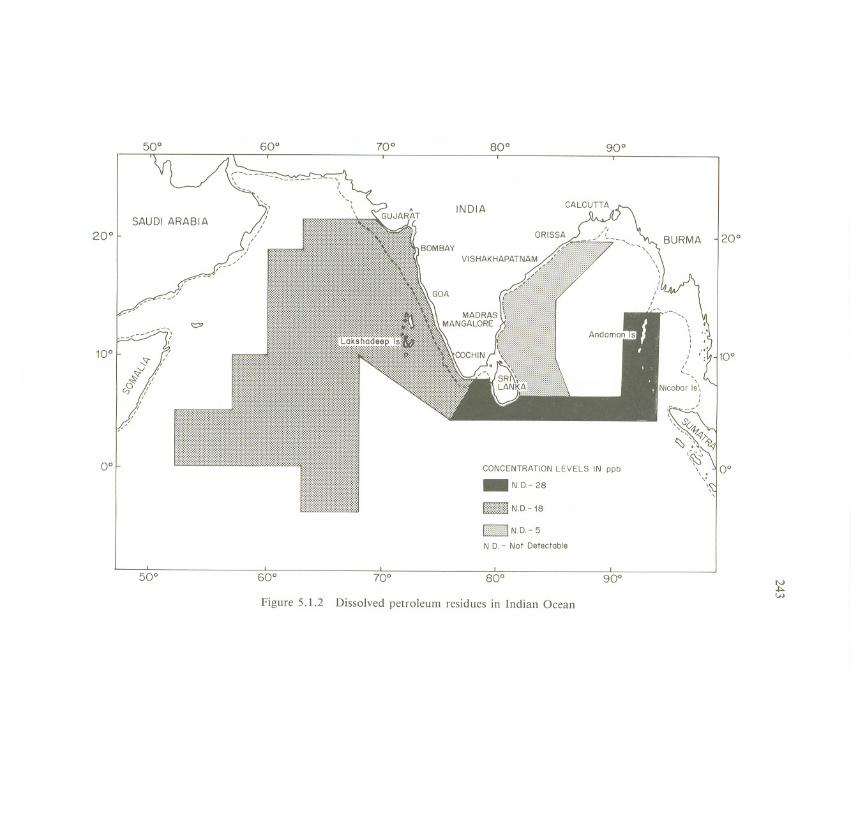
The concentrations of dissolved and dispersed petroleum hydrocarbons inthe upper 20 m of the tanker routes across the Arabian Sea are also presentedin Table 5.1.5. The ranges are almost uniform, excepting some occasional highvalues. However, some seasonal variations can be observed which are due tovarying intensities of tanker traffic and changes in meteorological factors. Thequantum of oil pollution in the northern Indian Ocean due to this, as of end1983, is presented in Figure 5.1.2.
One very interesting factor can be observed from the values in Table 5.1.5.The ranges did neither vary nor change appreciably from 1978to 1984. Marinetransport of oil and its products from the Middle East countries, however,
Dissolved/ dispersed hydrocarbons(Ilg/l)
Tar ballsMonth/year Om 10m 20m (mg/m2)
March 1978 0.6-22.9 0.9-18.1 25-28 0.02-0.32June 1978 - - - 1.26-3.46December 1978 21.5-42.8 16.8-42.5 28.6-37.5 0-0.54May 1979 - - - 0.09-6.0December 1979 18.6-41.6 16.9-34.15 10.4-24.9 -
February 1980 6.4-9.0 3.1-6.3 2.4-4.5 0-0.53October 1980 47-230 77-210November 1980 2.6-55.6 1.9-36.0January 1981 4.0-9.5 ND-2.5March 1981 200-305 130-277 - 0.30-112.2February 1982 - - - 0-0.06January 1983 9.7-24.2 6.7-13.2 2.2-7.2 0-0.06July 1983* 3.0-8.9 ND-1.2 ND-1.0 O-PISeptember 1983* 7.4-16.2 3.4-8.5 ND-1.2 O-PIOctober 1983* 5.7-10.6 2.1-5.4 ND-l.l O-PINovember 1983* 5.1-12.4 1.4-6.1 ND-1.6May 1984 22.9-114.6 18.6-62.2 18.9-72.0 0-0.06
Transport of Oil
Year Volume (million tonnes)
1977 1024.41978 974.91979 1009.61980 869.31981 725.41982 578.71983 512.9
20°
60° 70° 80° 90°
SAUDI ARABIA
20°
10°
0° CONCENTRATION LEVELS IN ppb- ND- 28
~:~:~:~::::~:~::::j N.D.- 18
ND.- 5
N.D. - Not Deteetoble
50° 60° 70° 80° 90° N.j::.w
Figure 5.1.2 Dissolved petroleum residues in Indian Ocean

GLC Analysis of Oil Samples
(1) EngineTank
<l><I>C0a.<I>i"Qj1:>(;<.)<l>a::
Retention Time (min)
(2) Sea Woter Collection
<l><I>C0a.<I>i"
<l>1:>(;<.)<l>
a::
Retention Time (min)
IR Spectre of Oil Samples
(1) Engine Tank tV.j::..j::.
~<l><.)C """"""""", ,,',',E 4000 3600 3200 2800 2400 2000 1800 1600 1400 1200 1000 800 600 400
~ Wavenumber (cm-1)<I>c0
~(2) Sea Water Collection
Spectofluorometric AnalysIs of Oils
(1 ) Engine TankExcitation,310 nmScanning emission from600nmRange" 10
Damp, 5
356 nm
.~<I>C<l>C 358 nm<l><.)C<l><.)<I><l>
(;:J
lL
( 2 ) Sea Watercollection
Figure 5.1. 3
Wavelength (nm)
A case study of an oil pollution incident in an Indian harbour

Environmental Pollution in Coastal Areas of India 245
decreased significantly over the same period (Table 5.1.5). This leads us to twoconclusions. Oil pollution in the surface waters of the Arabian Sea did notundergo much quantitative alteration over the years and is not directly relatedto the volume transported. The pollution is mainly due to operational dischargesof bilge and bunker washings of the tankers on their way to the Gulf ports forloading the cargo of oil.
Deposition of tar-like residues on the beaches is a chronic problem along thewest coast of India. However, this is a seasonal phenomenon depending on thepattern of coastal circulation, largely regulated by the monsoons. Records fromthe west coast of India during the years 1975 and 1976 indicate a range from22 to 448 mg/m2, with a peak value on one occasion of 1386g/m2. Thecomputed total deposits on beaches along the west coast of India are 1000 and750 tonnes for 1975 and 1976 respectively (Table 5.1.1).
In the nearshore area of Bombay high concentrations of dissolved/dispersedhydrocarbons ranged from 2 to 46 p,g/l in water and from 4 to 32p,g/g dry weightin sediments. In the Bombay harbour region the concentrations, after a tankerfire accident, ranged from 27 to 105p,g/l at the surface and from 36 to 59 p,g/lat 5 m. The concentrations in sediments increased from 1-26 p,g/g to 40-512 p,g/gafter the accident. In a polluted creek in Bombay concentrations in sedimentswere in the high range of 142-393 p,g/g.
Cargo ships and oil tankers, visiting Indian ports, may cause oil pollutionin harbour waters by operational or accidental discharges of oil and oily ballasts.According to MARPOL 1973/1978 (Convention of the International MaritimeOrganization) such spills are highly irregular and the owners of the ships areliable to pay compensation to the harbour authorities for clean-up operations.It is difficult, however, to identify the source of pollution and to match it tooil in harbour waters. The analytical techniques for such matching are:UV/spectrofluorometry, IR-spectrometry, and gas chromatography. A casestudy of one such incident in an Indian harbour (Bhosle et al., 1987)is presentedin Figure 5.1.3.
5.1.6 REFERENCES
Bhosle, N. B., Fondekar, S. P. and Sen Gupta, R. (1987). Sampling and analysis ofpetroleum hydrocarbons in the marine environment. Indian J. of Mar. Sci., 16,192-195.
British Petroleum (1984). British Petroleum Statistical Review of World Energy. BritishPetroleum, London.
Ganeshan, R., Shah, P. K., Turel, Z. R., and Haldar, B. C. (1980). Study of heavyelements (Cd, Hg and Se) in the environment around Bombay by radiochemical neutronactivation analysis. Trans. 4th. Internat. Con! on Nuclear Methods in Environ. andEnvironmental Res. Univ. Missouri, USA.
Ghose, B. B., Ray, P., and Gopalakrishnan, V. (1973). Survey and characterization ofwaste waters discharged into the Hooghly estuary. J. Inland Fisheries Soc. India,S,82-101.

246 Ecotoxicology and Climate
Holeman, J.N. (1978).The sediment yield of major rivers of the world. Waf. Resour.Res., 4, 787-797.
Kannan, S. T., and Sen Gupta, R. (1987). Organochlorine residues in zooplankton offthe Saurashtra Coast, India. Mar. Pollut. Bull., 18 (2), 92-94.
Kureishy, T. W., George, M. D., and Sen Gupta, R. (1978). DDT concentration inzooplankton from the Arabian Sea. Indian J. of Mar. Sci., 7, 54-55.
Kureishy, T. W., George, M. D., and Sen Gupta, R. (1979). Total mercury content insome marine fish from the Indian Ocean. Mar. Pollut. Bull., 10, 357-360.
Kureishy. T. W., Sanzgiri, S., and Bragania, A. M. (1981). Some heavy metals in fishesfrom the Andaman Sea. Indian J. of Mar. Sci., 10, 303-307.
Kureishy, T. W., Sanzgiri, S., George, M. D., and Braganca, A. M. (1983). Mercury,cadmium and lead in different tissues of fishes from the Andaman Sea. Indian J. ofMar. Sci., 12, 60-63.
Parulekar, A. H., Ansari, Z. A., Harkantra, J., and Rodrigues, A. C. (1986). Long-term variations in benthic macro-invertrebrate assemblage of Bombay waters. In:Thompsen, M. F., Sarojini, R., and Nagabhushanam, R. (eds), Biology of MarineBenthic Organisms, pp. 485-494. Oxford and IBH Pub!. Co., New Delhi.
Qasim, S. Z., and Sen Gupta, R. (1983). Environmental characteristics of the ocean.In: Pfafflin, J. R., and Zeigler, E. N. (eds), Encyclopedia of Environmental Scienceand Engineering, vo!. I, pp. 294-309. Gordon and Breach Science Publishers, NewYork.
Sabnis, M. M. (1984). Studies on some Major and Minor Elements in the Polluted MahimRiver Estuary. Doctoral dissertation, University of Bombay.
Sen Gupta, R., and Sankaranarayanan, V. N. (1975). Pollution studies off Bombay.Mahasagar-Bull. Nat. Inst. of Oceanography, 7, 73-78.
Sen Gupta, R., and Kureishy, T. W. (1981). Present state of oil pollution in the northernIndian Ocean. Mar. Pollut. Bull., 12, 295-301.
Sen Gupta, R., and Qasim, S. Z. (1985). Petroleum-its present and future.Mahasagar-Bull. Nat. Inst. of Oceanography, 18, 79-90.
Tanabe, S., and Tatsukawa, R. (1980). Chlorinated hydrocarbons in the North Pacificand the Indian Ocean. J. Oceanogr. Soc. Japan., 36, 217-226.
Tejam, B., and Haldar, B. C. (1975). A preliminary survey of mercury in fish fromBombay and Thana environment. J. Environ,. Hlth., 17, 9-16.
Zingde, M. D. (1985).Waste water effluents and coastal marine environment of Bombay.Proceedings, Sea water quality demands, pp.20.1-20.23. Naval Chemical andMetallurgical Laboratory, Bombay.