5.0 pq hot-line calls & case studies
TRANSCRIPT

© 2018 Electric Power Research Institute, Inc. All rights reserved.
5.0 PQ Hot-Line Calls
& Case Studies
Alden Wright, PE, CEM, CP EnMS
EPRI Industrial PQ and EE Group

2© 2018 Electric Power Research Institute, Inc. All rights reserved.
EPRI Industrial Site Assessments 1996-2016
13 Sites in 2016

3© 2018 Electric Power Research Institute, Inc. All rights reserved.
PQ Hotline Calls-Of-The-Month
▪ This project directly benefits the
utility and their customers.
▪ EPRI operates a hot-line for
funding members to ask power
quality questions from all topics.
▪ Each month, the best question
and EPRI response is presented
at the “Hot Line Call of the
Month.”
ASD Line Current =143.8 Amp RMS
-400
-300
-200
-100
0
100
200
300
400
0 0.004 0.008 0.012 0.016
-1
-0.5
0
0.5
1
0 1 2 3 4 5 6 7 8
Duration (4 Cycle)
Magnitude (50% of nominal)

© 2018 Electric Power Research Institute, Inc. All rights reserved.
Hot Line Calls of the
Month

5© 2018 Electric Power Research Institute, Inc. All rights reserved.
January 2014: Understanding UPS Types and Their Ability
to Harden Industrial Controls to Voltage Sags: Part 1
▪ Question: Via EPRI’s PQ Knowledge (PQK) Power Quality Hotline, a PQK funder asked which is the best uninterruptible power supply (UPS) to use for protecting industrial processes?
▪ Answer: The answer, of course, is, “It depends,” especially on the types of processes and industrial control loads that you are trying to protect.
▪ This first part of a two-part series on selecting the right UPS technology for your application discusses the three major UPS topologies.
▪ The second part will investigate a case study on the consequences of applying the wrong type of UPS.
Industrial process loads, such
as relays and programmable
logic controllers (PLCs) may
be vulnerable to voltage sags.

6© 2018 Electric Power Research Institute, Inc. All rights reserved.
Background
▪Occasionally, facility engineers attempt
to mitigate voltage sags by installing an
uninterruptible power supply (UPS) on
critical process controls or individual
components.
▪Different UPS topologies with different
strengths and weaknesses are available
for purchase.
▪ If the wrong UPS topology is applied to
industrial control components, it may
not harden the process to voltage sags
and may in fact make the ride-through
performance of the industrial equipment
worse.
Although uninterruptible
power supplies are
designed to protect
sensitive loads, some
topologies may not be
suitable for sensitive
industrial controls.

7© 2018 Electric Power Research Institute, Inc. All rights reserved.
UPS Types
▪ A Standby UPS is the type often found at a local computer store intended to backup a desktop computer in the event of a power outage. This UPS is normally bypassed
▪ A Line-interactive UPS is very similar to a standby UPS—the major difference between the two being that some kind of voltage-regulation transformer is located between the transfer contactor and the load. The regulation transformer is typically a fast-switching auto transformer or a constant voltage transformer.
▪ The Online UPS design is significantly different from the two topologies previously described. An online UPS rectifies the input voltage, converting it to DC, and recreates AC voltage for the load.
There are three basic
UPS topologies.

8© 2018 Electric Power Research Institute, Inc. All rights reserved.
UPS Found in the Facility: Why a Standby UPS May Not Work
for Industrial Control Applications
▪The control cabinet used a standby UPS in several locations throughout the facility.
▪The standby UPS technology has a switch between the line and the inverter output connection. – This switch is typically a relay or
contactor. Relay contacts do not switch instantaneously; in fact, they may take more than a 60-Hz cycle (or 16 milliseconds) to accomplish the switching operation.
– This single-cycle delay can cause sensitive loads to drop out.
A standby UPS was
used to prop up a PLC
at a food-processing
facility

9© 2018 Electric Power Research Institute, Inc. All rights reserved.
Sensitivity of Items in Control Cabinet

10© 2018 Electric Power Research Institute, Inc. All rights reserved.
Discussion
▪The response time of this UPS largely depends upon the response time of the relay used to switch from the source voltage to the inverter voltage, an action that, as described earlier, may take a full cycle.
▪The two devices in the ride-through curve shown indicate that these loads trip due to a 10-millisecond interruption.
▪Since the UPS must have time to detect an event before executing the transfer, the whole operation from detection to transfer may well exceed the voltage sag tolerances of these two devices.
▪A standby UPS would typically work well with devices such as desktop computers but may not be the best choice for industrial components.
▪The power supply inside a computer typically contains a significant amount of capacitance for DC bus filtering.
▪These capacitors have a secondary effect in that they add some voltage sag ride-through capability that enables the computer to operate normally through the transfer stage of the standby UPS.

11© 2018 Electric Power Research Institute, Inc. All rights reserved.
January 2014: Understanding UPS Types and Their Ability
to Harden Industrial Controls to Voltage Sags: Part 2
▪ When conducting power quality audits, EPRI
engineers occasionally encounter a component for
which a ride-through curve does not exist in the EPRI
ride-through database.
• Various voltage sag generators designed by
EPRI—ranging in size from 15 amperes
(single-phase) to 200 amperes (three-
phase)—can create voltage sags or swells
from a quarter cycle to 3 seconds in
increments of one-quarter cycle and from
120% to 0% of nominal voltage on demand.
• EPRI engineers may take the 15-A suitcase
model called the Porto Sag to the PQ audit to
test components that are not already in the
EPRI database.

12© 2018 Electric Power Research Institute, Inc. All rights reserved.
UPS Low-Voltage Detection Too Low
▪ The test demonstrated that the UPS
did not attempt to transfer to the
alternative source until the voltage
dropped to 70% of nominal voltage.
▪ The figure shows the UPS output 5-
cycle voltage sag to 75% of the
nominal voltage.
▪ The waveform shows that the UPS
did not transfer during that sag and
indeed would have passed the sag to
the PLC.
▪ The voltage sag ride-through of one
of the typical PLCs in the facility was
1 cycle at 78% of nominal voltage.
▪ Therefore, this event would have
shut down the PLC.
A 5-cycle voltage sag to 75% of
nominal voltage did not trigger
the UPS to switch to its
alternative source.

13© 2018 Electric Power Research Institute, Inc. All rights reserved.
UPS Transfer Too Late
The UPS that was used in the food-processing
facility exhibited intolerable latency when
switching to and from alternative power.

14© 2018 Electric Power Research Institute, Inc. All rights reserved.
Transfer Time Acceptable at Lower Sag Voltages
The UPS protected its load during a 1-cycle
voltage sag to 55% of nominal voltage.

15© 2018 Electric Power Research Institute, Inc. All rights reserved.
UPS Response against PQ Data
Area where UPS provides protection.
Area where PLC and Relay can Still Shutdown!

16© 2018 Electric Power Research Institute, Inc. All rights reserved.
What Type of UPS for Industrial Applications?
▪An online or
“rectifier/charger” UPS would
probably be the
recommended UPS should a
UPS be absolutely necessary
to support industrial control
loads.
▪The reason that an online
UPS may be a better choice
than a standby UPS for
mitigating the effects of
voltage sags on industrial
controls is that the output
voltage is continuous.
The output of an ultracapacitor-based UPS is
continuous and sinusoidal, even during deep
voltage sags

17© 2018 Electric Power Research Institute, Inc. All rights reserved.
Other Considerations When Specifying a UPS
1. What is the type of output waveform? Some discrete PLC AC input cards tested at EPRI cannot render a 0 or 1 when the input signal is a square wave.
2. Is long-term coverage during voltage interruptions necessary? Battery-less mitigation devices can provide short-term coverage and require little to no maintenance.
3. If interruption coverage is necessary for industrial controls, does the maintenance staff understand that it must support the batteries reliably in multiple units? A large distributed UPS approach to centralize the battery maintenance may be preferable.
4. How may the charge level of a battery and the battery’s condition be monitored? Specify a UPS that provides a battery health contact that may be monitored by a PLC or other monitoring device. Knowing the health of the battery is good insurance that the UPS is going to support its load during the next voltage sag.

18© 2018 Electric Power Research Institute, Inc. All rights reserved.
Conclusion
▪When applying UPS technology to industrial control circuits,
the person in charge of specifying the UPS must understand
the different types of UPS technology and the effects that
they may have on industrial controls.
▪The UPS that EPRI engineers discovered in the food-
processing facility discussed in this Hotline Call of the Month
was the wrong choice to support industrial controls for two
main reasons:
– The low voltage transfer setting of the UPS was below the
susceptibility of the industrial control loads.
– Occasionally, the transfer between normal power to the inverter was
too long to support the sensitive loads.

19© 2018 Electric Power Research Institute, Inc. All rights reserved.
Conclusion (cont.)
▪When specifying power conditioning for industrial control loads, interruption coverage for the process controls may not be necessary.
▪ If long-term voltage interruption coverage is not necessary—as in this case—battery-less solutions for voltage sags, such as the ultracapacitor-based UPS, Dynamic Sag Corrector (DySC), or constant-voltage transformer (CVT), may provide effective mitigation against voltage sags, without battery maintenance.
▪Should a battery-based UPS be necessary for multiple control cabinets, a central UPS providing mitigation for all cabinets may minimize battery maintenance.
▪Specifying an appropriate UPS for a specific application is not difficult when the engineer understands the available UPS topologies and the potential effects that their voltage output may have on the end-use equipment.
© 2018 Electric Power Research Institute, Inc. All rights reserved.
HealthCare
Facilities
21© 2018 Electric Power Research Institute, Inc. All rights reserved.
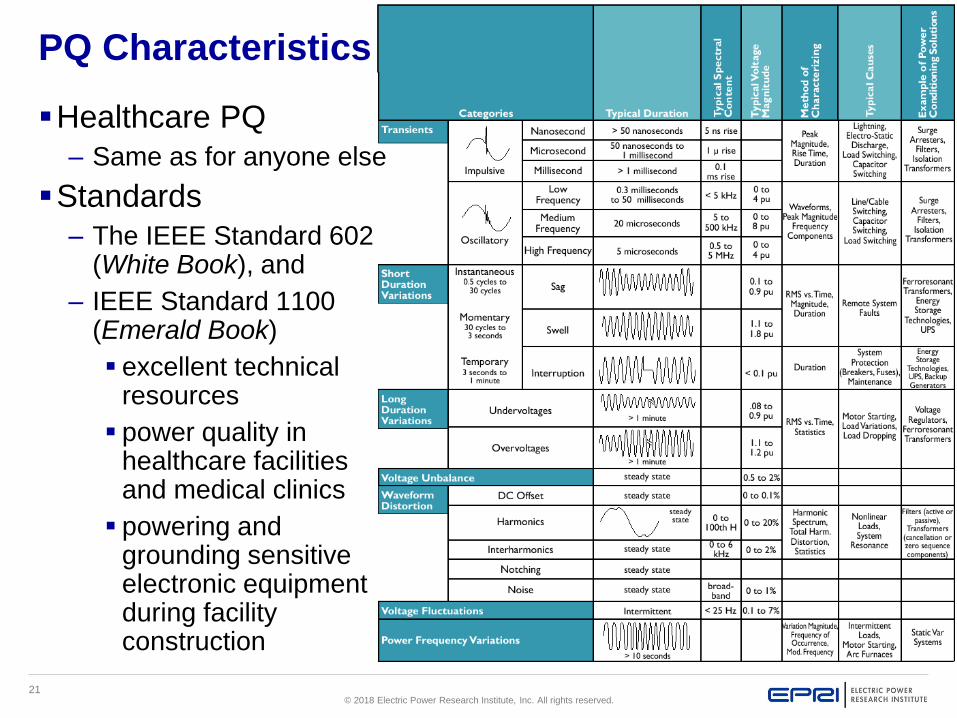
PQ Characteristics
▪Healthcare PQ
– Same as for anyone else
▪Standards
– The IEEE Standard 602 (White Book), and
– IEEE Standard 1100 (Emerald Book)
▪ excellent technical resources
▪ power quality in healthcare facilities and medical clinics
▪ powering and grounding sensitive electronic equipment during facility construction

22© 2018 Electric Power Research Institute, Inc. All rights reserved.
Service Ground
A conductor,
Not by conduit

23© 2018 Electric Power Research Institute, Inc. All rights reserved.
Isolated Ground
Only sensitive
equipment and
only to marked
outlets

24© 2018 Electric Power Research Institute, Inc. All rights reserved.
Separately-derived System
25© 2018 Electric Power Research Institute, Inc. All rights reserved.
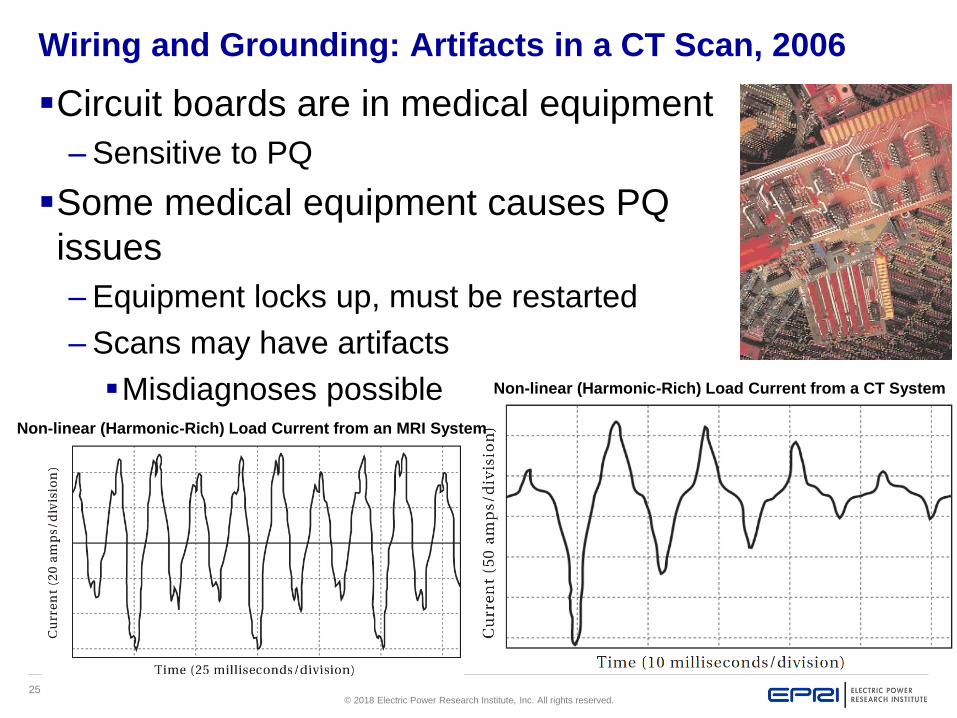
Wiring and Grounding: Artifacts in a CT Scan, 2006
▪Circuit boards are in medical equipment
– Sensitive to PQ
▪Some medical equipment causes PQ
issues
– Equipment locks up, must be restarted
– Scans may have artifacts
▪Misdiagnoses possible Non-linear (Harmonic-Rich) Load Current from a CT System
Non-linear (Harmonic-Rich) Load Current from an MRI System

26© 2018 Electric Power Research Institute, Inc. All rights reserved.
How Bad Could it Be?
▪Artifact-infested electrocardiograph (top)
– appears to match a textbook example of arrhythmia (bottom)
▪ (reproduced from Capuano, 1993)
▪300 beats per minute or 5 hertz
– accepted and diagnosed as arrhythmia, or atrial flutter
▪Scan artifacts may resemble tumors
Arrhythmia?
NO!
YES!

27© 2018 Electric Power Research Institute, Inc. All rights reserved.
What Caused These Issues?
▪Wiring and grounding problems
▪Voltage Sags and momentary interruptions
▪Overvoltages
▪Harmonics propagating into sensitive equipment
▪Etc.

28© 2018 Electric Power Research Institute, Inc. All rights reserved.
What Equipment Might be Sensitive?
▪Anything from
– a simple blood pressure monitor
– to a complex medical imaging system
– or a heart-lung bypass machine—
– virtually all are susceptible to electrical and
electromagnetic disturbances
– Chiller system (heater contactor elsewhere)

29© 2018 Electric Power Research Institute, Inc. All rights reserved.
What to Do?
▪Examine grounding System
and Facility Ground
▪ Install PQ meter
– ~$2500 or less for the meter
▪Maintain UPSs
– Batteries last 3 years
– Is it line-interactive or
standby?
▪ Double conversion is best
▪Examine line isolation
monitor (LIM) alarm for
unintended grounds (thru
patient)
– Was 2 mA, now 5 mA
▪ 10 mA can cause muscle
contractions

30© 2018 Electric Power Research Institute, Inc. All rights reserved.
March 2010: OV fault tripping of ASD caused by
Capacitor-Switching Transients
▪Question: Via EPRI's PQ Knowledge (PQK) Power Quality Hotline, a PQK funder asked EPRI engineers about periodic nuisance tripping in its six-pulse adjustable-speed drives (ASDs).
▪These nuisance trips seemed to correlate with a 34.5-kV capacitor bank being switched into service at the substation. The fault code on the drives was "Overvoltage."

31© 2018 Electric Power Research Institute, Inc. All rights reserved.
Problem Description
▪ Capacitor-switching operations are one of
the most common causes of transient
overvoltages on the power system.
▪ When a capacitor bank is energized, it
interacts with the system inductance,
causing a resonant condition.
▪ The transient overvoltage caused by a
capacitor-switching event can be
between 1.0 to 2.0 p.u., but is most
commonly between 1.3 and 1.4pu, with
frequencies between 250 and 1,000 Hz.
▪ One of the more common problems
associated with a switching transient is
the tripping off of electronically controlled
loads such as ASDs, as in this case.
March 2010: OV fault tripping of ASD caused by Capacitor-Switching Transients

32© 2018 Electric Power Research Institute, Inc. All rights reserved.
Analysis
▪When an ASD is exposed to a
substantial transient overvoltage, the
DC bus in the drive may exceed the
overvoltage trip point, causing the ASD
to trip offline due to "Overvoltage."
▪When the ASD experiences this
overvoltage, a fault code is typically
shown on its LED front display that
reads "OV," similar to that shown.
▪An ASD overvoltage trip point may be
as low as 1.2 p.u. on its DC bus (760
Vdc on a 480-Vac unit).
March 2010: OV fault tripping of ASD caused by Capacitor-Switching Transients

33© 2018 Electric Power Research Institute, Inc. All rights reserved.
Capacitor Switching Transient
A Circuit Model Replicates a
Capacitor-Switching Event
Switching on the Capacitor Bank
Creates a Transient Overvoltage
The Transient Overvoltage Causes the
DC Bus Voltage in the ASDs to Increase
above Their Overvoltage Trip Point
March 2010: OV fault tripping of ASD caused by Capacitor-Switching Transients

34© 2018 Electric Power Research Institute, Inc. All rights reserved.
Reducing Service Transformer Tap Setting
▪ If the tap setting on the plant's
transformer is reduced from 1.05 to
0.975, it will lower the voltage
magnitude of the DC buses in the
ASDs.
▪ The reaction of a DC bus to the
capacitor-switching event is shown
after lowering the transformer tap.
▪ This may reduce the risk of ASDs
tripping on overvoltage….
– but it also exposes other plant
loads to a lower service voltage,
possibly increasing plant
vulnerability to voltage sags.
Reducing the Tap Setting of the
Transformer Causes the ASD Bus
Voltage to Stay Below its
Overvoltage Trip Point during the
Capacitor-Switching Event
March 2010: OV fault tripping of ASD caused by Capacitor-Switching Transients

35© 2018 Electric Power Research Institute, Inc. All rights reserved.
Installing AC Line Reactors or Isolation Transformers
▪ One of most effective ways to
eliminate nuisance tripping is to
isolate an ASD from the power
system with an AC-line reactor or
an isolation transformer.
▪ The additional series inductance
will reduce the magnitude of a
transient overvoltage that appears
at the input of an ASD.
▪ Determining how much
inductance is required for a
particular application usually
requires a fairly detailed transient
simulation; however, typical
values are 3% of the ASD rating.
Isolating an ASD from the Power System
by Adding an Input Reactor Can Reduce
the Magnitude of the Transient Voltage
That Appears at the ASD Input
March 2010: OV fault tripping of ASD caused by Capacitor-Switching Transients
36© 2018 Electric Power Research Institute, Inc. All rights reserved.
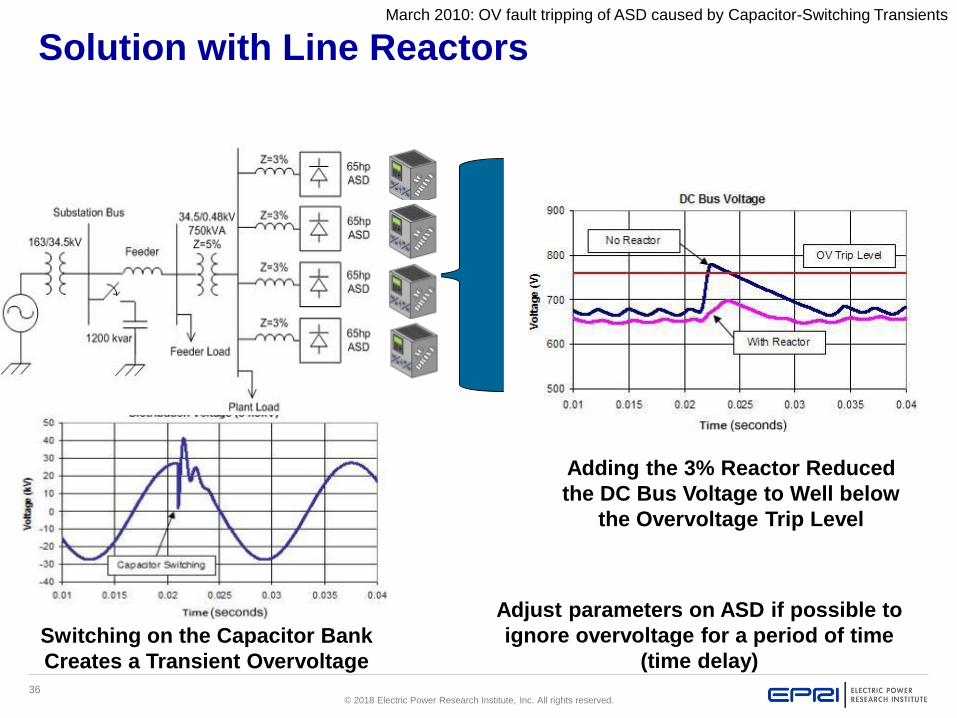
Solution with Line Reactors
Switching on the Capacitor Bank
Creates a Transient Overvoltage
Adding the 3% Reactor Reduced
the DC Bus Voltage to Well below
the Overvoltage Trip Level
March 2010: OV fault tripping of ASD caused by Capacitor-Switching Transients
Adjust parameters on ASD if possible to
ignore overvoltage for a period of time
(time delay)

37© 2018 Electric Power Research Institute, Inc. All rights reserved.
What about Local Power Factor Correction?
▪ If the plant has local power-factor correction on the 480-Vac side of the service transformer, another concern would be voltage magnification.
▪ In this case, voltage magnification may occur if the substation switching event excites a local resonance at the plant.
▪ This will make the transient high enough that isolation transformers or reactors may not work.
▪ In this case, the local power-factor-correction capacitors may need to be detuned by adding an inductance in series with the capacitor bank to decrease the transient voltage to an acceptable level.
480 Volt Compensation Level (kVAr)
Voltage (pu)
1.00
1.50
2.00
2.50
3.00
0 100 200 300 400 500 600
Compensation = Capacitors
Compensation = Filters
1500 kVA Transformer3000 kVAr Switched Capacitor Bank
Detuning Local PFC Caps with Inductors
(Typically @ 4.7th Harmonic)
March 2010: OV fault tripping of ASD caused by Capacitor-Switching Transients

38© 2018 Electric Power Research Institute, Inc. All rights reserved.
Conclusion
▪ Capacitor-switching operations are a
common cause of overvoltage
transients.
▪ There are several options that may
be used to limit the effect that these
transient overvoltages have on
ASDs.
▪ The solution may range from going
to a lower tap on the service
transformer (if available) or adjusting
some protection parameters on the
ASD itself (most ASDs do not have
this feature).
▪ Or the solution may be a little more
difficult, where isolation impedance
may need to be added or de-tuning a
capacitor in the facility is needed.
Here, Reactors Are Installed Next to ASDs
March 2010: OV fault tripping of ASD caused by Capacitor-Switching Transients

© 2018 Electric Power Research Institute, Inc. All rights reserved.
Case Studies in PQ

© 2018 Electric Power Research Institute, Inc. All rights reserved.
Voltage Sag study at a
Pharmaceutical
Manufacturing Plant

41© 2018 Electric Power Research Institute, Inc. All rights reserved.
Introduction
▪Located in a rural area, a pharmaceutical manufacturing
customer was experiencing voltage sag induced shutdowns of
their critical fluid beds.
▪The facility reported several PQ events from 2013 to 2015. The
pharmaceutical manufacturing facility reached out to the Utility
to assist in troubleshooting these PQ issues.
▪Working in cooperation, the pharmaceutical company and the
Utility brought in EPRI to review the electrical environment, the
plant equipment, and offer possible solutions as to what could
be done at the plant to maintain service during normal system
conditions, which typically includes some level of voltage
fluctuation.
▪This paper presents a case study of the analysis, findings, and
details the successful outcome of the work at the
pharmaceutical manufacturing facility.

42© 2018 Electric Power Research Institute, Inc. All rights reserved.
Pharmaceutical Plant Process & PQ Sensitivity
▪ The purpose of a fluid bed is to create a vortex in which raw chemicals used to make pharmaceutical drugs are levitated and liquid ingredients are systematically sprayed on to a circular placebo.
▪ This process occurs in a closed environment as shown in the example fluid bed.
▪ Any fluctuation in the power may cause this sensitive process to shut down.
▪ If the vortex stops the ingredients fall to the bottom of the chamber and coagulates.
▪ Such events can lead to:
– Hours of downtime to cleanup and reclaim the ingredients
– Catalog lost product and rectify with the FDA
– After proof of reclamation more controlled ingredients may be purchased potentially resulting in weeks of lost production time.
Typical Fluid Bed

43© 2018 Electric Power Research Institute, Inc. All rights reserved.
Why was this Audit Chosen as a Case Study?
▪ Sensitive controls found throughout the facility.
▪ Product loss and downtime costs at the facility prompted the customer to request:
– voltage sag solutions
– critical load coordinated shutdown
– and 2MVA switchboard solutions
▪ Facility already has 1MW generator and various automatic transfer switches that may be used in a mitigation scheme.
▪ Initially the facility engineer assumed he could have no interruption of power.
– Through collaboration with EPRI engineers, the facility engineer, and process engineer it was discovered that a controlled shut down solution is possible thus less expensive than providing protection for the whole switchboard.
Typical Fluid Bed

44© 2018 Electric Power Research Institute, Inc. All rights reserved.
Power System Overview
▪The facility is supplied 12kV power from the Utility’s Substation.
– The substation accepts power from the 138 kV system from one of two transformers.
▪The facility is powered from XT1 22.4MVA transformer.
– Transformer sources three circuits.
– The branch lines are sourcing a mix of residential, commercial, and industrial loads.
Power System Overview
Facility
45© 2018 Electric Power Research Institute, Inc. All rights reserved.
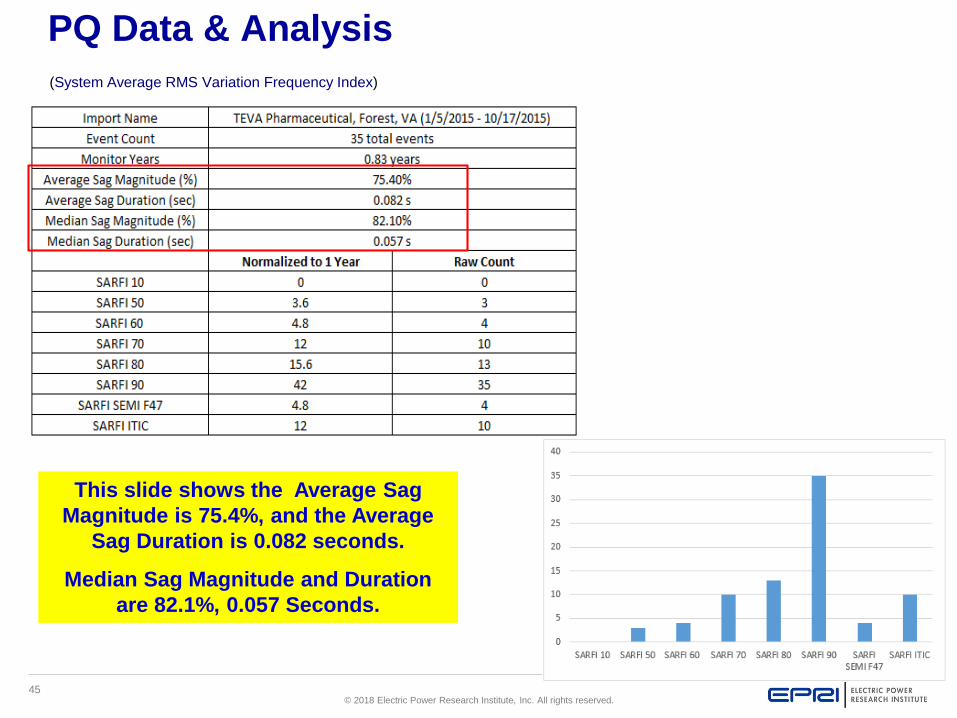
PQ Data & Analysis
(System Average RMS Variation Frequency Index)
This slide shows the Average Sag
Magnitude is 75.4%, and the Average
Sag Duration is 0.082 seconds.
Median Sag Magnitude and Duration
are 82.1%, 0.057 Seconds.

46© 2018 Electric Power Research Institute, Inc. All rights reserved.
Utility Suggestion for circuit protection
▪ There is a new Sub-Division being constructed across the street from the facility. The contractors working in the subdivision have contacted the power cables while trenching on a couple of occasions thus resulting in the substation breaker to operate.
▪ The utility investigated the issue and has taken the following action:
– Removed the instantaneous fault response of the upstream breaker to allow for downstream primary tap line fuses to open.
– This scheme should reduce the potential of momentary interruptions on the main Cavalier circuit due to faults on the branch feeds.
– This will not eliminate station breaker operations.

47© 2018 Electric Power Research Institute, Inc. All rights reserved.
1st Key Finding from On-Site Audit
▪ All of the fluid bed control equipment in the facility has a purge timer before the system is allowed to operate.
– This timer circuit is a delay on timer that closes an Ice Cube relay with a 120Vac Coil sensitive to voltage sags lower than 72% nominal.
– The contacts of the relay supplies all 120Vac control power to the circuit.
– Most of the controls are powered 24Vdc from a power supply that receives power from the 120V control power downstream of the Ice Cube relay.
– The DC power supply was tested and found to trip for voltage sags 3cycles 60% nominal.
– Therefore any voltage sag on the control power lower than 72% nominal will result in the loss of control power.

48© 2018 Electric Power Research Institute, Inc. All rights reserved.
2nd Key Finding from On-Site Audit
▪ The facility air handler adjustable
speed drives (ASDs) are known to be
very robust to voltage sags, however:
– The air handler ASD enable signal is
complete when both input and output
damper feedback switches are closed
indicating they are fully open.
– The damper actuator motors are
controlled by the building automation
system (BAS) through 24Vac Ice Cube
Relays
– If a voltage sag less than 72% nominal
occurs these relays open removing
power from the damper actuator motors
causing them to close.
– The end switches open causing the
drive to trip.

49© 2018 Electric Power Research Institute, Inc. All rights reserved.
3rd Key Finding from On-Site Audit
▪During the audit we located a
UPS in the facility whose load
was plugged into a “Surge
only” outlet.

50© 2018 Electric Power Research Institute, Inc. All rights reserved.
4th Key Finding from On-Site Audit
▪ During the drawing analysis we noticed that the pneumatic instrument air requirements for the FESTO system in Glatt 2 (seen in all other fluid beds as well) are
– 100psi/7bar minimum
– Air consumption is 30CFM
▪ The nominal air pressure at the facility is set to 116lb.
▪ The enable and run signals for the compressors are fed through the contacts of sensitive Ice Cube Relays.
ENABLE
Run

51© 2018 Electric Power Research Institute, Inc. All rights reserved.
Types of Control Level Solutions Selected
▪ MiniDySC
– Control Circuit Mitigation
– Static Series Compensator
with Capacitor Storage
– 50ms of voltage interruption
(more time at reduced load)
– 5 seconds of voltage sag
protection to 50% nominal. MiniDySC
Single Phase Input Power
Control
Loads
CPT
MiniDySC

52© 2018 Electric Power Research Institute, Inc. All rights reserved.
Control Level Solutions
Original Susceptibility of
Controls
Susceptibility of
Controls with
MiniDySC
* These solutions are designed to protect for voltage sags.
A generator with bridge power solution will be necessary for extended
interruptions.*

53© 2018 Electric Power Research Institute, Inc. All rights reserved.
Total Voltage Sag Mitigation Solution Costs
Option 1 recommendations are typically less expensive than Option 2.
Option 2 recommendations often provide ridethrough for deeper and
longer voltage sags.
Option 1 Option 2
All Areas *Estimated Total $12,172.58 $23,882.64
The customers indicated that they will implement all of
the Option 2 Recommendations.

© 2018 Electric Power Research Institute, Inc. All rights reserved.
Boiler Controls at a
Food and Beverage
Facility

55© 2018 Electric Power Research Institute, Inc. All rights reserved.
Background
▪Recently we had a PQ audit at
a facility that had a room with
two boiler units, their assorted
controls cabinets, and a
monitoring/control room.
▪The control cabinets had
several AC ice cube relays
inside. The Monitoring/control
room had some small UPSs
for backup power.
▪Some of the other stand alone
control cabinets had AB
PLC5s with AC I/O.

56© 2018 Electric Power Research Institute, Inc. All rights reserved.
Analysis and Walkdown
▪Where is the control power coming
from?
▪After reviewing their drawings, it
was determined that most of the
sensitive equipment was being
powered from a distribution panel
in the same area.
– The panel was a 120/208V 3Ø,
with a 150A main breaker.
▪This distribution panel was being
sourced from a 45kVA 480V –
120/208V Xfmr. The panel to the
left of the distribution panel was the
480V panel sourcing the 45kVA
Xfmr.

57© 2018 Electric Power Research Institute, Inc. All rights reserved.
Analysis of the PQ Environment
▪What does the PQ
environment look like?
▪Based on the PQ events
data, the PLC 5 and the AC
ice cube relays are right in
the area of most of the
events this facility were
seeing.
▪What would be best option
to mitigate these events and
provide a wider area of
protection?
58© 2018 Electric Power Research Institute, Inc. All rights reserved.
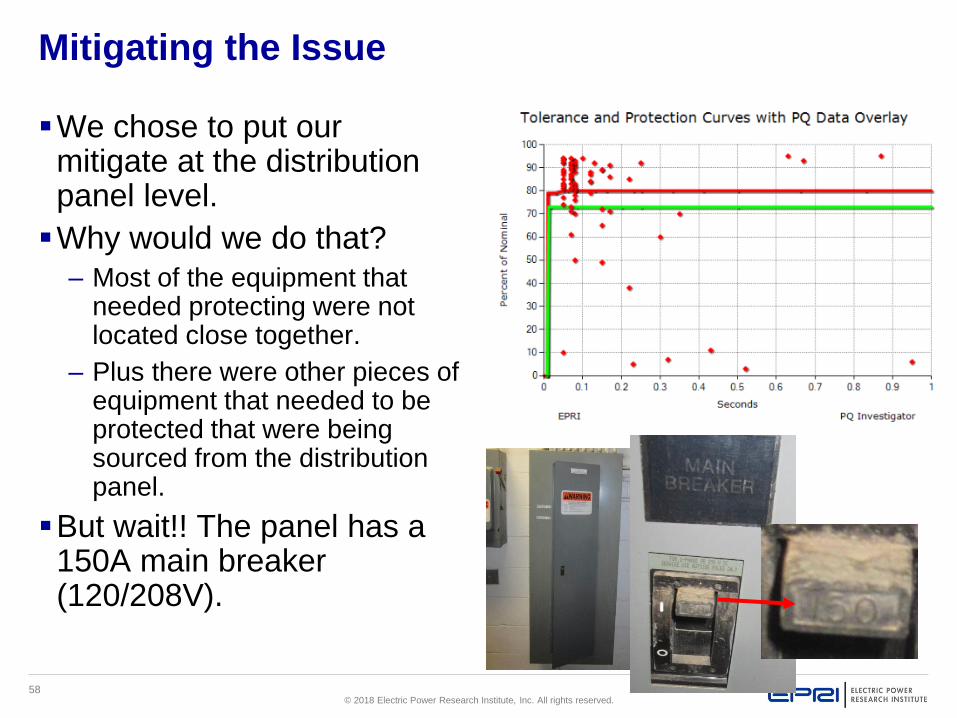
Mitigating the Issue
▪We chose to put our mitigate at the distribution panel level.
▪Why would we do that?
– Most of the equipment that needed protecting were not located close together.
– Plus there were other pieces of equipment that needed to be protected that were being sourced from the distribution panel.
▪But wait!! The panel has a 150A main breaker (120/208V).

59© 2018 Electric Power Research Institute, Inc. All rights reserved.
Solution
▪ The mitigation device chosen was an
AB ProDySC rated at 100A for 480V.
▪ This was the cheapest option, and
could be put up stream of the 45kVA
480V-120/208V Xfmr.
▪ This option would protect everything
the 120/208V distribution panel, and
allow some room to move a few other
critical items over to the panel for
protection as well.

© 2018 Electric Power Research Institute, Inc. All rights reserved.
Plastic Extrusion
Plant with PQ Issues

61© 2018 Electric Power Research Institute, Inc. All rights reserved.
Extruders, Extruders, Extruders…..
▪A plant utilized extruders to manufacture foam plates.
▪The extruders were using DC drives; mostly older vintage and some newer models.
▪They were using two extruders and drives for each line; Primary and Secondary.
▪This particular line had two newer models, but this particular drives cabinet was still using older permissives for the controls.– Control Transformer (CPT)
75VA
– AC Ice Cube Relays for Run, Field Run, and MX.

62© 2018 Electric Power Research Institute, Inc. All rights reserved.
Examining the PQ Environment
▪ What did the PQ Environment
look like?
▪ The permissive run signals
from the AC ice cube relays are
right in the area of the most
events at this facility.
▪ This helped explain why these
drives were shutting down
during PQ events on the
incoming power.
– The facility keep
complaining that it was the
utilities fault that they were
having lines tripped off line.
▪So what do we do to
mitigate this???
63© 2018 Electric Power Research Institute, Inc. All rights reserved.
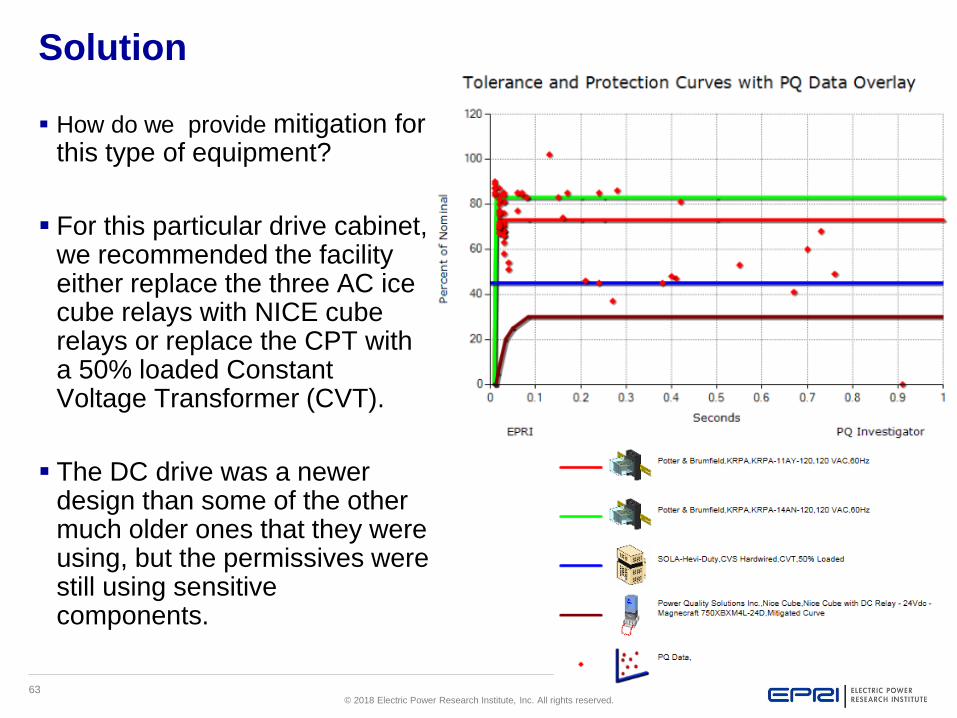
Solution
▪ How do we provide mitigation for this type of equipment?
▪ For this particular drive cabinet, we recommended the facility either replace the three AC ice cube relays with NICE cube relays or replace the CPT with a 50% loaded Constant Voltage Transformer (CVT).
▪ The DC drive was a newer design than some of the other much older ones that they were using, but the permissives were still using sensitive components.

© 2018 Electric Power Research Institute, Inc. All rights reserved.
James Owens, CEM, CPQ
EPRI
UPS Mayhem at a Soft
drink Bottling Plant

65© 2018 Electric Power Research Institute, Inc. All rights reserved.
UPSs used for Protection of Critical Controls at a
facility▪A PQ audit at a soda
bottling facility was
conducted.
▪As part of our initial
questions we asked if
they had done any
mitigation for their
equipment.
– They replied “We have
UPSs sprinkled around the
plant.”
– We replied, “Ok, we’d like to
see them when we are on-
site.”
▪What do you see????

66© 2018 Electric Power Research Institute, Inc. All rights reserved.
Looking Closely at the Drawings and the UPS
▪Apparently
the UPS had
failed on
them at
some point in
time, and as
a work
around they
bypassed the
UPS by
using a
‘power strip’
to power the
critical loads. 24VDC Power Supplies
Device Net Power
Meter Power
Netgear Switch
External RJ45/
Power Outlet
AB PLC 5
UPS

67© 2018 Electric Power Research Institute, Inc. All rights reserved.
UPS against PQ Environment?
▪ Once again, here is a facility
with a PQ environment that
has a majority of its PQ
events right in the trip range
of an AB PLC5.
▪ They had tried doing
something by installing a UPS
to provide back-up power.
▪ But like most places we see,
once the UPS is installed it’s
forgotten.
▪ Failed in Service
– Critical Loads put in power
strip instead
▪ So what did we recommend??

68© 2018 Electric Power Research Institute, Inc. All rights reserved.
Solution
▪ This particular location, we
recommended that they
completely remove the UPS; as
it was no longer usable.
▪ We suggested that they rewire
the way the circuits are sourced
and install either an AB
MiniDySC or a 50% loaded
CVT.
▪ This would provide them the
ride-through needed based on
the PQ environment.

69© 2018 Electric Power Research Institute, Inc. All rights reserved.
Another UPS in the Plant….
▪ Same plant different location.
▪ They are again using a UPS
for back-up power.
▪ What do you see??

70© 2018 Electric Power Research Institute, Inc. All rights reserved.
UPS Was Intended to Protect What???
▪ What is the most sensitive
component in the cabinet from a
control power standpoint?
▪ There is a 10A DC Power
Supply downstream of the UPS.
▪ Again, we find an AC ice cube
relay being used as a controls
permissive.
▪ It’s not on UPS power, but even
if it were, the control power is
plugged into the Surge
Protection Only outlet on a UPS
and the UPS is on Battery (unit
is faulted).
▪ What do you do, same PQ
environment as the last UPS
location??
71© 2018 Electric Power Research Institute, Inc. All rights reserved.
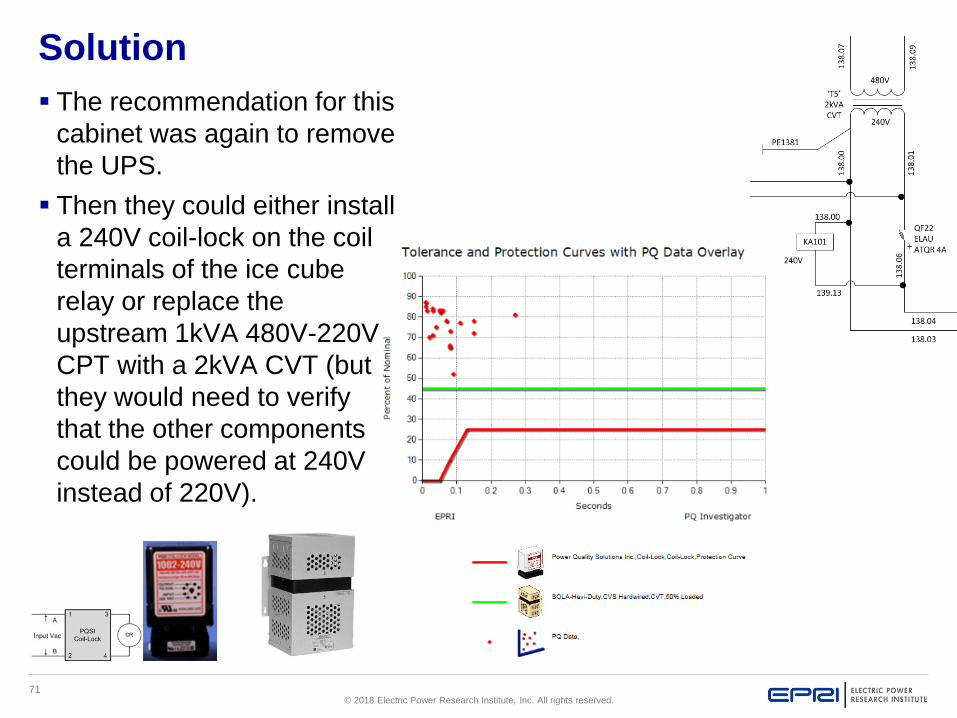
Solution
▪ The recommendation for this
cabinet was again to remove
the UPS.
▪ Then they could either install
a 240V coil-lock on the coil
terminals of the ice cube
relay or replace the
upstream 1kVA 480V-220V
CPT with a 2kVA CVT (but
they would need to verify
that the other components
could be powered at 240V
instead of 220V).
© 2018 Electric Power Research Institute, Inc. All rights reserved.
Protecting Critical and
Sensitive Process
Equipment at an
Automotive Supplier

73© 2018 Electric Power Research Institute, Inc. All rights reserved.
INTRODUCTION
▪An automotive manufacturing part supplier experiencing shutdowns called upon EPRI to help it decrease power disturbance – related delays. – This manufacturer supplies fuel injectors to two of the big
three U.S. automotive manufacturers.▪Just-in-time (JIT) is a type of inventory management system
common in the automotive industry.▪ In this particular case, a voltage sag event caused a supply
shock to multiple engine assembly plants. – In fact, the event was so devastating that the supplier had
to fly parts directly to each assembly line to avoid a fine of $1 million per hour that the engine assembly process was delayed.
– The root cause of this supply shock event was a power disturbance that caused a drive and motor on one assembly machine to fail.
– Had this manufacturer had a spare drive and motor in stock, the shock could have been minimized. Instead, this supplier experienced a four-day process delay.

74© 2018 Electric Power Research Institute, Inc. All rights reserved.
SCOPE OF WORK
▪After a power disturbance caused the devastating
supply shock, the fuel injector manufacturer organized a
task force to reduce or prevent this from occurring in the
future.
–The task force comprised operations, maintenance
(facility and operations), external consultants (EPRI),
and the local electric utility.
▪The goal of the task force was to identify the root cause
of the power disturbance and find a method to isolate or
eliminate the probability of reoccurrence.

75© 2018 Electric Power Research Institute, Inc. All rights reserved.
STRATEGY
▪The manufacturer and local utility identified the root cause of the process shutdown to be a 30-cycle interruption.
▪Knowing that a power disturbance was the root cause of the shutdown, the team’s goal was to reduce the potential of future power disturbance – related shutdowns.
▪The local utility was assigned the task of evaluating its infrastructure to identify areas for improvement, while EPRI was asked to evaluate the process equipment’s sensitivity to power disturbances.
▪EPRI draws upon an extensive knowledge base gained through over 600 industrial power quality projects. Its goal was to identify the elements of the critical process machines sensitive to power disturbances and recommend mitigation solutions to reduce the occurrence of power disturbance –related shutdowns.

76© 2018 Electric Power Research Institute, Inc. All rights reserved.
Step 1: Identification of Most-Critical and/or Most-
Sensitive Process Equipment
▪The manufacturer identified 10 of its most critical or most sensitive process equipment. – In order to provide the
most accurate analysis and recommendation, all equipment affected by power disturbances had to be included in the project.
– This is imperative because many process machines are either electrically or mechanically interlocked to one another, and an unidentified weakness of one system could negate any improvements done to others.

77© 2018 Electric Power Research Institute, Inc. All rights reserved.
Step 2: Evaluation of the Equipment’s Electrical
Environment
▪ Power disturbances: a normal component of the industrial electrical environment.
▪ Equipment shutdowns or misoperations may result from incompatibility between the equipment and its environment.
▪ The more compatible with its environment, the less likely that equipment shuts down due to disturbances.
▪ To determine the compatibility level of equipment, the electrical environment must be characterized by monitoring and recording power disturbances over time.
▪ Fortunately, the manufacturer’s local utility had recorded voltage sags and interruptions over the past five years where nominal voltage was 90% or less.
Sags and Interruptions
Recorded over
Past 5 Years

78© 2018 Electric Power Research Institute, Inc. All rights reserved.
Step 2: Evaluation of the Equipment’s Electrical
Environment

79© 2018 Electric Power Research Institute, Inc. All rights reserved.
Step 3: Determination of Tolerance Objective
▪Before any analysis or recommendation can be made, the manufacturer must determine the tolerance objective. – The tolerance objective is the
goal of the project.– Determines the level of
analysis and cost of the recommended solutions.
▪Given the potential high cost of process interruptions due to voltage sags at this facility, the manufacturer decided to pursue the goal of protecting one of its sensitive processes (comprising a total of 10 process machines) against all voltage sags and interruptions out to 10–seconds.

80© 2018 Electric Power Research Institute, Inc. All rights reserved.
Step 4: On-Site Visit (Data Collection)
▪ The primary focus:– to understand the power
distribution configuration, load characteristics, process, process machine power, and control configuration, and operations of all process machines included in the project.
▪ EPRI’s on-site investigation revealed – critical assembly machines
included in the project were powered by one 480-V, three-phase power distribution panel.
▪ The industrial welding support lasers that support the assembly machines were also powered from a single 480-V three-phase distribution panel

81© 2018 Electric Power Research Institute, Inc. All rights reserved.
Step 5: Detailed Report (Findings )
▪ The analysis focused on estimating the actual voltage sag sensitivity of the assembly machines and identifying a solution to meet the objective. In an effort to estimate the actual voltage sag tolerance.
▪ A single-line diagram was generated from the assembly machine’s electrical schematics.
▪ A representative assembly machine single-line diagram, including a tolerance curve for the machine’s most sensitive components.

82© 2018 Electric Power Research Institute, Inc. All rights reserved.
Step 5: Detailed Report (Findings)
▪Since the goal was to
eliminate delays and
failures which could
occur if the machines
are halted mid-cycle,
investigation into the
machine operations
revealed that a cycle-
stop (controlled stop)
could be performed
within 2.3 seconds.
▪Compressed Air has
45 seconds of
Capacity.
A Controlled Cycle Stop
can be Carried out
within 2.3 Seconds
Compressed Air has at
least 45 Second
Capacity

83© 2018 Electric Power Research Institute, Inc. All rights reserved.
Step 5: Detailed Report (Recommendations)
▪The minimum time required to provide conditioned power to all assembly machines to perform a cycle stop on the entire line is approximately 4 seconds. The solution recommended was a $100,000, 300-kVA flywheel to provide up to 13 seconds of conditioned power at full load.
▪The recommendation was to install the three-phase, 300-kVA flywheel between the 480-V unconditioned source and the 480-V power distribution panels for the assembly line and lasers,

84© 2018 Electric Power Research Institute, Inc. All rights reserved.
Step 6: Implementation
▪ Install the Power
Conditioner and
Cycle Stop Control
Signal
▪A 300kVA
Flywheel was
Installed on
Assembly Line 7.

85© 2018 Electric Power Research Institute, Inc. All rights reserved.
Step 6: Implementation
▪ The Power Conditioner
Chosen:
– 300kVA (240kW)
UPS
▪ 3.1 MJoules,
▪ 15 Times the
Required Energy

86© 2018 Electric Power Research Institute, Inc. All rights reserved.
Step 6: Implementation
▪Power Conditioner
must be Capable of
Providing a Signal to
the Process to
Perform a Cycle
Stop if the
Interruption Lasts
Longer than the
Limits of the
Conditioner.
▪The Flywheel’s DC
bus Energy Level
Signal was Used as
a Cycle Stop Trigger

87© 2018 Electric Power Research Institute, Inc. All rights reserved.
Summary
▪Since the installation of the Flywheel on Line 7 in June 2006, the line has not experienced an uncontrolled stop.
▪The Manufacturer Justified the Installation of New Flywheels on Three Additional Assembly Lines
▪The Cost Justification for the new Flywheels was Based on 18 Voltage Sags or Interruptions Related Shutdowns Occurring per year valued at $30,000 per event
▪Yearly losses due to Voltage Sags and Interruptions are Estimated at $540,000.
▪The Bottom Line! When looking at recommendations and solutions, think “Out of the Box”, be “Creative”, and “Analyze” the entire System and not “Just the Power”.

88© 2018 Electric Power Research Institute, Inc. All rights reserved.
Conclusions
▪This case study demonstrates that while plants encounter several power quality disturbances, changes as simple as altering parameters on the control can significantly contribute to hardening the plant against PQ events.
▪The audit revealed that the plant used several controls that were powered directly from AC and therefore were susceptible to voltage sags.
▪ It was recommended that the plant install small power conditioners at select locations where control transformers were installed.
▪Testing was done to demonstrate that firmware updates and simple parameter reconfiguration of AC drives can allow them to ride through sags as low as 50%.
▪The cost benefit of these solutions when compared to more sophisticated solutions such as installing large power conditioners at the service transformer is significant—as much as 50% cheaper.

© 2018 Electric Power Research Institute, Inc. All rights reserved.
Display Manufacturer
Case Study
90© 2018 Electric Power Research Institute, Inc. All rights reserved.
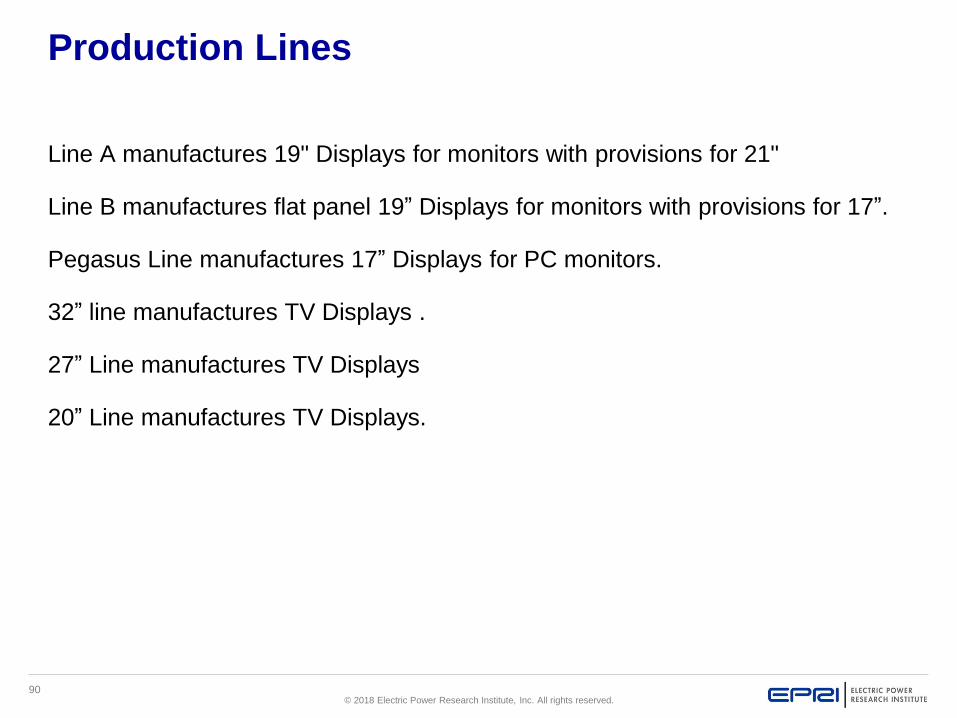
Production Lines
Line A manufactures 19" Displays for monitors with provisions for 21"
Line B manufactures flat panel 19” Displays for monitors with provisions for 17”.
Pegasus Line manufactures 17” Displays for PC monitors.
32” line manufactures TV Displays .
27” Line manufactures TV Displays
20” Line manufactures TV Displays.
91© 2018 Electric Power Research Institute, Inc. All rights reserved.
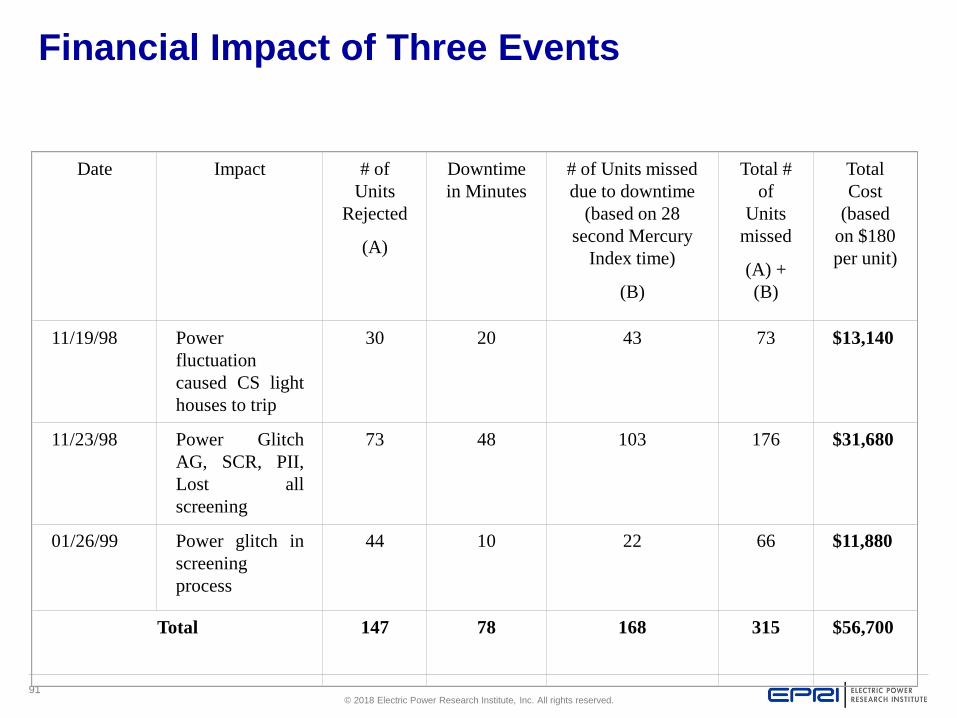
Financial Impact of Three Events
Date Impact # of
Units
Rejected
(A)
Downtime
in Minutes
# of Units missed
due to downtime
(based on 28
second Mercury
Index time)
(B)
Total #
of
Units
missed
(A) +
(B)
Total
Cost
(based
on $180
per unit)
11/19/98 Power
fluctuation
caused CS light
houses to trip
30 20 43 73 $13,140
11/23/98 Power Glitch
AG, SCR, PII,
Lost all
screening
73 48 103 176 $31,680
01/26/99 Power glitch in
screening
process
44 10 22 66 $11,880
Total 147 78 168 315 $56,700

92© 2018 Electric Power Research Institute, Inc. All rights reserved.
Voltage Sag Characteristics Inside the Plant
Cumulative Histogram for 208V
0
5
10
15
20
25
30
35
40
45
50
5
10
15
20
25
30
35
40
45
50
55
60
65
70
75
80
85
90
95
10
0
RMS Voltage Magnitude (in % of Nominal)
Nu
mb
er o
f E
ven
ts
1994 1995 1996 1997 1998 1999
2 1 1 1 15 4
11
29
43
8
21 1
110 Total Events

93© 2018 Electric Power Research Institute, Inc. All rights reserved.
Type of Events
Inside Sony Facility at 120V
01
0 0
2
0
3
8
3
15
32
910
6
11
12
0
4
8
3
9
10
0
5
10
15
20
1994 1995 1996 1997 1998 1999
Year
Nu
mb
er o
f E
ven
ts
Momentary 3-Phase 2-Phase 1-Phase

94© 2018 Electric Power Research Institute, Inc. All rights reserved.
Sensitive Equipment
85% Vnom

95© 2018 Electric Power Research Institute, Inc. All rights reserved.
How Sensitive?
0%
10%
20%
30%
40%
50%
60%
70%
80%
90%
24
V D
C P
S
24
V D
C P
S
24
V D
C P
S
PL
C @
208
V
PL
C @
120
V
PL
C @
208
V
PL
C @
120
V
PL
C @
120
&20
8V
Se
rvo
Dri
ve
AC
Conta
cto
r
% o
f N
om
ina
l Vo
lta
ge

96© 2018 Electric Power Research Institute, Inc. All rights reserved.
Embedded Solution
Change PLC Input from AC to DC
input.
Use a 3-Phase AC input to 24VDC
output Power supply.
If PLC AC power supply is
integrated to the Module use a
small power conditioning (e.g., Dip
Proofing Inverter or CVT).

97© 2018 Electric Power Research Institute, Inc. All rights reserved.
AC Versus DC Input for PLCs

98© 2018 Electric Power Research Institute, Inc. All rights reserved.
How Effective is a 3-Phase AC Input to 24V DC output
Phoenix Contact PS
PLC Power
Supply unit
24V DC
Source
Loading on
24V DC
Source
Voltage Sensitivity Threshold (in %) for 30 Cycle
Ride-Through
Three Phase
Sags
Two-Phase
Sags
Single-Phase
Sag
CV500-PS211 Phoenix
Contact
20%1 0% 0% 0%
CV500-PS211 Phoenix
Contact
35% 45% 0% 0%
CV500-PS211 Phoenix
Contact
60% 50% 0% 0%

99© 2018 Electric Power Research Institute, Inc. All rights reserved.
How Effective is this Solution?
6
12
6
18
15
0
1 1 1
3
0
2
4
6
8
10
12
14
16
18
20
1994 1995 1996 1997 1998
Num
be
r o
f P
roce
ss U
pse
tsImpact of Decreasing Voltage Sag Sensitivty of PLC
With No Improvement Redcuing Sensitivity of PLC to 50% of Nominal

100© 2018 Electric Power Research Institute, Inc. All rights reserved.
Lessons Learned
▪ In designing new process lines use DC input controllers
wherever possible.
▪Use a robust DC source for all your DC inputs (such as, 3-
Phase AC to 24V DC power supply)
▪Know the sag immunity of your DC power supplies in your
plant.

101© 2018 Electric Power Research Institute, Inc. All rights reserved.
Together…Shaping the Future of Electricity