5 th bi-annual border to border conference development of an origin-destination matrix for the paso...
TRANSCRIPT

5th Bi-Annual Border to Border Conference
Development of an Origin-Destination Matrix for the Paso Del Norte Region (Regional Master Network Phase IV)
McAllen, Texas November 19th , 2014

Background
The Center for International Intelligent Transportation Research (CIITR) is committed to enhancing the quality of life for the Paso Del Norte Region and to developing solutions that can be successfully applied in other U.S. border environments

Background
Project Phases:
1. Integration of the Transportation Network and Transportation Analysis Zones (TAZs) Ciudad Juarez and Las Cruces
2. Integration of El Paso’s Network and TAZs into the Regional Network
3. Exploring alternatives to build a regional Origin-Destination Matrix (ODM)
4. Developing the regional ODM (current)
Background
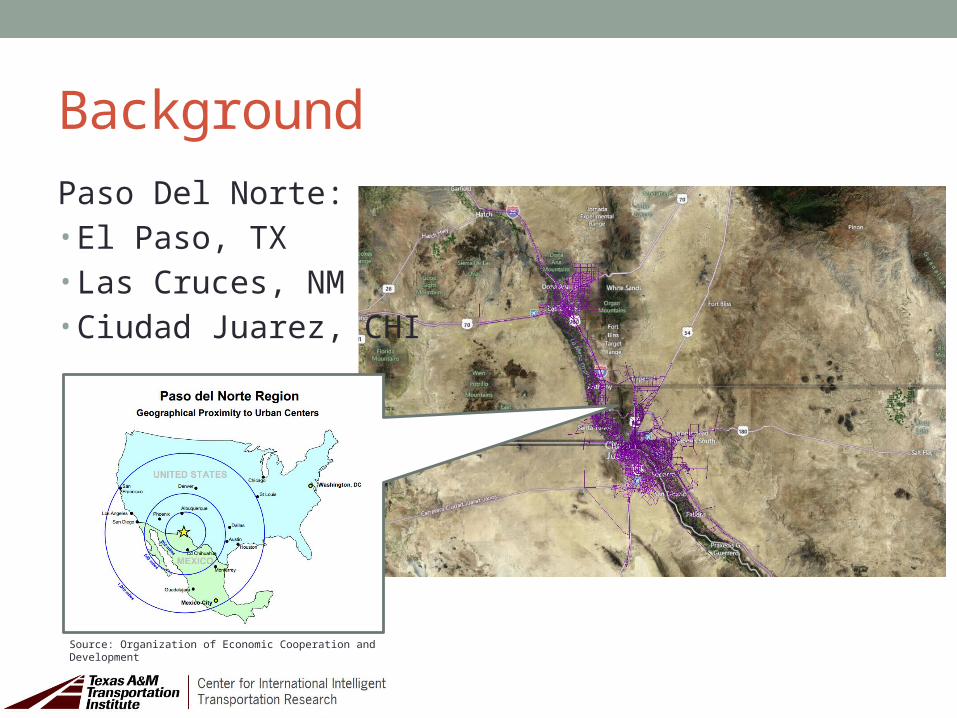
Paso Del Norte:• El Paso, TX• Las Cruces, NM• Ciudad Juarez, CHI
Source: Organization of Economic Cooperation and Development

Background

Regional MN Integration
El Paso, Texas Las Cruces, New Mexico
Ciudad Juarez, Chihuahua

Background (strategic grid for checking)

Background• Most common problems related to network-based
modeling at CIITR:• missing links• incorrect attributes• incorrect names• directionality and topology• lack of projection/coordinate system• no metadata
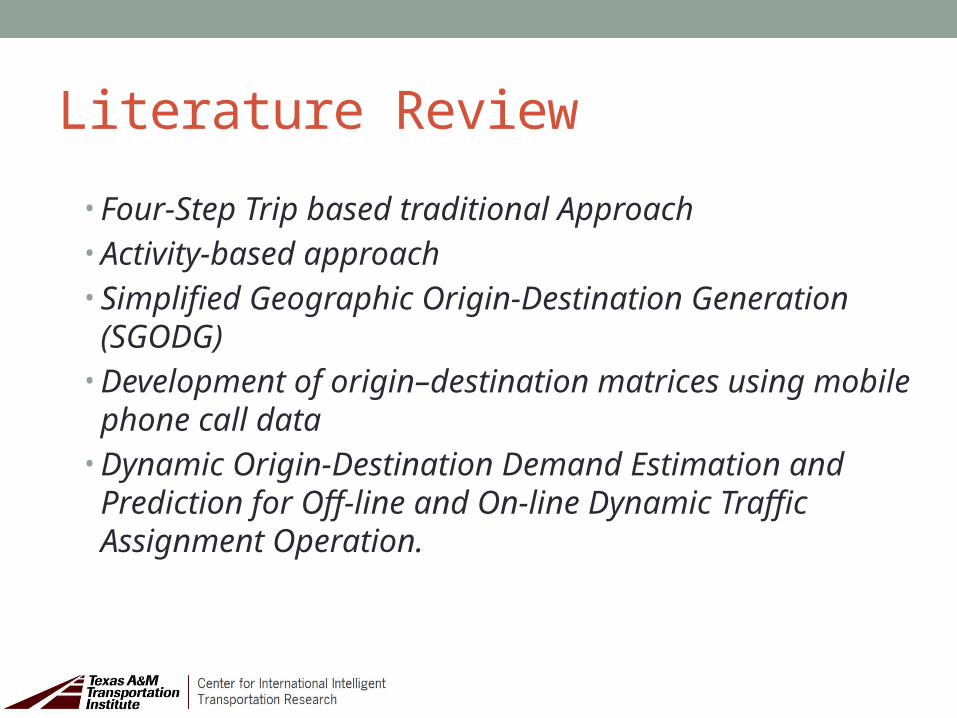
Literature Review
• Four-Step Trip based traditional Approach• Activity-based approach• Simplified Geographic Origin-Destination Generation
(SGODG)• Development of origin–destination matrices using mobile
phone call data• Dynamic Origin-Destination Demand Estimation and
Prediction for Off-line and On-line Dynamic Traffic Assignment Operation.

Summary of FindingsAlternative/Method
Approximated Cost (thousand
dollars)Advantages Disadvantages
Direct Measurements $420-$500Accurateness and reliability Cost and time consuming
Traffic Counts + Algorithms
$80-$90 Few steps for its implementation
Computer processing and algorithm development time
Simplified Geographic $40-$45Low-cost alternative Calibration and validation
Household Data (regressions)
$80-$110 Time and resources savings: quicker implementation than other methods
Household data acquisition (Ciudad Juarez)
TRANUS land use based $55-$65 Direct generation of a regional O-D
Calibration/Validation (International POE)
Cellphone Data $75-$82 Accurateness suitable for big areas
Relatively expensive, time consuming processing (Different cell providers policies)
Bluetooth Technology N/A Easy to implement, Excellent for External-to-External O-D
Not suitable for internal zones (O-D). Low capture range and high cost. No vehicle classification.

OD Demand Calibration FrameworkTraffic Network Traffic Flow Model Intersection
Controls
Estimated, Time-Dependent OD Matrices
Traffic Assignment/Simulation
Linear Optimization Model
Optimized Affected, Time-Dependent OD Pairs
Results
Assignment Results
Update Demand

Data Collection (El Paso)

Data Collection (Ciudad Juarez)

Data Collection (Las Cruces)

Data Collection (Pneumatic Road Tube Installation and Manual Counts)

Data Collection (24-hr Camera Equipment)

Next Steps (TAZ Restructure)
Utilizing GIS to Create the Lower Rio Grande Valley Travel Demand Model Geographies (Kevin Hall-Border to Border 2012)

Next Steps (TAZ Restructure)

Questions?Contact Information:
Luis David GaliciaAssistant Research Scientist
Texas Transportation Institute
The Texas A&M University System
4050 Rio Bravo Drive, Suite 151
El Paso, Texas 79902
(915) 532-3759