5 supply - weebly...134 chapter 5 a supply curve shows the data from a supply schedule in graph...
TRANSCRIPT

CHAPTER
How does the use of robots affect thesupply of goods and services? See theCase Study on pages 158–159.
129Supply
5
More at ClassZone.com
SupplyCONCEPT REVIEW
Demand is the willingness to buy a good or service and the abilityto pay for it.
CHAPTER 5 KEY CONCEPT
Supply is the willingness and ability of producers to offer goods andservices for sale.
WHY THE CONCEPT MATTERS
You may not think of yourself as a producer, but you are. You offeryour labor when you do chores around the house or work at a part-time job. If you have a car, you sometimes provide transportationfor your friends. Also, if you belong to a sports or academic team,you supply your skills and knowledge. List five things that yousupply. Then list the costs you incur and the rewards you receive forsupplying them. How would your willingness and ability to supplythese things be affected if these costs and rewards changed?
Go to ECONOMICS UPDATE forchapter updates and current newson the use of robots in industry.(See Case Study, pp. 158–159.)
Go to INTERACTIVE REVIEW forconcept review and activities.
SECTION 1What Is Supply?
SECTION 2What Are
the Costs ofProduction?
SECTION 3What Factors
Affect Supply?
SECTION 4What Is Elasticity
of Supply?
CASE STUDYRobots—
TechnologyIncreases Supply
Go to ANIMATED ECONOMICS forinteractive lessons on the graphs andtables in this chapter.

1SECT ION
130 Chapter 5
OBJECT IVES KEY TERMS TAKING NOTES
As you read Section 1, complete acluster diagram like the one shownusing the key concepts and otherhelpful words and phrases. Use theGraphic Organizer at InteractiveReview @ ClassZone.com
In Section 1, you will
• define supply and outline whatthe law of supply says
• explain how to create andinterpret supply schedules
• explain how to create andinterpret supply curves
supply, p. 130
law of supply, p. 131
supply schedule, p. 132
market supply schedule, p. 132
supply curve, p. 134
market supply curve, p. 134
The Law of Supply
KEY CONCEPTS
In Chapter 4, you learned about the demand side of market interactions and howconsumers serve their interests by purchasing the best products at the lowest possibleprice. You also discovered that there are other factors that change demand at everyprice. Demand, however, is only one side of the market equation. In this chapter, youwill learn about the supply side of the equation in order to understand why producerswant to provide products at the highest possible price.
Supply refers to the willingness and ability of producers to offer goods and ser-vices for sale. Anyone who provides goods or services is a producer. Manufacturerswho make anything from nutritionbars to automobiles are producers.So, too, are farmers who grow crops,retailers who sell products, and util-ity companies, airlines, or pet sitterswho provide services.
The two key words in the defi-nition of supply are willingness andability. For example, the Smith familygrows various fruits and vegetableson their small farm. They sell theirproduce at a local farmers’ market. Ifthe prices at the market are too low,the Smiths may not be willing totake on the expense of growing and
What Is Supply?
Supplying a Service Service providers, suchas utility companies, are producers too.
Supply is the desire andability to produce and sella product.
QUICK REFERENCE
law ofsupply
Supply
supplyschedule

As pricesfall…
quantitysupplied
falls.As pricesrise…
quantitysupplied
rises.
FIGURE 5.1 LAW OF SUPPLY
131Supply
transporting their produce. Also, if the weather is bad and the Smiths’ crops of fruitsand vegetables are ruined, they will not be able to supply anything for the market. Inother words, they will not offer produce for sale if they do not have both the willing-ness and the ability to do so.
As is true with demand, price is a major factor that influences supply. The law of
supply states that producers are willing to sell more of a good or service at a higherprice than they are at a lower price. Producers want to earn a profit, so when theprice of a good or service rises they are willing to supply more of it. When the pricefalls, they want to supply less of it. In other words, price and quantity supplied havea direct relationship. This relationship is illustrated in Figure 5.1.
EXAMPLE Price and Supply
Let’s take a closer look at how price and quantity supplied are related by returning tothe Smiths and their produce business. The Smiths travel to the Montclair Farmers’Market every Wednesday and Saturday to sell a variety of fruits and vegetables—blueberries, peaches, nectarines, sweet corn, peppers, and cucumbers. However,their specialty crop is the tomato. How should the Smiths decide on the quantity oftomatoes to supply to the farmers’ market? The price they can get for their crop is amajor consideration.
The Smiths know that the standard price for tomatoes is $1 per pound. Whatquantity of tomatoes will the Smiths offer for sale at that price? They decide thatthey are willing to offer 24 pounds. What if the price of tomatoes doubled to $2 perpound? The Smiths might decide that the price is so attractive that they are willingto offer 50 pounds of tomatoes for sale on the market. In contrast, if the price fell to50 cents, the Smiths might decide to supply only 10 pounds. Furthermore, at pricesunder 50 cents per pound, they may not be willing to supply any tomatoes. Lookagain at the definition of the law of supply. As you can see, it provides a concisedescription of how producers behave.
APPLICATION Analyzing Effects
A. You sell peppers at the Montclair Farmers’ Market. If the price of peppers increasedfrom 40 cents to 60 cents each, how would your quantity supplied of pepperschange? How would your quantity supplied change if the price decreased to 25 cents?
The law of supplystates that when pricesdecrease, quantity sup-plied decreases, and whenprices increase, quantitysupplied increases.
QUICK REFERENCE
Find an update onfarmers’ markets atClassZone.com

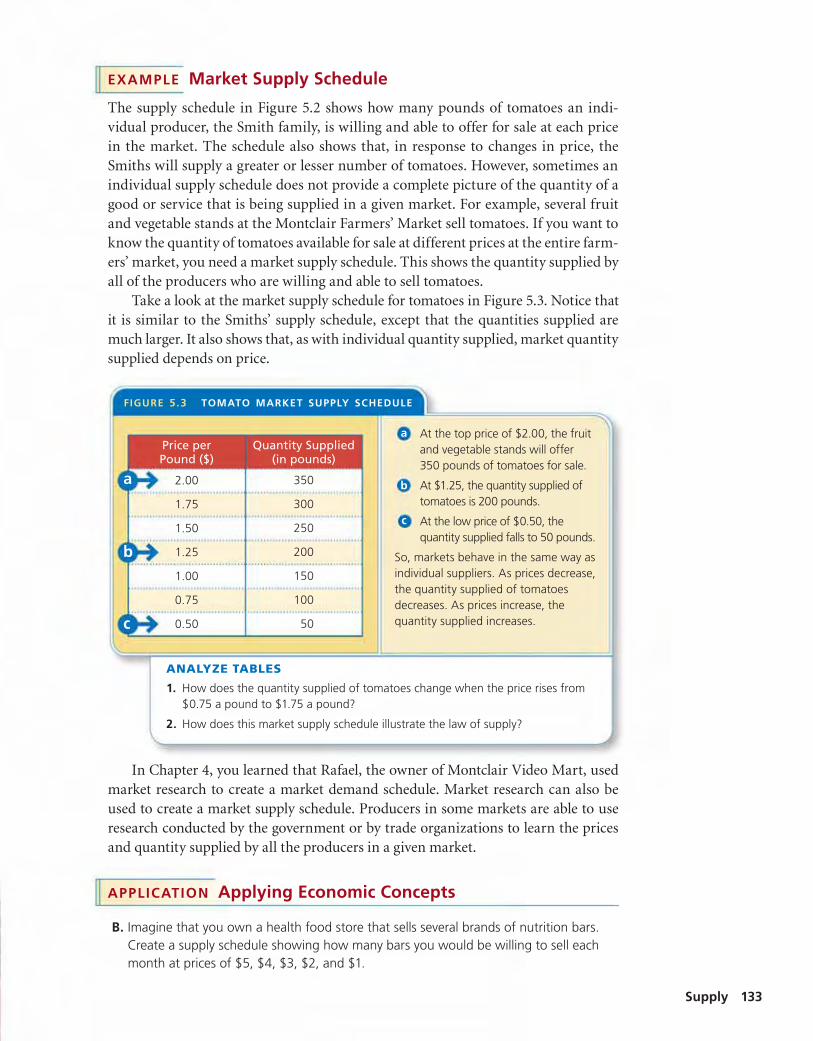
FIGURE 5.2 THE SMITHS’ TOMATO SUPPLY SCHEDULE
Price perPound ($)
Quantity Supplied(in pounds)
2.00 50
1.75 40
1.50 34
1.25 30
1.00 24
0.75 20
0.50 10b
a
Chapter 5132
Supply Schedules
KEY CONCEPTS
A supply schedule is a table that shows how much of a good or service an individualproducer is willing and able to offer for sale at each price in a market. In other words,a supply schedule shows the law of supply in table form. A market supply schedule isa table that shows how much of a good or service all producers in a market are willingand able to offer for sale at each price.
EXAMPLE Individual Supply Schedule
A supply schedule is a two-column table that is similar in format to a demand schedule.The left-hand column of the table lists various prices of a good or service, and theright-hand column shows the quantity supplied at each price.
The Smiths’ supply of tomatoes can be expressed in a supply schedule (Figure5.2). How many pounds of tomatoes are the Smiths willing to sell when the priceis $1.25 per pound? What if the price is $0.50 per pound? Or $2.00 per pound?Your answers to these questions show that the Smiths’ quantity supplied of tomatoesdepends on the price.
A supply schedule listshow much of a good or ser-vice an individual produceris willing and able to offerfor sale at each price.
A market supplyschedule lists how muchof a good or service allproducers in a market arewilling and able to offer forsale at each price.
QUICK REFERENCE
a At the top price of $2.00, theSmiths are willing to sell 50pounds of tomatoes.
b At $0.50, the Smiths are willingto provide only 10 pounds oftomatoes for sale.
Notice that when the price falls, thequantity of tomatoes that the Smithsare willing to sell also falls. When theprice rises, the quantity they are willingto sell rises. So quantity supplied andprice have a direct relationship.
ANALYZE TABLES
1. How many pounds of tomatoes will theSmiths offer for sale if the price is $1.75?
2. How is this supply schedule different from ademand schedule for tomatoes?
Use an interactive supply scheduleat ClassZone.com
Price perPound ($)
Quantity Supplied(in pounds)
2.00 350
1.75 300
1.50 250
1.25 200
1.00 150
0.75 100
0.50 50
b
a
c
133Supply
EXAMPLE Market Supply Schedule
The supply schedule in Figure 5.2 shows how many pounds of tomatoes an indi-vidual producer, the Smith family, is willing and able to offer for sale at each pricein the market. The schedule also shows that, in response to changes in price, theSmiths will supply a greater or lesser number of tomatoes. However, sometimes anindividual supply schedule does not provide a complete picture of the quantity of agood or service that is being supplied in a given market. For example, several fruitand vegetable stands at the Montclair Farmers’ Market sell tomatoes. If you want toknow the quantity of tomatoes available for sale at different prices at the entire farm-ers’ market, you need a market supply schedule. This shows the quantity supplied byall of the producers who are willing and able to sell tomatoes.
Take a look at the market supply schedule for tomatoes in Figure 5.3. Notice thatit is similar to the Smiths’ supply schedule, except that the quantities supplied aremuch larger. It also shows that, as with individual quantity supplied, market quantitysupplied depends on price.
In Chapter 4, you learned that Rafael, the owner of Montclair Video Mart, usedmarket research to create a market demand schedule. Market research can also beused to create a market supply schedule. Producers in some markets are able to useresearch conducted by the government or by trade organizations to learn the pricesand quantity supplied by all the producers in a given market.
APPLICATION Applying Economic Concepts
B. Imagine that you own a health food store that sells several brands of nutrition bars.Create a supply schedule showing how many bars you would be willing to sell eachmonth at prices of $5, $4, $3, $2, and $1.
a At the top price of $2.00, the fruitand vegetable stands will offer350 pounds of tomatoes for sale.
b At $1.25, the quantity supplied oftomatoes is 200 pounds.
c At the low price of $0.50, thequantity supplied falls to 50 pounds.
So, markets behave in the same way asindividual suppliers. As prices decrease,the quantity supplied of tomatoesdecreases. As prices increase, thequantity supplied increases.
ANALYZE TABLES
1. How does the quantity supplied of tomatoes change when the price rises from$0.75 a pound to $1.75 a pound?
2. How does this market supply schedule illustrate the law of supply?

134 Chapter 5
A supply curve showsthe data from a supplyschedule in graph form.
A market supply curveshows the data from amarket supply schedule ingraph form.
QUICK REFERENCE
Supply Curves
KEY CONCEPTS
A supply curve is a graph that shows how much of a good or service an individualproducer is willing and able to offer for sale at each price. To create a supply curve,transfer the data from a supply schedule to a graph. A market supply curve showsthe data from the market supply schedule. In other words, it shows how much of agood or service all of the producers in a market are willing and able to offer for saleat each price.
EXAMPLE Individual Supply Curve
Study the supply curve (Figure 5.4) created from the Smiths’ supply schedule. How manypounds of tomatoes will the Smiths supply at $1.50 per pound? How will the Smiths’quantity supplied change if the price increases or decreases by 25 cents? Find the answersto these questions by running your finger along the curve. As you can see, the supplycurve is a graphic representation of the law of supply. When the price increases, thequantity supplied increases; when the price decreases, the quantity supplied decreases.Note that the supply curve in Figure 5.4, and the schedule on which it is based, werecreated using the assumption that all other economic factors except price remain thesame. You’ll learn more about these other factors in Section 3.
0
.50
.25
.75
1.00
1.25
1.50
1.75
2.00
10 20 30 40 50Quantity supplied of tomatoes (in pounds)
Pric
e p
er p
ou
nd
(in
do
llars
)
FIGURE 5.4 THE SMITHS’ TOMATO SUPPLY CURVE
Use an interactive supplycurve at ClassZone.com
Price perpound ($)
QuantitySupplied
2.00 50
1.75 40
1.50 34
1.25 30
1.00 24
0.75 20
0.50 10
ANALYZE GRAPHS
1. How many pounds of tomatoes will theSmiths offer for sale when the price is $1.50?
2. How does this supply curve illustrate the lawof supply?
Notice that supply curvesalways slope upward fromlower left to upper right.
a The vertical axis of thegraph shows prices, withthe highest at the top.
b The horizontal axis showsquantities supplied, withthe lowest on the far left.
c The specific quantitiessupplied at specific priceslisted on the supply sched-ule are plotted as points onthe graph and connectedto create the supply curve.
.
a
c
b

Quantity supplied of tomatoes (in pounds)
Pric
e p
er p
ou
nd
(in
do
llars
)
500
.50
.25
.75
1.00
1.25
1.50
1.75
2.00
100 150 200 250 300 350
FIGURE 5.5 TOMATO MARKET SUPPLY CURVE
Supply 135
Price perPound ($)
QuantitySupplied
2.00 350
1.75 300
1.50 250
1.25 200
1.00 150
0.75 100
0.50 50
EXAMPLE Market Supply Curve
Like the Smiths’ individual supply curve, the market supply curve for all the standsthat sell tomatoes at the Montclair Farmers’ Market shows the quantity supplied atdifferent prices. In other words, the graph shows the quantity of tomatoes that allof the producers, or the market as a whole, are willing and able to offer for sale ateach price. The market supply curve (Figure 5.5) differs in scope from the Smiths’individual supply curve, but it is constructed in the same way. As in Figure 5.4, thevertical axis displays prices and the horizontal axis displays quantities supplied.
Look at Figure 5.5 one more time. What is the quantity supplied at $1.50? How willquantity supplied change if the price increases by 25 cents or decreases by 25 cents?Once again, find the answers to these questions by running your finger along the curve.As you can see, the market supply curve, just like the individual supply curve, vividlyillustrates the direct relationship between price and quantity supplied. If the price oftomatoes increases among all of the suppliers at the farmers’ market, then the quantitysupplied of tomatoes also increases. And, conversely, if the price decreases, then thequantity supplied decreases as well. As with the individual supply curve, the marketsupply curve is constructed on the assumption that all other economic factors remainconstant—only the price per pound of tomatoes changes.
ANALYZE GRAPHS
1. At which price will all the fruit and vegetable stands want to sell 200 poundsof tomatoes?
2. How is the slope of this supply curve different from the slope of a marketdemand curve?
Notice that market supplycurves slope upward fromlower left to upper right, justas individual supply curves do.
The main differencebetween the two types ofcurves is that the quantitiessupplied at each price aremuch larger on a marketsupply curve. This is becausethe curve represents a groupof producers (a market), notjust one producer.

FIGURE 5.6 INTERNATIONAL PLAYERS IN THE NBA
Source: nbahoopsonline.com NBA season
Nu
mb
er o
ffo
reig
n p
laye
rs
38 41 46
6365
81 82
1999–2000 2000–2001 2001–2002 2002–2003 2003–2004 2004–2005 2005–2006
136 Chapter 5
A GLOBAL PERSPECTIVE
Supply curves for all producers follow the law of supply. Whether the producersare manufacturers, farmers, retailers, or service providers, they are willing to supply moregoods and services at higher prices, even though it costs more to produce more. Afarmer, for example, spends more on seeds and fertilizer to grow more soybeans.Why are farmers and other producers willing to spend more when prices are higher?The answer is that higher prices signal the potential for higher profits, and the desireto increase profits drives decision making in the market. You will learn more aboutthe costs of production and about maximizing profits in Section 2.
APPLICATION Applying Economic Concepts
C. Look back at the supply schedule for nutrition bars you created for Application B onpage 133. Use it to create a supply curve.
CONNECTING ACROSS THE GLOBE
1. Synthesizing Economic Information How do price and quantitysupplied relate to salaries and labor in the NBA?
2. Drawing Conclusions What effect might a large drop in NBAsalaries have on international sales of NBA merchandise?
The NBA Goes InternationalUntil recently, nearly all of the National Basketball Association’s (NBA) playerswere U.S-born. Before 1984, there were only 12 foreign-born players in theleague, but that has changed. Opening day rosters in the 2005–06 seasonlisted 82 international players, and they hailed from all over the world—fromSpain and Slovenia in Europe to Senegal and the Sudan in Africa. Why hasthe supply of international players risen so dramatically? The average annualsalary of an NBA player, which has risen from about $2 million in 1997 to over$4 million in 2006, is a likely explanation.
The international players are not the only group reaping monetary rewards.With people in China watching Yao Ming (at right), and French fans followingTony Parker, the NBA’s overseas merchandise sales have increased rapidly.In 2004, the NBA sold an estimated $600 million in merchandise outside ofthe United States—about 20 percent of its overall merchandise sales.
Create a supply curveat ClassZone.com

ClassZone.com
137Supply
ECONOMICS IN PR ACTICE
Use @ ClassZone.comto complete this activity.
Making a Market Supply CurveSuppose that you are the head of thesporting goods dealers’ associationin your city. You survey all the storesthat sell skis and determine howmany pairs of skis they are willing tosell at various prices. Your researchenables you to make the followingmarket supply schedule.
Create a Supply Curve Use thismarket supply schedule to draw amarket supply curve. Be sure to labeleach axis of your graph.
Challenge Write a caption foryour supply curve explaining what itshows.
SECTION 1 Assessment
2. Why does a supply curve slope upward?
3. What do the points on a market supply curve represent?
4. If the price of a video game increased, what would the law of supplypredict about the quantity supplied of the game?
5. How is the law of supply similar to the law of demand? How is itdifferent?
6. Using Your Notes How isa supply schedule differentfrom a market supplyschedule? Refer to yourcompleted cluster diagram.Use the Graphic Organizerat Interactive Review @ ClassZone.com
C RIT IC AL THINKING
7. Explaining an Economic Concept Focus on one item you buyregularly for which the price has changed. How did this shift inprice influence supply?
8. Making Inferences The market supply schedule on page133 shows that the quantity supplied of tomatoes priced at 50cents per pound was 50 pounds. However, market researchof customers at the farmers’ market showed that the marketdemand at that price was 250 pounds of tomatoes. How do youexplain the difference?
9. Applying Economic Concepts Return to the supply schedulefor nutrition bars you created for Application B on page 133.Assume that the class represents all the sellers of nutrition bars inthe market. Tabulate these individual supply schedules to create amarket supply schedule. Then use that schedule to draw a marketsupply curve.
10. Challenge Why might producers not always be able to sell theirproducts at the higher prices they prefer? Think about the lawsof demand and supply and the different attitudes that consumersand producers have toward price. How might the market resolvethis difference? (You will learn more about this in Chapter 6.)
a. supplylaw of supply
c. market supply schedulemarket supply curve
b. supply schedulesupply curve
Price per Pair ($) QuantitySupplied
500 600
425 450
350 325
275 225
200 150
125 100
1. Explain the differences between the terms in each of these pairs:
REVIEWING KEY CONC EP TS
law ofsupply
Supply
supplyschedule

2SECT ION
138 Chapter 5
OBJECT IVES KEY TERMS TAKING NOTES
As you read Section 2, completea hierarchy diagram like thisone to track main ideas andsupporting details. Use theGraphic Organizer at InteractiveReview @ ClassZone.com
In Section 2, you will
• analyze how businessescalculate the right number ofworkers to hire
• determine how businessescalculate production costs
• explain how businessesuse those calculations todetermine the most profitableoutput
marginal product, p. 138specialization, p. 138increasing returns, p. 139diminishing returns, p. 139fixed cost, p. 140variable cost, p. 140total cost, p. 140marginal cost, p. 140marginal revenue, p. 142total revenue, p. 142profit-maximizing output, p. 143
Labor Affects Production
KEY CONCEPTS
Let’s look at an individual producer andthe costs involved in supplying goods to themarket. Janine owns a small factory thatproduces custom blue jeans. The factory hasthree sewing machines, and when there arethree workers, one day’s product is 12 pairsof jeans. She wonders how hiring one moreworker will affect production. The changein total product that results from hiring onemore worker is called the marginal product.With four workers, the factory produces 19pairs of jeans a day, so the new employee’smarginal product is 7 pairs of jeans. With afifth worker, output jumps from 19 to 29—a marginal product of 10. Why did marginal product increase?
Each of Janine’s original three workers had a sewing machine to operate, butthey also had to cut cloth, package the finished jeans, and keep the shop clean. So,Janine’s employees only spent half of their time sewing. The fourth employee helpedwith the other tasks, so marginal product increased. But the sewing machines wereoften still idle. The fifth worker allowed labor to be divided even more efficiently,which caused marginal product to increase markedly. Having each worker focus ona particular facet of production is called specialization. But does hiring more work-ers always cause marginal product to increase?
What Are the Costs ofProduction?
Marginal productis the change in totaloutput brought about byadding one more worker.
Specialization ishaving a worker focuson a particular aspect ofproduction.
QUICK REFERENCE
ProductionCosts
main idea main idea main idea
details details details

FIGURE 5.7 JANINE’S MARGINAL PRODUCT SCHEDULE
Number ofWorkers
TotalProduct
MarginalProduct
0 0 0
1 3 3
2 7 4
3 12 5
4 19 7
5 29 10
6 42 13
7 53 11
8 61 8
9 66 5
10 67 1
11 65 �2
a
b
c
139Supply
EXAMPLE Marginal Product Schedule
A marginal product schedule shows the relationship between labor and marginalproduct. As you can see from Janine’s marginal product schedule (Figure 5.7), oneor two workers produced very little. But marginal product was still slightly largerwith each added worker. Then with between three and six workers, the benefits ofspecialization become increasingly apparent. With up to six employees, Janine’soperation experiences increasing returns, meaning each new worker adds more tototal output than the last, as shown by the marginal product.
Figure 5.7 shows that increasing returns stop with the seventh worker. This isalso related to specialization. Workers seven, eight, nine, and ten can still add toproductivity, but their work overlaps with that of the first six workers. With betweenseven and ten employees, Janine’s operation experiences diminishing returns, as eachnew worker causes total output to grow but at a decreasing rate. With eleven work-ers, total output actually decreases, and Janine experiences negative returns. Thismay happen as employees become crowded and operations become disorganized. Itis rare, however, for a business to hire so many workers that it has negative returns.
APPLICATION Drawing Conclusions
A. Why do Janine’s increasing returns peak with six employees?
a Four workers can produce 19pairs of jeans. Specializationcauses a healthy increase inmarginal product.
b With seven workers, total productstill increases, but marginalproduct begins to decrease.
c With eleven workers, totalproduct decreases, and themarginal product is a negativenumber.
ANALYZE TABLES1. At what number of workers is total product highest?
2. On the basis of this table, does it make sense for Janineto hire more than six workers? Explain your answer.
Diminishing returnsoccur when hiring newworkers causes marginalproduct to decrease.
QUICK REFERENCE
Increasing returnsoccur when hiring newworkers causes marginalproduct to increase.
QUICK REFERENCE

140 Chapter 5
Production Costs
KEY CONCEPTS
The goal of every business is to earn as much profit as possible. Profit is the moneythat businesses get from selling their products, once the money it costs to makethose products has been subtracted. Businesses have different kinds of costs. Fixed
costs are expenses that the owners of a business must incur whether they producenothing, a little, or a lot. Variable costs are business costs that vary as the level ofproduction output changes. Businesses find the total cost of production by addingfixed and variable costs together. Finally, businesses are interested in knowing theirmarginal cost, or the additional cost of producing one more unit of their product.
EXAMPLE Fixed and Variable Costs
Janine’s fixed costs include the mortgage on her factory, her insurance, and the utili-ties that are on even when the factory is closed at night and on weekends. These costsare the same whether she is producing no jeans, 3 pairs, or 42 pairs of jeans per day.She must also pay the salaries of managers who keep the company running but arenot involved directly in production.
Wages are one of Janine’s chief variable costs. As she hires additional workers toincrease the level of production, her costs for wages increase. She also incurs addi-tional costs for more fabric, thread, zippers, and buttons as well as increased electricitycosts to run the machines and light the factory. Shipping her jeans to customers isanother variable cost. The more pairs of jeans that Janine’s factory produces, themore her variable costs increase. Conversely, if she decides to cut back the hours orthe number of workers, or if she closes the factory for a week’s vacation, her variablecosts decrease.
To determine the total cost to produce a certain number of pairs of jeans, Janinecan add her fixed and variable costs. And by figuring out her marginal cost, she candetermine what it costs to produce each additional pair of jeans.
Fixed costs are thosethat business owners incurno matter how much theyproduce.
Variable costs dependon the level of productionoutput.
Total cost is the sum offixed and variable costs.
Marginal cost is theextra cost of producing onemore unit.
QUICK REFERENCE
Variable CostsFixed Costs
Management
▼
▼Workers
Cloth
▼
▼
Mortgageon factory
Machinery
▼
▼Thread

FIGURE 5.8 JANINE’S PRODUCTION COSTS SCHEDULE
Number ofWorkers
TotalProduct
FixedCosts ($)
VariableCost ($)
TotalCost ($)
MarginalCost ($)
0 0 40 0 40 —
1 3 40 30 70 10
2 7 40 62 102 8
3 12 40 97 137 7
4 19 40 132 172 5
5 29 40 172 212 4
6 42 40 211 251 3
7 53 40 277 317 6
8 61 40 373 413 12
9 66 40 473 513 20
10 67 40 503 543 30
11 65 40 539 579 —
b
a a
141Supply
EXAMPLE Production Costs Schedule
By looking at Figure 5.8, we can see Janine’s costs and how they change as her quan-tity of jeans produced changes. Remember that her total product increased throughthe addition of the tenth worker and declined after the eleventh worker was added.The change in the number of workers is a major factor in the increase in variablecosts at each quantity. You’ll notice that the fixed costs remain the same no matterwhat the total product amounts to.
Marginal cost is determined by dividing change in total cost by change in totalproduct. Notice in Figure 5.8 that marginal cost declines at first and then increases.The initial decline occurs because of increasing worker efficiency due to specializa-tion. After that the marginal cost increases because of diminishing returns.
Janine now knows when her returns are increasing or diminishing and what itcosts her to produce each additional pair of jeans. Her next step is to figure out herrevenue, the money she makes from selling jeans, at each level of production.
APPLICATION Analyzing and Interpreting Data
B. Why does it cost Janine more to produce 65 pairs of jeans with 11 workers than toproduce 66 pairs of jeans with 9 workers?
a Fixedcosts remainconstant, whilevariable costschange at eachquantity.
b Calculatetotal costs byadding togetherfixed costs andvariable costs.
ANALYZE TABLES1. How do the variable costs change when the total product increases from
7 pairs to 12 pairs?
2. When Janine has no workers, why are her fixed and total costs the same?
CONNECT TO MATH
To determine marginalcost, divide the change intotal cost by the change intotal product.
1. In Figure 5.8, totalcost with four workersis $172; with threeworkers it is $137.172�137�35
2. Total product with fourworkers is 19; withthree workers it is 12.19�12�7
3. Marginal cost in thiscase is figured bydividing 35 by 7.35�7�5
142 Chapter 5
Earning the Highest Profit
KEY CONCEPTS
Before a business can decide how much to produce in order to earn as much profitas possible, it must figure its marginal revenue and total revenue. Marginal revenue
is the added revenue per unit of output, or the money made from each additionalunit sold. In other words, marginal revenue is the price. If, for example, baseball hatswere priced at $5 each, the money earned from each additional hat sold would be$5. Total revenue is the income a business receives from selling a product. It can beexpressed by the formula Total Revenue = P � Q, where P is the price of the productand Q is the quantity purchased at that price. (Recall that you used this same for-mula to calculate total revenue on page 101.)
EXAMPLE Production Costs and Revenues Schedule
You have seen how Janine explored the relationship between labor and marginalproduct. You have also seen what it cost her to produce various quantities of jeans.Next, you will learn how she calculates her revenue and her profits.
Look at Figure 5.9, which shows Janine’s costs, revenues, and profit for variouslevels of total product. Janine calculates her total revenue by multiplying the mar-ginal revenue—$20 per pair of jeans—by the total product. Then she can deter-mine her profit by subtracting her total costs from her total revenue. Rememberthat Janine is trying to decide how many workers she should hire and how manypairs of jeans she should produce in order to make the most profit. To make thesedecisions, she needs to perform a marginal analysis, which is a comparison of theadded costs and benefits of an economic action. In other words, she needs to lookat the costs and benefits of adding each additional worker and producing additionalpairs of jeans.
Using Figure 5.9, Janine can see that when she has noemployees, and therefore does not produce any jeans, sheloses money because she still incurs fixed costs. If shehires one worker who produces three pairs of jeans, hercosts are $70, but she only collects $60 in total rev-enue. Therefore, she still doesn’t earn a profit. Whenshe hires a second worker and together the two work-ers produce seven pairs of jeans, costs are $102 andrevenues are $140, so she earns a very small profit of$38. Janine has finally passed the break-even point,the point at which enough revenue is being gener-ated to cover expenses. At the break-even point,total costs and total revenue are exactly equal.
Like all business owners, Janine wants to doa lot better than break even. She wants to earnas much profit as possible. She can see thatas she adds additional workers and producesmore jeans, her profits increase.
Marginal revenue isthe money made from thesale of each additional unitof output.
Total revenue is acompany’s income fromselling its products.
QUICK REFERENCE
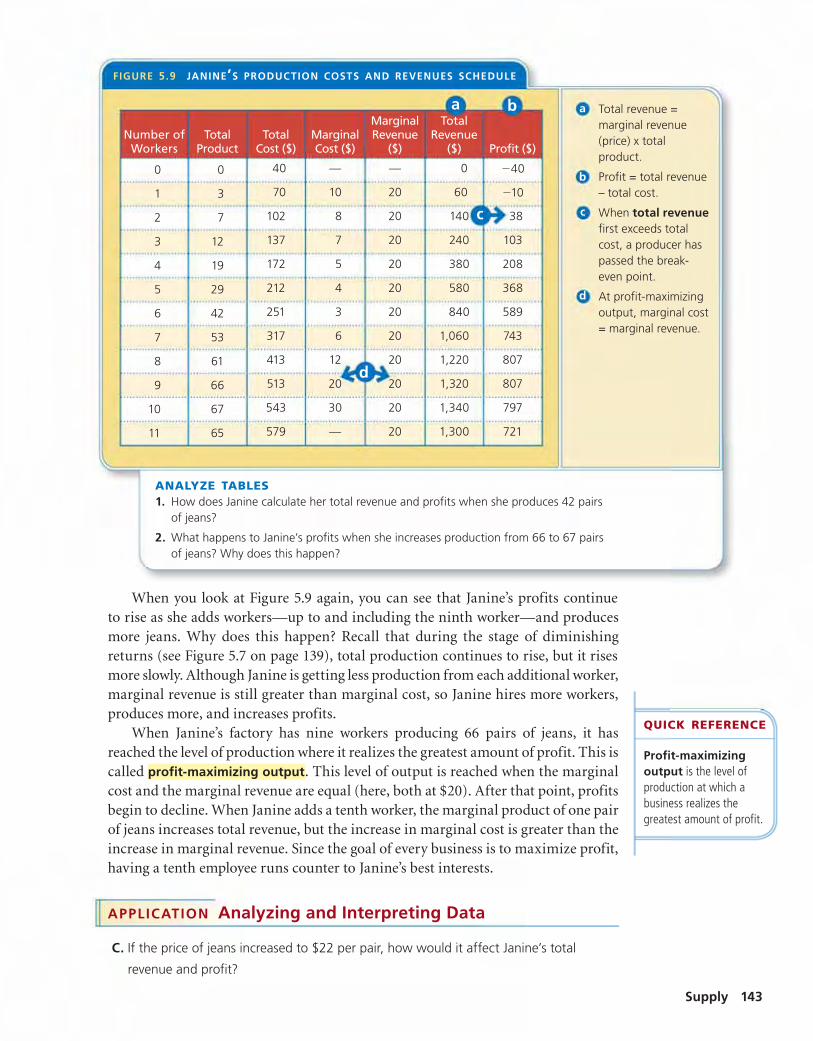
FIGURE 5.9 JANINE’S PRODUCTION COSTS AND REVENUES SCHEDULE
Number ofWorkers
TotalProduct
TotalCost ($)
MarginalCost ($)
MarginalRevenue
($)
TotalRevenue
($) Profit ($)
0 0 40 — — 0 �40
1 3 70 10 20 60 �10
2 7 102 8 20 140 38
3 12 137 7 20 240 103
4 19 172 5 20 380 208
5 29 212 4 20 580 368
6 42 251 3 20 840 589
7 53 317 6 20 1,060 743
8 61 413 12 20 1,220 807
9 66 513 20 20 1,320 807
10 67 543 30 20 1,340 797
11 65 579 — 20 1,300 721
c
ba
d
143Supply
When you look at Figure 5.9 again, you can see that Janine’s profits continueto rise as she adds workers—up to and including the ninth worker—and producesmore jeans. Why does this happen? Recall that during the stage of diminishingreturns (see Figure 5.7 on page 139), total production continues to rise, but it risesmore slowly. Although Janine is getting less production from each additional worker,marginal revenue is still greater than marginal cost, so Janine hires more workers,produces more, and increases profits.
When Janine’s factory has nine workers producing 66 pairs of jeans, it hasreached the level of production where it realizes the greatest amount of profit. This iscalled profit-maximizing output. This level of output is reached when the marginalcost and the marginal revenue are equal (here, both at $20). After that point, profitsbegin to decline. When Janine adds a tenth worker, the marginal product of one pairof jeans increases total revenue, but the increase in marginal cost is greater than theincrease in marginal revenue. Since the goal of every business is to maximize profit,having a tenth employee runs counter to Janine’s best interests.
APPLICATION Analyzing and Interpreting Data
C. If the price of jeans increased to $22 per pair, how would it affect Janine’s total
revenue and profit?
a Total revenue =marginal revenue(price) x totalproduct.
b Profit = total revenue– total cost.
c When total revenuefirst exceeds totalcost, a producer haspassed the break-even point.
d At profit-maximizingoutput, marginal cost= marginal revenue.
ANALYZE TABLES1. How does Janine calculate her total revenue and profits when she produces 42 pairs
of jeans?
2. What happens to Janine’s profits when she increases production from 66 to 67 pairsof jeans? Why does this happen?
Profit-maximizingoutput is the level ofproduction at which abusiness realizes thegreatest amount of profit.
QUICK REFERENCE
ECONOMICSSKILLBUILDER
For more on evaluating sources, see theSkillbuilder Handbook, page R28.
144 Chapter 5
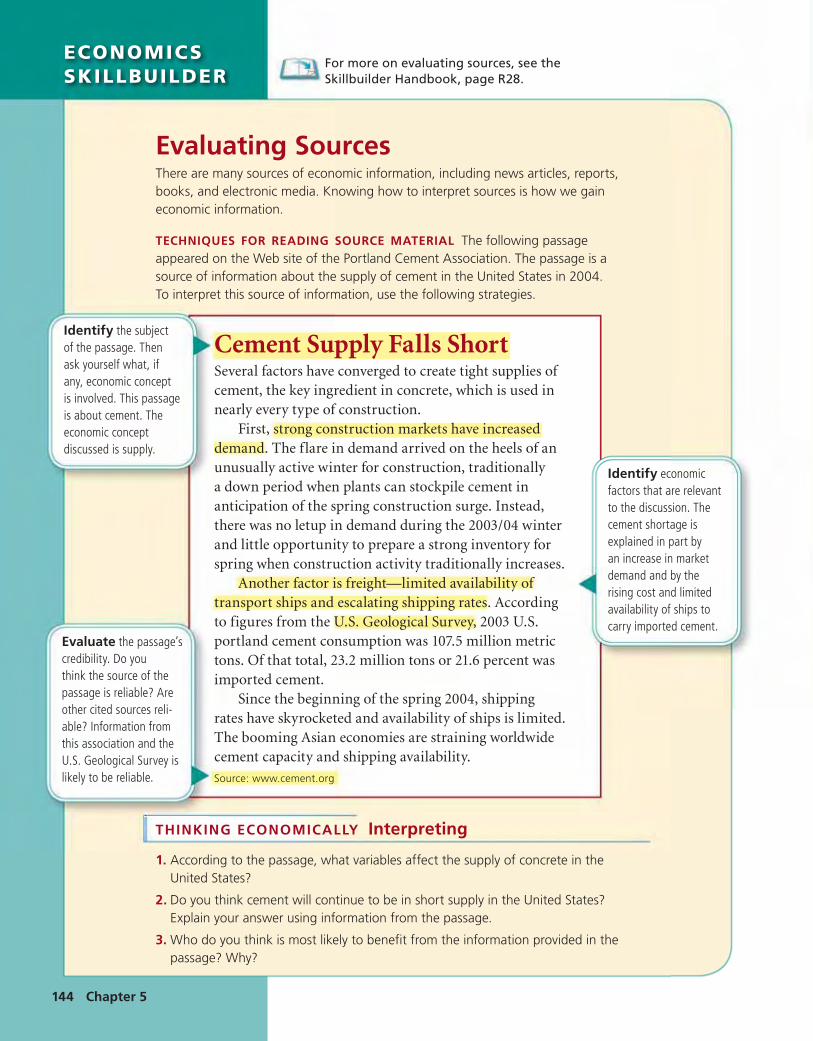
Evaluating SourcesThere are many sources of economic information, including news articles, reports,books, and electronic media. Knowing how to interpret sources is how we gaineconomic information.
TECHNIQUES FOR READING SOURCE MATERIAL The following passageappeared on the Web site of the Portland Cement Association. The passage is asource of information about the supply of cement in the United States in 2004.To interpret this source of information, use the following strategies.
THINKING ECONOMICALLY Interpreting
1. According to the passage, what variables affect the supply of concrete in theUnited States?
2. Do you think cement will continue to be in short supply in the United States?Explain your answer using information from the passage.
3. Who do you think is most likely to benefit from the information provided in thepassage? Why?
Cement Supply Falls ShortSeveral factors have converged to create tight supplies ofcement, the key ingredient in concrete, which is used innearly every type of construction.
First, strong construction markets have increaseddemand. The flare in demand arrived on the heels of anunusually active winter for construction, traditionallya down period when plants can stockpile cement inanticipation of the spring construction surge. Instead,there was no letup in demand during the 2003/04 winterand little opportunity to prepare a strong inventory forspring when construction activity traditionally increases.
Another factor is freight—limited availability oftransport ships and escalating shipping rates. Accordingto figures from the U.S. Geological Survey, 2003 U.S.portland cement consumption was 107.5 million metrictons. Of that total, 23.2 million tons or 21.6 percent wasimported cement.
Since the beginning of the spring 2004, shippingrates have skyrocketed and availability of ships is limited.The booming Asian economies are straining worldwidecement capacity and shipping availability.
Source: www.cement.org
Identify the subjectof the passage. Thenask yourself what, ifany, economic conceptis involved. This passageis about cement. Theeconomic conceptdiscussed is supply.
Identify economicfactors that are relevantto the discussion. Thecement shortage isexplained in part byan increase in marketdemand and by therising cost and limitedavailability of ships tocarry imported cement.
Evaluate the passage’scredibility. Do youthink the source of thepassage is reliable? Areother cited sources reli-able? Information fromthis association and theU.S. Geological Survey islikely to be reliable.

ClassZone.com
C RIT IC AL THINKING
145Supply
ECONOMICS IN PR ACTICE
SECTION 2 AssessmentREVIEWING KEY CONC EP TS
1. Explain the differences between the terms in each of these groups:
2. Why does the marginal cost in Janine’s factory decrease as marginalproduct increases?
3. Explain why marginal revenue and price are the same in Figure 5.9 onpage 143.
4. What changes for a company when it reaches the break-even point?
5. How does a business use marginal analysis to decide how manyworkers to employ?
6. Using Your Notes How does a businesscalculate its total costs? Refer to yourcompleted hierarchy diagram. Use theGraphic Organizer at InteractiveReview @ ClassZone.com
a. marginal productprofit-maximizing output
b. increasing returnsdiminishing returns
c. fixed costvariable cost
7. Categorizing Economic Information Categorize the followingcosts incurred by a bookstore owner as fixed or variable:accountant, electricity for extra holiday hours, wages, clerks’insurance, manager’s salary, purchase of books, rent, telephone.
8. Applying Economic Concepts Suppose that you own a videostore that has total costs of $3,600 per month. If you charge $12for each DVD you sell, how many do you need to sell each monthin order to break even? Explain how you arrived at your answer.
9. Applying Economic Concepts The owner of a factory thatproduces soccer balls determines that his marginal product is atits peak when he has 100 employees. He determines that hismarginal cost and marginal revenue are equal when he has 150employees. What number of employees should he hire in order tomaximize his profits? Explain the reason for your answer.
10. Challenge Many companies choose to manufacture theirproducts in countries where workers are paid lower wages thanin the United States. Which variable costs decrease and whichones increase as a result of this decision? Why do companiesmake this choice? Consider what you know about the relationshipof costs to profits as you formulate your answer.
Calculating Costs and RevenuesSuppose you are a manufacturer ofvideo games. You have analyzed yourcosts of production to create the fol-lowing table.
Calculate Costs Copy the informa-tion in the table on your own paperand add two columns: Total Costsand Marginal Costs. Use the informa-tion given to calculate the values andfill in those two columns.
Challenge You sell the video gamesfor $40 each. Add columns forMarginal Revenue, Total Revenue,and Profit to your chart and calculatethe values for each quantity of totalproduct.
TotalProduct
Fixed Cost($)
VariableCost ($)
0 500 0
25 500 800
50 500 1,200
100 500 1,800
175 500 2,550
275 500 3,350
350 500 4,250
400 500 5,750
ProductionCosts
main idea main idea main idea
details details details

3SECT ION
Factor ThatChanges Supply
Reason WhySupply Changes
146 Chapter 5
OBJECT IVES KEY TERMS TAKING NOTES
As you read Section 3, completea chart like this one showing eachfactor that causes change in supply.Use the Graphic Organizer atInteractive Review @ ClassZone.com
In Section 3, you will
• explain the difference betweenchange in quantity suppliedand change in supply
• understand how to determinea change in supply
• identify the factors that cancause a change in supply
change in quantity supplied, p. 146
change in supply, p. 148
input costs, p. 148
labor productivity, p. 149
technology, p. 149
excise tax, p. 149
regulation, p. 150
Changes in Quantity Supplied
KEY CONCEPTS
The supply schedules and supply curves that you studied in Section 1 were createdusing the assumption that all other economic factors except the price of tomatoeswould remain the same. If all other factors remain the same, then the only thingthat influences how many tomatoes producers will offer for sale is the price of thosetomatoes. The supply curve shows that pattern.
In Chapter 4, you learned the difference between change in demand and changein quantity demanded. Change in quantity demanded is shown by the points alongan existing demand curve, while change in demand actually shifts the demand curveitself. Similarly, the different points on a supply curve show change in quantity sup-plied. Change in quantity supplied is an increase or decrease in the amount of a goodor service that producers are willing to sell because of a change in price.
What Factors Affect Supply?
Change in quantitysupplied is a rise or fallin the amount producersoffer for sale because ofa change in price.
QUICK REFERENCE
A change in the price of bicycles. . . . . . causes a change in the quantity supplied.

Quantity supplied of tomatoes (in pounds)
Pric
e p
er p
ou
nd
(in
do
llars
)
0
.75
.50
.25
1.00
1.25
1.50
1.75
2.00
10 20 30 40 50
FIGURE 5.10 CHANGES IN QUANTITY SUPPLIED
Use an interactive supply curve tosee changes in quantity suppliedat ClassZone.com
147Supply
EXAMPLE Changes Along a Supply Curve
Each new point on the supply curve shows a change in quantity supplied. A changein quantity supplied does not shift the supply curve itself. Let’s look again at theSmiths’ supply curve for tomatoes (Figure 5.10). Note the quantities supplied at eachprice. Notice that as quantity supplied changes, the change is shown by the directionof movement, right or left, along the supply curve. A movement to the right indicatesan increase in both price and quantity supplied. A movement to the left shows adecrease in both price and quantity supplied.
Just as Figure 5.10 shows change in quantity supplied by one individual, a mar-ket supply curve shows similar information for an entire market. However, marketsupply curves have larger quantities supplied, and therefore larger changes to quan-tity supplied, because they combine the data from all the individual supply curves inthe market. For example, when the price increases from $0.75 to $1.75 on the marketsupply curve (Figure 5.5), the quantity supplied increases from 100 pounds to 300.Compare this with the change in quantity supplied at those prices in Figure 5.10.
APPLICATION Applying Economic Concepts
A. Changes in quantity supplied do not shift the position of the supply curve. Why?
ANALYZE GRAPHS
1. What is the change in quantity suppliedwhen price increases from $0.75 to $1.50?
2. What is the change in price when quantitysupplied changes from 50 to 24 pounds?
A change in quantitysupplied doesn’t shift thesupply curve. The changerefers to movement alongthe curve itself. Each point onthe curve represents a newquantity supplied.
a As you move to theright along the curve,the quantity suppliedincreases.
b As you move to theleft along the curve,the quantity supplieddecreases.
b
a

0
1
2
3
5
4
10 20 30 40 50 60
Pric
e p
er n
utr
itio
n b
ar (
in d
olla
rs)
Pric
e p
er n
utr
itio
n b
ar (
in d
olla
rs)
Quantity supplied of nutrition bars
0
1
2
3
5
4
10 20 30 40 50 60
Quantity supplied of nutrition bars
S1S2 S1 S3
FIGURE 5.11 DECREASE IN SUPPLY FIGURE 5.12 INCREASE IN SUPPLY
FIGURES 5.11 AND 5.12 SHIFTS IN SUPPLY
148 Chapter 5
Changes in Supply
KEY CONCEPTS
Consider what might happen if the workers at an automobile factory negotiate a largewage increase so that it’s more expensive to produce each automobile. As the firm’scosts increase, it is less willing and able to offer as many automobiles for sale. Anyaction such as this, which changes the costs of production, will change supply. Change
in supply occurs when something prompts producers to offer different amounts forsale at every price. When production costs increase, supply decreases; when productioncosts decrease, supply increases.
Just like change in demand, change in supply actually shifts the supply curve.Six factors cause a change in supply: input costs, labor productivity, technology,government actions, producer expectations, and number of producers.
FACTOR 1 Input Costs
Input costs are a major factor that affects production costs and, therefore, supply.Input costs are the price of the resources needed to produce a good or service. Forexample, Anna makes nutrition bars that contain peanuts. If the price of peanutsincreases, Anna’s costs increase. She cannot afford to produce as many nutritionbars, and her supply curve shifts to the left (Figure 5.11). When the price of peanutsdecreases, her costs decrease. She is willing and able to increase the quantity she cansupply at every price, and the curve shifts to the right (Figure 5.12).
Change in supplyoccurs when a change inthe marketplace promptsproducers to sell differentamounts at every price.
QUICK REFERENCE
Input costs are the priceof the resources used tomake products.
QUICK REFERENCE
ANALYZE GRAPHS
1. In Figure 5.11, how has the supply of nutrition barschanged at every price?
2. In Figure 5.12, how has the supply of nutrition barschanged at every price?
When a change insupply occurs, thesupply curve shifts.
a As Figure 5.11shows, a shift to theleft (S2) indicates adecrease in supply.
b As Figure 5.12shows, a shift to theright (S3) indicatesan increase insupply.
Use an interactive versionof shifting supply curves atClassZone.com
ba

149Supply
Labor productivity isthe amount of goods andservices that a person canproduce in a given time.
Technology entailsapplying scientificmethods and innovationsto production.
QUICK REFERENCE
An excise tax is a tax onthe making or selling ofcertain goods or services.
QUICK REFERENCE
The Typewriter’sEnd The move fromtypewriter to computershows how technologyhelps to boost productivity.
FACTOR 2 Labor Productivity
Labor productivity is the amount of goods and services that a person can produce ina given time. Increasing productivity decreases the costs of production and thereforeincreases supply. For example, a specialized division of labor can allow a producer tomake more goods at a lower cost, as was the case at Janine’s factory in Section 2. Hermarginal costs decreased when there were six workers, each of whom had a separatejob to do.
Better-trained and more-skilled workers can usually produce more goods in lesstime, and therefore at lower costs, than less-educated or less-skilled workers. Forexample, a business that provides word-processing services can produce more docu-ments if its employees type quickly and have a lot of experience working with word-processing software.
FACTOR 3 Technology
One way that businesses improve their productivity and increase supply is throughthe use of technology. Technology involves the application of scientific methods anddiscoveries to the production process, resulting in new products or new manufac-turing techniques. Influenced by the profit motive, manu-facturers have, throughout history, used technology to makegoods more efficiently. Increased automation, including theuse of industrial robots, has led to increased supplies of auto-mobiles, computers, and many other products. (See the CaseStudy on pages 158–159.)
Improved technology helps farmers produce more foodper acre. It also allows oil refiners to get more gasoline outof every barrel of crude oil and helps to get that gasoline togas stations more quickly and more safely. In addition, tech-nological innovations, such as the personal computer, enableworkers to be more productive. This, in turn, helps businessesto increase the supply of their services, such as processinginsurance claims or selling airline tickets.
FACTOR 4 Government Action
Government actions can also affect the costs of production,both positively and negatively. An excise tax is a tax on theproduction or sale of a specific good or service. Excise taxesare often placed on items such as alcohol and tobacco—things whose consumption the government is interested indiscouraging. The taxes increase producers’ costs and, there-fore, decrease the supply of these items.
Taxes tend to decrease supply; subsidies have the opposite effect. You learned inChapter 3 that a subsidy is a government payment that partially covers the cost of aneconomic activity. The subsidy’s purpose is to encourage or protect that activity. Mostforms of energy production in the United States receive some form of subsidy. Forexample, subsidies helped to double the supply of ethanol, a gasoline substitute madefrom corn, between 2000 and 2004.

0
S1 S2
.50
1.00
1.50
2.00
2.50
3.00
50 100 150 200 250 300
Quantity supplied of ice cream cones
Pric
e (i
n d
olla
rs)
FIGURE 5.13 NUMBER OF PRODUCERS
150 Chapter 5
Government regulation, the act of controlling business behavior through a set ofrules or laws, can also affect supply. Banning a certain pesticide might decrease thesupply of the crops that depend on the pesticide. Worker safety regulations mightdecrease supply by increasing a business’s production costs or increase supply byreducing the amount of labor lost to on-the-job injuries.
FACTOR 5 Producer Expectations
If producers expect the price of their product to rise or fall in the future, it may affecthow much of that product they are willing and able to supply in the present. Differentkinds of producers may react to future price changes differently. For example, if afarmer expects the price of corn to be higher in the future, he or she may store someof the current crop, thereby decreasing supply. A manufacturer who believes theprice of his or her product will rise may run the factory for an extra shift or invest inmore equipment to increase supply.
FACTOR 6 Number of Producers
When one company develops a successful new idea, whether it’s designer weddinggowns, the latest generation of cell phones, or fast-food sushi, other producers soonenter the market and increase the supply of the good or service. When this happens,the supply curve shifts to the right, as you can see in Figure 5.13.
An increase in the number of producers means increased competition, whichmay eventually drive less-efficient producers out of the market, decreasing supply.(You’ll learn more about competition in Chapter 7.) Competition has a major impacton supply, as producers enter and leave the market constantly.
ANALYZE GRAPHS
1. About how many ice cream cones were sold at $1.00 when Casey was theonly producer in the market?
2. How do these two curves show the effect of the number of producers on thesupply of ice cream cones in the market?
a This supply curve (S1)shows the number of icecream cones sold in aweek at each price whenCasey is the only supplierin the market.
b This curve (S2) showsthe number of ice creamcones sold in a week ateach price when threemore suppliers enter themarket.
ba
Regulation is a set ofrules or laws designed tocontrol business behavior.
QUICK REFERENCE

151Supply
Figure 5.13 shows what happens to the supply of ice cream cones in a neighbor-hood as more producers enter the market. When Casey opened his ice cream storeit was the only one in the area. It was an instant success. Within six months, threecompeting stores had opened in the neighborhood, and the supply of ice cream conesincreased at all price levels. A year later, though, this intense competition forced oneof the producers to leave the market.
APPLICATION Applying Economic Concepts
B. Choose an item of food or clothing that you buy regularly. List as many input costsas you can that might affect the supply of that product. Compare your list with a
classmate’s and see if you can add to each other’s lists.
F I G U R E 5.14 Factors That Cause a Change in Supply
ECONOMICS ESSENTIALS
ANALYZE CHARTS
A newspaper article states that the supply of snowboards has risen dramatically over the past sixmonths. Choose four of the six factors that cause a change in supply and explain how each mighthave resulted in the recent influx of snowboards.
Input Costs Input costs, the collective priceof the resources that go into producing agood or service, affect supply directly.
Labor ProductivityBetter-trained ormore-skilled work-ers are usuallymore productive.Increased productiv-ity decreases costsand increases supply.
TechnologyBy applyingscientific advancesto the productionprocess, produc-ers have learnedto generate theirgoods and servicesmore efficiently.
Government Action Government actions,such as taxes or subsidies, can have a posi-tive or a negative effect on productioncosts.
ProducerExpectations Theamount of productproducers are willingand able to supplymay be influencedby whether theybelieve prices will goup or down.
Number of ProducersA successful new prod-uct or service alwaysbrings out competitorswho initially raiseoverall supply. What
Causes aChange inSupply?

A Vast Reach BET sup-plies programming to morethan 80 million householdsin Canada, the UnitedStates, and the Caribbean.
Find an update onRobert Johnson atClassZone.com
152 Chapter 5
ECONOMICS PACESET TER
Robert Johnson: Supplying African-American Entertainment
In this section, you’ve learned about the factors that influence supply. You’ve also seensome examples of how these factors work. The story of media entrepreneur RobertJohnson provides a real-world example of how the entrance of a new supplier canaffect a market.
EXAMPLE Expanding the Number of Producers
In the late 1970s, Robert Johnson was working as a Washington lobbyist for theNational Cable Television Association. He recognized that current suppliers in thecable TV industry were ignoring a substantial market—African Americans.To fill this void, Johnson conceived the idea for Black Entertainment Television(BET), the first cable channel owned by and focused on African Americans.
To launch his dream, Johnson took out a $15,000 bank loan. He also persuadeda major investor to put up $500,000. Next, he secured space on a cable TV satellitefor his new channel. BET’s first program appeared on January 8, 1980. The companygrew from offering two hours of programming a week to round-the-clock program-ming on five separate channels. Cable operators in the United States, Canada, andthe Caribbean saw the value of this kind of targeted programming, and began to buyBET’s shows.
At first, BET targeted young viewers with programssimilar to those on MTV. As the cable TV industrygrew and became more profitable, Johnson investedin more diverse programming. Of this transition heexplained, “Now we’re a music video channel witha public affairs footprint. . . .” BET could “play music,but also . . . cover issues that are of concern to AfricanAmericans.” BET.com, the number one Internet portalfor African Americans, soon followed.
In 2001, Johnson sold BET to the giant mediacompany Viacom International Inc. for $3 billion andbecame the nation’s first black billionaire. After the sale,Johnson stayed on at BET and continued to run the com-pany for five more years. His success demonstrated thatthere was a strong market for African-American enter-tainment. As a result, many suppliers—some with notraditional ties to the African-American community—now offer the kind of programming Johnson pioneered.
APPLICATION Making Inferences
C. What effects might BET’s success have on the supply
of African-American programming?
Robert Johnson
Title: Chairman of BETHoldings II, Inc., retired
Born: April 8, 1946,Hickory, Mississippi
Major Accomplish-ment: BET is the leadingsupplier of cable TVprogramming aimed atAfrican Americans.
Other Enterprises:Digital music networks,publishing, eventsproduction, BET.comWeb portal, NBA teamCharlotte Bobcats, andWNBA Charlotte Sting
Honors: Broadcastingand Cable Magazine Hallof Fame Award, NAACPImage Award
FAST FACTS

ClassZone.com
153Supply
ECONOMICS IN PR ACTICE
SECTION 3 AssessmentREVIEWING KEY CONC EP TS
1. Explain the differences between the terms in each of these pairs:
a. change in quantity suppliedchange in supply
b. input coststechnology
c. excise taxregulation
2. What else besides raw materials would be included in input costs?
3. Why might an increase in oil prices lead to a decrease in the supply offruits and vegetables in your local supermarket?
4. Why do excise taxes and subsidies affect supply differently?
5. Does expectation of a change in price affect supply? Illustrate youranswer with examples.
6. Using Your Notes How does a change innumber of producers affect supply? Referto your completed chart.
Use the Graphic Organizer at InteractiveReview @ ClassZone.com
7. Applying Economic Concepts How do each of these examplesof government actions affect the supply of gasoline?
a. In 2005, the government continued support for ethanol, agasoline substitute.
b. The state of California requires a special blend of gasoline thatmeets stricter environmental standards than other regions inthe country.
c. Many states use gasoline taxes to help fund highwayconstruction and maintenance.
8. Making Inferences Why do you think governments want toinfluence the supply of alcohol and tobacco products by imposingexcise taxes?
9. Analyzing Effects Take out the market supply curve for skis thatyou created on page 137. Add new curves showing how supplywould be changed in each of the following cases. Share yourgraph with a classmate and explain your reasoning.
a. The price of titanium, used in skis, declines dramatically.
b. A large manufacturer decides to stop producing skis.
10. Challenge How does an increased number of producers affectthe prices of goods in a market? What is the reason for thiseffect? Think about what you know about demand and supplyand review Figure 5.12 as you formulate your answer.
Explaining Changes in SupplySuppose that you are a manufacturerof personal digital music players(PDMPs). What factors affect supplyfor PDMPs? The chart below listsexamples of a change in supply in themarket for PDMPs. For each example,identify which factor that affectssupply is involved and state whethersupply increases or decreases.
Challenge Identify which of the sixfactors that affect supply does notappear on this chart. What would bean example of how that factor mightaffect the market for PDMPs?
Example of ChangeThat Affects
Supply
Factor andHow It
AffectedSupply
You give each work-er in your factory aspecialized job.
Price of computerchips used in PDMPsrises.
New machineryspeeds up the manu-facturing process.
Your successprompts three newcompanies to startproducing PDMPs.
A new law requiresproducers to recyclethe wastewater fromtheir factories.
C RIT IC AL THINKING
Factor ThatChanges Supply
Reason WhySupply Changes

4SECT ION
154 Chapter 5
As you read Section 4, complete acluster diagram like the one shown.Use the Graphic Organizer atInteractive Review @ ClassZone.com
In Section 4, you will
• define the term elasticity ofsupply
• explain the difference betweenelastic and inelastic supply
• identify the factors that affectelasticity of supply
elasticity of supply, p. 154
Elasticity of Supply
KEY CONCEPTS
According to the law of supply, as price increases so will the supply of a good orservice. When Toyota Motor Corporation introduced its Prius hybrid in 2000, it wassurprised by the automobile’s instant popularity. Consumers were willing to paymore than the manufacturer’s suggested price. Yet Toyota was not able to increasesupply at the same pace that consumer demand and prices rose. Even five years later,Toyota could not meet rising demand. This inability to effectively respond to andmeet increased demand suggests that the supply of the Prius was inelastic.
In Chapter 4, you learned that elasticity of demand measures how responsiveconsumers are to price changes. In a similar way, elasticity of supply is also ameasure of how responsive producers are to price changes.If a change in price leads to a relatively largerchange in quantity supplied, supply is saidto be elastic. In other words, supply iselastic if a 10 percent increase inprice causes a greater than 10percent increase in quantitysupplied. If a change in priceleads to a relatively smallerchange in quantity supplied,supply is said to be inelastic. If theprice and the quantity suppliedchange by exactly the same per-centage, supply is unit elastic.
What Is Elasticity of Supply?
Elasticity of supplyis a measure of howresponsive producers areto price changes in themarketplace.
QUICK REFERENCE
Elasticityof Supply
OBJECT IVES KEY TERMS TAKING NOTES
Inelastic Supply The supply of expensive andcomplicated items, such as this Prius hybrid,is often inelastic.

155Supply
EXAMPLE Elastic Supply
Let’s look at an example of elastic supply. Figure 5.15 illustrates how the quantitysupplied of a new style of leather boots was elastic. As the boots gained in popular-ity, a shortage developed. The boot makers raised the price of the boots from $60 to$150 dollars, and the quantity supplied more than kept up, escalating from 10,000 to50,000 pairs. The producer was able to rapidly increase the quantity supplied because,unlike car manufacturing for instance, the raw materials needed to make boots areneither particularly expensive nor hard to come by. The actual manufacturing pro-cess is also, relatively speaking, fairly uncomplicated and easy to increase.
EXAMPLE Inelastic Supply
In Chapter 4, you learned that demand for gasoline was inelastic. The supply of gas-oline is also inelastic. Although gasoline prices rose 20 to 30 percent between 2004and 2005, producers were not able to increase supply by the same amount because ofthe limited supply of crude oil and refining capacity.
Figure 5.16 shows how the supply of olive oil is also inelastic. When the price ofolive oil rose by a factor of four, supply could not keep pace, as the oil comes fromthe previous season’s olives and is exported from the Mediterranean region.
APPLICATION Drawing Conclusions
A. A bakery produces 200 muffins per week that sell for $1.50 each. When the priceincreases to $2.00, it produces 300 muffins per week. Is supply elastic or inelastic?Explain your answer.
0
30
60
90
120
150
10 20 30 40 50 0
1
2
3
4
5
10 20 30 40 50
FIGURE 5.15 ELASTIC SUPPLY CURVE FIGURE 5.16 INELASTIC SUPPLY CURVE
Quantity supplied of boots (in thousands)
Pric
e p
er p
air
of
bo
ots
(in
do
llars
)
Pric
e p
er g
allo
n (
in d
olla
rs)
Quantity supplied of olive oil
(in thousands of gallons)
ANALYZE GRAPHS1. If the price of leather rose dramatically for the boots in
Figure 5.15, how might this affect elasticity of supply?
2. In the United States, would the supply of corn oil be moreelastic than the supply of olive oil? Why or why not?
a The curve in Figure5.15 slopes gradually.It slopes morehorizontally thanvertically because ofgreater changes inquantity supplied.
b The curve in Figure5.16 slopes steeply. Itslopes more verticallythan horizontallybecause of lesserchanges in quantitysupplied.
Use elastic and inelastic supplycurves at ClassZone.com
a
b

156 Chapter 5
What Affects Elasticity of Supply?
KEY CONCEPTS
Just as there are factors that cause a change in supply, there are also factors thataffect the elasticity of supply. There are far fewer of these factors than for elasticityof demand. The ease of changing production to respond to price change is the mainfactor in determining elasticity of supply. Given enough time, the elasticity of supplyincreases for most goods and services. Supply will be more elastic over a year or sev-eral years than it will be if the time frame to respond is a day, a week, or a month.
Industries that are able to respond quickly to changes in price by either increasingor decreasing production are those that don’t require a lot of capital, skilled labor,or difficult-to-obtain resources. For example, the quantity supplied of dog-walkingservices can increase rapidly with the addition of more people to walk dogs. A smallbusiness that sells crafts made from recycled materials would be able to respondquickly to changes in the price of its various products by applying its resources toincrease the supply of its higher priced items.
For other industries, it takes a great deal of time to shift the resources of pro-duction to respond to price changes. Automakers and oil refiners are examples ofindustries that rely on large capital outlays or difficult-to-obtain resources. It mighttake such suppliers a considerable amount of time to respond to price changes.
APPLICATION Applying Economic Concepts
B. Is the elasticity of a farmer’s crop of sweet corn greater at the beginning of thegrowing season or in the middle of the growing season? Why?
YOUR ECONOMIC CHOICES
?
ELASTICITY OF SUPPLY
Which supply of cupcakes is more elastic?You’re planning to sell cupcakes at your school’sfootball game to raise funds for a charitable cause,but it’s hard to say in advance how many fans willattend the game. You can place an order with abakery (which you need to do a week early) orhave volunteers do the baking the night beforethe game. Which supply of cupcakes is moreelastic? Why?

ClassZone.com
157Supply
1. Use each of the following three terms in a sentence that gives anexample of the term as it relates to supply:
2. How is elasticity of supply similar to elasticity of demand? How is itdifferent?
3. Is the supply of genuine antique furniture elastic or inelastic? Why?
4. What is the difference between industries that have elastic supplyand those that have inelastic supply?
5. What is the main factor that affects elasticity of supply and how doesit affect elasticity?
6. Using Your Notes How is time related toelasticity of supply? Refer to your completedcluster diagram. Use the Graphic Organizerat Interactive Review @ ClassZone.com
a. elastic b. inelastic c. elasticity of supply
7. Analyzing Causes Between 1997 and 2002, many goldproducers cut their budgets for exploring for new sources in orderto stay profitable when the price of gold was less than $350 perounce. When the price rose above $400 per ounce in 2004, goldproducers were not able to respond quickly to the increase. Usewhat you know about elasticity of supply to explain this cause-and-effect relationship.
8. Analyzing Data In May, Montclair Electronics sold 100 portableDVD players at $150 each. High consumer demand at the startof the summer travel season increased the price to $180. In June,the store sold 115 DVD players at the higher price. Is the supply ofDVD players elastic or inelastic? Show your math calculations tosupport your answer.
9. Applying Economic Concepts Analyze the factors thatdetermine elasticity of supply to explain why it is difficult fororange growers to respond quickly to changes in the price oforange juice.
10. Challenge Prices are up 8 percent at the local juice shop. Itsraw materials are inexpensive and easy to find, and the labor isunskilled. Should the shop be able to raise quantity supplied morethan 8 percent? Why?
Calculating ElasticityThe growing market for bottled yogurtsmoothies is shown in the supplyschedule below. Use the informationin the table to determine whetherthe quantity supplied is growingproportionately more than increasesin price. Would you expect supplyfor yogurt smoothies to be elastic orinelastic over a period of six months?
Create a Supply Curve Use theinformation in the supply scheduleto create a supply curve for yogurtsmoothies. What does the slope ofthis curve indicate about elasticity ofsupply for yogurt smoothies?
Challenge Adapt the information inthe Math Challenge on page 121 tocalculate the elasticity of supply usingthe data in the supply schedule above.Substitute quantity supplied forquantity demanded in the formula.
Price ($) Quantity Suppliedof Smoothies
2.00 600
1.75 450
1.50 300
1.25 200
Elasticityof Supply
ECONOMICS IN PR ACTICE
SECTION 4 AssessmentREVIEWING KEY CONC EP TS
C RIT IC AL THINKING
Use @ClassZone.com to complete this activity.

Find an update on this CaseStudy at ClassZone.com
158 Chapter 5
Case Study
Robots—TechnologyIncreases SupplyBackground The increasing sophistication of technology continues to have aprofound impact on the production and supply of manufactured goods. Robots—machines that can be programmed to perform a variety of tasks—are a primeexample of technology’s effect on industry.
Today, industrial robots perform a wide variety of functions. Although robotsdo everything from packaging pharmaceuticals to dispensing genetic material inbiotechnical laboratories, half of all industrial robots are used to make automo-biles. Robots are ideal for lifting heavy objects and for performing repetitive activi-ties that humans find boring. Lately, though, robots are being used more for tasksthat require refined skills.
What’s the issue? How does technology increase supply? Study these sources todiscover how robots can increase productivity.
Toyota to Use “Super” RobotsAs the Japanese labor pool declines, Toyota turns to robots.
Toyota is deploying at all 12 of its domestic plants robotscapable of performing several simultaneous operations. Itaims to be the first automaker to introduce robots that, inaddition to machine work and engine assembly, performthe finishing touches on the assembly line. . . .
In the automobile industry robots mainly perform rela-tively dangerous tasks such as welding and coating, while,in order to preserve quality, human workers accomplishsuch complicated final processes as attaching interior trim.
But Toyota plans to introduce robots to final assemblyprocesses after establishing the necessary controltechnology and safeguards, and developing parts easilyassembled by android [robotic] hands.
Even this super robot will not result in the total replace-ment of man by machine; rather it will reinforce thestrengths of the production line and compensate formanpower shortages in a truly Toyota-style productioninnovation.
The company plans to use robots to keep production costs at the levelof those in China. . . . Toyota presently uses between 3,000 and 4,000standard robots. It expects a total of 1,000 super robots to join them.Source: japaninc.net
Thinking Economically Will the use of robots as described in this articleaffect the supply of Toyota automobiles? Explain your answer.
Japan’s low birth-rate is likely toresult in a shortageof workers. Thisarticle discusseshow Toyota plansto use robots tosolve this problem.
A.OnlineArticle
159Supply
THINKING ECONOMICALLY Synthesizing
1. Which of the six factors that can cause a change in supply is highlighted in the threedocuments? Does this factor generally increase or decrease supply?
2. Which document, B or C, addresses the issue of elasticity? Explain.
3. In which article, A or C, are the robots an example of variable costs? Why?
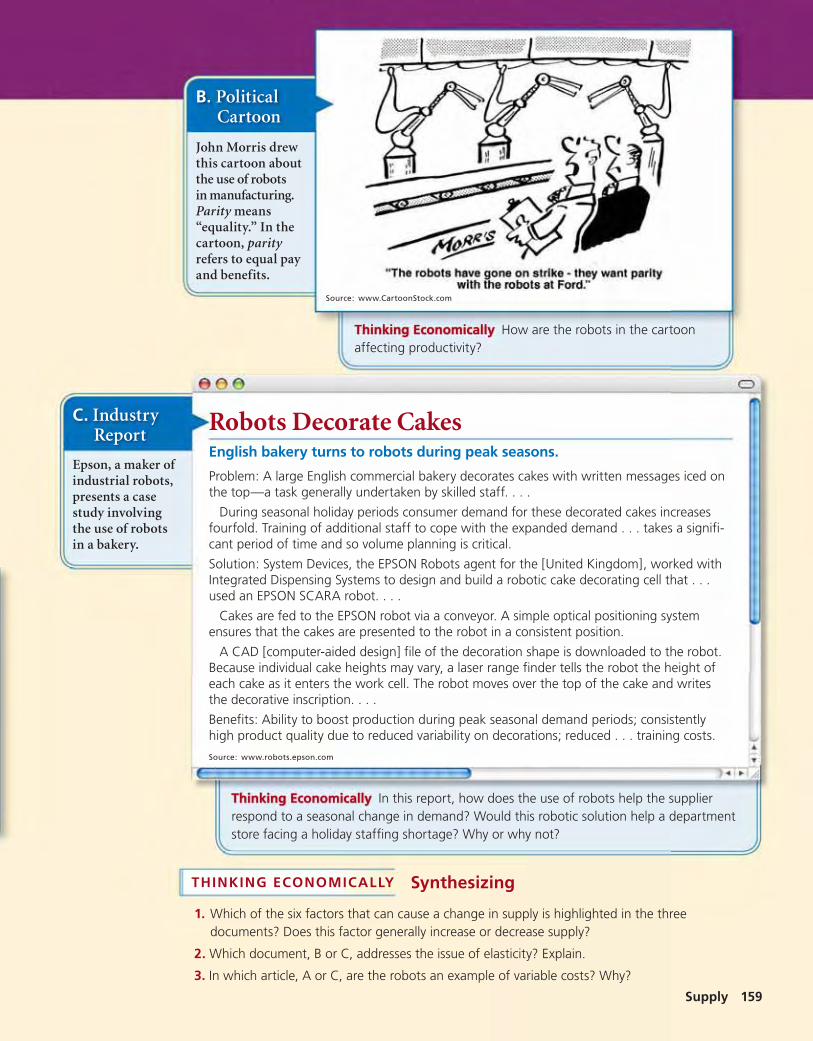
John Morris drewthis cartoon aboutthe use of robotsin manufacturing.Parity means“equality.” In thecartoon, parityrefers to equal payand benefits.
Thinking Economically How are the robots in the cartoonaffecting productivity?
B. PoliticalCartoon
Robots Decorate CakesEnglish bakery turns to robots during peak seasons.
Problem: A large English commercial bakery decorates cakes with written messages iced onthe top—a task generally undertaken by skilled staff. . . .
During seasonal holiday periods consumer demand for these decorated cakes increasesfourfold. Training of additional staff to cope with the expanded demand . . . takes a signifi-cant period of time and so volume planning is critical.
Solution: System Devices, the EPSON Robots agent for the [United Kingdom], worked withIntegrated Dispensing Systems to design and build a robotic cake decorating cell that . . .used an EPSON SCARA robot. . . .
Cakes are fed to the EPSON robot via a conveyor. A simple optical positioning systemensures that the cakes are presented to the robot in a consistent position.
A CAD [computer-aided design] file of the decoration shape is downloaded to the robot.Because individual cake heights may vary, a laser range finder tells the robot the height ofeach cake as it enters the work cell. The robot moves over the top of the cake and writesthe decorative inscription. . . .
Benefits: Ability to boost production during peak seasonal demand periods; consistentlyhigh product quality due to reduced variability on decorations; reduced . . . training costs.
Source: www.robots.epson.com
Epson, a maker ofindustrial robots,presents a casestudy involvingthe use of robotsin a bakery.
Thinking Economically In this report, how does the use of robots help the supplierrespond to a seasonal change in demand? Would this robotic solution help a departmentstore facing a holiday staffing shortage? Why or why not?
C. IndustryReport
Source: www.CartoonStock.com

Year
Do
llars
per
gal
lon
FIGURE 5.17 U.S. PRICES OF CRUDE OIL ANDGASOLINE
0
.50
1.00
1.50
2.00
2.50GASOLINE
CRUDE OIL
20052004200320022001
Source: Energy Information Administration, June 2006
Complete the following activity either on yourown paper or online at ClassZone.com
160 Chapter 5
CHAPTER 5 AssessmentREVIEWING KEY CONC EP TS
Review this chapter using interactiveactivities at ClassZone.com
• Online Summary• Quizzes• Vocabulary Flip Cards
• Graphic Organizers• Review and Study Notes
Choose the key concept that best completesthe sentence. Not all key concepts will be used.
break-even pointchange in quantity suppliedchange in supplydiminishing returnselasticity of supplyfixed costincreasing returnsinput costslaw of supplymarginal cost
marginal productmarginal revenueproductivityprofit-maximizing outputsupplysupply curvesupply scheduletotal producttotal revenuevariable cost
1 is the quantity of a product that producers arewilling and able to offer for sale. According to the 2 , when price increases, quantity supplied
increases, and when price decreases, quantitysupplied decreases. Quantity supplied can bedisplayed on a chart called a 3 or on a graphcalled a 4 .
5 is the change in 6 caused by hiring oneadditional worker. When marginal product beginsto decrease, production is in the stage of 7 .
Total cost is the sum of 8 and variable costs.9 is the additional cost of producing one moreunit. When marginal cost equals 10 , a companyhas reached 11 .
A 12 occurs when producers are willing tosell different amounts of a product at every price.The six factors that change supply are input costs, 13 , technology, government action, producer
expectations, and number of producers.The term 14 describes how responsive
producers are to price changes. It is measured bycomparing 15 to change in price.
What Is Supply? (pp. 130–137)
1. What two requirements of supply must someonemeet to be considered a producer?
2. What does it mean to say that quantity suppliedand price have a direct relationship?
What Are the Costs of Production? (pp. 138–145)
3. How does marginal product change during thethree stages of production?
4. What is the relationship of total costs to profit?
What Factors Affect Supply? (pp. 146–153)
5. What is the difference between change in quantitysupplied and change in supply?
6. How do input costs affect supply?
What Is Elasticity of Supply? (pp. 154–159)
7. How are elastic and inelastic supply different?
8. How might you calculate elasticity of supply?
Look at the graph below showing price changes fortwo commodities: crude oil and gasoline.
9. How is the price of gasoline related to theprice of crude oil?
10. What factor that affects the supply of gasoline isshown in this graph? How does this factor affectthe supply of gasoline?
APPLYING ECONOMIC CONC EP TS

Supply 161
S I M U L AT I O NC RIT IC AL THINKING
11. Analyzing Data Suppose that you own a factoryproducing backpacks that sell for $20 each. Use theinformation in this table to calculate marginal cost, totalrevenue, and profit at each level of output. Identify thebreak-even point and profit-maximizing output.
12. Analyzing Effects A city puts a new rule intoeffect about the kinds of beverages that may besold in schools. Sugary sodas must be replaced bybottled water, fruit juices, and sports drinks. Howwill this decision affect the supply of each categoryof beverage at the schools? What factor that affectssupply is demonstrated in this situation?
13. Drawing Conclusions Both demand and supplyfor gasoline are inelastic. Would the elasticity of sup-ply and demand be the same for sports cars? Whyor why not?
14. Challenge When a string of hurricanes hit Florida,preparation for and cleanup from the storms in-creased demand for plywood. Yet prices rose onlyslightly, partly because large chains shipped plywoodfrom stores around the country in anticipation of theincreased demand. How does this story illustrate thelaw of supply and elasticity of supply?
How Much Are You Willing to Supply?Choose a partner. Imagine that the two of you runa software company. Your best-selling product is aprogram that helps businesses manage their inventory.Next year you will produce 20,000 units. The followingpartial supply schedule shows the prices at which youwill likely sell your product during that period.
Step 1 Copy the schedule onto a sheet of paper andfill in the missing amounts in the Quantity Suppliedcolumn. Be sure that the amounts you choose adhere tothe law of supply.
Step 2 Draw a supply curve to illustrate your schedule.Be sure to label each axis of your curve.
Step 3 Get together with three other groups. Theseare your competitors. Bring all of your individual supplyschedules together to make a market supply schedule.Then convert the market supply schedule into a marketsupply curve.
Step 4 You and your competitors find out that severalother companies are getting ready to introduce simi-lar inventory-control software. On your market supplycurve, show how this development causes a shift insupply.
Step 5 Although writing your program was difficult,now that it is written, it is relatively quick and easy toproduce copies for sale. Is the supply of your productelastic or inelastic? Why?
Use @ ClassZone.comto complete this activity.
SOFTWARE SUPPLY SCHEDULE
Price ($) Quantity Supplied
70 7,500
65
60
55
50 1,000
BACKPACK PRODUCTION COSTS
Production Costs
Total Product Total Cost ($)
100 3,500
200 5,300
300 7,000
400 8,000
500 8,800
600 9,800
700 11,800
800 14,300
900 17,000