5 oil spill response and cleanup...
TRANSCRIPT
5 Oil Spill Response and Cleanup TechniquesJacqueline Michel1, Gary Shigenaka2, and Rebecca Hoff2
Page
Introduction.....................................................................................................5-1
Open-water response techniquesDispersants..................................................................................................5-1Dispersant types and application methods..........................5-2Review of dispersant tests...............................................................5-11Monitoring of dispersant applications......................................5-13Toxicity of oil spill dispersants.......................................................5-17
Mammals.................................................................................................5-27Birds...........................................................................................................5-31Fish..............................................................................................................5-34Crustaceans..........................................................................................5-35Molluscs....................................................................................................5-36Corals.........................................................................................................5-38Microorganisms..................................................................................5-38Plants.........................................................................................................5-40
Summary.....................................................................................................5-42Dispersant use guidelines.................................................................5-44
Shoreline cleanup methods and application.............................5-50Approved physical treatment methods................................5-50
No action..................................................................................................5-51Manual removal.................................................................................5-51Passive collection sorbents........................................................5-52Debris removal...................................................................................5-52Trenching...............................................................................................5-51Sediment removal............................................................................5-53Cold water flooding (deluge).....................................................5-53Cold water low/high pressure.................................................5-54
1Research Planning, Inc., P.O. Box 328, Columbia, South Carolina 292022National Oceanic and Atmospheric Administration, 7600 Sand Point Way N.E, Seattle, Washington98115
Page
Warm water moderate/high pressure.............................5-55Hot water pressure washing....................................................5-56Slurry sand blasting.......................................................................5-57Vacuum...................................................................................................5-57
Treatment methods requiring RRT approval.....................5-58Cutting vegetation...........................................................................5-58Chemical..................................................................................................5-59Burning....................................................................................................5-61Nutrient enhancement.................................................................5-62Microbial addition..............................................................................5-63Sediment reworking.......................................................................5-63Shoreline removal, cleansing, and replacement........5-64Other techniques..............................................................................5-65
Beach cleaners..............................................................................5-65Elastol...................................................................................................5-65Bioremediation.............................................................................5-68
References.........................................................................................................5-99
Chapter 5.Oil Spill Response and Cleanup TechniquesIntroduction
The majority of oil spills (number of events) occur in coastal waters or in ports.
Therefore, contamination of the shoreline is likely at most spills, and thus the issues
of oil recovery and shoreline cleanup must be addressed. Nearly all shoreline
cleanup methods have some kind of environmental impact, so selection of a
cleanup method inherently forces us to make some kind of tradeoff of the effects of
the oil versus the effects of the cleanup. In this chapter, we describe some of the
commonly used techniques for oil spill response and shoreline cleanup. There has
been little innovation in the physical removal technologies since the 1970s. The
only really new techniques developed in the last few years involve chemical and
biological treatment methods.
Open Water Response Techniques: Dispersants
It has been nearly 25 years since the Torrey Canyon oil spill, where large amounts of
highly toxic degreasers were applied directly to oiled rocky shores, marshes, and sand
beaches in England. The impacts to intertidal biological communities were
extensive and well documented (Smith, 1968). This very negative experience led to
the prohibition of dispersant use in many countries and the perception that all
dispersants are highly toxic. Since that time, there has been much talk and little
"action" about dispersants. New formulations have been produced, many of which
have acute toxicities lower than the constituents and fractions of most crude oil
products (NRC, 1989). There have been extensive laboratory and field tests on
effectiveness and toxicity, and workshops and protocols for dispersant-use decision
making during spills. The number of papers presented at the Oil Spill Conference
over the last ten years reflects the growing interest in the potential for use of
dispersants in the first half of the decade and the dropoff in interest in the second
half as dispersants failed to become an accepted spill response tool:
1981 - 15 papers in two sessions1983 - 10 papers scattered around in various sessions1985 - 25 papers1987 - 30 papers1989 - 15 papers1991 - 11 papers
5-1
There are many good reports on dispersants, including the most recent (1989)
National Research Council publication Using Oil Spill Dispersants on the Sea. In
this section we only briefly summarize the key issues on dispersant application, test
results, toxicity, and guidelines for decision making on dispersant use.
Dispersant Types and Application Methods
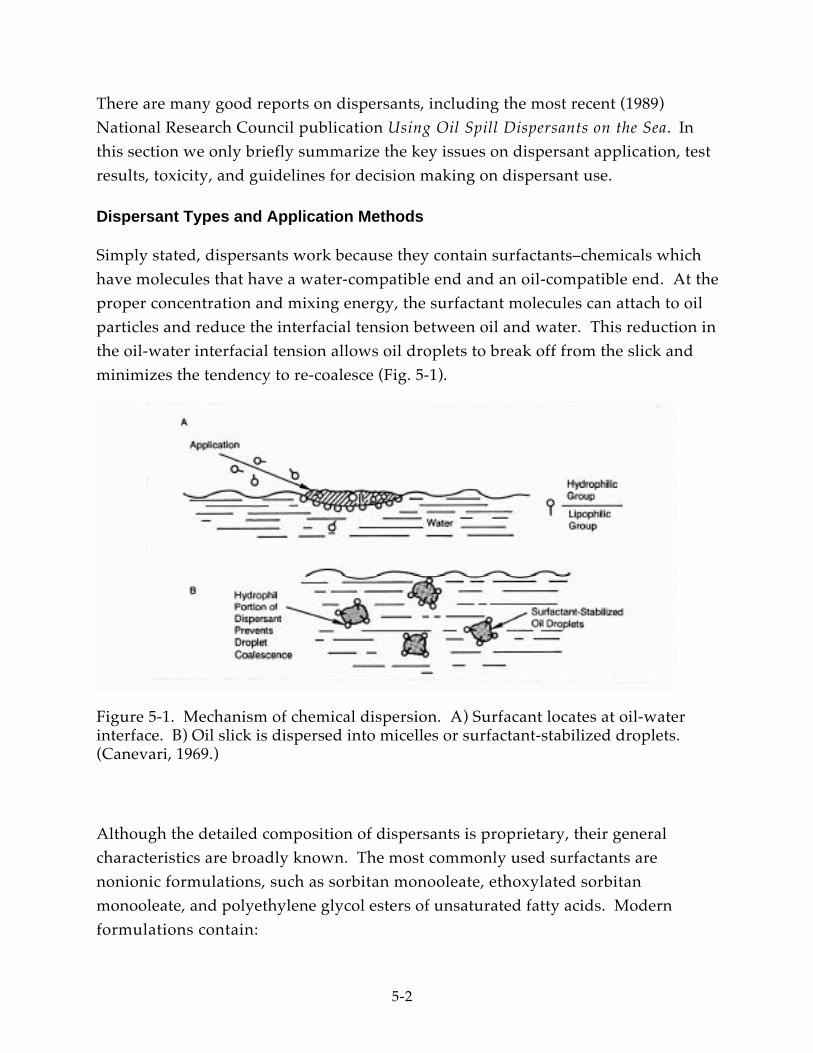
Simply stated, dispersants work because they contain surfactants–chemicals which
have molecules that have a water-compatible end and an oil-compatible end. At the
proper concentration and mixing energy, the surfactant molecules can attach to oil
particles and reduce the interfacial tension between oil and water. This reduction in
the oil-water interfacial tension allows oil droplets to break off from the slick and
minimizes the tendency to re-coalesce (Fig. 5-1).
Figure 5-1. Mechanism of chemical dispersion. A) Surfacant locates at oil-waterinterface. B) Oil slick is dispersed into micelles or surfactant-stabilized droplets.(Canevari, 1969.)
Although the detailed composition of dispersants is proprietary, their general
characteristics are broadly known. The most commonly used surfactants are
nonionic formulations, such as sorbitan monooleate, ethoxylated sorbitan
monooleate, and polyethylene glycol esters of unsaturated fatty acids. Modern
formulations contain:
5-2
• 15-75 percent of one or more nonionic surfactants• 5-25 percent anionic surfactant• Solvent of either:
-water-water-miscible hydroxy compounds-hydrocarbons
Dispersants are applied either "neat" or diluted. The standard dosage is a
dispersant:oil ratio of 1:20. Assuming an average slick thickness of 0.1 mm, this
dosage would require five gallons per acre of dispersant. However, it should be
noted that nonuniformity of the slick is a very real problem in dispersant
applications. In the U.S., the effort has been to have a range of aircraft available for
spraying dispersants on short notice, and there has been considerable research on
optimization of droplet size and the equipment needed to produce the droplets.
NRC (1989) lists four criteria for effective dispersal of oil:
1) The dispersant must reach the slick, which can be a major problem ifstrong winds blow the droplets away from the slick, or visibility limits theability to accurately position the aircraft over the slick during application.
2) The dispersant must mix with the oil or move to the oil-water interface.This is where droplet size becomes important; too large droplets pass rightthrough the slick and too small droplets stay on the oil surface or blowaway.
3) The dispersant must reach the proper concentration at the interface, sothat a maximum reduction in the interfacial tension is reached. Note thatdosage is never uniform or well-known because of nonuniformity in theslick thickness.
4) The oil must disperse into droplets. Therefore, some minimum energy isneeded for dispersants to work.
These logistical factors are obviously difficult to overcome. An added problem is
that dispersant efficiency testing shows that many dispersants are not very effective,
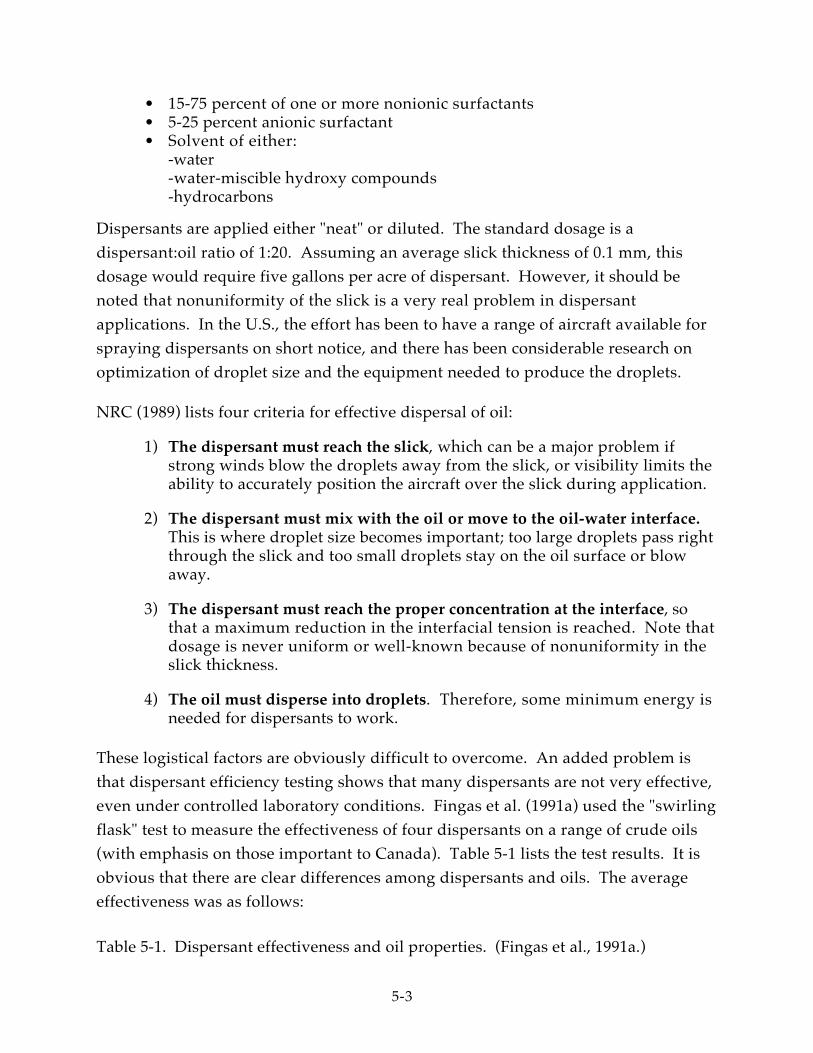
even under controlled laboratory conditions. Fingas et al. (1991a) used the "swirling
flask" test to measure the effectiveness of four dispersants on a range of crude oils
(with emphasis on those important to Canada). Table 5-1 lists the test results. It is
obvious that there are clear differences among dispersants and oils. The average
effectiveness was as follows:
Table 5-1. Dispersant effectiveness and oil properties. (Fingas et al., 1991a.)
5-3
• Heavy crude oils 1 percent• Medium crude oils 10 percent• Light crude oils 30 percent• Very light crude oils 90 percent• Weathered oils Always lower than fresh
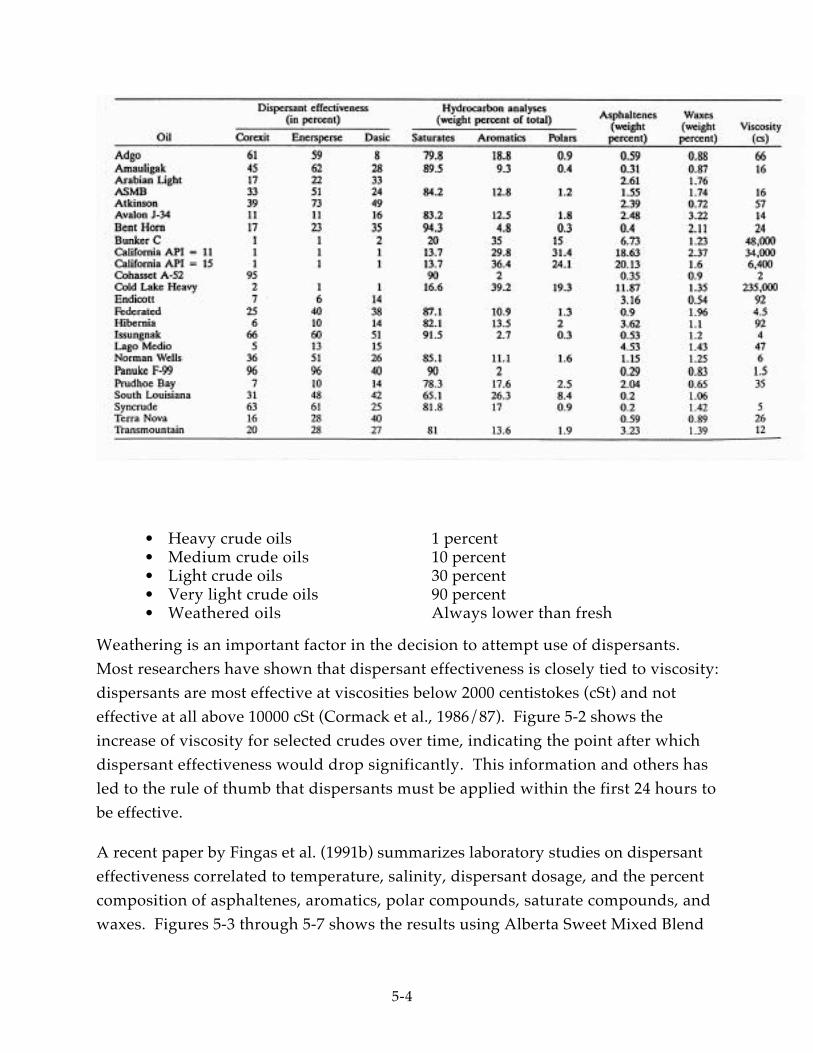
Weathering is an important factor in the decision to attempt use of dispersants.
Most researchers have shown that dispersant effectiveness is closely tied to viscosity:
dispersants are most effective at viscosities below 2000 centistokes (cSt) and not
effective at all above 10000 cSt (Cormack et al., 1986/87). Figure 5-2 shows the
increase of viscosity for selected crudes over time, indicating the point after which
dispersant effectiveness would drop significantly. This information and others has
led to the rule of thumb that dispersants must be applied within the first 24 hours to
be effective.
A recent paper by Fingas et al. (1991b) summarizes laboratory studies on dispersant
effectiveness correlated to temperature, salinity, dispersant dosage, and the percent
composition of asphaltenes, aromatics, polar compounds, saturate compounds, and
waxes. Figures 5-3 through 5-7 shows the results using Alberta Sweet Mixed Blend
5-4
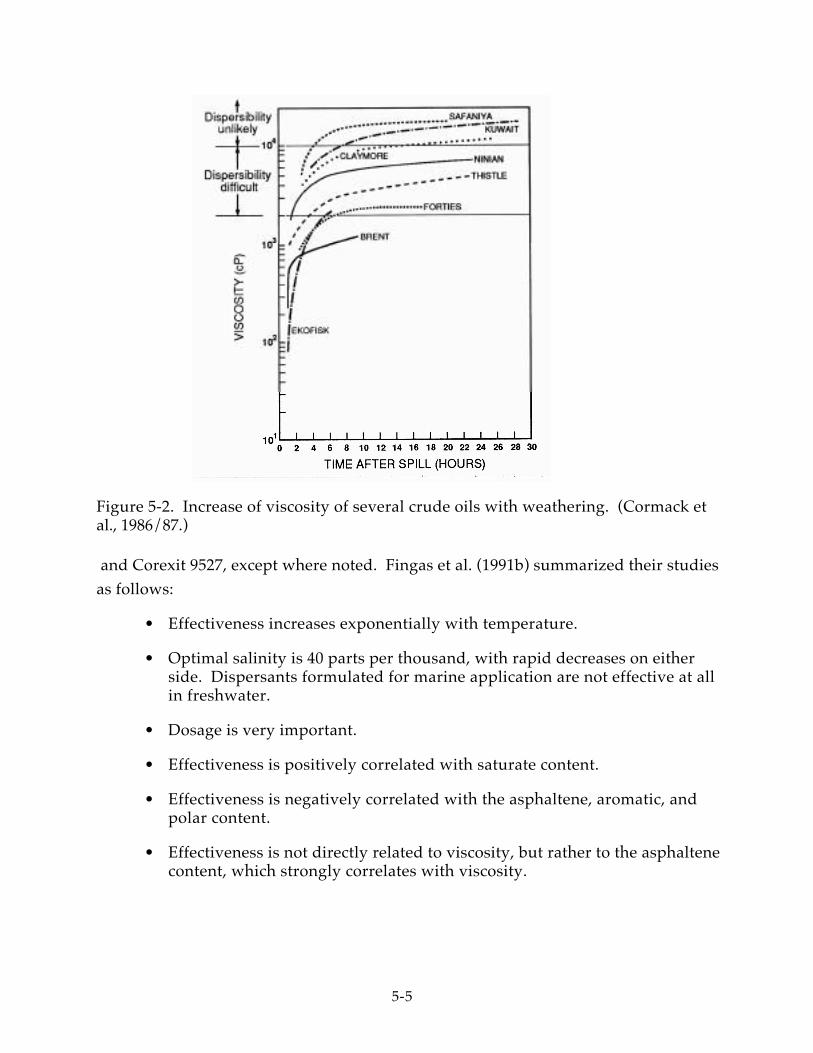
Figure 5-2. Increase of viscosity of several crude oils with weathering. (Cormack etal., 1986/87.)
and Corexit 9527, except where noted. Fingas et al. (1991b) summarized their studies
as follows:
• Effectiveness increases exponentially with temperature.
• Optimal salinity is 40 parts per thousand, with rapid decreases on eitherside. Dispersants formulated for marine application are not effective at allin freshwater.
• Dosage is very important.
• Effectiveness is positively correlated with saturate content.
• Effectiveness is negatively correlated with the asphaltene, aromatic, andpolar content.
• Effectiveness is not directly related to viscosity, but rather to the asphaltenecontent, which strongly correlates with viscosity.
5-5
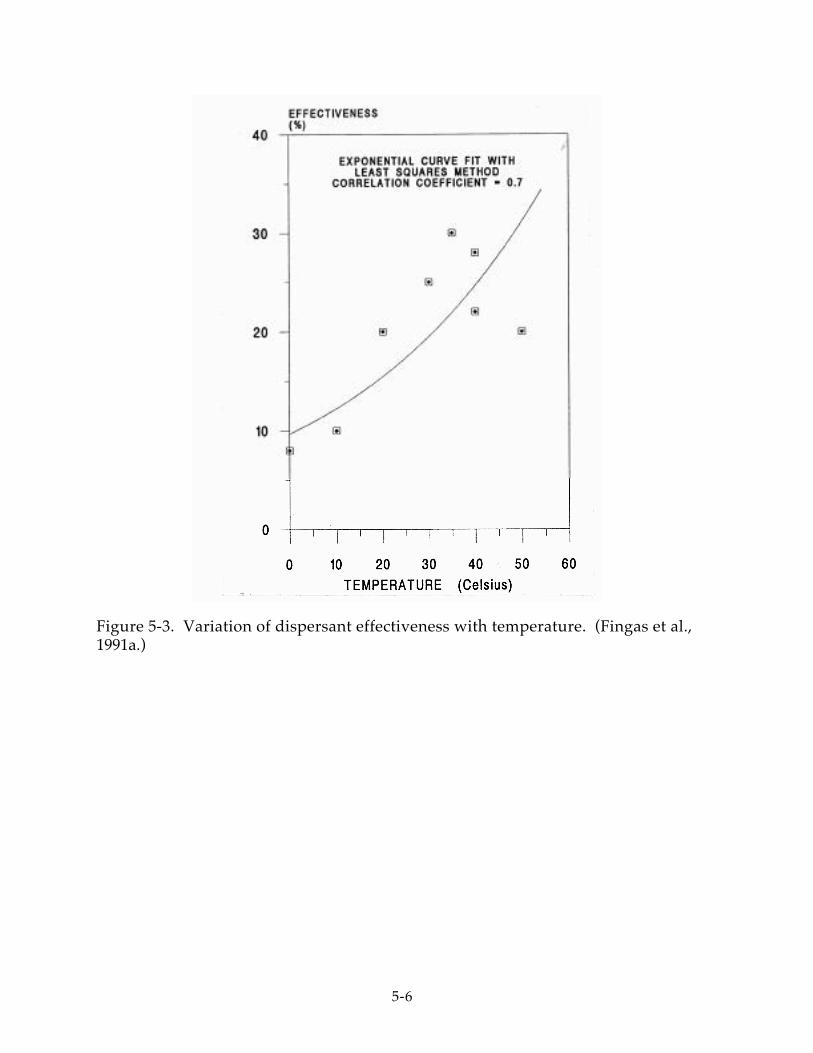
Figure 5-3. Variation of dispersant effectiveness with temperature. (Fingas et al.,1991a.)
5-6
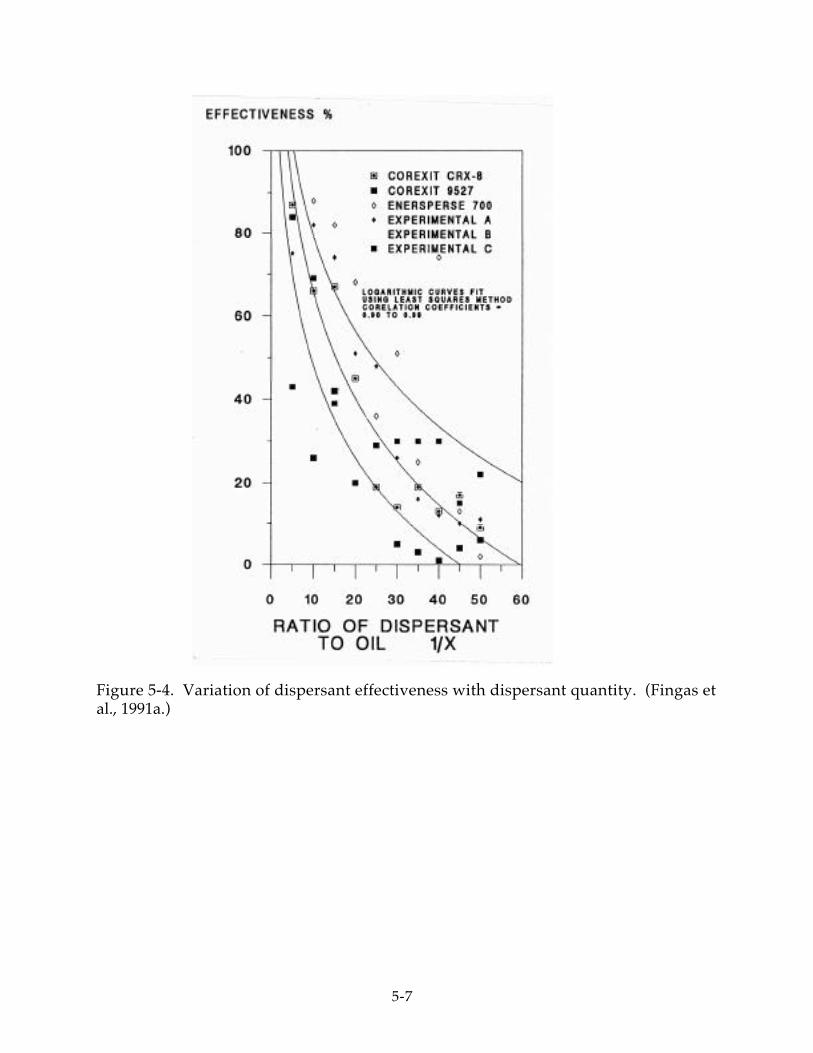
Figure 5-4. Variation of dispersant effectiveness with dispersant quantity. (Fingas etal., 1991a.)
5-7
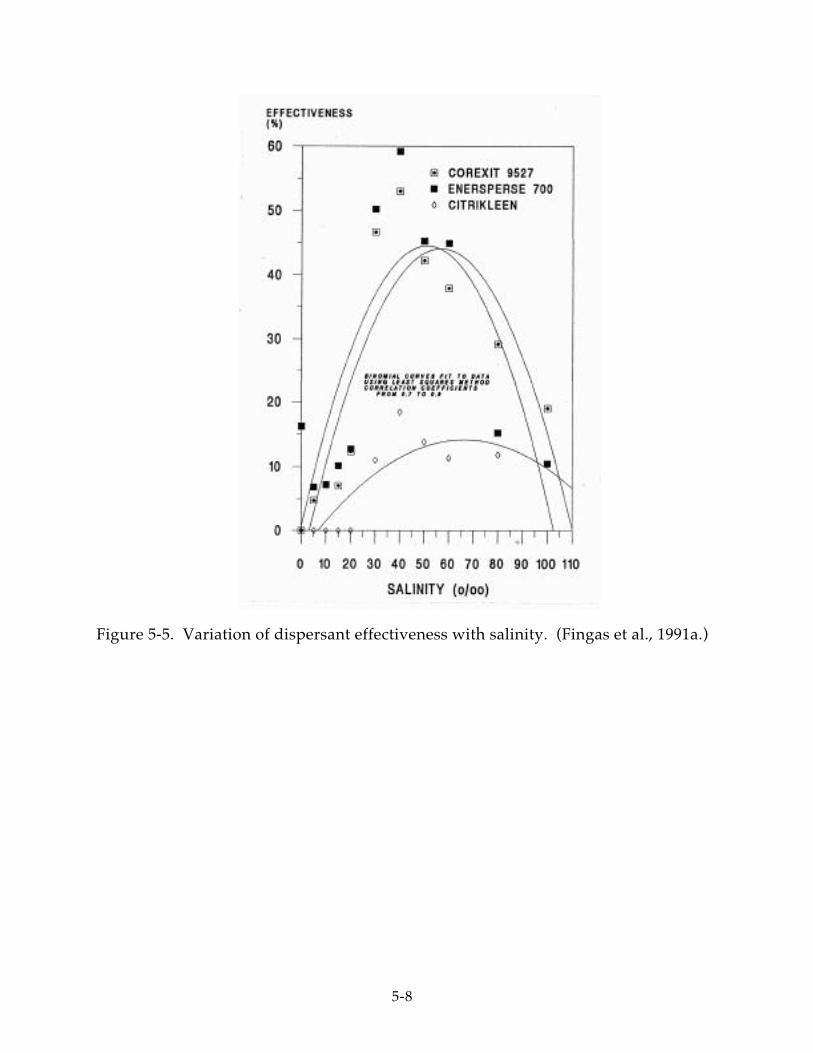
Figure 5-5. Variation of dispersant effectiveness with salinity. (Fingas et al., 1991a.)
5-8
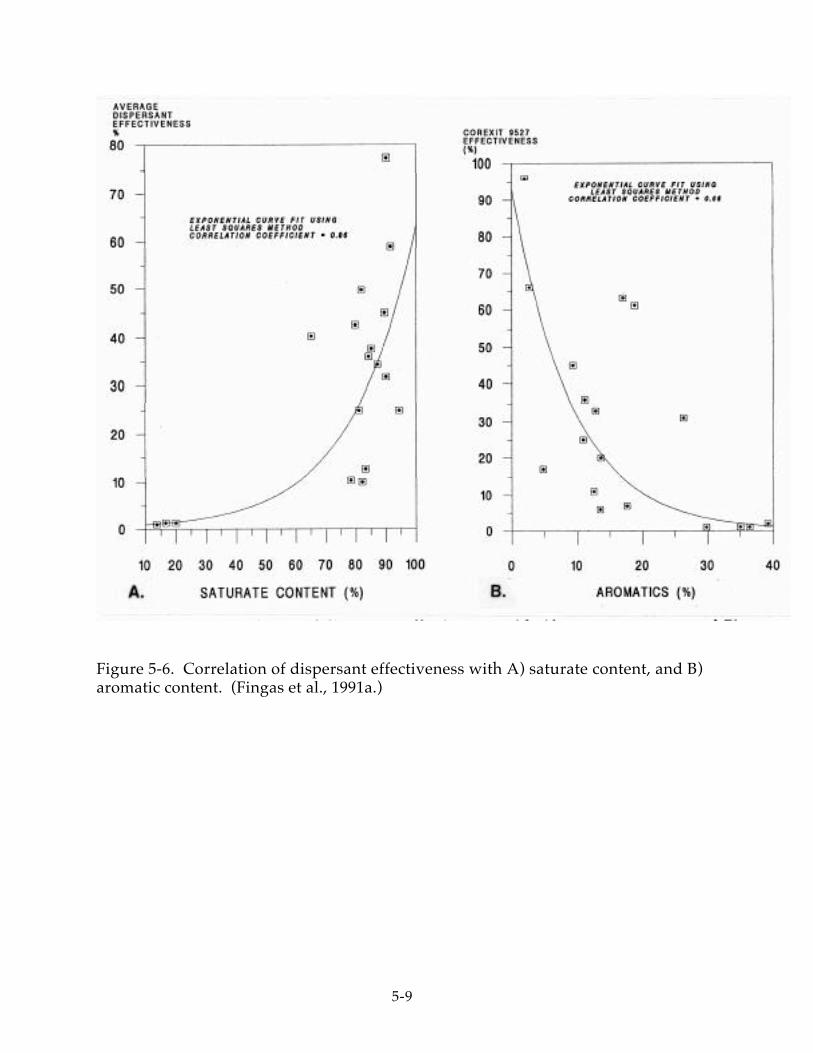
Figure 5-6. Correlation of dispersant effectiveness with A) saturate content, and B)aromatic content. (Fingas et al., 1991a.)
5-9
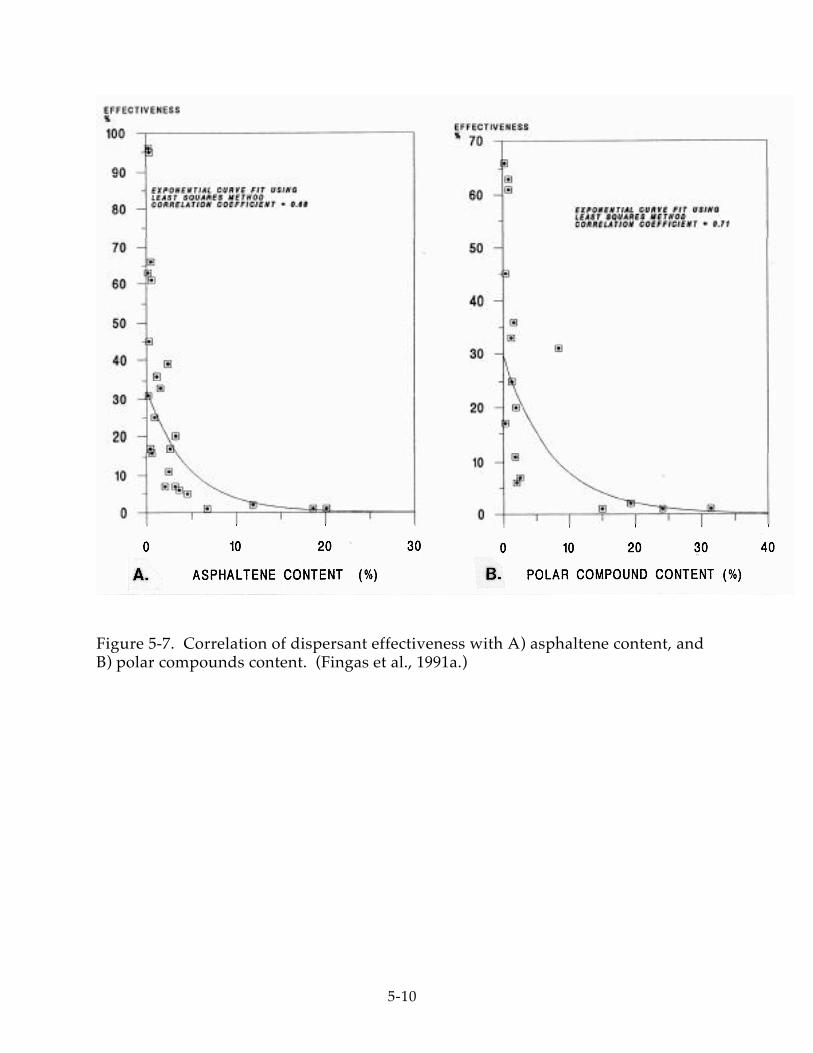
Figure 5-7. Correlation of dispersant effectiveness with A) asphaltene content, andB) polar compounds content. (Fingas et al., 1991a.)
5-10
Review of Dispersant Tests
Field test results have been highly varied. Fingas et al. (1991a) report that there have
been 107 test spills for determining dispersant effectiveness in the last 12 years.
Results were reported as an estimate of the effectiveness percentage for only 25
spills. The average effectiveness was 30 percent, with values ranging from 0 to 100
percent. Most of the time, effectiveness was determined by measurement of the
concentrations of oil in the water column below dispersed slicks. Surface slick
dimensions were used to calculate the amount of dispersed oil. Fingas et al. (1991a)
argues that this approach is invalid because surface slicks have little positional
relationship to the underwater dispersed plume.
Open-ocean field trials are the best indication of dispersant effectiveness and the
likely concentrations of oil in the water column over time and with depth. Water-
column concentrations are particularly important in the assessment of impacts to
organisms. The best-documented field trials in the U.S. were sponsored by API, at
locations off New Jersey in 1978 and California in 1979, reported in McAuliffe et al.
(1981). Figure 5-9 shows the California test results for Prudhoe Bay crude oil sprayed
with Corexit 9527 from aircraft immediately after release. Within 30 minutes, the
highest concentrations of dispersed oil in the water column averaged 41 ppm at 1
meter and 10 ppm at 3 m (Fig. 5-7a). Nearly 40 percent of the oil was dispersed into
the top 2 m. After one hour, downward mixing of the dispersed plume was evident
(Fig. 5-7b), with 31 percent of the oil in the top 2 m, 24 percent at 2-4 m, and 29
percent at 4-7.5 m. After three hours, maximum concentrations of 1-2 ppm were
recorded through 6 m and 0.5 ppm at 9 m. Other field trials in the North Sea,
Canada, and France have shown similar results (summarized in NRC, 1989, Table 4-
3), with maximum concentrations of 1 to 100 ppm in the top meter.
These field results are are not very different than the model calculations of Mackay
and Wells (1983), which predict a maximum concentration of 1 ppm at 10 m depth
(Fig. 5-8). The general rule that dispersants should not be used in water depths less
than 10 m is derived from the assumption that 1 ppm is a threshold for acute
toxicity above which impacts to benthic organisms might occur.
5-11
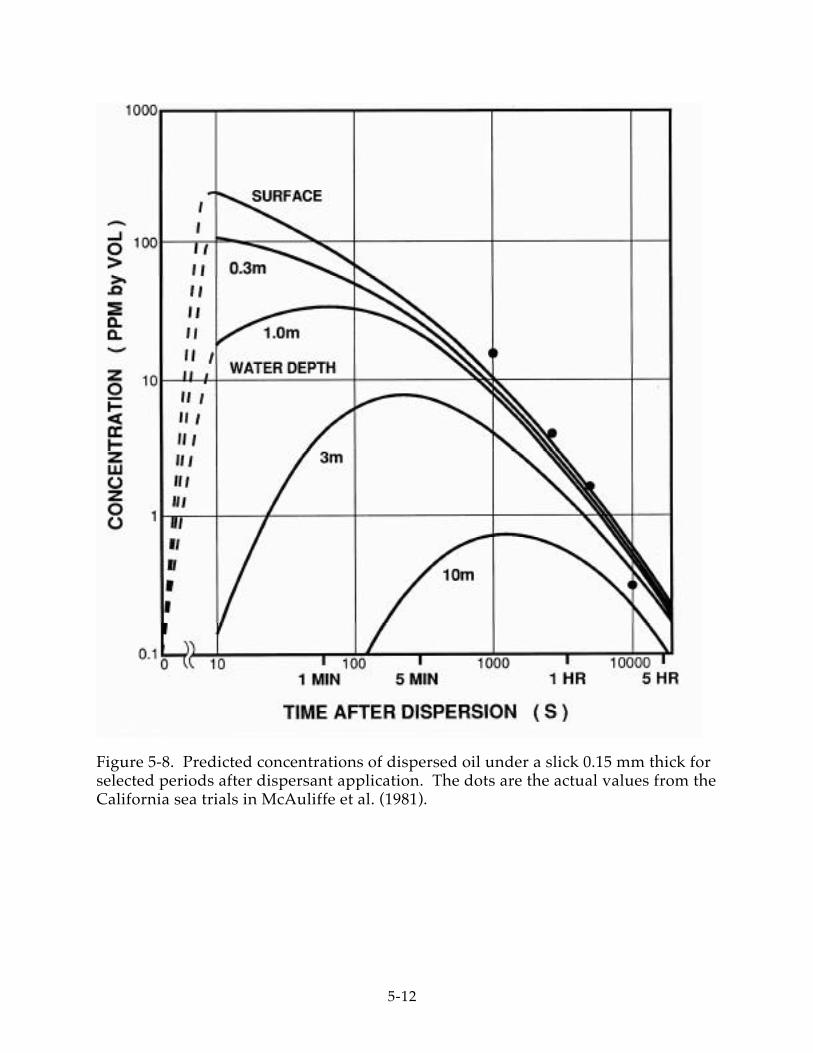
Figure 5-8. Predicted concentrations of dispersed oil under a slick 0.15 mm thick forselected periods after dispersant application. The dots are the actual values from theCalifornia sea trials in McAuliffe et al. (1981).
5-12
Monitoring of Dispersant Applications
There have been very few spills in the U.S. where approval was granted for use of
dispersants in combatting the spill. Typical of emergency conditions was the spill
associated with the fire and breakup of the Puerto Rican in 1984 off the Farallon
Islands. Nearly 2,000 gallons of Corexit 9527 were applied to the slicks three days
after the initial incident. Weather prevented implementation of the water-column
monitoring program originally required, thus effectiveness was measured by visual
observation. But, observers were not able to reach consensus on how much oil was
dispersed, though most estimates ranged from 0 to 30 percent.
It is obvious that we will never resolve the issue of whether dispersants work and
what are the impacts to water-column organisms compared to undispersed slicks
without high-quality field monitoring plans. But, how are we to be prepared for
such a monitoring program under emergency conditions when quick approval to
proceed is being sought to optimize effectiveness? The only solution is having a
detailed, yet flexible plan, trained people, and a lot of luck. NOAA has been
involved in two "spills of opportunity" where they tested various dispersant
monitoring strategies: the Pac Baroness off California in 1987 and the Mega Borg off
Galveston, Texas in 1990. These monitoring results are summarized in Payne et al.
(1991a; b). Lessons learned from these two spills include:
• There must be good communications among the various aircraft and boatsinvolved in direction, observation, and sampling.
• A very detailed plan must be developed, in advance, with the roles andresponsibilities of each group spelled out.
• Both videotape and 35 mm photography should be used fordocumentation. The video camera should be mounted on the nose of theobservation helicopter and a remote used to direct it. Whenever possible,a surface vessel or other feature should be kept in the field of view forreference and scale.
• If water-column sampling is required, continuous flow fluorometers areuseful but samples are needed for confirmation of dispersed oilconcentrations.
• For large applications, SLAR and IR/UV remote sensing are goodtechniques for monitoring the slicks.
5-13
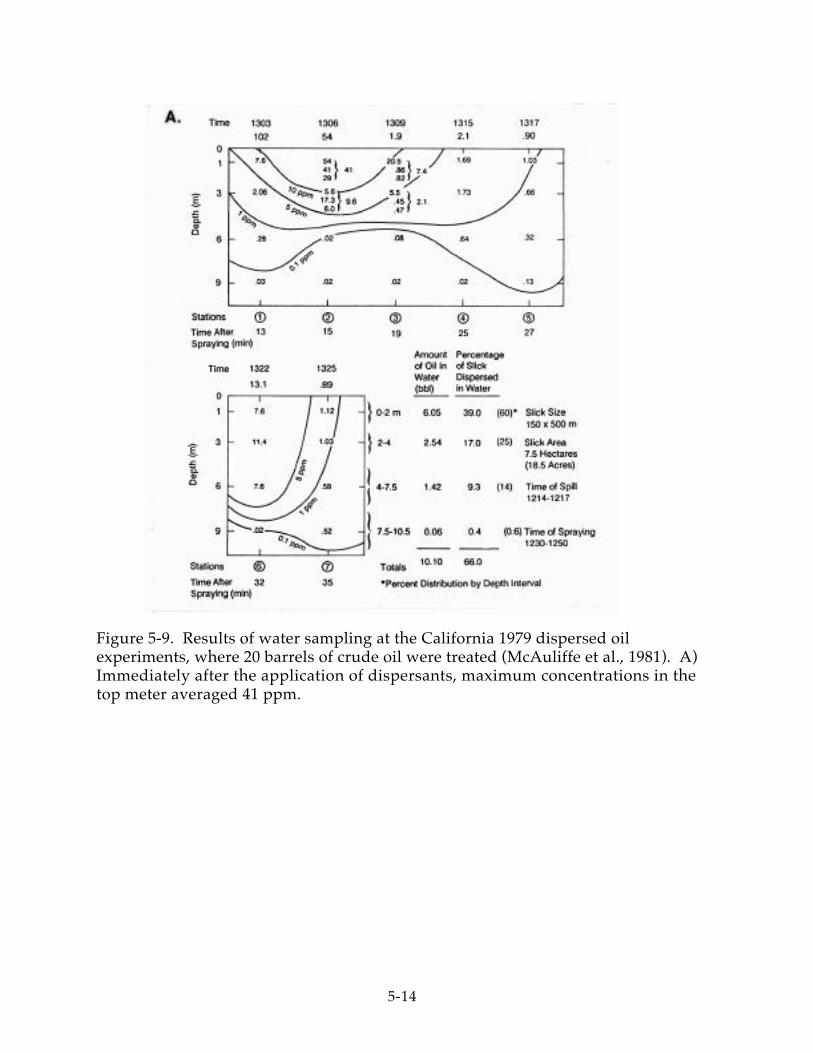
Figure 5-9. Results of water sampling at the California 1979 dispersed oilexperiments, where 20 barrels of crude oil were treated (McAuliffe et al., 1981). A)Immediately after the application of dispersants, maximum concentrations in thetop meter averaged 41 ppm.
5-14
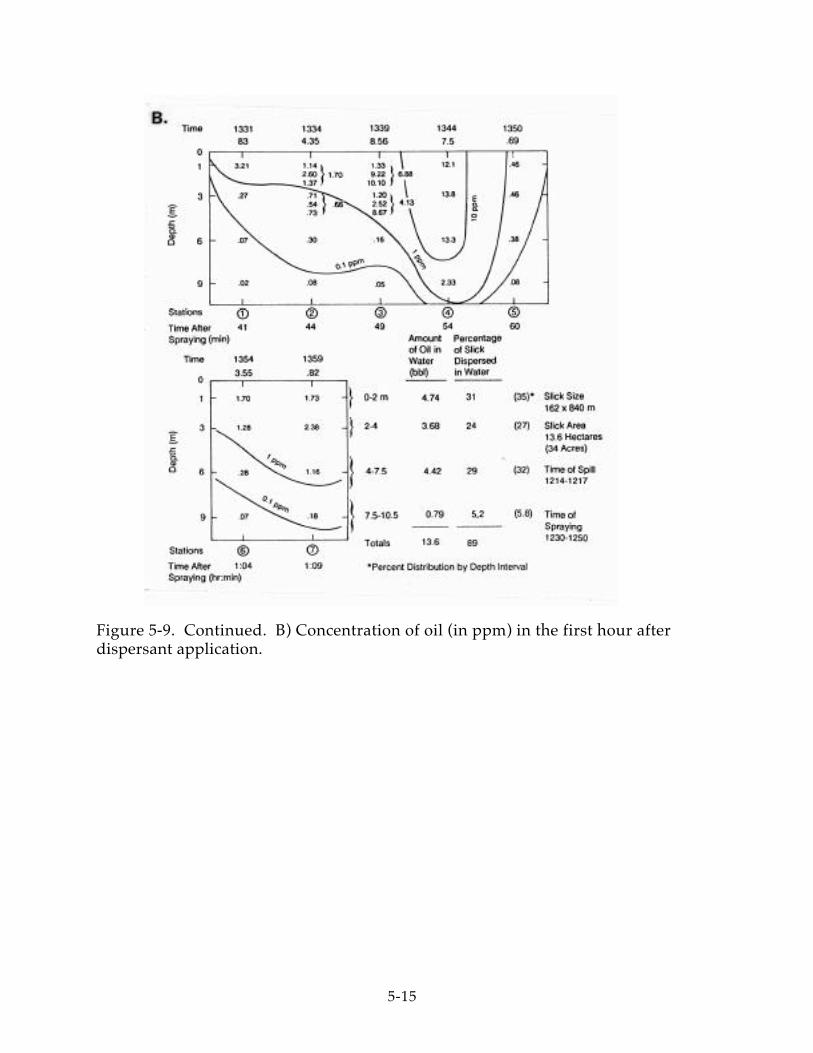
Figure 5-9. Continued. B) Concentration of oil (in ppm) in the first hour afterdispersant application.
5-15
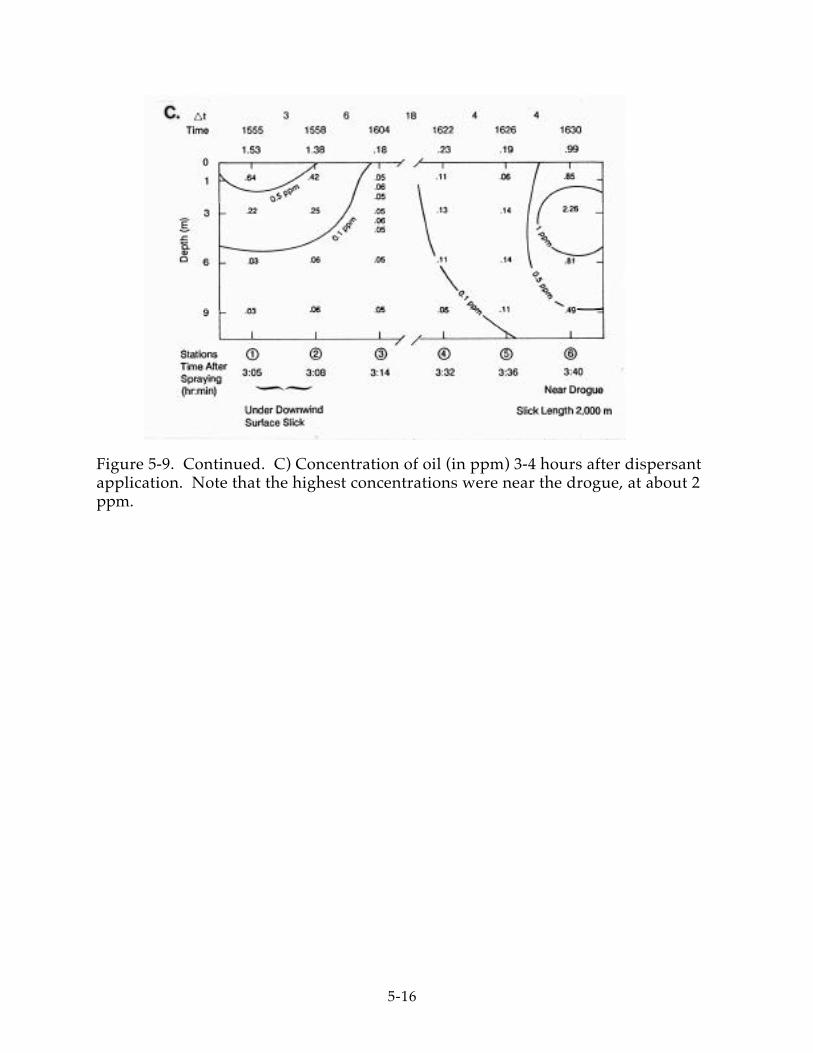
Figure 5-9. Continued. C) Concentration of oil (in ppm) 3-4 hours after dispersantapplication. Note that the highest concentrations were near the drogue, at about 2ppm.
5-16
Many groups question whether a monitoring program can, in reality, include a
water-column sampling component. Only under the best of conditions is it likely
that a comprehensive and well-conducted water sampling program will be possible.
In the two recent spill of opportunity dispersant monitoring programs, the spills
were on-going, with a continual release of fresh oil. In the NOAA studies, the
monitoring groups had 1-3 days to prepare, and the results were still less than
optimal. Anyone can imagine what it would be like to get a water sampling
program off “at first light” after finally getting approval to use dispersants that
evening! It might be better to concentrate on training and logistics for high-quality
visual and photographic observations.
Toxicity of oil spill dispersants
IntroductionIn 1967, the tanker Torrey Canyon spilled nearly 1 million bbl of crude oil into the
waters off the coast of England. In the two weeks that followed, approximately
10,000 bbl of chemical dispersants were sprayed on the impacted waters and
shoreline in an attempt to remove the spilled oil. The biological results of this
application bordered on the disastrous, and were highly visible. On rocky
shorelines, mortality to intertidal organisms was clearly evident; molluscs such as
limpets, snails, barnacles, and mussels were particularly hard hit. Subsequent
toxicity evaluations of the most widely used product showed that the concentration
necessary to kill half of populations of subtidal test organisms in 24 hours (LC50)
ranged between 0.5 to 5.0 ppm. LC50 values for intertidal organisms ranged between
5.0 ppm and 100 ppm. The concentrations at which the dispersants were toxic to all
organisms were much lower than the concentrations required to disperse the
stranded oil (1:2-4, dispersant:oil), and very much lower than actual application
amounts (10,000 tons of dispersants to 14,000 tons of stranded oil) (Southward and
Southward 1978).
In this instance, ecological impact clearly took a back seat to the mandate to remove
the spilled product. Priorities were esthetic, not ecological (National Research
Council 1989). However, the consequences of this treatment philosophy were long-
term, and Southward and Southward noted that ten years after the Torrey Canyon
incident, heavily oiled locations that had received
5-17
repeated applications of the dispersants had apparently not recovered to a state
comparable to lightly oiled, lightly dispersed areas.
The National Research Council (1989), in recounting the sequence of events, noted:
. . .adverse publicity during and after the Torrey Canyon incident gave dispersants a badreputation. Indeed, the experience led to a very cautious attitude toward dispersant use amongseveral industrialized nations.
In the 25 years since the Torrey Canyon, a number of changes have taken place to
improve the perceptions about dispersants. Nevertheless, dispersant use as a spill
response technique has been employed relatively sparingly, with mostly
inconclusive results, in the intervening years. The National Research Council cited
only only six examples in which dispersants were used operationally in spill
response between the Torrey Canyon incident and 1989. The Exxon Valdez in
1989,Mega Borg in 1990, and theVesta Bella barge sinking in the Caribbean in 1991
involved the use of dispersants, also with mixed results.
The most significant change affecting the acceptability of dispersant use is associated
with the dispersants themselves: older dispersant formulations were essentially
industrial degreasing agents, identical or similar to those used for cleaning engine
rooms and bilges. These contained a number of toxic hydrocarbon-based
constituents, such as kerosene, mineral spirits, and naphtha. So-called "second
generation" oil dispersants have much different formulations, with less toxic
ingredients such as alcohols, glycols, and glycol ethers (Fingas et al. 1979). One of the
most common and widely stockpiled of the newer dispersants is Corexit 9527,
manufactured by Exxon. It is a mixture of non-ionic (48%) and anionic (35%)
surfactants in a hydrocarbon solvent (17%). The surfactant formulation includes
ethoxylated sorbitan mono- and trioleates, sorbitan monooleate and sodium dioctyl
sulfosuccinate. Solvents in Corexit 9527 are ethylene glycol monobutyl ether and
water (Singer et al. 1990).
Acute toxicity of newer dispersants appears to be considerably less than the older,
Torrey Canyon-zera products; Fingas et al. (1979) noted about a 30-fold difference in
96 hr. tests with rainbow trout. The National Research Council, in its recent review,
concluded that toxic effects of dispersants are generally less
5-18
than crude oils and refined products. However, exposure to second generation
dispersants has also been demonstrated to result in adverse effects on marine
organisms, and it is important to factor toxicological implications of dispersant use
into the decision matrix for oil spill response.
General dispersant toxicity considerationsThe explicit consideration of toxicological effects resulting from dispersant use is not
a straightforward task. It can, in fact, be quite confusing and confounding to the
decision-making process. The bottom line of toxicity to an ecosystem or a specific
living resource in question is very much a function of at least five components: the
dispersant, the oil being dispersed, the nature of exposure (i.e., concentration and
length), the organism in question, and the life stage of the organism in question.
The combination of these factors, as well as others that may be relevant in specific
situations, will determine the ultimate impact on the resources.
Beyond consideration of the toxicity of dispersants alone, the toxicity of dispersed oil
that would be expected to result from an application also should be factored into the
ecological assessment. The National Research Council concluded that acute toxicity
of dispersed oil was generally attributable to the oil fraction rather than the
dispersant fraction. Assuming that dispersed and untreated oil invoke the same
level of toxicity, the shift in the nature of exposure becomes an important
determinant of effect. That is, are potential toxic impacts being shifted from surface
waters to the water column?
The concept of LC50 has been discussed previously in other sections. Briefly, it
involves the exposure of a population of test organisms to a constant concentration
of a compound for a specific period of time, usually 24-, 48- or 96-hours. By
extrapolating the toxicity obtained from a number of different concentrations, the
exposure level at which half the test organisms die is obtained. Anderson et al.
(1984) noted that this method, while straightforward in concept, has a number of
shortcomings, particularly with respect to assessment of petroleum compounds:
(LC50 ) tests were usually conducted in closed ("static") systems without feeding test organismsor replenishing the toxicants. As more chemical analyses were conducted, investigators began torealize that significant amounts of many toxicants sorbed to the walls of vessels, evaporated,and were taken up by organisms. In tests with petroleum, there were also problems withdroplets moving to the surface (forming slicks) and numerous alterations related to differentspecific components.
5-19
Many of the LC50 tests performed and reported in the literature have been based on
the nominal concentrations of dispersant and/or dispersed oil, and not those
actually measured in the water to which organisms were exposed (nominal
concentrations are those based on the volume mixtures of contaminants and not the
concentrations in the water). This can be a fundamental source of error in
estimating exposure concentrations, due to the tendencies of hydrocarbons either to
adhere to test equipment, as well as the difficulties in getting largely hydrophobic
("water-hating") compounds to dissolve in test waters.
In order to address some of the inadequacies of classical LC50 toxicity testing and to
provide a basis for comparing results from many studies using different exposure
times or concentrations, Anderson et al. (1984) demonstrated the concept of the
toxicity index. The toxicity index considers exposure duration and toxicant
concentration to be equal factors in toxicity. The index is expressed as the product of
the two, with values reported in ppm days or ppm hours. Under the assumptions of
this approach, a two-day exposure to 10 ppm of a contaminant (yielding a toxicity
index value of 20 ppm day) should produce the same toxic effect as a five-day
exposure to 4 ppm, or a ten-day exposure to 2 ppm.
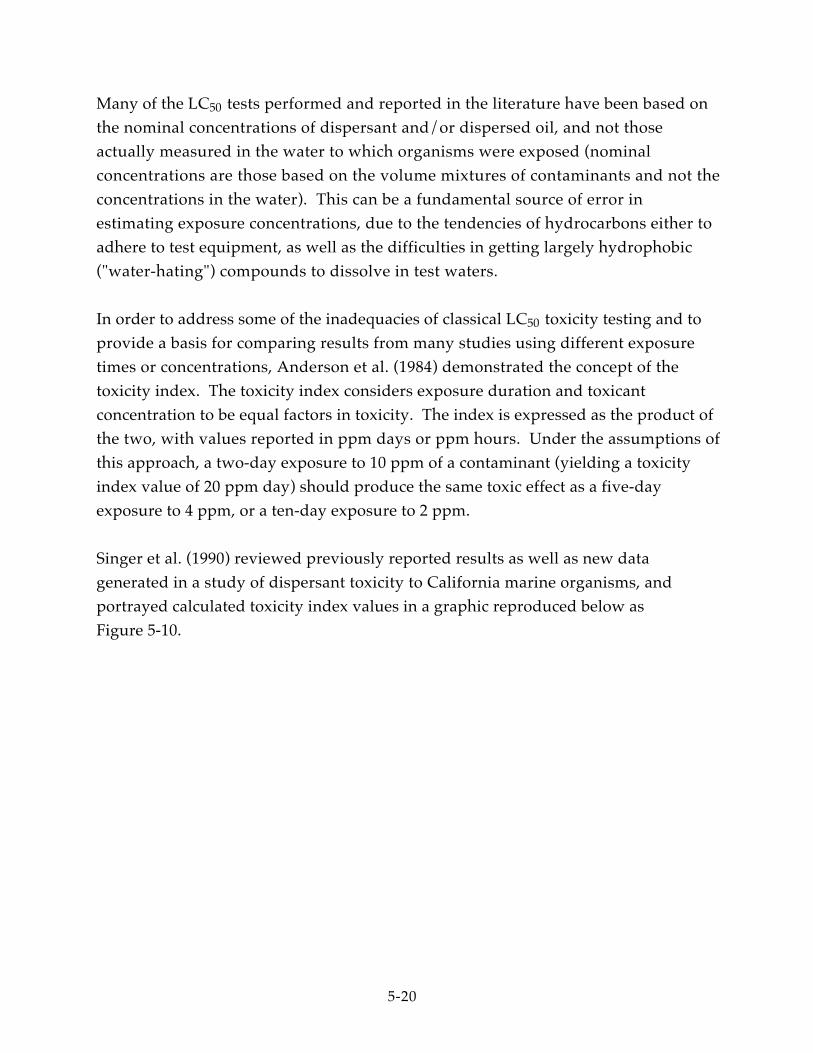
Singer et al. (1990) reviewed previously reported results as well as new data
generated in a study of dispersant toxicity to California marine organisms, and
portrayed calculated toxicity index values in a graphic reproduced below as
Figure 5-10.
5-20
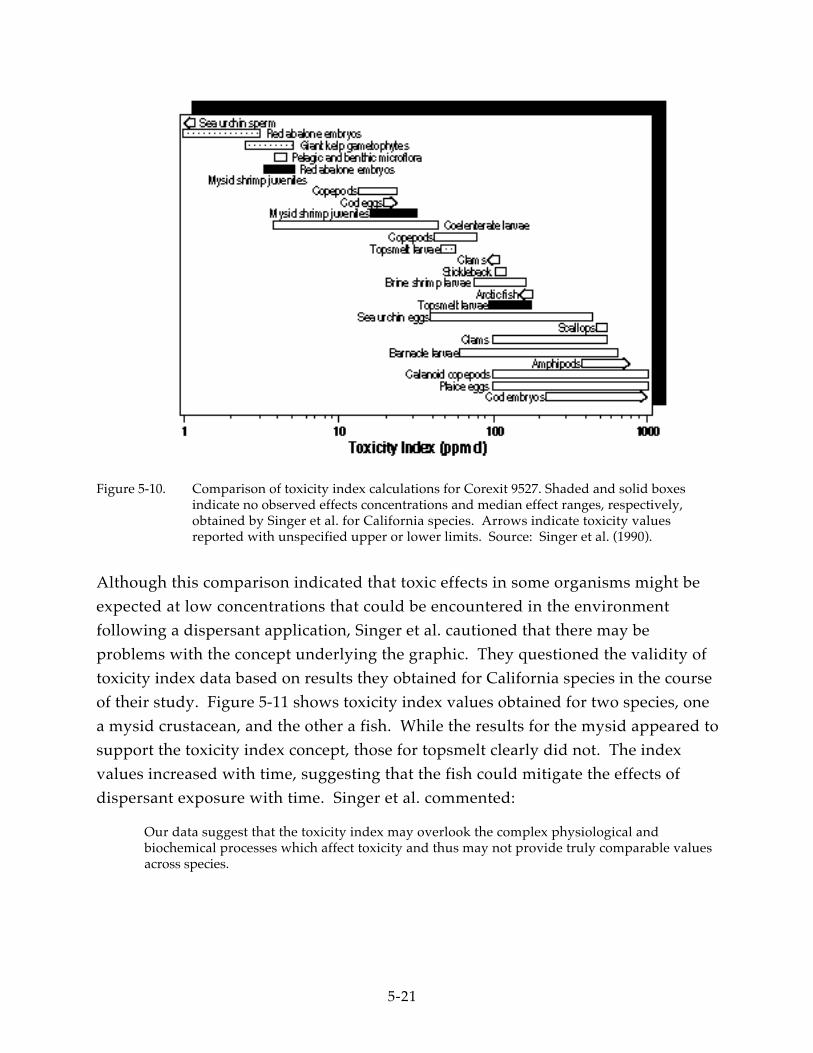
Figure 5-10. Comparison of toxicity index calculations for Corexit 9527. Shaded and solid boxesindicate no observed effects concentrations and median effect ranges, respectively,obtained by Singer et al. for California species. Arrows indicate toxicity valuesreported with unspecified upper or lower limits. Source: Singer et al. (1990).
Although this comparison indicated that toxic effects in some organisms might be
expected at low concentrations that could be encountered in the environment
following a dispersant application, Singer et al. cautioned that there may be
problems with the concept underlying the graphic. They questioned the validity of
toxicity index data based on results they obtained for California species in the course
of their study. Figure 5-11 shows toxicity index values obtained for two species, one
a mysid crustacean, and the other a fish. While the results for the mysid appeared to
support the toxicity index concept, those for topsmelt clearly did not. The index
values increased with time, suggesting that the fish could mitigate the effects of
dispersant exposure with time. Singer et al. commented:
Our data suggest that the toxicity index may overlook the complex physiological andbiochemical processes which affect toxicity and thus may not provide truly comparable valuesacross species.
5-21
Figure 5-11. Comparison of daily toxicity index values for two California species, one a mysid andthe other a fish. Source: Singer et al. (1990).
The methods employed by Singer and his colleagues in the state of California
attempted to address many of the inadequacies of other techniques. Nevertheless,
while no laboratory evaluation will be perfect in its simulation of true
environmental conditions, useful insights may be obtained from studies employing
older methods that have since been found to be biased. Results from a number of
different types of toxicity studies, including those employing "classical" methods of
assessing acute toxicity, will be presented in this chapter; it is important to remember
limitations and shortfalls of these approaches. It would appear that more recent
investigations, particularly in the state of California, may give a more accurate
picture of dispersant toxicities that might be expected under realistic conditions of
exposure. Results from the latter investigations will also be discussed later in this
section.
A review by Wells (1984) consolidated a large amount of dispersant toxicity
information available at the time. In his paper, Wells focused on the toxicity of
Corexit 9527, although information for other formulations is included as well.
Wells summarized threshold effect concentrations from the review of results for
organisms ranging from protozoans to birds (Table 5-2).
5-22
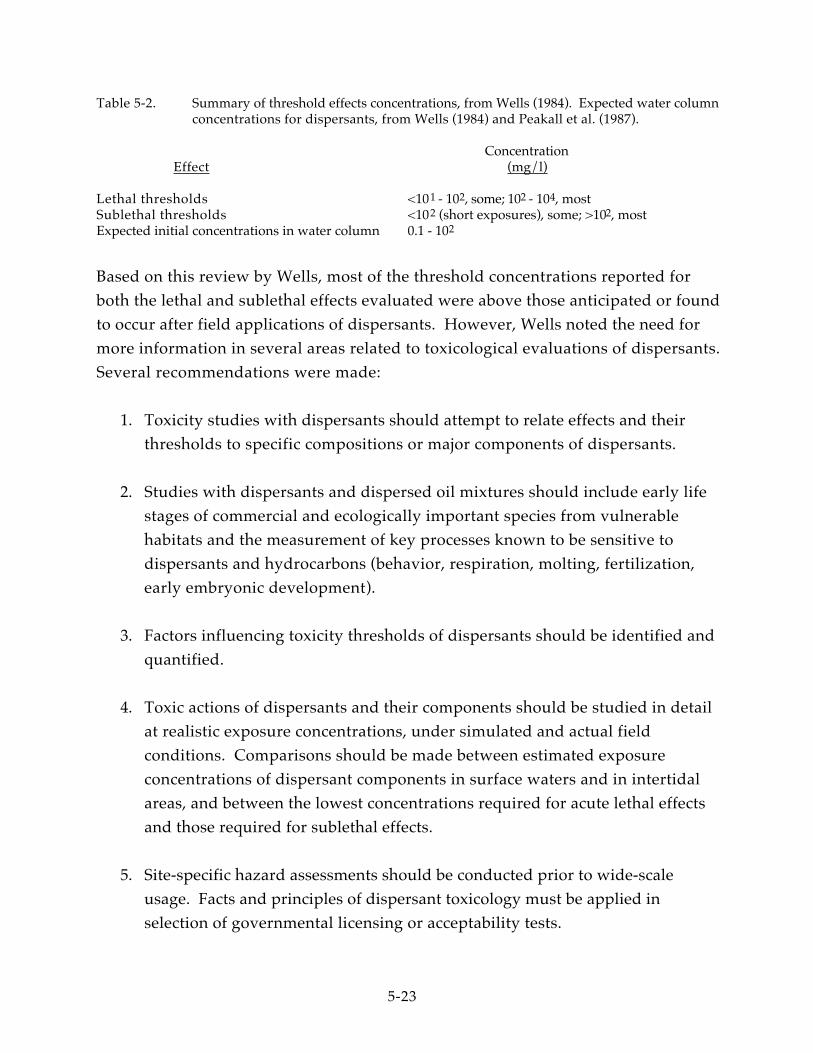
Table 5-2. Summary of threshold effects concentrations, from Wells (1984). Expected water columnconcentrations for dispersants, from Wells (1984) and Peakall et al. (1987).
ConcentrationEffect (mg/l)
Lethal thresholds <101 - 102, some; 102 - 104, mostSublethal thresholds <102 (short exposures), some; >102, mostExpected initial concentrations in water column 0.1 - 102
Based on this review by Wells, most of the threshold concentrations reported for
both the lethal and sublethal effects evaluated were above those anticipated or found
to occur after field applications of dispersants. However, Wells noted the need for
more information in several areas related to toxicological evaluations of dispersants.
Several recommendations were made:
1. Toxicity studies with dispersants should attempt to relate effects and their
thresholds to specific compositions or major components of dispersants.
2. Studies with dispersants and dispersed oil mixtures should include early life
stages of commercial and ecologically important species from vulnerable
habitats and the measurement of key processes known to be sensitive to
dispersants and hydrocarbons (behavior, respiration, molting, fertilization,
early embryonic development).
3. Factors influencing toxicity thresholds of dispersants should be identified and
quantified.
4. Toxic actions of dispersants and their components should be studied in detail
at realistic exposure concentrations, under simulated and actual field
conditions. Comparisons should be made between estimated exposure
concentrations of dispersant components in surface waters and in intertidal
areas, and between the lowest concentrations required for acute lethal effects
and those required for sublethal effects.
5. Site-specific hazard assessments should be conducted prior to wide-scale
usage. Facts and principles of dispersant toxicology must be applied in
selection of governmental licensing or acceptability tests.
5-23

Many of the difficulties inherent in evaluating the toxicological implications of oil
dispersant use were addressed in a study by Wu (1981). Wu investigated the
toxicities of a true oil dispersant (BP 1100X) and a surface active agent (Shell Herder)
on 18 marine species from different taxa, and found that toxicities depended very
much upon the species tested. The organisms tested included fish, tunicates,
urchins, starfish, barnacles, shrimp, bivalve molluscs, and gastropods. The oil used
was diesel oil at 1000 ppm concentration. Some species showed high sensitivities to
BP 1100X and low with Herder, while for others the opposite was true. Results are
summarized below in Table 5-3.
TABLE 5-3. Percentages of mortality for different species with treatment of BP 1100X and ShellHerder (1000 ppm dispersant/surfactant + 1000 ppm diesel oil). Source: Wu (1981).
Shell Herder BP1100X Significant/NonOrganism + diesel + diesel between treatmentsFish
Callionymus richardsonii 50.0 ± 14.1 40.0 ± 14.1 NSSiganus oramin 82.0 ± 21.9 3.0 ± 2.7 S
TunicateStyela plicata 4.0 ± 5.5 36.0 ± 11.4 S
UrchinsAnthocidaris crassispina 0 0 NSEchinodermata mathei 0 0 NSSalmacis bicolor 0 0 NS
StarfishArchaster typicus 0 0 NS
BarnacleBalanus amphitrite 0 0 NS
Mantis shrimpOratosquilla oratoria 40.0 ± 7.1 82.0 ± 8.3 S
BivalvesAnadara broughtonii 2.5 ± 3.5 1.5 ± 3.4 NSAnadara granosa 2.0 ± 4.5 0 NSBarbatia obliquata 2.0 ± 4.5 4.0 ± 5.5 NSPaphia undulata 46.0 ± 13.3 45.0 ± 12.7 NSPerna viridis 0 0 NSSeptifer bilocularis 0 0 NS
GastropodsBabylonia areolata 0 0 NSBabylonia formosae 0 0 NSNucella clavigera 0 0 NS
The table above shows the wide range of results obtained among the different
organisms. Toxicities were very much dependent on species and the product tested,
and Wu commented on the implications for evaluating toxicity of products such as
dispersants:
5-24
The large differences in susceptibility within a single animal group found in the present study. ..indicate that neither the absolute nor relative toxicity of an oil dispersant can be ascertainedby selecting one "representative" species. Due to the time and manpower involved, however, itmay be impractical to test each product against a large number of species in order to determineits toxicity. Even if this is possible, the criteria of passing and failing a dispersant/surfaceactive agent would be difficult to establish, since the product might be toxic to some of thespecies but not to the others.
. . .It seems logical, and more meaningful, from an environmental point of view, that toxicitytests should be performed on species which are ecologically important (e.g., "key species" of acommunity or population with a high energy flow value) in identified receiving environments,rather than on some animals which are easy to obtain and maintain in the laboratory.
Specific regional studies on a variety of organisms, as advocated by Wu, have been
undertaken by California researchers. Investigations of this type will hopefully
enable more realistic and applicable toxicity data to be factored into dispersant use
decisions. The California tests are summarized below.
Toxicity to California marine organismsSinger et al. (1990) examined the toxicity of constant low-level exposures of Corexit
9527 to sensitive life stages of four California marine organisms: giant kelp,
Macrocystis pyrifera; red abalone, Haliotis rufescens; mysid crustacean,
Holmesimysis costata; and topsmelt, Atherinops affinis. It was found that the
organisms had varying degrees of sensitivity to the dispersant. Juvenile red abalone
and the newly released zoospores of giant kelp were most sensitive, with no
observed effects concentrations (NOEC) in a range between 0.63 to <2.35 ppm. Larval
topsmelt were the least sensitive, with NOEC ranging between 12.3 and 14.2 ppm.
From an applied perspective, it should be remembered that in the above study, the
test organisms were continuously exposed over periods of time ranging from 24 to
96 hours. This is common for many studies of toxicity, but not necessarily realistic.
In an actual dispersant application scenario, exposures to organisms would be
expected to be transient and continuously declining as the dispersant and oil-
dispersant mixtures are themselves dissipated in three dimensions. Resultant
toxicities would be dependent upon concentration-time profiles. An article by
Peakall et al. (1987) included a summary of studies that have examined dispersant
and oil-dispersant concentrations under treated oil slicks. In these studies, total
initial hydrocarbon concentrations were found to range between 1-100 ppm.
However, it was recognized that many constituents of the dispersed oil which
rapidly dissolve and/or evaporate would decline to parts per billion—or lower—
levels within minutes or hours.
5-25
Tjeerdema et al. (1990) attempted to address some of the inadequacies of traditional
toxicity methodologies by conducting a study using the same materials and test
organisms as Singer et al. above, but exposing the biota to spiked concentrations of
Corexit 9527. In other words, an initial exposure concentration of dispersant was
continuously diluted, in order to simulate the situation organisms might be
expected to realistically encounter during a real application of dispersant.
Tjeerdema et al. found that the test organisms reacted differently, both qualitatively
and quantitatively, to spiked exposures than they did to constant concentrations.
Haliotis (red abalone) were most sensitive to the spiked exposure, as was the case in
the continuous concentration experiment. NOEC ranged between 5.3 and 8.4 ppm.
Macrocystis zoospores also reacted similarly in both exposures, with NOEC in the
spiked experiment between 12.2 and 16.4 ppm. The mysid Holmesimysis had NOEC
in the range of 8.4 to 20.5 ppm, and the topsmelt Atherinops between 31.0 and 89.8
ppm; however, in the latter two cases, the shape of the dose-response curve was
qualitatively different than in the constant exposure. That is, the relationship was
exponential in character, suggesting that a threshold for effects may exist. Below this
threshold, the animals may be able to survive and adapt to dispersant exposure, but
beyond, they are stressed beyond survivability even if the exposure is discontinued.
Mysids survived the initial spike relatively well, but showed a delayed mortality 72
to 96 hours after exposure. Topsmelt, on the other hand, showed a greater
susceptibility to the initial spike but those surviving the spike generally survived
the entire test period.
Tjeerdema et al. summarized the implications of their results:
Data from this study show that inferring toxicity of dispersants in actual use situations fromlaboratory collected, constant exposure data may lead to erroneous conclusions regardingenvironmental impacts. We have seen that traditional constant exposure data on a particularspecies may not give adequate insight into delayed mortality or increased sensitivity underrealistic exposures of that species. Also, while exposure tests are not perfect models of the "realworld", our data suggest that even very ephemeral exposure to dispersants at field-measuredconcentrations may be toxic to some marine larvae. Thus, on-scene coordinators must exerciseincreased caution and attention to specific conditions when evaluating dispersant use.
Investigations into the effects of dispersants and oil-dispersant mixtures are
summarized below in order to show the range of organisms that have been studied,
as well as the range of impacts noted. This is not intended to be a comprehensive
5-26
review of toxicological effects studies, but rather, it is to illustrate the diversity of
effort, approaches and results available (and not available) for groups of organisms.
More integrative and interpretive research reviews include the previously discussed
National Research Council (1989), and Wells (1984). The former is a particularly
nice overview of many aspects related to dispersants and their use, and includes a
good discussion of toxicity and review of relevant studies.
MammalsLittle information is available on the extent of and effects of ingestion of oil by
pinnipeds and cetaceans. Even fewer studies exist for toxicological and exposure
reduction implications of dispersant use. Nevertheless, because coastal waters
where dispesant use would be considered are utilized by a wide range of marine
mammals, including sea otters, pinnipeds and cetaceans, the potential impacts of
both oiling and dispersant use should be anticipated. Results presented below
necessarily focus on oil impacts to mammals, but these are relevant in that a major
factor in determining the appropriateness of dispersant use in a spill situation.
Of all the marine mammals, probably the most information related to oil impacts is
known for sea otters (Enhydra lutris). The most detailed studies to date of oil
toxicology in sea otters took place during the Exxon Valdez spill in Alaska.
Unfortunately, information from these studies has been slow to emerge from the
morass of litigation and natural resource damage assessment. Some observations,
however, were presented at a 1990 Southern California Academy of Sciences
conference on wildlife impacts resulting from the Exxon Valdez spill, by Terrie M.
Williams of International Wildlife Research. These included the following:
• Oil was problematic to sea otters because they spend such a large portion of
their lives at the surface.
• Very little was known about otters that were brought in from the field either
for necropsy or for cleaning.
Lack of knowledge on why otters had died, how the oil had killed them,
and on routes of exposure
• Three critical medical factors appeared to contribute to cause of death in otters:
1. Unstable temperature, both high and low
2. Hypoglycemia (low blood glucose)
Common in first days of the spill
Lightly oiled animals had >140 mg/decaliter (dl) glucose
5-27
Moderately oiled animals had 80 mg/dl
Heavily oiled animals had 60 mg/dl
Undetermined whether glucose depression resulted from inability to
absorb food, impaired ability to hunt, or other reason
3. Emphysema
Limited to first weeks of spill
Was devastating to otters
Sections of lungs blown out, resulted in leaking of gases into body cavity
Some theories that toluene, benzene-type vapors caused emphysema
• Most serious impacts were observed early in the spill
The first and last observations are probably of greatest relevance in relating
dispersant use to impacts on sea otters. Clearly, experiences from the Exxon Valdez
and elsewhere have shown that sea otters are particularly at risk from oil exposure.
In addition to the physiological effects cited above, the impacts on the ability of otters
to thermoregulate are severe: 20 percent oil cover on a sea otter results in a
doubling of metabolic rate, and the resultant energy expenditure to maintain body
heat exceeds that attainable by foraging (Michael Fry, personal comm. 1991).
Because animals suffered the most severe impacts early into spill events when the
oil is most toxic, quick response to prevent exposure is of primary importance. The
use of effective dispersants would be desirable in order to reduce the extent of that
exposure. However, the effects of dispersant exposure on sea otters has not been
well researched. It has been speculated (Fry, personal comm. 1991) that impacts from
oil and the detergents present in modern dispersants may be equally harmful to sea
otters, in terms of effects on pelt insulation. Further research efforts are needed,
even for this relatively well-studied marine mammal.
Information for other mammals, including the pinnipeds and cetaceans, is scant.
For pinnipeds, it is known that external oiling has little impact on thermoregulation
due to the presence of blubber layers. In the Exxon Valdez spill, the effects on harbor
seals were remarkably less severe than for sea otters. There were no observed
thermoregulatory problems, although some corneal lesions attributable to oil
exposure were observed. Internal effects of oil ingestion were apparently not
serious. Although some pups with elevated blood hydrocarbon levels lost weight
and appeared unhealthy for a time, all recovered.
5-28
Experiences such as these for harbor seals suggest there is less reason to consider the
use of dispersants when the marine mammal resource at risk is a pinniped species,
as opposed to sea otters.
The limited research performed with cetaceans suggests that they are less at risk
during an oil spill than other living marine resources. Geraci and St. Aubin (1982)
found that bottlenose dolphins (Tursiops truncatus) could detect as well as avoid oil
on the surface of the water.
They also investigated the effects of petroleum hydrocarbons on the physiology of
cetacean skin, which is structurally and functionally unique among mammals.
Although bottlenose dolphins were again the principal study species, others such as
Risso's dolphin (Grampus griseus) and sperm whale (Physeter catodon) were
included opportunistically. Changes in a number of parameters were examined,
including skin color, heat of exposed area, cellular damage and healing time, healing
time of previously damaged skin, damage to functional biochemistry of cells. Some
minor changes were observed for each parameter following exposure to petroleum,
but for the most part these were transient in nature.
Geraci and St. Aubin (1982) also studied the potential for oil fouling of baleen filters
that mysticete cetaceans use for feeding. It was found that light- to medium-weight
oils reduced water flow through baleen plates of fin and gray whales, but that flow
returned to normal within 40 seconds. Fouling with a heavy Bunker C product
restricted flow for up to 15 minutes, but even though plates were noticeably oiled,
flow returned to normal. Clearance of the baleen fibers occurred within 15-20 hours,
even with heavier-fraction oils. Impacts on contamination of food items or physical
adherence of food to the plates was not examined.
In summary, Geraci and St. Aubin concluded that impacts on cetaceans from oil
spills would not be expected to be severe, although it was recognized that many areas
of oil impacts have not been studied. However, based on the lack of a recognized
severe risk to cetaceans from oil exposure, rationalizing the use of dispersants based
on a perceived threat from oil to these marine mammals probably is not warranted.
5-29

It is very clear that the effects of dispersants on marine mammals is poorly described.
What little guidance that exists for considering potential impacts on marine
mammals is based on speculation or extrapolation. Neff (1990) summarized the
situation:
Virtually nothing is known about the effects of oil dispersants on marine mammals, except asthey are used to clean oil-fouled sea otters. By removing spilled oil from the sea surface,dispersants obviously reduce the risk of contact. The oil remaining, on the one hand, would beless sticky, and therefore less likely to adhere to fur, skin, baleen plates, or other body surfaces.On the other hand, the surfactants in dispersants may remove natural oils from marine mammalfur, thereby decreasing its insulating properties. Cleaning oiled beaches and rocky shores withdispersants may be an effective means of preventing oiling of pinnipeds that may wish to haulout there. More work needs to be done before we can adequately weigh the advantages ordisadvantages of using dispersants in such habitats.
With the exception of sea otters, it would appear that exposure of most marine
mammals to oil does not result in severe impacts. The ability of marine mammals
to avoid oiled areas and the lack of demonstrated toxic effects suggest that there may
be less need to consider dispersant use for protection of mammals than there may be
for other resources. However, special situations, such as the presence of large
numbers of sea otters and/or haulout and breeding areas in a spill area, may provide
substantial impetus to consider dispersant use.
BirdsThe effects of oil on seabirds are both well known and well described, and are
discussed elsewhere in this text. Studies examining dispersant impacts, either alone
or in concert with oil, are much less common. Peakall et al. (1987) summarized the
available information.
Reproductive impacts on four species of birds exposed to various combinations of
oil and dispersant were presented. In the mallard (Anas platyrhynchos), doses of
Prudhoe Bay crude oil, Corexit 9527, and oil-dispersant mixtures (5:1 and 30:1
oil:dispersant) applied to the surface of eggs all resulted in marked embryotoxicity,
with greater effects noted if the application was made early in incubation. The 30:1
oil:dispersant mixture was found to be significantly less toxic than the oil alone. In a
related experiment, exposures were made to more closely resemble field conditions
by exposing mallards to water troughs with oil and dispersant mixtures. In this case,
the hatchability of eggs exposed to oil alone was reduced, while that from Corexit
and oil-Corexit was not significantly different from unexposed controls. However,
5-30
the results were variable enough for the investigators to conclude that crude oil-
Corexit mixtures probably pose the same threat to eggs that oil alone does.
Studies on weight gain among both mallards and herring gulls exposed to oil and
oil-dispersant mixtures showed that in mallards, no effect was noted for either oil or
the mixture. In gulls, a significant decrease in weight gain was found for both oil
exposure and oil-dispersant exposure, but no difference between the two exposures.
Only one study that examined oil and oil-dispersant effects in the field was noted by
Peakall et al. In this investigation, Leach's storm petrels were given either external
or internal doses of Prudhoe Bay crude or oil-Corexit 9527. No effects were seen in
the internal dosing, but the highest concentration exposure of external dosing with
oil-dispersant resulted in significantly higher nest desertions during brooding. No
significant effects were observed with oil alone. Hatching success for both oil and
oil-dispersant treated adults was similarly reduced.
Physiological studies on herring gulls and mallards showed that oil alone and oil-
dispersant mixtures had similar effects on birds. This implied that the assessment of
exposure hazard was therefore dependent on the nature of exposure. That is, are
birds more likely to experience a higher degree of exposure through oil remaining
on the surface, or through oil and oil-dispersant mixtures resulting from a
dispersant application?
Because many seabirds are most at risk in an oil spill situation from exposure to oil
on the surface of the water, it is a reasonable assertion that in theory, the use of
dispersants should be advantageous because it would decrease the amount of oil
contacted at the surface. However, unless the dispersants are highly effective,
Peakall et al. suggest that the differences in oil exposure at the surface are very small,
and likely to be negligible in terms of the overall oil hazard to the birds. Theoretical
calculations by Peakall et al. on exposure occurring as a seabird dives through a
dispersed oil mass indicated that it is likely to be minimal.
Peakall et al. came to two major conclusions as a result of their review and research.
First, they found little evidence of a synergistic increase in oil toxicity to birds when
oil was combined with dispersant. Second, in order to significantly reduce surface
exposures of seabirds, dispersants need to be highly effective. Recent research has
5-31
suggested that the latter condition is not a reality. For example, Fingas et al. (1991a)
tested four dispersants with 20 different types of crude oils and refined products, and
obtained efficiencies of dispersion ranging from 1 percent to 96 percent. The nature
of the oil product appeared to be a greater determinant of efficiency than did the
dispersant employed.
Jenssen and Ekker (1991) found that for eiders (Somateria mollissima) and mallards
(Anas platyrhynchos) whose plumage was fouled with oil (Stratfjord A crude) or
crude oil mixed with the dispersants Finasol OSR-5 or OSR-12, oil-dispersant
mixtures were more potent in reduction of thermoregulatory capability. Both
exposures resulted in a reduction in the water-repellency of plumage, a resultant
increase in plumage water absorption, an increase in heat loss, and a compensatory
increase in heat production. However, much smaller amounts of the oil-dispersant
mixtures were required to cause the effects. Jenssen and Ekker speculated that the
reason for this result may be that surfactants in the dispersants more readily adhere
to the feather structure or bind to waxes that birds preen into their feathers.
It was also found that the different species were affected to different degrees, with
eiders more sensitive to the oil-dispersant mixtures than mallards. An explanation
for the difference may lie in differences in feather structure, and suggests more
broadly that different species of aquatic birds may respond differently to
contamination of plumage.
Jenssen and Ekker ended their article by explicitly addressing the question, "Should
oil spills at sea be treated with chemical dispersants in order to reduce their impact
on bird life?" They noted that their results implied that in order to minimize the
impact of a spill on birds, the concentration of treated oil needs to be very low by the
time it reaches flock of birds at sea. Results of effectiveness studies were cited in
which the action of dispersants was indeed very rapid, with resulting concentrations
in chemically treated slicks very low (Fingas et al. 1991a, however, dispute claims of
high dispersant efficiencies in field tests). At face value, therefore, dispersant use
would seem to be advisable for protection of birds, even in light of the study results
suggesting a higher potency of dispersed oil for adversely impacting
thermoregulation.
5-32
National Research Council (1989) discussed the implications of dispersant
inefficiency on bird exposure, and cautioned that while potential biological benefits
from dispersant use exist for birds (e.g., reduction in surface oil amounts), it is also
possible that residual sheen from dispersed oil slicks may cover a greater area than
untreated oil, resulting in potential exposure to more birds rather than fewer.
5-33
Jenssen and Ekker also expressed concerns about potentially increased exposure to
oil due to dispersant use:
. . .one should also note that dispersants may have a secondary effect, by increasing the surfacearea of the slick. In a "worst case" scenario, chemical treatment of an oil slick may thereforeincrease the risk of exposure of more birds to less, but more harmful, chemically treated oilmixtures. Since the effect of oil-dispersant mixtures on the thermoregulation of seabirds is afunction of the amount of the contaminant absorbed by the plumage, the effect is dependent onboth the concentration of the pollutants in the water, and on the volume of contaminated waterwith which the birds come into contact.
Finally, noting the apparent differences in species effects, they conclude that until
more data on impacts are available, birds should be prevented from coming into
contact with chemically treated oil slicks unless the hydrocarbon concentrations are
known to be very low.
FishNational Research Council (1989) summarized the results of a number of acute
toxicity tests performed on fish species. Unfortunately, these studies are somewhat
dated, with most having been published in the 1970s. The summary listed results of
LC50 tests from 13 separate studies that examined effects on 13 fish species. Eight
dispersant products were tested, with exposure periods ranging between 48 and 96
hours. Values for LC50 concentrations ranged between 29 ppm and >10,000 ppm.
The wide range of results obtained are difficult to interpret, especially given that
there are many combinations of organism, dispersant, and exposure time. Unless
the dispersant product/species pair happens to match the exact product/species pair
of interest or concern, probably the most illuminating aspect of the tabular summary
is the range of results obtained in the studies, with the implied inability to
generalize about dispersant toxicity.
Oyewo (1986) performed acute toxicity tests with the fingerlings of mullet (Mugil sp.)
and three dispersants (Conco-K, Foremost, and BP 1100X) calculating LC50
concentrations for three exposure periods (24-, 48-, and 96-hour). There were
significant differences in LC50 concentrations among products. For example, in the
96-hour test at about 36 parts per thousand salinity, the LC50 concentration for
Conco-K was 4.60 ppm, for Foremost was 52.0 ppm, and for BP 1100X was 151 ppm.
The relative relationships among the three products were consistent across all
exposures (i.e., toxicity of Conco-K > Foremost > BP 1100X), and in fact, the absolute
values of the LC50 concentrations were essentially the same for all three products
5-34
across the range of different exposures. Salinity differences did not appear to
influence the results. The study results suggest the importance of not extrapolating
a general condition from the results of toxicity testing for a single product.
Akintonwa and Ebere (1990) tested the toxicity of crude oil (Asabo 16c) and two
dispersants (Conco-K and Teepol) to two species of freshwater fish (Barbus sp. and
Clarias sp.) both discretely and in combination. They found that the two dispersants
were much more toxic to the fish than crude oil alone, and that when the
dispersants were used in combination with oil, the toxicity of the oil increased. They
concluded that combining crude oil and dispersant resulted in a higher toxicity than
that from the dispersant alone.
CrustaceansAhsanullah et al. (1982) conducted standard LC50-type toxicity tests using a
hydrocarbon-based dispersant (BP/AB), Kuwaiti crude oil, and an oil-dispersant
mixture. The key finding in this study was that combining oil with dispersant
increased the toxicity of the oil to a crab species by a factor of 16. The results
suggested that the physical effect of the dispersant in emulsifying the oil resulted in
the increase in toxicity, with the broader implication being that toxicity is in effect a
measure of the the efficiency of the product: the more efficient the product, the
more toxic the oil-dispersant mixture.
However, Ahsanullah et al. included some precautionary comments about
extrapolating the results to a real-world situation:
It is difficult to apply these results to an oil spill situation in the marine environment becausethe laboratory conditions do not replicate the hydrographic characteristics of the affectedareas. This includes wave action, dispersal by currents and the spatial separation of the faunafrom oil on the surface of the sea or in the case of littoral animals, the physical coating of thebody surface with oil.
As an additional component of the fish study cited above, Oyewo (1986) also tested
three dispersants for acute toxicity to hermit crabs (Clibinarius africanus) and
obtained results qualitatively similar to those for the fish tested (i.e., the toxicity
relationship of Conco-K > Foremost > BP 1100X). In 33.5 parts per thousand salinity
and 24-hour exposure, the LC50 concentrations obtained were, for Conco-K, 9.2 ppm;
for Foremost 19.4 ppm; and for BP 1100X, >30,000 ppm. The results in different
exposures and the different salinity were somewhat more variable than was the case
for the fish, but overall demonstrated the same trend.
5-35
Oyewo also cautioned about the extrapolation of these kinds of results to the real
world:
It is necessary to emphasize that results of acute toxicity tests cannot, alone, form the basis ofany decision on the use of oil dispersants since several other considerations are important in theoverall decision framework. . .However, relative toxicity data plus a detailed knowledge offield effects is a useful combination for ecological predictions and therefore invaluable inmaking decisions on the use of oil dispersants.
Anderson et al. (1984) examined the seasonal effects of dispersed oil exposure on
toxicity to coonstripe shrimp (Pandalus danae). Prudhoe Bay crude oil was used in
the test, with two unspecified dispersant products. Differences in effects were
observed between the two dispersants, particularly in winter exposures. Although
significant differences in toxicity were not found between the dispersants in summer
exposures, the overall levels of toxicity in summer were significantly higher.
MolluscsHartwick et al. (1981) studied the effects of Alberta crude oil, Corexit 9527, and oil-
Corexit mixtures on several aspects of littleneck clam (Protothaca staminea)
behavior and physiology. They found in both laboratory and field experiments that
Alberta crude oil alone (1000 ppm), or low concentrations (<10 ppm) of Corexit 9527
were not greatly harmful to the clams. The lack of sensitivity to crude oil contrasted
to results from other researchers that had suggested a particular susceptibility in
molluscs.
It was also determined that the dispersant and oil-dispersant mixtures were more
toxic to clams than oil alone. Mortality was observed when clams were exposed to
100 ppm Corexit 9527, and was highest in both the laboratory and in the field when a
mixture of 100 ppm Corexit 9527 and 1000 ppm crude oil was used. Hartwick et al.
also found variable results between the laboratory and the field:
It was. . .apparent that the percentage mortalities resulting from the field experiments weremuch lower than those from the equivalent laboratory tests. Such discrepancies demonstratethe difficulty in extrapolating laboratory results to natural spill conditions.
Some impact on the settlement of clam larvae was noted with oil-dispersant
mixtures over oil alone. In addition, hydrocarbon analysis of the substrate in
experimental plots showed that residues penetrated deeper and were measurable for
longer periods of time in oil-dispersant treated plots. The overall implications of
5-36
the study results were that the impact of oil spill alone on the littleneck clam could
be expected to be small. However, the use of Corexit 9527 as a dispersant may
augment adverse impacts by reducing the recruitment of larvae, and by increasing
the retention time and penetration depth of hydrocarbons into the substrate.
Ordzie and Garofalo (1981) examined the effects of oil (Kuwait crude), dispersant
(Corexit 9527), and oil-dispersant mixtures on scallops (Argopecten irradians) and
two predators, a drill (Urosalpinx cinerea) and starfish (Asterias forbesi). Different
susceptibilities were found for the three organisms. Scallops were found to be most
sensitive to dispersant and oil-dispersant mixtures, starfish were sensitive to
dispersant only, while the drill was insensitive to all test mixtures.
Similar to results found by Anerson et al. (1984) for shrimp, there appeared to be a
significant influence of water temperature on the degree of toxicity observed.
Scallops were found to be most sensitive at water temperatures encountered in the
summer, and less so at winter temperatures. This seasonal sensitivity was found to
be dramatic: dispersant concentrations not lethal to scallops at winter temperatures
caused >50 percent mortality at summer temperatures. The predators were affected
in an opposite fashion, with treatments having a lesser impact at summer
temperatures. However, sublethal effects on behavior (ability to recognize prey
items) increased in predators with increasing temperature. Ordzie and Garofalo
summarized the implications of their study:
In order to accurately assess biological effects of a pollutant event, we need to knowsusceptibilities of animals for different seasons. . .Although temperature of ambient watercould be a significant predictor of scallop susceptibility to dispersant exposure, one should notgeneralise to other organisms. This issue becomes more complex because either the "pollutanttoxicity" or "animal sensitivity" can be affected by temperature. Accordingly, the temperaturerelated susceptibility can be different for each organism, making broad generalisationsdangerous.
CoralsCorals, of course, are a critical habitat only in tropical coastal waters. However,
review of research into oil and dispersant effects on reef building corals helps to
define the range of impacts across a diversity of marine organisms. Knap (1987)
studied the effects of Arabian Light crude oil and oil dispersed with Corexit 9527 (1:20
mixture, dispersant:oil) and oil dispersed with BP 1100WD (1:10 mixture).
Laboratory exposures were validated in the field both in winter and summer. Knap
found that the coral Diploria strigosa appears to be relatively tolerant to brief
5-37
exposures to crude oil chemically dispersed into the water column. Exposure
concentrations in field experiments ranged from 8 to 25 ppm, and length of
exposures were 6 hours. However, it was also noted that many of the cryptic
epifaunal organisms living in the coral reef community (i.e., polychaetes, bivalves,
crustaceans) displayed a greater sensitivity to the exposures that apparently did not
harm the coral itself.
A multi-disciplinary, long-term field assessment of the effects of oil and dispersed
oil in Panama (Ballou et al. 1989) was interesting in that it illustrated the kinds of
trade-offs that dispersant use may entail. In this study, sites with three major
components—mangroves, seagrasses, and coral reefs, were exposed to both oil
(Prudhoe Bay crude) and dispersed (with non-ionic glycol ether-based product) oil. It
was found that untreated oil had severe effects on mangroves and associated
communities and relatively minor impacts on seagrasses and corals. In contrast,
dispersed oil adversely affected seagrasses and corals. This suggested that the use of
dispersants shifted toxicity from one compartment (intertidal) to another (subtidal).
Although the situation of dispersant application to an oil slick far offshore was
discussed, it was not investigated in this study. However, based on the other results
obtained, Ballou et al. felt that such an approach might minimize the extent of
damage to resources in both tidal zones.
MicroorganismsProtozoans. Rogerson and Berger (1981) performed toxicological studies using
Corexit 9527 and ciliate protozoa. The rationale for examining impacts on protozoa
were twofold: the researchers wished to study a non-traditional experimental
organism, and they also wanted to examine effects on a trophic level not often
considered. Rogerson and Berger acknowledged that while ciliates were not found
in great abundances in pelagic waters, they are abundant in intertidal areas and
could be of some ecological importance.
Rogerson and Berger found that the most sensitive ciliate protozoan species tested
yielded a threshold concentration of 100 ppm Corexit 9527, although other species
tolerated levels as high as 320 ppm. However, the dispersant in combination with
crude oil appeared to be much more acutely toxic than the dispersant alone. It was
found that mixtures with >1.0 ppm Corexit caused the protozoan cells to lyse.
Because the concentration of crude oil was held constant and the concentration of
5-38
Corexit 9527 varied, Rogerson and Berger reasoned that it was the dispersant
component of the emulsion that contributed most to toxicity.
The mechanism of toxicity of the oil-dispersant mixtures was also examined. Two
hypotheses were that chemical emulsifiers interact with oil to release toxic
substances, or alternatively, that the mixture is made more available through
dispersion of fine droplets. It was determined through studies of ingestion rates and
identification of materials ingested by the ciliates that in this case, toxicity was
apparently manifested through increased availability of the oil-dispersant mixture.
The authors speculated that it was probable that the oil acts as a vector through
which the dispersant is transported into the cell, causing the disruption of cellular
membranes.
It may be important to note that this study was performed using both marine and
freshwater organisms. Corexit 9527 was developed for use in the marine
environment, and its effectiveness in freshwater is questionable. Although
evidence was cited that toxicity testing using freshwater organisms should not lead
to significant errors, the possibility that differences attributable to the test conditions
cannot be overlooked.
Microbial degradation. An aspect of dispersant toxicity that is often
overlooked but should be acknowledged is the impact that dispersant use may have
on other important processes associated with removal of oil from the environment.
In particular, Foght and Westlake (1982) found that Corexit 9527 has detrimental
effects on eucaryotic processes, bacterial activity at sea, and microbial oil-degrading
processes. In other words, application of dispersant products can potentially
negatively affect mechanisms of biodegradation.
The addition of relatively large volumes of carbon-rich dispersants to an oiled environmentalready having a very high carbon to nitrogen. . .ratio (which is not suitable for rapidmicrobial growth) further stresses this environment. The beneficial effects of dispersants inproviding more oil surface for microbial growth is countered by the additional stress on thenitrogen-phosphate level of the environment by the addition of a biodegradable dispersant. ..This stress could result in a delay of the oil-degradation process.
Another study by Bhosle and Mavinkurve (1984), using four unspecified dispersants
on Saudi Arabian and Bombay High crude oil, elicited mixed results, in which some
dispersants in combination with Saudi or Bombay crudes either inhibited or
accelerated biodegradation processes by one of two bacterial species. Reduction in
5-39
biodegradation processes was thought to result from a preferential utilization by
microbes of carbon sources provided by the dispersant over those in oil.
Enhancement of biodegradation rates was also observed, possibly due to the increase
in oil surface area mentioned in the previous study.
PlantsAlthough most of the research on biological impacts of dispersants and dispersed oil
has examined effects on animals, some plant species have also been studied. The
overview of toxicity provided in National Research Council (1989) summarizes the
results of dispersed oil toxicity studies for phytoplankton, diatoms, and vascular
plants. Of eleven studies, ten found that the toxicity of dispersed oil was greater
than that for oil alone. However, the results of many of these investigations were
called into question by the National Research Council because of the use of nominal
exposure concentrations as opposed to measured concentrations. The studies which
measured concentrations in the water yielded mixed results, with two studies
indicating dispersed oil as more toxic than oil alone, one suggesting oil alone as
more toxic, and one showing them to be equally toxic.
Much of the research available for evaluating the effects of oil dispersants on plants
has focused on tropical and subtropical species. For example, Thorhaug and Marcus
(1987) studied three seagrass species found in the Caribbean and subjected them to
mixtures of three commonly stockpiled dispersant products (Corexit 9527, Arcochem
D609, and Conco K(K)) and two crude oils (Louisiana and Murban). They
determined that at recommended application levels, no significant mortalities
occurred. Higher concentrations, about an order of magnitude above recommended
application levels, resulted in the deaths of more sensitive species, especially with
longer exposures. Widely different results were obtained with different dispersant
products, with Conco K(K) causing a consistently higher degree of mortality in all
three seagrass species. The two crude oils yielded similar results.
A number of studies have examined effects of oil (South Louisiana crude) and
dispersants on mangroves. Teas et al. (1987) found that crude oil caused a significant
mortality to treated trees. The use of an unspecified non-ionic water-based
dispersant sprayed onto previously oiled mangroves increased this mortality.
Application of oil predispersed with a glycol ether-based product had no effect in
reversing the mortality attributable to oil, although mortality was not increased by
5-40
dispersant use. These results suggested that because oil exposure results in
significant impacts on mangroves, all efforts should be made to prevent contact.
Use of a dispersant, particularly a glycol ether-based product, may be justified as part
of the response, since its effects appear to be no worse than the oil itself.
A longer term approach to assessment of the effects of dispersant use among
mangrove trees was undertaken by Wardrop et al. (1987). They evaluated the
toxicities of Arabian Light crude oil, Tirrawarra crude oil, the dispersant BP-AB, and
oil-dispersant mixtures on mangroves in a fringing Australian marsh. Sublethal
effects such as defoliation, leaf damage, pneumatophore damage, flowering and
fruiting were monitored for three years. The results were interesting in that initial
toxicity of the oil was apparently increased through the use of a dispersant, but after
three months those mangroves treated with dispersed Arabian Light showed a
higher degree of productivity over both Arabian Light crude alone and the unoiled
controls. This apparent growth stimulation had been reported elsewhere for
mangroves exposed to various hydrocarbon products. The Tirrawarra crude
mixtures did not show a similar increase in growth, and in fact, produced somewhat
fewer leaves.
SummaryUnfortunately, it is not possible to present a rote formula for determining ecological
consequences of the use of dispersants during a spill situation. As should be
apparent from the examples cited above, the effects are highly dependent on a
number of factors, some of which are relatively undefined in terms of their
importance.
As a spill responder, it will not be possible for you to anticipate all of the
implications of dispersant use. However, keeping in mind some of the insights that
have been learned may help in the decision-making process.
• The number of combinations of oil, dispersant, organism, life stage, nature of
exposure, time of year, etc. that are possible in an area make a prediction of
the ecological impacts of dispersant use very difficult. Several studies suggest
that effects can vary significantly with different combinations of parameters,
usually making generalizations inappropriate.
5-41
• The common wisdom in the case of the newer generation dispersants is that
they are no more toxic than crude or refined oils to which they might be
applied, and that toxicity resulting from an oil-dispersant mixture is largely
attributable to the oil component. Some recent studies suggest otherwise, but
more carefully designed and administered investigations clearly would be
useful.
• Conceptually, the use of dispersants moves an oil product from one physical
environment (the air-water interface) to another, or others (the water column
or the benthic environment). However, no dispersant is 100 percent effective;
application will result in variable amounts in each physical compartment,
with resultant impacts proportional to the partitioning.
• Laboratory studies suggest that the toxicity of dispersants is correlated with
efficiency: the more efficient a product is in moving oil into the water
column, the greater the toxicity to organisms in the water column or in the
benthos.
• It is difficult to extrapolate results from the laboratory to anticipated results in
field exposures. Comparison of such results within the same study show a
wide variation, with field mortalities attributable to exposure lower than
those in the laboratory. However, some methods employed in these
assessments may introduce biases that inaccurately portray toxicities.
• Certain life stages of organisms, particularly early reproductive stages, appear
to be most at risk from exposure to dispersants.
• Mature life stages of animals are more tolerant to exposures to oil-dispersant
mixtures. However, consideration of life cycle timing is critical, since
physiological stresses imposed by reproductive or other activities may
increase the susceptibility to both oil and dispersants.
• Dispersants can either enhance or inhibit biodegradation of oil, apparently
depending on the dispersant product, the oil, and the specific bacteria
involved.
5-42
There are distinct advantages in planning for dispersant use. The need to apply a
dispersant on spilled oil very early into the event in order to maximize the
efficiency of dispersion is the major motivating factor for anticipating conditions in
specific regions. An integral part of this process should be the explicit consideration
of ecological impacts, which may involve fairly detailed resource surveys and
toxicological studies of effects on organisms of concern. Ideally, this would include:
• Identification of sensitive life stages and commercially important marinespecies for discrete areas of the coast.
• Critical periods of time for those species that may affect sensitivities toboth oil and dispersants.
• Laboratory and/or field evaluations of the effects of oil, dispersant, andoil/dispersant mixtures, using products that could be transported or usedin the event of a spill.
Although the collection and interpretation of this information can be both time-
consuming and costly, it is a prerequisite to assessing ecological trade-offs
realistically for the use of dispersants to treat an oil spill. An observation by
Anderson et al. (1984) seems to be valid for the current situation in evaluating
dispersant toxicity:
. . .both field measurements of dispersed oil and estimates of dilution rates within a specificbody of water can play an important role in estimating the impact on local species. Suchassessments can be made after a spill, but it is our hope that our state of understanding willadvance to a level that will allow us to accurately predict the comparative hazards of noaction versus dispersant application. Only after more data are gathered. . .on a variety oforganisms and ecosystems will we be in a position to make this type of accurate assessment.
Dispersant use guidelinesThere are a number of methods for oil spill response and cleanup, both on the water
and on shorelines. These range from doing nothing, to strictly mechanical means,
such as booming or skimming, to chemical methods exemplified by the use of oil
dispersants or elasticizers, to biological treatments like fertilizers or microbial mixes
to enhance biodegradation. When a spill occurs, some sort of evaluative framework
must be used to determine what approaches are to be used. Decision-making
methods that have been formulated (usually decision trees) to provide a structure
for crafting approaches generally incorporate evaluation of the use of dispersants.
The decision of whether to apply dispersants involves considering the logistical and
5-43
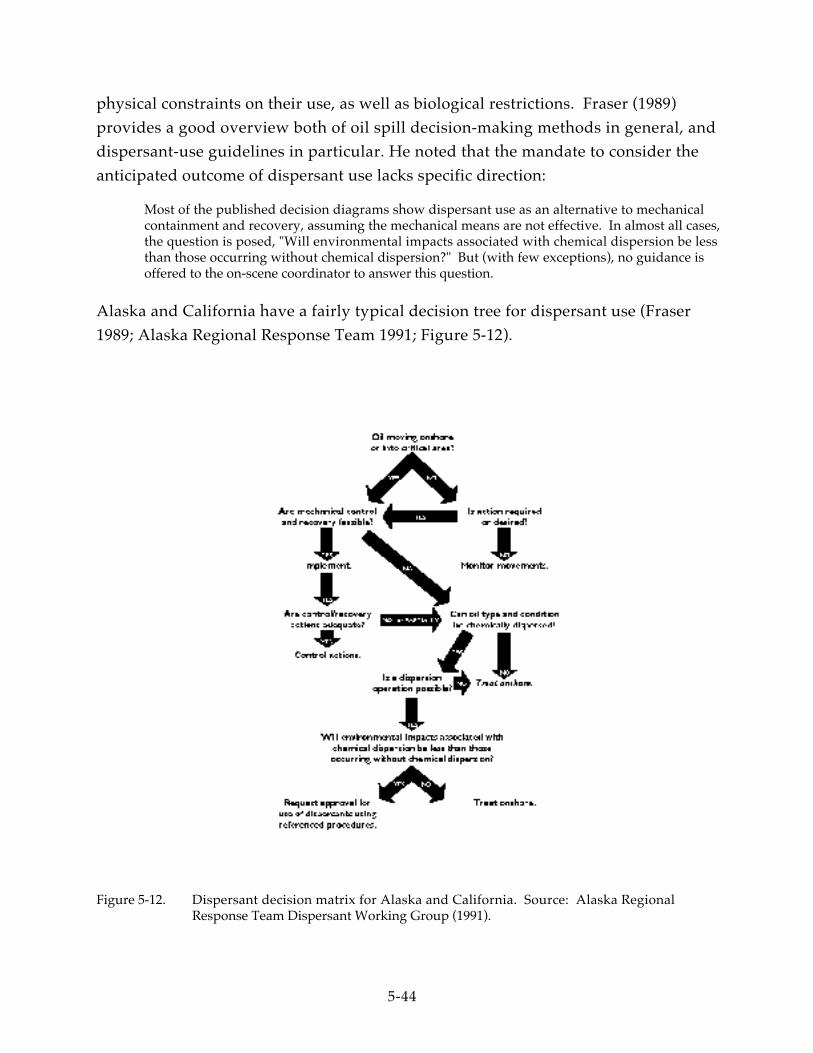
physical constraints on their use, as well as biological restrictions. Fraser (1989)
provides a good overview both of oil spill decision-making methods in general, and
dispersant-use guidelines in particular. He noted that the mandate to consider the
anticipated outcome of dispersant use lacks specific direction:
Most of the published decision diagrams show dispersant use as an alternative to mechanicalcontainment and recovery, assuming the mechanical means are not effective. In almost all cases,the question is posed, "Will environmental impacts associated with chemical dispersion be lessthan those occurring without chemical dispersion?" But (with few exceptions), no guidance isoffered to the on-scene coordinator to answer this question.
Alaska and California have a fairly typical decision tree for dispersant use (Fraser
1989; Alaska Regional Response Team 1991; Figure 5-12).
Figure 5-12. Dispersant decision matrix for Alaska and California. Source: Alaska RegionalResponse Team Dispersant Working Group (1991).
5-44
As this diagram shows, dispersant use will be considered as a response option only
when mechanical containment and recovery actions are not considered to be
feasible. It is also apparent that implementation of this decision tree requires a
significant amount of information to be gathered prior to the actual time of decision,
including an explicit evaluation of comparative impacts between untreated and
dispersed oil. As Fraser has noted, however, no guidance is offered as to how to
make this determination.
The state of Alaska has taken steps to anticipate resource impacts that may result
from dispersant applications through the designation of use zones. This constitutes
the major difference between the Alaska and California
decision-making processes: the dispersant use criteria developed for use in Alaska
classify coastal waters into three dispersant use zones. In all cases, the use of
dispersants will be based on the determination that the impact of dispersants or
dispersed oil will be less harmful than non-dispersed oil. The zones are defined by
physical parameters such as bathymetry and currents, biological considerations such
as sensitive habitats or fish and wildlife concentration areas, nearshore human uses,
and time required to respond. The three zones are defined as follows:
Zone 1: Use of dispersants is acceptable. The On-Scene Coordinator (OSC) is not
required to seek approval by the EPA or the state prior to dispersant use, but is
required to notify both of the decision as soon as possible.
Zone 2: Dispersant use is conditional, in order to protect sensitive wildlife and
other resources. The OSC is required to consult with the RRT and to obtain
approval from the EPA and the state prior to use of dispersants.
Zone 3: Dispersant use is not recommended. However, dispersant use may be
permitted if, on a case-by-case basis, it is determined that disturbance of the
organisms and direct exposure to dispersants or dispersed oil would be less
harmful than the impact of spilled oil. Consultation is required with the RRT,
and approval of the EPA and state are necessary.
In Alaska, sensitive wildlife and other resources that are to be considered for
dispersant use decisions have been identified as including:
• endangered or threatened species protected by Federal and stategovernments;
5-45

• nesting, spawning, breeding, and nursery areas for mammals, birds, fish,and shellfish;
• fish and wildlife concentration area where these animals feed, rest, ormigrate;
• sensitive marine habitats, including- seagrass beds- kelp beds- shellfish beds- tidal flats- marshes- shallow subtidal areas- low energy bays and harbors- rocky intertidal areas
• aquaculture and commercial areas which are shallow enough to allowimpacts from oil spills; and
• recreational and industrial areas
Evaluation of potential impacts to these resources has been factored into the use
designations that have been established for specific areas, with the result being zonal
configurations that may change during the course of the year to account for varying
resource sensitivities. For example, the area around the Valdez tanker loading
facility is designated as a Zone 1 region from October 16 to February 28, when
fisheries resources such as juvenile salmon and herring spawning and rearing areas
as well as fishing activities are least abundant. From March 1 to October 15, when
fisheries resources and harvest activities are at a peak, the area is considered as a
Zone 2 dispersant category.
Implicit in these designations are certain assumptions about the effects of
dispersants on organisms and resources of interest or concern. The increased
restrictions on dispersant use that are imposed on areas with aggregations of
mammals, birds, fish, and shellfish imply that dispersants and dispersed oil are
considered to be at least as harmful as untreated oil. The toxicity studies cited in the
preceding discussion show that impacts vary widely among organisms, dispersants,
oils, life stages, water temperatures, and the like, and suggest that studies directed at
specific combinations that are relevant for specific areas would be useful in planning
exercises. The investigations on sensitive life stages of California marine organisms
(i.e., those by Tjeerdema et al. and Singer et al. discussed in the preceding section)
provide a good basis for evaluation of dispersant use impacts and subsequent
designation of dispersant use zones.
5-46

Research Planning, Inc. (RPI), has had considerable experience in evaluating both
the effectiveness of dispersants as well as resource impacts resulting from dispersant
use. RPI has been participating in the development of simplified dispersant-use
guidelines (RPI 1991) that could be incorporated into a computer-based expert system
for use in spill response decisionmaking. Some of the salient features of the RPI
work have a broader application in formulating dispersant use guidelines include
the following considerations:
1. First, determine the quick and easy answers that eliminate the use ofdispersants.
1. Is the oil dispersible? NO for light petroleum products (No. 2 fuel, jet fuel,
gasoline). NO for very heavy products (heavy No. 6 fuel, Bunker C, asphalts,
residuals). Possible YES for all other oil types.
2. If the oil has formed an emulsion, then it is no longer dispersible.
3. Is the wave height between 1 and 10 feet? If lower, then dispersants are not
very effective, because of insufficient mixing forces. If higher, then
dispersants are not recommended because of sufficient natural mixing, as well
as logistical problems.
4. Is sufficient dispersant available in time for use? This issue is the window of
opportunity during which the oil is dispersible. The time frame depends on
the meteorological conditions, and oil type. The transition is gradual.
5. Is this in a RRT preapproval area? This is a question response personnel need
to know the answer to in advance. If the answer is no then it must be
determined if approval can be obtained within the time frame indicated
above.
6. Is the water depth in the spill area greater than 30 feet? If NO then dispersants
are not to be used. Field studies and mathematical models show that oil
concentrations under a dispersed a dispersed slick will have concentrations of
1 ppm or greater down to 30 feet. With 1 ppm set as the maximum safe
concentration, dispersants could not be used in less than 30 feet, with the
entire water column concentration being above the 1 ppm level.
5-47
2. Answer other predetermined questions that have been specified toeliminate the use of dispersants. For example:
1. Are there any water intakes in the area? If YES then dispersants are not to be
used.
2. Are there critical subtidal resources? This includes nursery grounds,
spawning aggregation areas, or other areas of particular sensitivity. If these
exist in the area being considered, then dispersants are not to be used.
3. Compare subtidal and intertidal impacts of oil and dispersed oil.1. Intertidal effects of exposure to oil - Considers shoreline sensitivity for
beaches, marshes, and tidal flats. Incorporates assessment of animal
sensitivity and ranking through a system examining possibility of oiling,
sensitivity to oil, environmental/commercial/recreational status (i.e.,
endangered, commercial fishery, federally managed).
2. Intertidal/subtidal effects of dispersed oil - Shoreline impact would be
expected to be reduced with increased effectiveness of the dispersant; subtidal
impact may increase. Subtidal animal toxicity is calculated, and impact values
assigned to the animals. Calculations include determining the ppm-hour
concentrations over a 24 hour period, and comparing that to the toxicity data
of the animal to determine the percent mortality at the given ppm-hours.
3. Compare the weighted values for the effects of dispersed oil and the effects of
oil. The parameter with the lower number has the least adverse effect.
In summary, general guidelines (i.e., decision trees) for the use of dispersants exist
for many regions. Considering impacts to biological resources is a component of
these guidelines, but guidance for how to do this is generally vague. By defining, in
advance, those resources considered to be sensitive or otherwise of importance, and
estimating or determining the effects of oil and dispersed oil on those resources,
decision-makers may then define dispersant use zones that will greatly simplify
dispersant use decisions during spill incidents.
5-48
Shoreline Cleanup Methods and Application
Approved Physical Methods
A wide range shoreline cleanup methods are used during oil spills. Listed below are
the more commonly used methods, including the objective, description, applicable
shoreline types, guidelines on when to use the method, general biological
constraints, and potential environmental effects. These descriptions were initially
written as part of the Shoreline Treatment Manual developed in 1989 during the
first year of the Exxon Valdez spill cleanup program. They were revised in 1991 as
part of an effort by Region III for preplanning for oil spill cleanup requirements and
approvals.
1. No ActionOBJECTIVE:
No attempt to remove any stranded oil, to minimize impacts to theenvironment or because there is no proven effective method for cleanup.
DESCRIPTION:No action is taken.
APPLICABLE SHORELINE TYPES:Can be used on all shoreline types.
WHEN TO USE:If the shoreline is extremely remote or inaccessible, when natural removalrates are very fast, or cleanup actions will do more harm than leaving the oilto be removed naturally.
BIOLOGICAL CONSTRAINTS:This method may be inappropriate for areas where high numbers of mobileanimals (birds, marine mammals, crabs, etc.) use the intertidal zone oradjacent nearshore waters.
ENVIRONMENTAL EFFECTS:Intertidal — The same as the oil.Subtidal — The same as the oil.
2. Manual RemovalOBJECTIVE:
Removal of stranded surface oil with hand tools and manual labor.
DESCRIPTION:Removal of surface oil and oily debris by manual means (hands, rakes,shovels, etc.) and placing in containers for removal from the shoreline. Nomechanized equipment is used.
APPLICABLE SHORELINE TYPES:Can be used on all shoreline types.
5-49
WHEN TO USE:Generally used on shorelines where the oil can be easily removed by this non-mechanical means. Most appropriate for light to moderate oiling conditions.
BIOLOGICAL CONSTRAINTS:Foot traffic over sensitive areas (shellfish beds, algal mats, bird nesting areas,dunes, etc.) is to be restricted. May be periods when shoreline access isrestricted (e.g., bird nesting, mammal pupping).
ENVIRONMENTAL EFFECTS:Intertidal — Minimal if surface disturbance by cleanup activities and work
force movement is limited.Subtidal — None.
3. Passive Collection SorbentsOBJECTIVE:
Removal of oil by sorption onto oleophilic material placed in the intertidalzone.
DESCRIPTION:Sorbent material is placed on the surface of the shoreline substrate allowing itto absorb oil as it is released by tidal or wave action. Oil removal is dependenton the capacity of the particular sorbent, energy available for lifting oil off theshoreline, and degree of weathering.
APPLICABLE SHORELINE TYPES:Can be used on any shoreline type.
WHEN TO USE:When the shoreline oil is mobile and transport of oil is expected on or off thesite. The oil must be of a viscosity and thickness to be released by the substrateand absorbed by the sorbent. Often used as a secondary treatment methodafter gross oil removal, and along sensitive shorelines where access isrestricted.
BIOLOGICAL CONSTRAINTS:None, although this method can be slow thus allowing oil to remain incritical habitats during sensitive periods of time.
ENVIRONMENTAL EFFECTS:Intertidal — None, except for the amount of oil remaining on the shoreline
after the sorbents are no longer effective.Subtidal — None.
4. Debris RemovalOBJECTIVE:
Removal of contaminated debris and logs.
DESCRIPTION:Manual or mechanical removal of debris from the upper beachface and thezone above high tide beyond the normal wash of waves. Can include cuttingand removal of oiled logs.
5-50
APPLICABLE SHORELINE TYPES:Can be used on any shoreline type, where safe access is allowed.
WHEN TO USE:When driftwood and debris is heavily contaminated and, either a potentialsource of chronic oil release, an aesthetic problem, or a source ofcontamination of other organisms on the shoreline.
BIOLOGICAL CONSTRAINTS:Disturbance to adjacent upland areas should be minimized. Foot traffic oversensitive intertidal areas (shellfish beds, algal mats, bird nesting areas, dunes,etc.) is to be restricted. May be periods when shoreline access is restricted (e.g.,bird nesting, mammal pupping).
ENVIRONMENTAL EFFECTS:Intertidal — None.Subtidal — None.
5. TrenchingOBJECTIVE:
Remove subsurface oil from permeable substrates.
DESCRIPTION:Dig trenches to the depth of the oil and remove oil floating on the water tableby vacuum pump or super sucker. Water flooding or high-pressure sprayingat ambient temperatures can be used to flush oil to the trench.
APPLICABLE SHORELINE TYPES:Can be used on beaches ranging in grain size from fine sand to gravel.
WHEN TO USE:When large quantities of oil penetrate deeply into permeable sediments andcannot be removed by surface flooding. The oil must be liquid enough toflow at ambient temperatures.
BIOLOGICAL CONSTRAINTS:Trenches should not be dug in the lower intertidal when attached algae andorganisms are abundant.
ENVIRONMENTAL EFFECTS:Intertidal — On gravel beaches, there may be a period of beach unstability as
the sediments are redistributed after the trenches are filled in.Subtidal — None.
6. Sediment RemovalOBJECTIVE:
Removal of surface oiled sediments.
DESCRIPTION:Oiled sediments are removed by either manually using hand tools ormechanically using various kinds of motorized equipment. The oiledmaterial must be transported and disposed of off-site.
5-51
APPLICABLE SHORELINE TYPES:Can be used on any shoreline with surface sediments. On rocky coasts, onlymanual removal is feasible. Equipment is to be used only on beaches, withspecial supervision to minimize sediment removal.
WHEN TO USE:When only very limited amounts of oiled sediments have to be removed.Should not be considered where beach erosion may result. Care should betaken to remove the sediments only to the depth of oil penetration, whichcan be difficult with heavy equipment.
BIOLOGICAL CONSTRAINTS:Mechanized equipment may be restricted when sensitive habitats are adjacent(e.g., stream mouths, tidal flats, marshes, or dunes).
ENVIRONMENTAL EFFECTS:Intertidal — The equipment is heavy, and required support personnel is
extensive. May be detrimental if excessive sediments are removed withoutreplacement. All organisms resident in the beach will be affected, thoughthe need for removal of the oil may be determined to be the best overallalternative.
Subtidal — Release of oil and fine-grained oily sediments to the water duringsediment removal activities and tidal flushing of the excavated beach surface.
7. Cold Water Flooding (Deluge)OBJECTIVE:
To wash surface oil and oil from crevices and rock interstices to water's edgefor collection.
DESCRIPTION:A large diameter header pipe is placed parallel to the shoreline above theoiled area. A flexible perforated header hose is used during deluge ofintertidal shorelines to better conform to their profiles. Ambient seawater ispumped through holes in the header pipes and flows down the beach face tothe water. On porous beaches, water flows through the substrate pushingloose oil ahead of it (or floats oil to the water's surface) then transports the oildown slope for pickup. Flow is maintained as long as necessary to removethe majority of free oil. Oil is trapped by booms and picked up with askimmer or other suitable equipment.
APPLICABLE SHORELINE TYPES:Beaches with sediments coarser than sand, and gently sloping rockyshorelines. Generally not applicable to mud, sand, vegetated, or steep rockyshorelines.
WHEN TO USE:On heavily oiled shorelines when the oil is still fluid and loosely adhering tothe substrate; and where oil has penetrated into cobble or boulder beaches.
5-52
This method is frequently used in combination with other washingtechniques (low or high pressure, cold or warm water).
BIOLOGICAL CONSTRAINTS:Not appropriate at creek mouths. Where the lower intertidal contains richbiological communities, flooding should be restricted to tidal stages when therich zones are under water, to prevent secondary oiling.
ENVIRONMENTAL EFFECTS:Intertidal — Habitat may be physically disturbed and smothered as sand and
gravel components are washed down slope. Organisms may be flushed intolower tidal zones.
Subtidal — Oiled sediment may be transported to shallow subtidal areas,contaminating them and burying benthic organisms.
8 a. Cold Water/Low Pressure WashingOBJECTIVE:
Remove liquid oil that has adhered to the substrate or man-made structures,pooled on the surface, or become trapped in vegetation.
DESCRIPTION:Low pressure washing with ambient seawater sprayed with hoses is used toflush oil to the water’s edge for pickup. Oil is trapped by booms and picked upwith skimmers or sorbents. Can be used with a deluge system on beaches toprevent released oil from re-adhering to the substrate.
APPLICABLE SHORELINE TYPES:On heavily oiled gravel beaches, rocky coasts, riprap and seawalls where theoil is still fresh and liquid. Also, in marshes and mangroves where free oil istrapped.
WHEN TO USE:Where adhered oil is still fresh and must be removed due to continuedrelease of oil.
BIOLOGICAL CONSTRAINTS:May need to restrict use of flushing to certain tidal elevations so that theoil/water effluent does not drain across sensitive low tide habitats. Inmarshes, use only at high tide and either from boats or the high-tide line toprevent foot traffic in vegetation.
ENVIRONMENTAL EFFECTS:Intertidal — If containment methods are not sufficient, contamination may
be flushed into lower intertidal zone.Subtidal — Oiled sediment may be transported to shallow subtidal areas,contaminating them and burying benthic organisms.
8 b. Cold Water/High Pressure WashingOBJECTIVE:
Remove oil that has adhered to hard substrates or man-made structures.
5-53
DESCRIPTION:Similar to low pressure washing except that water pressure is up to 100 psi.High pressure spray will better remove oil that has adhered to rocks. Becausewater volumes are typically low, may require placement of sorbents directlybelow treatment areas.
APPLICABLE SHORELINE TYPES:Rocky shores, riprap, and seawalls. Can be used to flush floating oil or looseoil out of tide pools and between crevices on rocky shores.
WHEN TO USE:When low pressure washing is not effective at removal of adhered oil, whichmust be removed due to continued release of oil. When directed water jetcan remove oil from hard to reach sites. To remove oil from man-madestructures for aesthetic reasons.
BIOLOGICAL CONSTRAINTS:May need to restrict use of flushing to certain tidal elevations so that theoil/water effluent does not drain across sensitive low tide habitats.
ENVIRONMENTAL EFFECTS:Intertidal — Removes many organisms on the surface. May drive oil deeper
into the substrate if water jet is improperly applied. If containment methodsare not sufficient, contamination may be flushed into lower intertidal zone.
Subtidal — Oiled sediment may be transported to shallow subtidal areas,contaminating them and burying benthic organisms.
9. Warm Water/Moderate-to-High Pressure WashingOBJECTIVE:
Mobilize thick and weathered oil adhered to rock surfaces prior to flushing itto the water’s edge for collection.
DESCRIPTION:Sseawater heated up to 100° is applied at moderate to high pressure tomobilize weathered oil that has adhered to rocks. The warm water may besufficient to flush the oil down the beach. If not, "deluge" flooding andadditional low or high pressure washing can be used to float the oil to thewater’s edge for pickup. Oil is trapped by booms and picked up withskimmers or sorbents.
APPLICABLE SHORELINE TYPES:Rocky shores, gravel beaches, riprap, and seawalls that are heavily oiled.
WHEN TO USE:When the oil has weathered to the point that low pressure washing with coldwater is not effective at removal of adhered oil, which must be removed dueto continued release of oil. To remove oil from man-made structures foraesthetic reasons.
BIOLOGICAL CONSTRAINTS:Must restrict use to certain tidal elevations so that the oil/water effluent doesnot drain across sensitive low tide habitats (damage can result from exposure
5-54
to oil, oiled sediments, and warm water). Should be restricted adjacent tostream mouths, tide pool communities, and similar rich intertidalcommunities.
ENVIRONMENTAL EFFECTS:Intertidal — Can kill or remove most organisms. If containment methods are
not sufficient, contamination may be flushed into lower intertidal zonesthat would otherwise not be oiled.
Subtidal — Oiled sediment may be transported to shallow subtidal areas,contaminating them and burying benthic organisms.
10. Hot Water/High Pressure WashingOBJECTIVE:
Dislodge trapped and weathered oil from inaccessible locations and surfacesnot amenable to mechanical removal.
DESCRIPTION:Water heaters mounted offshore on barges or small land-based units heatwater up to 170°F, which is usually sprayed by hand with high pressurewands. Used without water flooding, this procedure requires immediate useof vacuum (vacuum trucks or super suckers) to remove the oil/water runoff.With a deluge system, the oil is flushed to the water surface for collectionwith skimmers or sorbents.
APPLICABLE SHORELINE TYPES:Rocky shores, gravel beaches, riprap, and seawalls that are heavily oiled.
WHEN TO USE:When the oil has weathered to the point that even warm water at highpressure is not effective at removal of adhered oil, which must be removeddue to continued release of oil. To remove oil from man-made structures foraesthetic reasons.
BIOLOGICAL CONSTRAINTS:Restrict use to certain tidal elevations so that the oil/water effluent does notdrain across sensitive low tide habitats (damage can result from exposure tooil, oiled sediments, and hot water). Should be restricted near streammouths, tide pool communities, etc. Released oil must be recovered toprevent further oiling of adjacent environments.
ENVIRONMENTAL EFFECTS:Intertidal — All attached organisms in the direct spray zone will be removed
or killed, and significant mortality of the lower intertidal communities willresult even when used properly. Where the intertidal community is rich,the tradeoff between damage to the intertidal community from the hotwater washing versus potential damage from leaving the oil has to beweighed.
Subtidal — Oiled sediment may be transported to shallow subtidal areas,contaminating them and burying benthic organisms.
11. Slurry Sand Blasting
5-55
OBJECTIVE:Remove heavy residual oil from solid substrates.
DESCRIPTION:Use of sandblasting equipment to remove oil from the substrate. May includerecovery of used (oiled) sand in some cases.
APPLICABLE SHORELINE TYPES:Seawalls and riprap. Equipment can be operated from boat or land.
WHEN TO USE:When heavy oil residue is remaining on the shoreline, which needs to becleaned for aesthetic reasons, and even hot water wash is not effective.
BIOLOGICAL CONSTRAINTS:Not to be used in areas of oyster/clam beds, or areas with high biologicalabundance on the shoreline directly below or adjacent to the structures.
ENVIRONMENTAL EFFECTS:Intertidal — Complete destruction of all organisms in the intertidal zone.Subtidal — Possible smothering of subtidal organisms with sand. When the
used sand is not recovered, introduces oiled sediments into the subtidalhabitat.
12. Vacuum
OBJECTIVE:Remove free oil pooled on the substrate or from the water surface insheltered areas.
DESCRIPTION:Use of a vacuum unit with a suction head to recover free oil. The equipmentcan range from small portable units which fill individual 55-gallon drums tolarge supersuckers that are truck-mounted and can lift large rocks. Can beused with water spray systems to flush the oil towards the suction head.
APPLICABLE SHORELINE TYPES:Can be used on any shoreline type if accessible. May be mounted offshore onbarges, onshore on trucks, or as individual units on boats or ashore at lowtide.
WHEN TO USE:When free, liquid oil is stranded on the shoreline (usually along the high-tideline) or trapped in vegetation which is readily accessible.
BIOLOGICAL CONSTRAINTS:Special restrictions should be identified for areas where foot traffic andequipment operation should be limited, such as rich intertidal communities.Operations in wetlands are to be very closely monitored, with a site-specificlist of restrictions.
ENVIRONMENTAL EFFECTS:Intertidal — Minimal impacts if used properly and minimal substrate isremoved.
5-56
Subtidal — None.
Treatment Methods Requiring RRT ApprovalResearch and development is ongoing for both new and improved oil spill
treatment methods. Various chemical and biological degradation techniques are
currently being tested for effectiveness and toxicity, and they may be approved for
use in certain situations. Methods considered to be of potential use in this area are
described below.
13. Cutting VegetationOBJECTIVE:
Removal of oiled vegetation to prevent oiling of wildlife.
DESCRIPTION:Manual cutting of oiled vegetation using weed eater, and removal of cutvegetation with rakes. The cut vegetation is bagged immediately for disposal.
APPLICABLE SHORELINE TYPES:Marshes composed of emergent, herbaceous vegetation.
WHEN TO USE:Use when the risk of oiled vegetation contaminating wildlife is greater thanthe value of the vegetation that is to be cut, and there is no less destructivemethod to remove or reduce the risk to acceptable levels.
BIOLOGICAL CONSTRAINTS:Strict monitoring of the operations must be conducted to minimize thedegree of root destruction and mixing of oil deeper into the sediments. Accessto bird nesting areas should be restricted during nesting season.
ENVIRONMENTAL EFFECTS:Intertidal — Removal of the vegetation will result in loss of habitat for many
animals. Cut areas will have reduced plant growth for up to two years.Along exposed section of shoreline, the vegetation may not regrow,resulting in erosion and permanent loss of the habitat. Trampled areas(which is inevitable) will recover much slower.
Subtidal — Long term impacts would be increased sediment load in thesubtidal area as a result of increased erosion in the intertidal area.
14 a. Chemical Oil Stabilization with Elastomizers
OBJECTIVE:Solidify or gelatinize oil on the water surface or a beach to keep it fromspreading or escaping.
DESCRIPTION:Chemical agent enhancing polymerization of the hydrocarbon moleculesapplied by semi-liquid spray or as a dry chemical onto the oil in the proper
5-57
dosage. Depending on the nature and concentration of the polymerizingagent, the oil can be rendered viscoelastic, but still fluid, gelatinous, orsemisolid. The primary purpose is to stabilize the oil keeping it fromspreading or escaping, causing oiling elsewhere. May reduce the solubility ofthe light (and more toxic) fractions, by locking them into the polymer. Thisreduces both air and water exposure. Depending on the beach type andequipment used, recovery may be enhanced. Elastol is an example of an oilstabilizing agent.
APPLICABLE SHORELINE TYPES:Suitable on shorelines of low permeability where heavy oil has pooled on thesurface, except vegetated shorelines.
WHEN TO USE:When heavy concentrations of liquid oil are on the substrate and adjacentwater body, and physical removal can not be completed prior to the next tideso that the oil is likely to move to a more sensitive shoreline type. Should beused in conjunction with booming or other physical containment.
BIOLOGICAL CONSTRAINTS:Not suitable for vegetated or riprap shore types. Should be avoided whenbirds or other wildlife that may be more adversely impacted by the congealedoil can not be kept away from the treated shoreline. The congealed oil maystick to vegetation and wildlife, increasing physical damage to both. On riprapthe congealed oil may remain in crevices where it may hamper recovery andprolong the release of sheens.
ENVIRONMENTAL EFFECTS:May enhance the smothering effect of oil on intertidal organisms. Thus, thetreatment should be considered only for heavily oiled beaches wheresmothering effects are already maximal. The congealed oil may stick tovegetation and wildlife increasing physical damage, such as impaired flight inbirds or impaired thermoregulation in mammals and birds whose feathers orfur become oiled.
14 b. Chemical Protection of Beaches
OBJECTIVE:Pretreat shoreline to prevent oil from adhering to the substrate.
DESCRIPTION:Certain types of water-based chemicals, some of which are similar incomposition to dispersants, are applied to beaches in advance of the oil.
APPLICABLE SHORELINE TYPES:Coarse- and fine-grained sand beaches, seawalls and piers (particularly piers orwaterfront facilities that are of historical significance), eroding bluffs, wave-cut platforms, and riprap.
5-58
WHEN TO USE:When oil is projected to impact an applicable shoreline, particularly thosewhich have high recreational or aesthetic value.
BIOLOGICAL CONSTRAINTS:May not be suitable for nutrient-rich environments, particularly in confinedwaters. The toxicity of shoreline treatment products is reportedly much lessthan that of oil, but the toxicity of each product should be evaluated prior toconsideration for use.
ENVIRONMENTAL EFFECTS:The long-term environmental effects of these procedures are unknown. Atoxic effect of the chemical can be anticipated. Additionally, the nutrient loadto nearshore and interstitial waters may lead to eutrophication. Whether thepredicted reduced residence time of the oil on the beach will increase thesurvival rate for sessile and interstitial organisms is unknown.
14 c. Chemical Cleaning of Beaches
OBJECTIVE:To increase the efficiency of oil removal from contaminated areas.
DESCRIPTION:Special formulations which can be characterized as weak dispersants areapplied to the substrate, as a presoak and/or flushing solution, to softenweathered or heavy oils to aid in the efficiency of flushing treatmentmethods. The intent is to be able to lower the temperature and pressurerequired to mobilize the oil from the substrate.
APPLICABLE SHORELINE TYPES:On any shoreline where deluge and water flushing procedures are applicable
WHEN TO USE:When the oil has weathered to the point where it will not flow using warmto hot water. This approach may be most applicable where flushing decreasesin effectiveness as the oil weathers.
BIOLOGICAL CONSTRAINTS:Will required extensive biological testing for toxicity and water qualitysampling prior to receiving approval for use. The concern is that the treatedoil will be dispersed in the water column, and thus impact water column andsubtidal organisms. Field tests will be required to show that use of a beachcleaner does not reduce overall recoverability of the oil. Use may be restrictedwhere suspended sediment concentrations are high, adjacent to wetlands andtidal flats, and near sensitive subtidal resources.
ENVIRONMENTAL EFFECTS:If more oil is dispersed into the water column, there could be more oil sorbedonto suspended sediments and transfered to subtidal habitats, particularlyalong sheltered shorelines. Intertidal habitats might survive better, if coolerwater temperatures are possible.
5-59
15. In Situ Burning
OBJECTIVE:Removal of oil from the shoreline by burning.
DESCRIPTION:Oil on the shoreline is burned, usually when it is on a combustible substratesuch as vegetation, logs, and other debris. Oil can be burned off ofnonflammable substrates with the aid of a burn promoter.
APPLICABLE SHORELINE TYPES:On any shoreline type except tidal flats.
WHEN TO USE:Early in the spill event, after ensuring that the product is ignitable.
5-60
BIOLOGICAL CONSTRAINTS:Should only be considered for use in the upper intertidal or supratidal zonessince destruction of plants and animals from heat and burn promoters will beextensive. This technique is subject to restrictions and permit requirementsestablished by federal, state and local laws. It should not be used to burnPCB's, wastes containing more than 1,000 ppm of halogenated solvents, orother substances regulated by EPA.
ENVIRONMENTAL EFFECTS:Little is known about the relative effects of burning oiled wetlands comparedto other techniques or natural recovery. Burning may cause significant airpollution, which must be considered when weighing the potential benefitsand risks of the technique. The combustion products may travel greatdistances before deposition.
16. Nutrient Enhancement
OBJECTIVE:To speed the rates of natural microbial degradation of oil by addition ofnutrients (specifically nitrogen and phosphorus). Microbial biodegradation isthe conversion by microorganisms of dissolved and dispersed hydrocarbonsinto oxidized products via various enzymatic reactions. Some hydrocarbonsare converted to carbon dioxide and cell material, while others are partiallyoxidized and/or left untouched as a residue.
DESCRIPTION:Nutrients are applied to the shoreline in one of several methods: solubleinorganic formulations which are dissolved in water and applied as a spray atlow tide, requiring frequent applications; slow-release formulations which areapplied as a solid to the intertidal zone and designed to slowly dissolve; andoleophilic formulations which adhere to the oil itself, thus they are sprayeddirectly on the oiled areas.
APPLICABLE SHORELINE TYPES:Could be used on any shoreline type where safe access is allowed.
WHEN TO USE:On moderately to heavily oiled shorelines, after other techniques have beenused to remove as much oil as possible; on lightly oiled shorelines whereother techniques are not effective; and where nutrients are a limiting factor innatural degradation.
BIOLOGICAL CONSTRAINTS:Not applicable in shallow water, restricted embayments where nutrientoverloading may lead to eutrophication, or where toxicity of nutrients,particularly ammonia, is of concern. There must be no risk of oxygendepletion. Use is to be restricted adjacent to stream mouths, tide pools, etc.Contact toxicity of oleophilic formulations may restrict areas of directapplication. Bioassay test results should be carefully evaluated, as otherchemicals in the formulations could be toxic to aquatic organisms.
5-61
ENVIRONMENTAL EFFECTS:Tests in Alaska showed that interstitial oxygen concentrations did notdecrease to such an extent that it limited the supply of oxygen available to thebacteria. The fertilizer applications that increased nutrient concentrations andmicrobial activity did not harm the nearshore environment. About 99percent of butoxyethanol, a toxic component of the Inipol formulation, (thefertilizer commonly used in Alaska) degraded to nontoxic compounds within24 hours after Inipol treatments of cobble shorelines. Researchers also foundno evidence that the nutrients released from the treated shorelinesstimulated algal blooms.
17. Microbial Addition
OBJECTIVE:To speed the rates of natural microbial degradation of oil by addition ofnutrients and microbial products. Microbial biodegradation is the conversionby microorganisms of dissolved and dispersed hydrocarbons into oxidizedproducts via various enzymatic reactions. Some hydrocarbons are convertedto carbon dioxide and cell material, while others are partially oxidized and/orleft untouched as a residue.
DESCRIPTION:Formulations containing hydrocarbon-degrading microbes and fertilizers areadded to the oiled area. The argument is made that indigenous organismswill be killed by the oil, so new microbial species need to be added to being theprocess of biodegradation.
APPLICABLE SHORELINE TYPES:Could be used on any shoreline type where safe access is allowed.
BIOLOGICAL CONSTRAINTS:Not applicable in shallow water, restricted embayments where nutrientoverloading may lead to eutrophication, or where toxicity of nutrients,particularly ammonia, is of concern. There must be no risk of oxygendepletion. Use is to be restricted adjacent to stream mouths, tide poolcommunities, etc. Bioassay test results should be carefully evaluated, as otherchemicals in the formulation could be toxic to aquatic organisms.
ENVIRONMENTAL EFFECTS:Yet to be evaluated for full-scale field applications.
5-62
18. Sediment Reworking
OBJECTIVE:Rework oiled sediments to break up the oil deposits, increase its surface area,and mix deep subsurface oil layers, which will expose the oil to naturalremoval processes and enhance the rate of oil degradation.
DESCRIPTION:Beach sediments are rototilled or otherwise mechanically mixed, with the useof heavy equipment on gravel beaches. The oiled sediments in the upperbeach area may also be relocated lower on the beach to enhance naturalcleanup during reworking by wave activity (berm relocation).
APPLICABLE SHORELINE TYPES:Should be used only on beaches exposed to significant wave activity. Tilling-type activities work best on beaches with a significant sand fraction; largeequipment can be used to relocate sediments up to boulder size.
WHEN TO USE:On beaches with significant amounts of subsurface oil, where sedimentremoval is unfeasible (due to erosion concerns or disposal problems); alsowhere surface oil deposits have started to form pavements or crusts.
BIOLOGICAL CONSTRAINTS:Could not be used on beaches near shellfish-harvest or fish-spawning areas,or near bird nesting or concentrations areas because of the potential forconstant release of oil and oiled sediments. Sediment reworking should berestricted to the upper part of the beach, to prevent disturbance of thebiological communities in the lower intertidal area.
ENVIRONMENTAL EFFECTS:Intertidal — Due to the mixing of oil into sediments, this process could
further expose organisms which live below the original layer of oil.Repeated mixing over time could delay the reestablishment of organisms.Relocated sediments would bury and kill organisms. There may be a periodof beach unstability as the relocated sediments are redistributed.
Subtidal — There is a potential for release of contaminated sediments to thenearshore subtidal habitats.
19. Shoreline Excavation, Cleansing and ReplacementOBJECTIVE:
To remove and clean oiled sediments, then place them on the beach.
DESCRIPTION:Oiled sediments are excavated using heavy equipment on the beach at lowtide. The sediments are loaded into a container for washing. Cleansingmethods include hot water wash or physical agitation with a cleansingsolution. After the cleansing process, the rinsed materials are returned to theoriginal area. Cleaning equipment must be placed close to beaches in order toreduce transportation problems.
5-63
APPLICABLE SHORELINE TYPES:Sand- to boulder-sized beaches, depending on the limitations of the cleanupequipment. The beaches must be exposed to wave activity, so that thereplaced sediments can be reworked into a natural distribution.
WHEN TO USE:Applicable on beaches with large amounts of subsurface oil, where permanentremoval of sediment is undesired and other cleanup techniques are likely tobe ineffective.
BIOLOGICAL CONSTRAINTS:Excavating equipment must not intrude upon sensitive habitats. Only theupper and supratidal areas should be considered. Generally restricted inspawning areas. There may be site-specific constraints limiting placement oftemporary sediment storage piles,. Replaced material must be free of oil andtoxic substances. The washing must not change the grain size of the replacedmaterial, either by removal of fines or excessive breakage of friable sediments.
ENVIRONMENTAL EFFECTS:Intertidal — All resident organisms will be affected, though the need for
removal of the oil may be determined to be the best overall solution.Equipment can be heavy, large, and noisy, disrupting wildlife.Transportation to site may entail aircraft, land vehicles, or barges, whichcontribute to environmental disruption. There may be a period of beachunstability as the replaced sediments are redistributed.
Subtidal — May release oil and fine-grained oily sediments into the waterduring excavation. This is a concern due to tidal flushing of beachsediments and exposed excavations.
Other Techniques
Beach Cleaners
During the Exxon Valdez oil spill, Exxon spent considerable time and money
developing an effective and low-toxicity chemical cleaner which would speed the
removal of weathered oil from the beaches of Prince William Sound. Their
approach was to use the chemical as a presoak to be applied prior to water washing,
to soften the oil and increase removal efficiences at lower temperatures. Exxon
conducted a detailed screening program of commercially available products to find
the product which would remove the most oil but also had low dispersive
properties. It was not acceptable to have the oil removed by dispersion to the
nearshore water column.
5-64

Exxon eventually developed their own product, Corexit 9580, and conducted
extensive bioassays and field effectiveness tests in Alaska (Fiocco et al., 1991). This
product was shown to have very low toxicity, in both laboratory bioassays and in situ
testing of run-off water from full-scale field testing sites. The main concern about
the product was recoverability of the released oil; during tests, it appeared that the
released oil was dispersed more into the nearshore water than at control sites. Beach
cleaners might be appropriate for cleaning man-made structures, such as seawalls
and riprap, assuming that the oil can be recovered. Since recovery was still an issue
in the most extensive testing yet conducted on beach cleaners, their use without
further testing is unlikely.
Elastol
Elastol is a commercial product composed of polyisobutylene in a white powder
form. Polyisobutylene is a non-toxic constituent found in foodstuffs. Issues on
application of Elastol for oil spill response include:
• Elastol increases the resistance of spilled oil to being pulled apart or brokenup (viscoelasticity) by temporarily altering hydrocarbon molecular shape.
• The treated oil must be pulled; pushing it makes it lose its elasticproperties.
• The effects of Elastol are reversible.
• Application:
-Traditionally applied as a powder from conventional dusters
-Recently applied as a slurry mixture with a 15 percent calcium stearatecoating with water. Has consistency of "cream of wheat."
• Application rates vary with oil type, with lower rates for heavier oils:
-Light oil spills: 1000-2000 ppm
-Bunker C spills: 100-200 ppm
• Lower application rates are recommended because they allow the oil torevert back to its original condition more readily and at lower costs.
• Starts working in 15-60 minutes, with faster times for lighter oils.
• Elastol particles float, due to the coating. Dissolution occurs after mixingwith hydrocarbon liquids.
5-65
• Toxicity:
-Very low toxicity (see below)
-Lowers toxicity of oil by "binding" soluble toxic fractions into the"Elastoil" mixture.
_ _ _ _ _ _ _ _ _ _ _ _ _ _ _ _ _ _ _ _ _ _ _ _ _ _ _ _ _ _ _ _ _ _ _ _ _ _ _ _ _ _ _ _ _ _ _ _ _ _ _ _ _ _ _ _ _ __ _
Artemia salina Fundulus heteroclitusToxicant 48 hour LD50 (ppm) 96 hour LD50 (ppm)
_ _ _ _ _ _ _ _ _ _ _ _ _ _ _ _ _ _ _ _ _ _ _ _ _ _ _ _ _ _ _ _ _ _ _ _ _ _ _ _ _ _ _ _ _ _ _ _ _ _ _ _ _ _ _ _ _ __ _
Elastol >18,000 >18,000No. 2 fuel oil 600 3,2001:10 mixture(Elastol:No. 2 fuel oil) >3,200 >18,000
Seagrasses showed no toxic effects_ _ _ _ _ _ _ _ _ _ _ _ _ _ _ _ _ _ _ _ _ _ _ _ _ _ _ _ _ _ _ _ _ _ _ _ _ _ _ _ _ _ _ _ _ _ _ _ _ _ _ _ _ _ _ _ _ __ _
CONCERNS:
• Non-uniform application results in "clumping" of oil/Elastol mixtureinto highly viscous, sticky masses. Can be countered with sawdust. Butbehavior of this sticky mass when the mixture strands on the shoreline isof concern.
• Potential problems for birds, fur-bearing mammals, marshes, mangroves,etc. Do not know difference in impacts to oiled versus "Elastoiled"animals.
• Recovery is best with a specially designed drum skimmer, which must betransported to the site, causing delays.
PHYSICAL EFFECTS (based on laboratory, tank, and field tests)
• There was no simple correlation between oil type and effectiveness.
• Elastol increased these physical properties of oil:
-Viscoelasticity
-Slick thickness (only at application rates greater than 1 percent).
5-66
• Elastol decreased the extent of oil slick spreading.
• Elastol did not affect these oil properties:
-Evaporation rate
-Flash point
-Weathering rates
• Emulsion formation tendency tests have produced mixed results;formation of emulsion decreases the effectiveness of Elastol.
• Elastol reduced the effectiveness of chemical dispersants applied afterElastol use by up to a factor of 10.
• Elastol reduced natural dispersion by up to three orders of magnitude (so itcould be used to reduce oil levels in the water column in shallow waterconditions).
Observations from a test of Elastol on a heavy black oil spill in New York harbor on
26 December 1988, as recorded by Ed Levine, the NOAA SSC, are:
“Approximately 25 minutes after application of Elastol B to the oil athickening of product was observable. At this time the vacuum hose wasused to begin removing the product from the creek. Due to the amount offloating debris included in the oil, a problem was encountered with cloggingof the nozzle by this debris, however, at this time it was not significantlygreater than non-treated oil.
...“After approximately one hour from the original application of Elastol, wechanged the removal sites to the lee of the floating dock. The productencountered here was quite thick and exhibited stretch lines as the vacuumnozzle was applied to it. The oil could be observed migrating towards thevacuum source. The nozzel was then moved to an area of untreated oil. Amarked difference in the thickness and behavior of the oil could be noted.This oil was approximately the consistency of water, while the treated oil waslike thick molasses. Also noted was the increased recovery of water with theuntreated oil, as opposed to the treated oil, which removed mostly oil.”
Although Elastol has had very little field testing, it appears to work as advertised.
Recovery is still a problem, as is the case for any type of spilled hydrocarbon.
5-67
Bioremediation
Bioremediation should be considered in the context of the entire suite of spill
treatment technologies, including the option of no treatment. Only when there is a
clear reason for using bioremediation should its potential use be pursued.
Bioremediation is considered promising because it enhances natural biodegradation,
which occurs in most areas where oil is spilled. In fact, in areas that are lightly oiled,
natural, unassisted biodegradation may be the best "treatment." The key question to
ask in these circumstances is, Can bioremediation offer an improvement over
natural levels of biodegradation? It will probably be necessary to conduct a small-
scale test of the proposed bioremediation technique to answer this question.
Bioremediation is most promising as a long-term treatment, so there should be no
hurry to attempt to rush through an evaluation procedure during the first few
hours after a spill occurs. Alternate techniques exist for immediate spill response
that have been tried and tested more extensively. If a need for longer-term
shoreline treatments is identified, then bioremediation can still be considered
effectively days or weeks after the spill event.
Before becoming involved in the details of protocols and planning considerations, it
may be useful to step back for a moment and evaluate the three main types of
bioremediation currently being considered for oil spill response: fertilizer
application, microbial additions, and open-water applications.
FertilizerUse of fertilizer for accelerating biodegradation on oiled shorelines is the most well-
documented and well-researched type of bioremediation. Many aspects of the
technology are promising, particularly its potential use in areas that would be
affected detrimentally by more intrusive physical treatments. However, the variable
results from field tests confirm that this is not yet an off-the-shelf technique that can
be applied to oiled shorelines with the expectation of success in all cases. Perhaps
the most enlightening aspect of many of the studies of fertilizer use is that
unassisted biodegradation does occur at high rates in many locations, and that the
no-treatment option perhaps should be considered more frequently.
5-68
Bioremediation with fertilizer is complicated, because natural biodegradation rates
vary considerably (from days to months) depending on the environment and the oil
in question. Temperature is an important consideration, as is the amount of organic
matter and nutrients, salinity, and oxygen. This means that caution must be
exercised when applying results from one area to an application in another
environment. Like most other treatment technologies, decisions will probably need
to be made on a case-by-case basis. What works in one situation may not be effective
or may be inappropriate for another situation. Monitoring should be conducted to
verify the effectiveness of the application, and to document any adverse impacts.
Fertilizer may be most appropriately considered in the following situations, if it is
determined that nutrients may be limiting:
Sheltered shorelines that are heavily oiled, when techniques for physicalremoval of the oil are impractical or infeasible, or have already been attempted;
Shorelines with substantial subsurface oil that may degrade very slowly. (In thiscase, increased oxygen may need to be supplied to the subsurface);
Sensitive environments, especially marshes and wetlands that will be impactedadversely by other cleanup methods.
Fertilizer will be inappropriate in circumstances such as the following:
Environments that are already nutrient-rich (nutrients are not limiting in thesecases—see Prall's Island discussion). This can be tested by measuring backgroundnutrient levels before beginning a bioremediation experiment.
For short term, immediate response actions. Usually, physical techniques willfirst be used to remove as much oil as is feasible, and then fertilizer may beconsidered for longer-term, follow-up treatment.
5-69
Microbial products
Use of microbial products for treatment of open environments is still an
experimental technology. Few microbial products can show increased degradation
over use of fertilizer alone when tested under standardized laboratory conditions.
No data that currently exist show that microbes increase biodegradation in open
environments when they are compared with use of fertilizer alone. The same
environmental constraints that affect fertilizer treatments also apply to microbial
products, with the added uncertainty of whether the supplemental microbes will
survive and become active in a foreign environment. Microbial products would
theoretically be useful in environments that are lacking indigenous microbes, but
this has not been the case at most environments studied in the context of marine oil
spills.
At this time, the use of microbial products in open environments for treatment of
oiled shorelines should be considered for experimental testing purposes only.
Further, until the National Environmental Technology Applications Corporation
(NETAC) protocols are in place, a considerable burden of evaluating unknown
products rests with the spill responder. The decision on whether to use microbial
products should be made only after careful evaluation of the products available, and
after evaluating data on their toxicity and effectiveness. Without reliable data on
the effectiveness and potential toxicity of a microbial product, it will be impossible to
make an informed decision on its application in the marine environment.
Open-water. Open-water bioremediation is presently the least promising
bioremediation technology. Since bioremediation is a long-term process which does
not begin to significantly degrade oil until a period of several days to several weeks
after exposure to oil, it is questionable whether it could work on an oil slick. Much
of the initial loss of oil in slicks is through evaporation, and it is doubtful that
biodegradation is actively occurring during this time period (since the volatile
fractions of the oil are toxic to bacteria). Thus, a bioremediation product, whether
fertilizer or microbial, would have to become active during a window of time after
the volatile fractions of the oil have evaporated and before the oil has formed
weathered compounds that are more resistant to biodegradation. The
bioremediation product must also stick to the oil and remain at the surface-water
interface for an extended period of time.
5-70
The unknown questions about open-water bioremediation will be difficult to
answer due to the logistical problems of conducting research on oil slicks. The long
history of attempting to document the effectiveness of dispersants also applies to
open-water bioremediation techniques. Controlled field studies under real oil spill
conditions are extremely difficult to conduct, and research on intentionally spilled
oil even more so. Since open-water use of bioremediation is highly experimental,
and many substantial questions still need to be answered, this technology should
presently not be considered in any situation other than a research context.
Monitoring recommendationsThere is no single measure that will accurately measure effectiveness or toxicity of a
bioremediation application. Most of the larger bioremediation monitoring
programs that have been undertaken have used a combination of the techniques
discussed, depending on their specific concerns and objectives (DuPont 1991; Prince
et al. 1990; Pritchard et al. 1991). For example, the Alaska studies measured several
different parameters for toxicity, water quality and effectiveness (See Table 5-4). As a
minimum, a monitoring plan at a bioremediation field test or application should
include at least the following endpoints:
1) To measure effectiveness, track changes in indicator hydrocarbon compounds bygas chromatography/mass spectroscopy (GC/MS). Samples should be collected atleast at the beginning and end of the sampling period at control and treated sites.
2) Conduct toxicity testing using bioassays to determine acute and/or chronictoxicity to aquatic organisms (see NETAC protocols for examples.) Bioassaysshould include sediment bioassays if the bioremediation chemicals are likely tolodge in sediments. Testing should include test sites and control sites.
3) Monitor environmental impacts to aquatic habitats through chemical analysis ofsediments or water for potentially toxic compounds (such as heavy metals) thatmay be part of a bioremediation product. Samples should be collected at thebeginning and end of the sampling period at control and treated sites.
Biodegradation versus bioremediationBiodegradation is the natural process whereby bacteria or other microorganisms
alter and break down organic molecules into other substances, such as fatty acids and
carbon dioxide. Bioremediation is the act of adding fertilizers or other materials to
contaminated environments, such as oil spill sites, to accelerate the natural
biodegradation process (U.S. Congress 1991). Bioremediation is also used in
5-71
terrestrial and other applications, including sewage treatment, terrestrial oil spills,
and experimentally for hazardous wastes.
Three main types of bioremediation technologies are currently being developed or
applied for treatment of oil spills: addition of fertilizer to oiled shorelines, addition
of microbial products to oiled shorelines, and addition of fertilizer and/or microbial
products to open water oil slicks. Since all of these technologies attempt to accelerate
biodegradation, this report presents a short summary of the processes of
biodegradation of oil, a discussion of some of the potential uses of this technology,
including specific instances where bioremediation has been applied at oil spills, and
presents guidelines for evaluation and monitoring of bioremediation applications.
How does biodegradation work?Biodegradation is one of the main ways in which spilled oil is weathered. It occurs
in most environments, but at varying rates, depending on localized environmental
conditions and on the composition of the oil (for example, heavier oils are more
resistant to biodegradation than lighter oils)
(Atlas 1975). Among the many environmental factors that will affect biodegradation
rates, oxygen, nutrients, and temperature are probably the most important (Atlas
1981; DeFlaun and Mayer 1983).
Simply adding oil to an environment will stimulate growth of indigenous microbes,
since the oil provides increased amounts of carbon, the microbes' food source (Lee
and Levy 1991). Several researchers have documented a lag period before
indigenous microbial communities begin to degrade oil (Fusey and Oudot 1984;
NOAA 1980). This may be due to the fact that oil is initially toxic to microbial
organisms, and the most toxic fractions must be weathered before microbes can
grow, a time period of several days to several weeks (Lee and Levy 1989b).
The primary processes of microbial degradation are aerobic (requiring oxygen),
though anaerobic degradation may occur at very low rates. Low-energy, sheltered
environments probably have the lowest rates of biodegradation, especially in
subsurface sediments. Oil in anaerobic sediments in marshes or other
environments may degrade very little, with oil persisting in some cases for several
years (Delaune et al. 1980; Atlas 1981; Lee and Levy 1991). High-energy
environments usually show rapid biodegradation, in part because of physical
5-72
weathering, but also because wave action supplies oxygen and nutrients to the
microbial communities, facilitating biodegradation (Lee and Levy 1989a). See the
OTA report for a thorough discussion of the chemical processes of biodegradation
(U.S. Congress 1991).
Microbial populations that undergo rapid growth in the presence of spilled oil may
become limited by inadequate amounts of nutrients, such as nitrogen and/or
phosphorus. Field tests on biodegradation of a waxy crude oil (Terra Nova crude) in
sandy beaches found that fertilizer addition was effective in accelerating
biodegradation in areas that were heavily oiled, but less so in areas that were lightly
oiled (little acceleration was measured in these areas). This was due to the fact that
unassisted biodegradation occurred very rapidly in the lightly oiled areas (Lee and
Levy 1991). Nutrients are less likely to be limiting to microbial population growth
in the water column for degradation of suspended oil particles, than for oil on
shorelines or concentrated in oil slicks (Atlas 1981).
At extremely high salinities, biodegradation is inhibited (Ward and Brock 1978), but
this is not likely to be a problem in the normal range of salinities usually
encountered in marine and coastal environments (Lee and Levy 1989a).
5-73
Types of bioremediation
Nutrient addition (fertilizer)The theory behind bioremediation by nutrient addition is simple: microbes already
living on an impacted shoreline have a sudden new source of food—carbon
compounds in the spilled oil. After the initial toxicity of the oil wears off (usually by
evaporation of the volatile compounds) and after indigenous species of
hydrocarbon-degrading microbes become acclimated, they begin to "eat" the oil, and
their population grows. At this point, the sudden increase in numbers of microbes
may deplete existing supplies of nutrients (specifically nitrogen and/or phosphorus)
and this may limit further growth of the microbial population. With added
nutrients, the microbial population can continue to increase, and degrade oil at a
faster overall rate, than without the supplemental nutrients.
Numerous laboratory studies on fertilizer enhancement of oil biodegradation by
naturally occurring microbes have concluded that fertilizer enhancement has
potential as a treatment technique for oiled shorelines (NOAA 1978; Atlas 1981; Lee
and Levy 1987; Lee and Levy 1989a). Field experiments have also been conducted,
but these have not always corroborated the laboratory results (Fusey and Oudot 1984;
Lee and Levy 1991). Results from field tests are less clear, in part because it is
difficult to actually measure biodegradation outside of the laboratory. It is also
difficult to determine statistical differences in biodegradation rates between control
areas and fertilized areas in the field due to environmental variability and high
spatial variability in the distribution of oil in sediments of impacted areas. It also
appears that biodegradation rates can vary substantially between environments,
probably due to environmental factors such as temperature or other very localized
conditions (Prince et al. 1990; DuPont 1991; Pritchard et al. 1991).
The potential advantages of any bioremediation technique must be balanced against
possible detrimental environmental effects, including introduction of
contaminants, toxicity to aquatic organisms, and physical impacts. Some fertilizer
products, whose primary use is in a terrestrial setting, may contain trace metals as
micro-nutrients (e.g., copper or mercury) that would be introduced into an aquatic
environment with potentially much more significant toxicological effects (Mearns
1991). Others may produce by-products such as ammonia and/or nitrates that are
toxic to aquatic organisms at certain concentrations (U.S. EPA 1989). Intertidal
organisms that are directly exposed during application of the undiluted fertilizer
5-74
solution may be adversely impacted. In addition, physical disturbance from the
application process and from monitoring will have some impacts on the shoreline,
especially in sensitive environments such as marshes.
Fertilizer use is still experimental in marine environments; therefore, any
application should include a monitoring program to determine whether the desired
objectives have been met, and whether any adverse impacts have been minimized
to acceptable levels of risk. Following are summaries of different types of fertilizers
and application techniques that have been used in bioremediation experiments or
applications.
Types of fertilizers
Fertilizer addition can involve a variety of application techniques and numerous
commercial fertilizer products, some that have been developed specifically for use
on oil spills, and others that have been adapted from agricultural or domestic use.
These products can be grouped into three basic categories: soluble inorganic
fertilizers, oleophilic fertilizers, and slow release fertilizers. Each is discussed in
more detail below.
Soluble inorganic fertilizers. Inorganic fertilizers include a wide variety of
water-soluble lawn or agricultural fertilizers that can be mixed with seawater and
sprayed on shorelines. These fertilizers can be formulated with different ratios of
nitrogen and phosphorus and usually include small quantities of trace elements.
Some advantages of inorganic fertilizers are that they are readily available,
inexpensive, and usually consist of compounds with well known properties.
However, since these fertilizers are water-soluble, they may be washed off the
shoreline by tidal action, requiring frequent, repeated applications. There may also
be some direct toxicity (i. e. burning) to plants or animals in the intertidal zone that
are directly impacted during the application process.
Oleophilic fertilizers. Oleophilic fertilizers were developed to solve the
problem of fertilizers washing off rocks or beaches. Oleophilic (literally, "oil-
loving") fertilizers are chemically "sticky" and adhere to oil on rocks or other
substrates. In theory, these fertilizers are designed to remain at the oil-water
interface and are therefore readily accessible to oil-degrading microbes. In Prince
5-75
William Sound, Alaska, the oleophilic fertilizer Inipol EAP 22 was applied
extensively to oiled shorelines and was investigated in several monitoring studies.
Inipol contains oleic acid (a source of carbon), urea (a source of nitrogen),
tri(laureth-4)-phosphate (a surfactant), and 2-butoxy-ethanol (another surfactant)
(Pritchard et al. 1991). Since addition of oil alone will stimulate bacterial growth, the
presence of oleic acid in the fertilizer complicates evaluation of the effectiveness of
oleophilic fertilizers such as Inipol. Do these products appear to work better because
the microbes are eating the carbon in the fertilizer instead of the spilled oil? Lee and
Levy (1989b) concluded that addition of an oleophilic fertilizer to a low-energy beach
contaminated with crude oil was ineffective as a bioremediation agent because the
microbes were preferentially eating the organic components of the fertilizer instead
of the oil.
Several scientists have argued that Inipol appears to be effective because it is acting
primarily as a chemical surfactant rather than as a bioremediation agent.
Surfactants, such as the ones in Inipol, are found in cleaning agents and dispersants.
Inipol contains approximately 10% 2-butoxy ethanol, a common ingredient in
household cleaning agents, and also one of the ingredients in the dispersant Corexit
9527 (Exxon 1989a; Keyser 1991; Exxon 1989b). Critics have argued that some of the
dramatic visual effects noted during field observations using oleophilic fertilizers
are a result of the surfactant properties of the fertilizer, rather than from stimulated
biodegradation.
Several components of Inipol are toxic to humans and other organisms at certain
concentrations. These include 2-butoxy-ethanol, and urea, which produces
ammonia when it comes in contact with water. 2-butoxy-ethanol is toxic to
mammals, especially in the first 48 hours after application. Effects on humans
include eye and skin irritation, and damaged blood cells with repeated exposure.
This requires that special safety precautions be taken for workers who handle Inipol,
such as wearing clothing (rubber boots and aprons) or respirators if exposure to
fumes or dust is likely (Exxon 1989b).
Slow-release fertilizers . Slow-release fertilizers are designed to release
quantities of fertilizer over a longer period of time, and to remain in the area where
they are applied. They include various brands of fertilizer mixes, packaged in
5-76
dissolvable capsules or briquettes. These formulations, in theory, release small
quantities of nutrients slowly over a period of time. While briquettes may move
about on the beaches with tidal action, granules will usually lodge among pebbles
and cobbles and remain in the intertidal zone. In this way, the dosage of fertilizer is
controlled at low levels and release of fertilizer to the subsurface may be facilitated as
granules work their way down into sediments.
Several brands of slow-release fertilizers were tested in Prince William Sound in
1989 by EPA, and one granule product, Customblen™, was subsequently applied
extensively on shorelines (Pritchard et al. 1991). Customblen contains nutrients
(ammonium nitrate, calcium phosphate, and ammonium phosphates) encased in a
polymerized vegetable oil (Prince et al. 1990). Assuming that the pellets remain in
the intertidal zone, Customblen does not need to be applied as frequently as liquid
fertilizers. Some possible disadvantages include the possibility that pellets may
wash away or lodge at the high tide zone on high-energy beaches. Concentrations of
pellets higher than the recommended application could collect in one location (such
as a tidal pool) and create concentrations of ammonia that could be toxic to aquatic
organisms.
5-77
Fertilizer applications
Exxon ValdezMarch 1989 - 1991
In March 1989, approximately 350 miles of shoreline in Prince William Sound were
oiled with North Slope crude oil from the Exxon Valdez spill (Pritchard and Costa
1991). In the early summer, following preliminary results from a bioremediation
test program conducted by the EPA's Alaska Oil Spill Bioremediation Project, the
Alaska RRT approved the use of fertilizer as bioremediation to treat oiled
shorelines. A number of constraints were placed on the use of fertilizer, including a
restriction to areas that were well-flushed, and a prohibition from applying fertilizer
in sensitive areas such as near anadromous fish streams. The decision on whether
to apply bioremediation to specific shorelines was made on a segment-by-segment
basis. In 1990, continued use of bioremediation as a shoreline treatment was
approved with the requirement that a monitoring program be conducted to evaluate
the effectiveness and safety of the bioremediation applications (U.S. Congress 1991;
Prince et al. 1990; Pritchard et al. 1991).
The studies conducted in 1989 and 1990 in Prince William Sound were
comprehensive and investigated the effectiveness of different types of fertilizers at
several sites, including several test and control plots. Monitoring also included
sampling and analysis of various water quality parameters and toxicity testing (Table
5-4; Prince et al. 1990; Pritchard et al. 1991).
Effectiveness: Though several articles published about the bioremediation studies
in Prince William Sound have claimed dramatic and successful results (Pritchard
and Costa 1991), a careful evaluation of the data leads to a more cautious conclusion
(Kellogg 1991). Though studies conducted in both years were carefully designed and
included control plots, all of the data had high levels of variability, making it
difficult to determine overall differences between fertilized plots and control plots.
1989 Studies: In 1989, one of two treated test plots in Passage Cove (treated with
water-soluble fertilizer applied with sprinklers) showed statistically significant
differences in oil residue weight when compared with the control site. The second
test site (treated with Inipol and Customblen) did not show a significant difference
in oil residue weight compared with the control site. (Measures of oil residue
5-78
weight varied at all sites by up to two orders of magnitude.) Microbial counts
showed no significant differences in numbers of microbes between treated and
control plots. However, significant differences were found between numbers of
bacteria at oiled sites versus unoiled sites, demonstrating that the presence of oil by
itself will stimulate microbial growth (Pritchard et al. 1991).
At a second study conducted in 1989 at Snug Harbor, measurements of oil residue
weight over time were highly variable among all plots, including control plots.
(Values ranged over an order of magnitude.) Decreasing trends in oil residue
weight were found at all plots, including the control plot. No data showing
statistical comparisons were presented, but there did not appear to be strong
differences between control and treated plots in oil residue weight loss over time.
Gas chromatograph analyses showed degradation rates that appeared to be higher at
treated sites (Pritchard et al. 1990; Pritchard et al. 1991).
1990 Studies: The studies conducted in 1990 encountered the same problem as those
in 1989 with highly variable distributions of oil in sediments. This resulted in such
high levels of variability in measures of oil residue weight, that detecting differences
by quantitative analysis was deemed impossible without greatly increased numbers
of samples (approximately an order of magnitude greater; Prince et al. 1990).
Analyses using gas chromatography that tracked specific compounds showed
qualitatively that biodegradation was occurring, but differences between control and
treated sites were difficult to detect. Overall results of effectiveness were
inconclusive.
There are several reasons why the results from both years were somewhat
inconclusive: background rates of biodegradation were found to be "surprisingly
high" at control plots; second, there could be strong differences in local
environmental conditions that either favor or inhibit biodegradation at each
individual site. Further, a process of declining returns would be expected in 1990,
since most of the remaining oil was weathered, and thus more
5-79
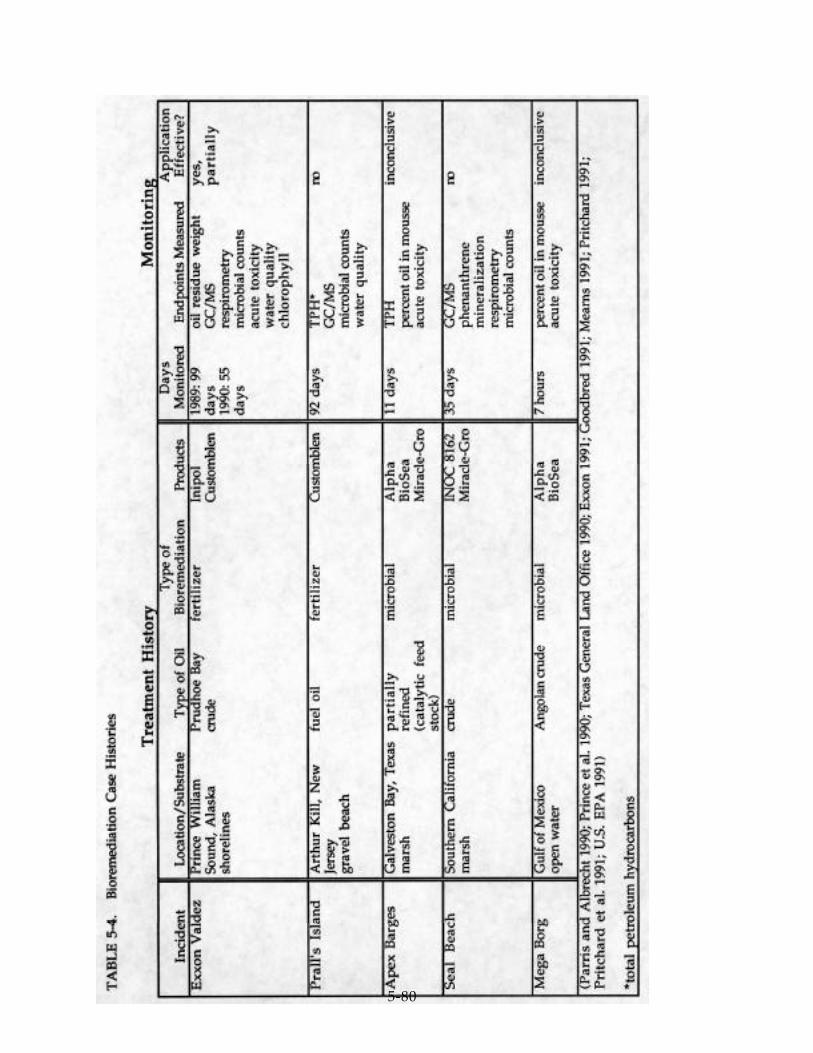
5-80
resistant to biodegradation. These studies can be interpreted as showing that s ome
fertilized sites showed trends with increased rates of biodegradation, with stronger
evidence of effectiveness in the first year.
Toxicity: Bioassays conducted using oyster and mussel larvae showed some acute
toxicity, while bioassays using mysids showed no acute effects. These were
conducted with water samples from beaches after treatment with both Inipol and
Customblen (Sanders and Gray 1989; Prince et al. 1990; Pritchard et al. 1991). No
chronic toxicity tests were conducted, nor were analyses made for sediment toxicity
or direct toxicity of Inipol to intertidal organisms.
Prall's Island, New JerseyJune 1990 - December 1990
In January 1990, a pipeline at the Exxon Bayway refinery in Linden, New Jersey
broke. Fuel oil was spilled into the Arthur Kill waterway, contaminating a beach on
the Prall's Island bird sanctuary. Most of the oil was removed by physical means, but
these efforts were halted in March 1990, partly to avoid impacts to migrating birds
using the area. Exxon Research and Engineering received permission to conduct a
bioremediation experiment on part of the beach with remaining oil (DuPont 1991).
The experiment used a slow-release fertilizer (Customblen) placed in two shallow
trenches dug in the intertidal zone. In an attempt to get around the usual high
variability in distribution of oil on the beach, bags of beach substrate containing
known concentrations of oil were buried in each test plot. Samples from each of
these bags were measured for total petroleum hydrocarbons (TPH) at the end of the
experiment to compare rates of biodegradation (DuPont 1991). Microbial counts
made on beach samples taken before fertilization showed high background levels of
microbes in the test area. Background levels of nitrogen and phosphorus were also
high when measured prior to the beginning of the experiment (DuPont 1991).
5-81
Effectiveness: The overall results showed no clear trends of increased rates of
biodegradation from fertilized plots. This was, in part, due to the high variability in
the levels of TPH measured in soils and sampling bags from all plots, including the
control plot. Some problems were experienced with possible cross-contamination of
the control plot (nutrients leaching from the treated plots into the control plot), and
this may have obscured any differences between them. The fact that high numbers
of microbes were measured in the substrate before the fertilizer treatment began may
be an indication that background levels of biodegradation were naturally high. This
is not surprising since Prall's Island has been chronically impacted by oil spills in the
past, and indigenous microbial populations may be well adapted to the presence of
hydrocarbons. Also, the previously existing high levels of nitrogen and phosphorus
would suggest that nutrients may not be a limiting factor in this system.
Toxicity: Though no bioassays were conducted as part of this experiment, levels of
ammonia in offshore and interstitial waters were generally below levels that would
be toxic to aquatic organisms (EPA 1989). Levels of dissolved oxygen in offshore
waters and in the interstitial waters of the test plots were monitored throughout the
experiment. Ammonia levels were highest in the lower intertidal areas of the
treated plots, ranging from 4-10 ppm, while levels at the control plot ranged from 0-
2 ppm.
Microbial productsAdding microbes to contaminated areas, also known as "seeding," is conducted to
enhance biodegradation of an oil-impacted area with selected strains of microbes
that are known to be capable of degrading hydrocarbons. However, the effectiveness
of adding microbes to the environment to enhance biodegradation is not well
supported in the scientific literature (Atlas 1981). In fact, studies indicate that
addition of microbes to an open environment probably does not increase
biodegradation because "foreign" strains of bacteria, out-competed by indigenous
species, disappear quickly from the microbial community (Lee and Levy 1989b).
No strain of bacteria, whether indigenous or from a product application, is likely to
degrade oil actively until after the most toxic components of the oil have evaporated
(Lee and Levy 1987). Therefore, claims of "instant success" from microbial products
should be regarded with skepticism. The argument is made that indigenous
organisms will be killed by the oil, so new microbial species need to be added to
begin the process of biodegradation. In fact, studies have found that most areas of
5-82

the world contain some microbes that are capable of degrading oil, and that these
usually grow rapidly when they have acclimated to an oil spill (Lee and Levy 1989a).
Currently, no genetically engineered microorganisms are being considered for use in
bioremediation (U.S. Congress 1991).
To date, few objective scientific studies have been conducted that have tested
microbial products currently on the market. The most comprehensive was
conducted by Venosa et al. (1991a, 1991b) of the EPA Office of Research and
Development in Cincinnati. In brief, the lab study compared the biodegradation of
weathered Prudhoe Bay crude oil using individual applications of 11 microbial
products and fertilizer alone at 15˚C. Two products showed a statistically significant
increase in biodegradation over fertilizer. However, these products performed as
well with sterilized (dead microbes) as with live microbes. Both of the two highest
performers were then tested in a controlled, replicated field test in Alaska. In the
field, no significant difference in oil residue weight or total resolvable alkanes could
be detected among the control plots, the fertilized plots, or the plots treated with
microbial products. (See also the discussion below on the results from Seal Beach.)
Most microbial products either contain or recommend use of some type of fertilizer,
so the concerns about potential toxicity discussed in the section on fertilizer should
be considered here as well. In addition, concerns have been raised about microbial
products that contain strains of bacteria that are potential human or animal
pathogens. Other chemicals that are possibly part of microbial products (such as
binders or surfactants), could also be toxic to aquatic organisms. Therefore, bioassays
or other toxicity testing should be conducted as part of monitoring.
5-83
Microbial applications
Apex Barges, TexasAugust 1990
A collision between three Apex barges and the tanker Shnoussa occurred on July 28,
1990, spilling approximately 700,000 gallons of a partially refined oil into Galveston
Bay. Shorelines and marshes along the northern shore of the Bay were
contaminated by the oil approximately one week after the initial spill. The Texas
Water Commission received approval from the Region 6 RRT to conduct a trial
application of a microbial bioremediation product (Alpha BioSea) to a contaminated
marsh (Mearns 1991). RRT approval was given under certain guidelines, including
that the application be done only in areas where mechanical recovery of oil was not
feasible, and that a scientifically sound monitoring program be conducted. The
Texas Water Commission carried out the monitoring program with consultation
from NOAA and EPA representatives who also acted as on-site observers.
On August 5 the pre-mixed solution containing the microbial product and a
nutrient mix was applied to the marsh by a high-pressure hose from a small boat.
Samples of water and sediment were collected both before treatment and at
approximately 24, 48, and 96 hours after the treatment. Additional samples were
collected at 9,10, and 11 days after the intitial application. All samples were sent to
an EPA laboratory for analysis.
Effectiveness: No noticeable differences between treated and untreated plots could
be discerned in samples collected 48 hours after treatment. Results from EPA-
analyzed samples are not yet available, but samples analyzed by NOAA using gas
chromatography/mass spectroscopy showed no apparent changes in the relative
abundances of specific compounds in the oil before and after treatment. Many
problems experienced in the monitoring program prevented the collection of useful
information and made the results of the experiment unclear. These problems
included poor control over application of the product, disturbance of the test areas by
livestock and numerous human activities, and a too-short period of sample
collection after the application (Table 5-4; Mearns 1991).
These results are not surprising for several reasons. First, since Galveston Bay is
chronically impacted by oil spills, one could expect that indigenous populations of
5-84
bacteria would be well adapted for hydrocarbon degradation. Therefore, it is
questionable whether additional microbes were needed in this environment.
Second, the short period of the monitoring could probably not have measured any
acceleration in biodegradation rates if it had in fact occurred, since biodegradation
usually does not begin until several days or weeks after a spill. Third, there is no
way to separate any effects due to the microbial product from effects due to the
fertilizer. Fourth, the feed stock oil was already in a degraded form (Mearns 1991).
The Alpha BioSea product should have been tested first in the laboratory to
determine if it could accelerate biodegradation when compared with fertilizer alone.
Toxicity: Water samples collected after the application were tested and found to be
acutely toxic to mysids. Additional concerns about potential toxic effects of trace
metals in the nutrient mix were raised by Mearns (1991).
Seal Beach, CaliforniaNovember 1990
A well blowout offshore of Seal Beach, California occurred on October 31, 1990,
releasing approximately 400 gallons of crude oil into the atmosphere, resulting in
the oiling of approximately two to three acres of marsh grasses in the Seal Beach
National Wildlife Refuge (U.S. Department of the Interior 1990; U.S. EPA 1991b).
Bioremediation treatment with a microbial product plus fertilizer was undertaken
one week after the blowout, followed by an application of fertilizer alone two weeks
later. Treatment consisted of hand spraying of grass blades with a combination of a
microbial product used in sewage treatment plants (INOC 8162) and a commercial
fertilizer (Miracle Gro 30-6-6). Samples of unoiled, oiled, and treated, and oiled grass
were collected and analyzed by the EPA Environmental Research Laboratory in Gulf
Breeze, Florida (U.S. EPA 1991b).
Effectiveness: The results of a number of laboratory tests performed on samples
taken from the marsh showed no differences between oiled and treated grasses and
oiled grasses with no treatment. Measures of degradation included most probable
number counts of bacteria and 14C mineralization, a relative measure of
biodegradation rate. In addition, a laboratory study was performed by EPA to
compare the ability of the INOC product to degrade Prudhoe Bay crude oil with
uninoculated (nutrient only) controls. After 7 and 16 days of incubation, little or no
5-85

difference was found in the amount of four indicator compounds in the flask
containing the product compared with the control flask. Thus, the microbial
product was not effective in accelerating biodegradation of oil under controlled
laboratory conditions (U.S. EPA 1991b).
Toxicity: The U.S. Fish and Wildlife Service has collected samples of plants and
invertebrates and intends to analyze these tissues for presence of hydrocarbon
compounds (Goodbred 1991). These analyses have not yet been performed, and no
other toxicity testing has been reported to date.
Open-water bioremediationStudies from the early 1970s in laboratory and simulated large tank situations have
investigated the use of addition of fertilizer on open water oil slicks (Atlas and
Bartha 1973). However, to date, no studies have evaluated use of bioremediation
(microbial or fertilizer) in an open ocean situation. From a research viewpoint, it is
still unknown whether bioremediation would be effective on a recently spilled,
open-water oil slick.
Biodegradation in the water is thought to occur at the water surface (Lee and Levy
1989a). Therefore, any product or nutrient added would need to stay at this interface
and follow the oil slick as it moves. For bioremediation to be successful on open
water, the nutrients or products would have to remain with the oil slick for the time
it takes microbes to become acclimated to the oil and to begin biodegrading.
As in shoreline applications, the question has been raised, Do bioremediation
products applied on open water actually act as dispersants or surfactants,
redistributing oil into the water column? If this is the case, should these products
then be considered dispersants and not bioremediation agents? (If these products are
considered dispersants, they are covered by separate regulations.)
The same concerns for potential toxicity that have been discussed for use of
fertilizers and microbes on shorelines also apply to open-water applications. The
dilution factor is likely to be much greater on open water, however, and this is likely
to lessen the risk from direct toxic effects. As with dispersants, monitoring will
present very real difficulties, including formidable logistics for applications,
5-86
measurements or observations, and the difficulty of collecting samples that will
provide meaningful data.
Open-water applications
Mega Borg, TexasJune 1990
The Mega Borg spill in 1990 is the only known application of a microbial product to
an open-water oil slick in the United States. The Mega Borg supertanker was
transferring its cargo of Angolan crude oil at a location approximately 60 nautical
miles off the coast from Galveston, Texas, when an explosion caused a fire and
subsequent release of oil. Oil was released continuously for nine days. The Region 6
RRT gave approval to the Texas Water Commission to conduct an experimental,
open-water application of a microbial product to the slick. The microbial product
was applied from a Coast Guard vessel twice, 6 and 9 days after the initial explosion.
Sampling was conducted from a Texas A&M University research vessel and
included samples of surface water and subsurface samples from 1 and 9 m depths.
Three of these samples were sent to the EPA Gulf Breeze Lab for toxicity testing
(Parrish and Albrecht 1990; Research Planning 1991).
Several problems were encountered during the experiment, including interference
by skimmers working in the same area where the first application was made, and
logistical problems with the sampling vessel, resulting in no sample collection
during the first application. A dispersant test was also conducted during this spill
(Payne et al. 1991), causing further competition for logistics platforms.
Effectiveness: Results from the percentage of oil found in samples of mousse from
surface water were inconclusive since no differences could be detected between
samples collected before and after the bioremediation application. As stated by the
Texas General Land Office report: "The high variability in these samples...
demonstrates the difficulty of obtaining comparative and consistently representative
samples in the open ocean, and the unequal mixing of the oil on the water surface."
(Texas General Land Office 1990 p.10).
The Texas General Land Office relied heavily on visual observations made several
hours after the application to evaluate the experiment (Texas General Land Office
5-87
1990). Since it is unlikely that microbial activity could have begun this quickly after
application (see background discussion), it is likely that the observed visual changes
in the appearance of the slick were caused by physical processes such as dispersion.
This experiment demonstrates both the difficulties inherent in attempts to conduct
open-water experiments and the inconclusive results that can be expected from
open-water bioremediation.
Toxicity: Results of the EPA Gulf Breeze Lab's acute (96 hour) bioassays performed
on silversides and mysids showed no acute effects, but the researchers questioned
whether the samples were actually collected in an area impacted by the oil slick,
since no trace of oil was found in the samples (Parrish and Albrecht 1990). The
bioremediation product was not directly tested for toxicity.
Evaluation of bioremediation technologiesThe EPA Interim Guidelines provide guidance for establishing protocols for the use
of bioremediation in spill response, and include several sections relating to
evaluation of bioremediation techniques and products. The Guidelines offer a
comprehensive discussion of feasibility assessment, screening of bioremediation
agents, logistics, and monitoring. A useful guide for screening of bioremediation
proposals or plans are the seven points of concern listed in section 1-2 of the
guidelines (EPA 1991a.)
For screening specific bioremediation products, a four-tiered protocol is being
developed by the National Environmental Technology Applications Corporation
(NETAC) for standardized testing and evaluation of bioremediation products.
(These protocols are in appendix B of the Interim Guidelines). The NETAC
protocols include preliminary screening, laboratory testing (including toxicity
testing), microcosm testing, and field testing. When in place, bioremediation
products will be required to pass through these tiers in order to be approved for
consideration at oil spills. These protocols are still in the development stage and are
expected to be finalized in approximately one year.
Since bioremediation is not yet a fully developed, off-the-shelf technology, a
preliminary evaluation should be undertaken prior to the development of spill
response plans, such as those suggested in the Interim Guidelines. This evaluation
5-88
should determine whether certain bioremediation techniques have reached a stage
where they are ready to be considered for use in spill response, or for experimental
testing, or not at all.
Following the NETAC approach using sequential evaluation tiers, a similar process
can be applied to the bioremediation techniques discussed in this report, considering
them as technologies in various stages of development. These can be looked at
through four "evaluation tiers" as follows:1) Is the technique supported in theoretical research?2) Has the technique been tested in the laboratory?3) Has the technique undergone small-scale field testing?4) Has the technique been applied in an open environment on a large
scale with monitoring?
RationaleThe rationale for these tiers is as follows: a technique should first be shown to be
effective in the lab, where conditions can be controlled. This should represent an
ideal case for proving, through scientific methods, that a technique works as
intended. However, a technique which is proven to be effective in the lab may not
be equally effective under field conditions, which are much more variable and
unpredictable. Certainly, if the performance of a product is poor in the lab, then
more research and refinement of the product needs to be done before it should be
considered for field application. Only when a technique has been shown to work in
lab and field tests should it be considered for a larger-scale application. If a technique
cannot be shown to work in controlled lab and field tests, it is more appropriately
considered in a research context than in a response context.
Evaluation tiers1) The first tier is the theoretical research and development of the idea and theory
behind the technology. At the present time, all of the three proposedapplications for bioremediation at marine oil spills have some basis in researchtheory, though this is more strongly supported for some applications (fertilizer)than for others (microbial seeding and open-water bioremediation).
2) The second tier is testing the technology and proving that it works effectivelyunder controlled laboratory conditions. Fertilizer has been repeatedly shown tobe effective in laboratory flask tests, while only a few microbial products havebeen shown to be effective in lab tests (conducted by laboratories other than thoseof the manufacturing company). Open-water applications have not beensuccessfully tested under controlled conditions.
5-89
3) The third tier is a small-scale field test in an open environment. Both fertilizerand microbial bioremediation have undergone field testing, with mixed results.Results from two field tests with microbial products did not show increaseddegradation over fertilizer (U.S. EPA 1991b; Venosa et al. 1991b). Field tests usingfertilizer alone have been shown to increase biodegradation in some plots, butnot with overall statistical significance (Prince et al. 1990; DuPont 1991; Pritchardet al. 1991). Results from the open-water bioremediation application at the MegaBorg yielded no conclusive results about effectiveness of open-water applications(Texas General Land Office 1990).
4) The fourth tier is equivalent to a response action, i.e., large-scale field applicationwith monitoring. In normal circumstances, a technique would have successfullypassed through the first three tiers before any considerations were made for largescale applications. However, due to the unplanned nature of oil spill response inthe past, many techniques were tried before previous evaluation tiers had beencompleted. For example, fertilizer was applied on a large scale as part oftreatment of shorelines in Prince William Sound in conjunction with smaller-scale field tests. Neither microbial applications to shorelines nor open-waterbioremediation have been made in other than in small, experimentalcircumstances.
In several cases, decision makers and oil spill responders have been asked toconsider large-scale bioremediation applications in open environments withouthaving any information about prior scientific research or laboratory testing of theparticular technique. Such attempts to rush into use of a potentially untested orinvalid bioremediation technique are unfortunate in that they usually result inconfusion about effectiveness, and risk an unsuccessful application ofbioremediation. Worse, such attempts could divert resources away from otherpotentially more effective cleanup treatments, and could potentially add negativeimpacts to environments already affected by an oil spill.
MonitoringSince all forms of bioremediation are still experimental in open environments, and
because local environmental conditions will affect how a particular technique
works, a monitoring program should be set up with any bioremediation application
to determine whether the technique is working as intended. The monitoring
process may be more costly than the application itself, and this should be weighed
with other factors when considering whether to use bioremediation as part of a spill
response.
5-90
To be effective, monitoring should be well planned and include carefully selected
control sites. Replicate sampling of all test and control plots should be included
when possible. Important factors to consider when setting up a monitoring program
include the questions to be asked, the endpoints to be measured for answering these
questions, the type of samples to be collected, where the samples will be collected,
and the time frame for sampling. (See EPA Interim Guidelines for further
discussions on monitoring).
Questions to be addressed by monitoringOne of the most basic parts of a monitoring program is to define clearly which
questions or concerns the program is being designed to answer. Nearly always these
will include, Is this technique effective? Or, Did the technique accelerate the rate of
biodegradation of oil in the area of concern relative to an untreated control? In this
case, a measure of the biodegradation rate is necessary, so that the rates in the treated
area can be compared with rates in a similar, untreated area. Another major
concern is, Are there detrimental effects from the treatment? Usually the potential
for toxicity to aquatic organisms will be a concern for resource agencies and, in some
cases, other potential environmental effects such as eutrophication or physical
impacts from sampling. Additional questions may be posed, depending on the
situation. All such questions must be formulated in advance so that the monitoring
program can be designed to gather the data necessary for addressing the issues of
concern. After the basic questions are identified, endpoints can be chosen and a
sampling plan developed.
Sampling endpoints
5-91
Endpoints are a specific definition of what is meant by a general term like effective.
What, exactly, will be used to determine whether a technique is effective? The
endpoints to be measured should be selected in advance to avoid confusion when
interpreting monitoring results. In general, it is better to avoid reliance on
qualitative measures such as "visual differences," which are very difficult to
interpret, and may vary depending on the observer.
Some specific endpoints are discussed below for measuring...
1) biodegradation2) toxicity3) other environmental effects
1) BiodegradationMeasuring biodegradation is not a simple task, and it has become a central part ofmonitoring for effectiveness of bioremediation techniques. Most of themeasures that have been used in bioremediation experiments involve laboratorytests performed on samples collected in the field. These are relative measures,but they are the best that are available at the present time.
a. Visual observations: Visual observations can indicate a number of processes,such as dispersion, movement of oil from the surface, oil attaching to substratein a product (such as cornstarch, an additive in some microbial products), photo-oxidation (a physical process), or other weathering processes. There is no way todetermine what a visual change represents without corroboration from morespecific measurements. Visual observations are also very difficult to standardizebetween observers. (See discussion of Apex Barges, Mega Borg and Alaskaincidents).
b. Total petroleum hydrocarbons: A commonly used method for measuring theoverall reduction of oil at a bioremediation test site is to take sediment samplesbefore bioremediation and again some time after application and measure thesefor total petroleum hydrocarbons (TPH). (This is also referred to as oil residueweight).
Consistently, studies measuring TPH have been unable to detect differencesbetween sites because of high spatial variability in the distribution of oil insediments (Prince et al. 1990). Therefore, TPH has in most cases, not proveduseful for determining effectiveness of bioremediation.
The difference between starting and ending concentrations of TPH measures notonly loss of hydrocarbons from biodegradation, but also losses from physicalweathering. Further, TPH does not provide information on the toxicity of theremaining components of the oil. Despite these drawbacks, TPH is still proposed
5-92
as a measure of effectiveness in bioremediation experiments because it providesa gross indicator of the amount of remaining oil, and it is less costly than other,more detailed chemical analyses such as gas chromatography.
c. Gas chromatography: Many experts in the field recommend the use of gaschromatography and mass spectroscopy to characterize the biodegradationprocess, since the use of measures of total residue (such as TPH) are many timesnot adequately informative (Walker et al. 1976; Prince et al. 1990). Gaschromatography can trace patterns of specific compounds that are only brokendown by microbial processes, thus tracking biodegradation separately fromphysical weathering. Examples of indicator compounds that are used in this wayare hopane compounds and the ratio of C18 to phytane. Gas chromatographywill also indicate what percentage of the oil is made up of the more toxiccomponents. Gas chromatography is, however, more expensive than other,more gross chemical measures, and this will limit the number of samples thatcan be analyzed.
d. Microbial counts: Methods such as most probable number counts (MPN)estimate the number of microbial cells in a sediment sample. These types ofcounts are accurate only within an order of magnitude, and are not a measure ofmicrobial activity, but only of the number of microbial bodies. (Some percentageof microbes are usually in a dormant state.) Microbial counts can be used as arough indication of the microbial population in an area, and to determinewhether the microbial population has grown in response to a bioremediationapplication.
e. Mineralization: A widely used measure of microbial activity is 14Cmineralization. This is a relative index of bacterial activity with specificsubstrates, not an absolute measure total oil degradation (Lee and Levy 1989a).Sediment samples are collected from test plots and brought to the laboratorywhere the biodegradation rates of the microbes in the sample are measured.Studies using mineralization include the two Alaska experiments (Prince et al.1990; Pritchard et al. 1991) and Seal Beach (U.S. EPA 1991b). In these cases,mineralization rates were quite variable between samples and between sites, butsome trends could be discerned, showing higher rates at some treated sitescompared with rates at control sites.
2) ToxicityToxicity can be monitored by collecting water samples and analyzing for specificcompounds or by conducting bioassays. Many bioremediation monitoringprograms have measured water samples for concentrations of ammonia or otherchemicals of concern (Alaska studies, Prall's Island). Acute bioassays will give agood indication of immediate toxic effects to aquatic organisms. (Acute tests wereperformed in Alaska and at the Apex Barges incident). Chronic bioassays areimportant for assessing long-term, non-lethal effects, and may be indicated inlong-term treatments or treatments involving repeated applications.
5-93
3) Other environmental effects:Other possible environmental effects that may be of concern includeeutrophication in offshore waters or other detrimental effects on water quality.Eutrophication is not likely to be a problem in well-flushed systems, or over ashort time period in sheltered environments. Studies in Prince William Soundand at Prall's Island found no elevated levels of nutrients offshore of treatedbeaches (DuPont 1991; Pritchard et al. 1991). Eutrophication can be monitored bymeasuring levels of nutrients and dissolved oxygen in offshore waters before andafter treatment applications.
Sampling designAn appropriate sampling design helps ensure that the data collected provide
answers to the initial questions posed in the monitoring plan. Sampling may be
simple or very complex, but it should correspond to the objectives of the
monitoring. Sample design includes consideration of control sites, number of
samples, locations of sample collection, timing of sampling, and sample handling
and analysis. It is more useful to take a few carefully thought-out samples than to
take numerous samples without proper planning and follow-through.
Controls
Sampling controls are an essential part of any scientific experiment. Since
bioremediation is an acceleration of biodegradation over the background rate, it is
necessary to know the background rate for comparison. Without a comparison
value, there is no way to tell whether bioremediation was successful, or whether it
was a superfluous exercise. Since the state of the art of bioremediation is still
evolving, any open-environment application should be considered experimental,
and should require a control. Data collected without controls will be of limited
utility for assessing effectiveness.
In some cases, recognized standards or criteria exist that can be used as comparison
values for measuring toxicity or other adverse environmental impacts. Values such
as EPA ambient water quality criteria, or sediment toxicity standards can serve this
function.
Usually a control will consist of a sample plot that is as similar to the test plot as
possible, but far enough away so that it will not be influenced by the treatment. At
the Prall's Island experiment, the control site was located adjacent to treated sites on
5-94
both sides, and it is likely that nutrients from the treated sites leached into the
control site, thereby contaminating it.
Ideally, the control plot should be treated identically to the treated plot, except for the
actual treatment. For instance, if the treatment involves sprinkling the area with
fertilizer mixed with seawater, the control should be sprinkled with seawater
without fertilizer. A different type of control was exemplified by the use of bags of
sediment with known quantities of oil planted in test sites at Prall's Island. This was
a promising idea that attempted to address the problem of high spatial variability of
oil distribution in sediments. Unfortunately, in this case it did not yield the desired
result (less variability in the data). But the concept could be experimented with and
refined further.
How many samples? The number of samples to be collected depends on the
question being asked, on the kind of data analysis to be done, and on the resources
available. A larger number of samples often allows greater power for statistical
analysis, but will be more costly. One strategy is to collect a large number of samples
in the field and then to analyze only a subset of the samples collected, depending on
the initial results. A small number of samples will provide an indication of the
processes occurring, but may not be representative of the entire study area.
Where to sample? Where samples should be collected is tied closely to the number
of samples and to the sample analysis. Often, the sample area is divided into
sections based on conditions such as oiling (e.g., heavily oiled, lightly oiled,
unoiled), or substrate type (e.g. cobble, gravel). A representative sample is then
collected from each section. The Alaska studies in 1989 conducted tests at two sites,
one heavily oiled and one moderately oiled, then sub-divided one site into plots of
cobble and gravel substrate (Pritchard et al. 1991).
When possible, avoid taking samples in areas with outside influences that may
confound the results, such as areas near outfalls or freshwater streams. Samples
taken in the middle of the plot will usually be more representative than samples
taken along the edge. Another method is to lay a grid pattern over a map of the test
area and choose samples randomly in each designated area.
5-95
Timing of sample collection: The appropriate time frame for collecting samples will
depend on the questions being addressed. For example, for monitoring the
effectiveness of bioremediation on a beach, samples could be collected before
application, soon after application, and at several subsequent intervals of several
weeks' duration. In contrast, if monitoring for toxicity, the time scale will likely be
much shorter, probably immediately after application and at several subsequent
times hours after application (4 hours, 8 hours, etc.). The Galveston Bay monitoring
program was an example of a time frame that was probably too short for monitoring
biodegradation, though it was appropriate for monitoring toxicity. (See Table 5-4 for
comparison of monitoring time frames).
Analysis and protocol for handling samples: The laboratory designated to conduct
the analysis should be consulted prior to sampling to ensure that samples are
handled appropriately.
Monitoring recommendationsThere is no single measure that will accurately measure effectiveness or toxicity of a
bioremediation application. Most of the larger bioremediation monitoring
programs that have been undertaken have used a combination of the techniques
discussed, depending on their specific concerns and objectives (DuPont 1991; Prince
et al. 1990; Pritchard et al. 1991). For example, the Alaska studies measured several
different parameters for toxicity, water quality and effectiveness (See Table 5-4). As a
minimum, a monitoring plan at a bioremediation field test or application should
include at least the following endpoints:
1) To measure effectiveness, track changes in indicator hydrocarboncompounds by gas chromatography/mass spectroscopy (GC/MS). Samplesshould be collected at least at the beginning and end of the samplingperiod at control and treated sites.
2) Conduct toxicity testing using bioassays to determine acute and/or chronictoxicity to aquatic organisms (see NETAC protocols for examples.)Bioassays should include sediment bioassays if the bioremediationchemicals are likely to lodge in sediments. Testing should include test sitesand control sites.
3) Monitor environmental impacts to aquatic habitats through chemicalanalysis of sediments or water for potentially toxic compounds (such asheavy metals) that may be part of a bioremediation product. Samples
5-96

should be collected at the beginning and end of the sampling period atcontrol and treated sites.
5-97
References
American Petroleum Institute. 1982. Oil Spill Response: Options For MinimizingAdverse Ecological Impacts. American Petroluem Institute Publication No. 4398.Washington, DC. 98 pp.
Atlas, R. M. 1981. Microbial degradation of petroleum hydrocarbons: anenvironmental perspective. Microbiol. Reviews (45): 180-209.
Atlas, R. M. 1975. Effects of temperature and crude oil composition on petroleumbiodegradation. Appl. Microbiol. (30): 396-403.
Atlas, R.M. and R. Bartha. 1973. Stimulated biodegradation of oil slicks usingoleophilic fertilizers. Environ. Sci. and Technology (7): 538-541.
Bobra, M., P. Kawamura, M. Fingas, and D. Velicogna. 1987. Mesoscale applicationand testing of an oil spill demulsifying agent and Elastol. Ottawa, Ontario, Canada:Environment Canada. 41 pp.
Breuel. 1981. Oil Spill Cleanup and Protection Techniques for Shorelines andMarshlands. Park Ridge, New Jersey: Noyes Data Corp. 404 pp.
Cairns, J., Jr. and A.L. Buikema, Jr., (eds.). 1984. Restoration of Habitats Impacted byOil Spills. Butterworth Publishers, Boston, Mass. ???pp.
Canevari, G.P. 1969. The role of chemical dispersants in oil cleanup: in D.P. Hoult,(Ed), Oil on the Sea. New York: Plenum Press. pp. 29-51.
CONCAWE. 1987. A Field Guide To Coastal Oil Spill Control And Clean-upTechniques. The Hague, The Netherlands. 112 pp.
Cormack, D., W.J. Lynch, and B.D. Dowsett. 1986/87. Evaluation of dipsersanteffectiveness. Oil and Chem. Poll. (3): 87-103.
DeFlaun, M. R. and L. M. Mayer. 1983. Relationships between bacteria and grainsurfaces in intertidal sediments. Limnol. Oceanogr. (28):873-881.
Delaune, R.D., G.A. Hambrick III, and W.H. Patrick, Jr. 1980. Degradation ofhydrocarbons in oxidized and reduced sediments. Marine Poll. Bull. (11): 103-106.
DuPont Environmental Remediation Services. 1991. Final Report Prall's IslandBioremediation Project. Florham Park, New Jersey: Exxon Research andEngineering.
ERCE and PENTEC. 1991. Evaluation of the condition of intertidal and shallowsubtidal biota in Prince William Sound following the Exxon Valdez oil spill and
5-98
subsequent shoreline treatment. Seattle: Hazardous Materials Response andAssessment Division, National Oceanic and Atmospheric Administration. TwoVolumes.
Exxon Corporation. 1989a. Material Safety Data Sheet, Inipol EAP 22. Houston:Exxon Company, U.S.A. July 28, 1989.
Exxon Corporation. 1989b. Material Safety Data Sheet, Corexit 9527. Houston: ExxonChemical Company. October 25, 1989.
Fingas, M., I. Bier, M. Bobra, and S. Callaghan. 1991b. Studies on the physical andchemical behavior of oil and dispersant mixtures. Proceedings of the 1991 Oil SpillConference, March 4-7, 1991, San Diego, California, pp. 419-426.
Fingas, M.F., R. Stoodley, N. Stone, R. Hollins, and I. Bier. 1991a. Testing theeffectiveness of spill-treating agents: laboratory test development and initial results.Proceedings of the 1991 Oil Spill Conference, March 4-7, 1991, San Diego, California,pp. 411-414.
Fiocco, R.J. and seven others. 1991. Development of Corexit 9580–A chemical beachcleaner. Proceedings of the 1991 Oil Spill Conference, March 4-7, 1991, San Diego,California, pp. 395-400.
Fusey, P. and J. Oudot. 1984. Relative influence of physical removal andbiodegradation in the depuration of petroleum-contaminated seashore sediments.Marine Pollution Bulletin (15): 136-141.
Geraci, J.R. and D.J. St. Aubin. 1982. Study of the effects of oil on cetaceans. ReportBLM/YL/SR-82/01. Washington, D.C.: Bureau of Land Management, U.S.Department of the Interior. 274pp.
Goodbred, S., Environmental Contaminants Specialist, U.S. Fish and WildlifeService, Laguna Niguel, California, personal communication, July 31, 1991.
Hayes, M.O., E.R. Gundlach, and C.D. Getter. 1980. Sensitivity ranking of energy portshorelines. Proceedings of the Specialty Conference on Ports ‘80, May 19-20, 1980,Norfolk, Virginia, pp. 697-708.
Hayes, M.O., J. Michel, and B. Fichaut. 1991. Oiled gravel beaches: A special problem.Proceedings of the Specialty Conference on Oil Spills, Management and LegislativeImplications, published by American Society of Civil Engineers. pp.444-457.
Interagency Shoreline Cleanup Committee. 1989. Field Shoreline TreatmentManual. Valdez, Alaska: Prepared by National Oceanic and Atmospheric Admin.,Alaska Department of Environmental Conservation, Alaska Department of Fish
5-99
and Game, U.S. Fish and Wildlife Service, U.S. Environmental Protection Agency,and Exxon.
Kellogg, S.T. 1991. Review of 1990 Bioremediation Monitoring Program FinalReport. Memo to State of Alaska Department of Environmental Conservation,February 11, 1991. Moscow, Idaho: University of Idaho. 23 pp.
Keyser, G.E. 1991. Bioremediation in Prince William Sound. DRAFT. Valdez,Alaska: Regional Citizens' Advisory Council. May 14, 1991.
Lee, K. and E.M. Levy. 1991. Bioremediation: waxy crude oils stranded on low-energy shorelines. Proceedings of the 1991 Oil Spill Conference, March 4-7, 1991, SanDiego, California, pp. 541-547.
Lee, K. and E. M. Levy. 1989a. Biodegradation of petroleum in the marineenvironment and its enhancement. In: Aquatic Toxicology and Water QualityManagement, J. O. Nrigau and J. S. S. Lakshminarayana (eds.). New York: JohnWiley & Sons. pp. 218-243
Lee, K. and E. M. Levy. 1989b. Enhancement of the natural biodegradation ofcondensate and crude oil on beaches of Atlantic Canada. Proceedings of the 1989 OilSpill Conference, February 13-16, 1989, San Antonio, Texas, pp. 479-486.
Lee, K. and E.M. Levy. 1987. Enhanced biodegradation of a light crude oil in sandybeaches. Proceedings of the 1987 Oil Spill Conference, April 6-9 1987, Baltimore,Maryland, pp. 411-416.
Mackay, D. and P.G. Wells. 1983. Effectiveness, behavior, and toxicity of dispersants.Proceedings of the 1983 Oil Spill Conference, February 28-March 3, 1983, SanAntonio, Texas, pp. 65-71.
McAuliffe, C.D., B.L. Steelman, W.R. Leek, D.E. Fitxgeral, J.P. Ray, and C.D. Barker.1981. The 1979 Southern California dispersant treated research spills, Proceedings ofthe 1981 Oil Spill Conference, March 2-5, 1981, Atlanta, Georgia, pp. 269-282.
Mearns, A. 1991. Observations of an oil spill bioremediation activity in GalvestonBay, Texas. NOAA Technical Memorandum NOS OMA 57. Seattle: HazardousMaterials Response Branch, National Oceanic and Atmospheric Administration.38 pp.
Meyers & Associates, and RPI, Inc. 1989. Oil Spill Response Guide. Park Ridge, NewJersey: Noyes Data Corp. 314 pp.
National Research Council. 1989. Using Oil Spill Dispersants on the Sea.Washington, D.C.: National Academy Press. 335 pp.
5-100
NOAA MESA Puget Sound Project. 1978. Microbial degradation of petroleumhydrocarbons. EPA- 600/7-78-148. Seattle: U.S. Environmental Protection Agency.
NOAA MESA Puget Sound Project. 1980. Petroleum biodegradation potential ofnorthern Puget Sound and Strait of Juan de Fuca environments. EPA-600/7-80-133.Seattle: U.S. Environmental Protection Agency.
National Research Council. 1989. Using Oil Spill Dispersants on the Sea.Washington, D.C.: National Academy Press. 335 pp.
Owens, E.H. and A.R. Teal. 1990. Shoreline cleanup following the Exxon Valdex oilspill–field data collection within the SCAT program: Proceedings of the 13th Arcticand Marine Oil Spill Program Technical Seminar, June 6-8, 1990, Edmonton,Canada, pp. 411-421.
Parrish, R. and B. Albrecht. 1990. Acute toxicity of three Gulf of Mexico watersamples to mysids (Mysidopsis bahia) and silversides (Menidia beryllina). GulfBreeze, Florida: U.S. EPA Environmental Research Laboratory, 5 pp.
Payne, J.R., and nine others. 1991a. Dispersant trials using the Pac Baroness, a spillfor opportunity, Proceedings of the 1991 Oil Spill Conference, March 4-7, 1991, SanDiego, California, pp. 427-433.
Payne, J.R., and seven others. 1991b. Mega Borg oil spill dispersant efficiency testing.Seattle: Hazardous Materials Response Branch, National Oceanic and AtmosphericAdministration. 39 pp. plus appendices.
Prince, R.C., J.R. Clark, and J.E. Lindstrom. 1990. Bioremediation monitoringprogram. Anchorage: Exxon, EPA, Alaska Department of EnvironmentalConservation. 85 pp. plus appendices.
Pritchard, P. H. and C. F. Costa. 1991. EPA's Alaska oil spill bioremediation project.Environ. Sci. Technol. (25): 372-379.
Pritchard, P. H., R. Araujo, J.R. Clark, L.D. Claxton, R. B. Coffin, C.F. Costa, J.A.Glaser, J. R. Haines, D.T. Heggem, F.V. Kermer, S.C. McCutcheon, J.E. Rogers, A.D.Venosa. 1991. Interim report, oil spill bioremediation project, summer 1989. GulfBreeze, Florida: U.S. EPA, Office of Research and Development. 264 pp. plusappendices.
Pritchard, P. H., R. Araujo, J.R. Clark, L.D. Claxton, R. B. Coffin, C.F. Costa, J.A.Glaser, J. R. Haines, D.T. Heggem, F.V. Kermer, S.C. McCutcheon, J.E. Rogers, A.D.Venosa. 1990. Interim report, oil spill bioremediation project, summer 1989. GulfBreeze, Florida: U.S. EPA, Office of Research and Development. 224 pp.
5-101

Research Planning, Inc. 1991. The Mega Borg oil spill, summary of spill responseactivities. Rockville, Maryland: NOAA Damage Assessment and RestorationCenter. Draft. 55 pp.
Sanders, N. and Gray E. 1989. Alaska oil spill bioremediation project workshopsummary, November 7-9 1989. Washington, D.C.: EPA Office of Research andDevelopment. 8 pp.
Sanders, N. and E. Gray. Alaska Oil Spill Bioremediation Project WorkshopSummary. Rockville, Maryland: Technical Resources, Inc. 8 pp.
Smith, J.E. 1968. Torrey Canyon Pollution and Marine Life. New York: ColumbiaUniversity Press.
Tetra Tech. 1982. Ecological Impacts of Oil Spill Cleanup: Review andRecommendations. Draft report submitted to American Petroleum Institute, Wash.,D.C.
Texas General Land Office. 1990. Mega Borg oil spill off the Texas coast, an openwater bioremediation test. Austin, Texas. 30 pp.
Tjeerdema, R.S., M.M. Singer, G.M. Scelfo, D.L. Smalheer, L.M. Swall, G.E. Croston,D.M. Fry, and M. Martin. 1990. The toxicology of oil spill cleanup agents. ReportUCSC/IMS-90/1. Sacramento: California Department of Fish and Game. 175pp.
U. S. Congress, Office of Technology Assessment. 1991. Bioremediation for marineoil spills - background paper. OTA-BP-0-70. Washington, D.C: U. S. GovernmentPrinting Office. 31 pp.
U.S. Department of the Interior. 1990. Seal Beach NWR Oil Spill Briefing. LagunaNiguel, California: U.S. Fish and Wildlife Service, November 15, 1990. 3 pp.
U.S. EPA. 1989. Ambient water quality criteria for ammonia (saltwater)-1989. EPA440/5-88-004. Washington, D.C: Office of Water Regulations and StandardsDivision.
U.S. EPA. 1991a. Interim guidelines for preparing bioremediation spill responseplans. Washington, D. C: Subcommittee on National Bioremediation SpillResponse, Bioremediation Action Committee. April 6, 1991. 27 pp.
U.S. EPA. 1991b. Seal Beach NWR bioremediation studies. Gulf Breeze, Florida:U.S. EPA Environmental Research Laboratory, Draft, March, 1991. 22 pp.
5-102
Venosa, A.D., J.R. Haines, W. Nisamaneepong, R. Govind, S. Pradhan, and B.Siddique. 1991a. Protocol for testing bioremediation products against weatheredAlaskan crude oil. Proceedings of the 1991 Oil Spill Conference, March 4-7, 1991, SanDiego, California, pp. 563-570.
Venosa, A.D., J. R. Haines, and D. M. Allen. 1991b. Effectiveness of commercialmicrobial products in enhancing oil degradation in Prince William Sound fieldplots. Proceedings of the 17th Annual Hazardous Waste Conference, April 9-11,1991, Cincinnati, Ohio.
Walker, J. D., R. R. Colwell and L. Petrakis. 1976. Biodegradation rates ofcomponents of petroleum. Can. J. Microbiol. (22):1209-1213.
Ward, D. M. and T. D. Brock. 1978. Hydrocarbon biodegradation in hypersalineenvironments. Applied and Environmental Microbiology (35): 353-359.
Woodward-Clyde Consultants. 1991. The SCAT Process Manual for the Shorelines ofthe Ontario Great Lakes. Burlington, Ontario: Environmental Emergency Divisionof Environment Canada. 111 pp. plus 9 appendices.
5-103