5. implementation of economic incentive systems
TRANSCRIPT

5. IMPLEMENTATION OF ECONOMIC INCENTIVE SYSTEMS
This section presents a detailed discussion of how fees and quotas could be implemented to provide economic incentives for reducing PROC emissions from hair spray and spray paint consumer products in California. General conclusions and recommendations concerning the feasibility and implementation of the incentive systems, along with specific implementation issues and areas requiring resolution, are highlighted.
Because the structure of the markets for hair spray and spray paint consumer products in California are very similar, the requirements for implementing incentives for each product are also quite similar, and are therefore presented jointly. First fee systems are discussed, followed by quota systems.
5.1 - FEE-BASED INCENTIVE SYSTEM
As described above in Chapter 2, a fee-based system provides an incentive for reducing PROC emissions from consumer products by increasing the cost of continuing to use PROCs in product fomulations. The feasibility of implementing a fee-based system is contingent upon the specific needs and structure of the product market to which it is applied.
This section discusses the implementation of a fee-based economic incentive system for reducing PROC emissions from hair spray and spray paint products in the California market with regard to five key components:
(1) what the fee is levied on;
(2) the point at which the fee is collected;
(3) setting the fee;
(4) use of revenues from the fee; and
(5) the steps necessary to ensure compliance.
A summary of the key components of the fee-based system is presented in Exhibit 5-1.

120
EXHIBIT 5-1
IMPLEMENTATION OF A FEE-BASED INCENTIVE SYSTEM
What the Fee is Levied on
Fee is levied upon the manufacture or import for sale in California of any hair spray or spray paint product that contains PROCs. The fee is expressed in dollars per pound of PROC that is integrated into the product and which is anticipated to be released during use and/or disposal.
Point at Which The Fee is Collected
Fee is collected from manufacturers or importers of hair spray and spray paint products sold in California. Each manufacturer is required to forecast sales periodically (e.g., quarterly) and submit fees to the California Board of Equalization on a regular basis. Overpayment or underpayment, based on actual saies and shipments, will be deducted or added to payment for new period.
Setting the Fee
ARB will determine the initial level of the fee to achieve an emissions reduction goal. Fee will be phased in over a predetermined time (e.g., five years) to achieve the emissions reduction goal. An assessment of the market activity and potential adjustments necessary to meet the goal will be completed following full implementation of the fee.
Use of Revenues From the Fee
Revenues from the fee will be deposited in a fund to be used for operation of the program, with the balance of revenues transferred to the State General Fund.
Steps Necessary to Ensure Compliance
Hair spray and spray paint containers are required to bear, in a visible location, a label, stamp, metered impression, or other printed notification indicating the PROC content, by percentage of net weight, and signifying that the fee for the product has been paid. Sale or distribution for sale within California of products that have not complied with these requirements shall be subject to penalties and fines. Each manufacturer will submit appropriate records, receipts, invoices, and other documentation to support the fee paid, including any additional fee that is required to balance an account. Reports and documentation submitted by manufacturers will be subject to audit and inspection for accuracy.

121
5.1.1 What the Fee is Levied on
Fee is levied upon the manufacture or import for sale in California of any hair spray or spray paint product that contains PROCs. The fee is expressed in dollars per pound of PROC that is integrated into the product and which is anticipated to be released during use and/or disposal.
Under this approach a fee will be paid based upon amount of PROCs used in the formulation of hair spray and spray paint products. The fee is levied upon all such products manufactured or imported for sale in California. The fee applies equally to all PROCs used in the products that are anticipated to be released during use and/or disposal of the product.
Implementation Issues
Several steps are required to implement this type of fee, including the fol!owing.
o Definition of products. The products covered by the fee must be defined precis·ely. As discussed above, it may be preferred to implement an economic incentive system that covers a range of products. A list will be required of the products that are covered, and specific definitions will be required for each product. For example, hair sprays have a specific technical definition that does not include styling mousses and spritzers. Care must be taken to adequately define the full range of products to be covered.
o Definition of PROC. For the products of interest, a precise PROC definition must be prepared. All substances that meet the definition criteria will be subject to the fee." If PROCs are to be treated differently based on physical criteria (such as reactivity), the trade offs among the PROCs must be defined precisely.
o Definition of "anticipated to be emitted". It is appropriate to place the fee only on the PROCs that will be emitted. Initially, it may be presumed that all the PROCs contained in the product will be emitted. However, manufacturers should have the opportunity to demonstrate that some portion of the PROCs in their products are not emitted during use and/or disposal.
o Definition of manufacture and import. The activity that triggers a liability for a fee must be clearly defined. For example, does the mixing of hair spray or spray paint ingredients constitute manufacture, or must the ingredients be put into a package? Given that some manufacturers prepare pre-mixed ingredients prior to filling, the definition of manufacture can be important. Based on the current understanding of the practices used to manufacture

0
122
hair sprays and spray paints, it is recommended that manufacturing be defined as the placing of ingredients into packages that are intended for sale in California. Given that the final sales location cannot be determined precisely for all products at the time of filling, a mechanism will be required that allows for prospective estimating of expected sales, and retrospective adjustments to account for deviations from anticipated levels. For example, shipments into the state may be assumed to be intended for sale. Subsequent shipments out of the state would be evidence that the products are no longer intended for sale.
Certification of PROC usage. Techniques will be required for evaluating the quantity of PROC usage. A manufacturer may be required to keep records on the total quantity of PROCs used in the manufacture of products that are covered by the fee. A preferred approach may instead be the certification of the PROC usage per container manufactured, and a procedure for estimating the number of containers sold in the state. This approach may be preferred because sales and inventory data are likely to be collected on the basis of the number of units involved. These data could then be used to estimate fees. In order to use this approach, the PROC contents of the individual products would have to assessed. 43
Variations in Approach
If it is found to be legally or administratively not possible to place the fee upon products manufactured out of state, or if for some other reason this is found to be undesirable, then it may be required to impose the fee upon the distribution of products within California. Such an approach, similar to the State cigarette tax, would impose the fee upon the first primary source of distribution of the products within California.
While such an approach may be feasible, tracking and implementing the program would be very complex. Distributors would be required to keep records of products distributed in the state. Each distributor would have to be registered with the state, and procedures for record-keeping would be required. The PROC contents of the products would still have to be certified, and the certification information would still likely have to come from the manufacturers.
43 Note that it is not contemplated that each can be examined. Instead, the PROCs in a given formulation that is put into a can of a given size need only be certified once. Once it is certified, any number of cans could be filled with that formulation without subsequent certification being required. This certification procedure will require a mechanism that will allow manufacturers to maintain the confidentiality of their formulations.

123
5.1.2 Point at Which the Fee is Collected
Fee is collected from manufacturers or importers of hair spray and spray paint products sold in California. Each manufacturer is required to forecast sales periodically (e.g., quarterly) and submit fees to the California Board of Equalization on a regular basis. Overpayment or underpayment, based on actual sales and shipments, will be deducted or added to payment for new period.
Under this approach the liability for the fee would rest with the manufacturer. Contract fillers, distributors, wholesalers, and retailers would not be involved in the payment of any fees. Fees would be paid on an ongoing basis based on reports prepared by the manufacturers. Subsequent adjustments to reflect larger or smaller than anticipated sales would be required. Such adjustments are currently made as part of the existing cigarette tax program in California.
Implementation issues
Several steps are required to implement this approach, including the following.
0 Procedures for fee computations. Procedures and rules that describe the method for computing fees owed to the state must be developed. These procedures would include requirements for keeping records on number of units manufactured with various formulations, and numbers of units shipped to California for sale. Procedures for estimating the number of units subsequently not sold in the state would also be required. The preferred approach would likely be that all shipments into the state would be presumed to be sold in the state. Adjustments for units not sold in the state would also be made. Forms for reporting to the Board of Equalization would need to be developed, and staff at the board would be required in order to handle and record the reports.
0 Notification of affected parties. Information about the fee program and its requirements must be provided to affected parties.
0 Procedures for fee remittance. The procedures for sending in the fee payments must be developed. The frequency of the payments (e.g., quarterly) and opportunities for averaging must be defined. Averaging may be important because some production is done on a "campaign basis." Over a six-week period a contract filler may fill a large number of units for a given manufacturer. These units could be shipped to a warehouse (e.g., in California) and sold throughout the year. Given that this single shipment may represent the intended sales for a long period of time (e.g., six months or even a year), it may not be appropriate to require payment for the entire shipment in one quarter.

124
Variations in Approach
The most difficult aspect of implementing fees in this manner is that manufacturers may not be aware of the intended final point of sale of their products. For example, a manufacturer may sell products to a wholesaler or a national chain that sells products in many states. Under the approach outlined above, the manufacturer would rely on his client to estimate: (1) expected sales in California; and (2) subsequent deviations from the expected level of sales in California. Th.is arrangement may be troublesome for manufacturers, in particular if they are subject to penalties if their client who purchased the products fails to report accurately.
One method of addressing this issue is to require those units that are manufactured for sale in California to be labelled in some manner that can be easily identified. In this manner, national chains or others who purchase products from manufacturers would be required to estimate the number of "California" units desired. Fees would be due on all these units that were produced unless subsequent documentation was provided that indicated that sales in California did not take place. Th.is approach is similar to the approach used to enforce cigarette taxes.
Another way to address this issue is to make the party that introduces the goods into the state for sale responsible for the fee. If a manufacturer sold products to a national chain, the national chain would subsequently be responsible for the fee if they sold the products in California. While this approach makes it easier for manufacturers, its drawbacks include:
o more parties are subject to the fee, increasing the complexity of the program;
o parties are subject to the fee that may not have data on the PROC contents of the products; and
o parties are subject to the fee that are not involved in decisions regarding the formulations of the products.
5.1.3 Setting the Fee
ARB will determine the initial level of the fee to achieve an emissions reduction goal. Fee will be phased in over a predetermined time {e.g .• five years) to achieve the emissions reduction goal. An assessment of the market activity and potential adjustments necessary to meet the goal will be completed following full implementation of the fee.
Under this approach, ARB would be required to estimate emissions reductions anticipated in response to various fees. Th.en an emissions reduction goal would be set, and a fee level chosen. The fee would then be phased in so as to minimize market disruptions and allow manufacturers a

125
reasonable time for adjustment and reformulation. Following full implementation of the system, ARB would evaluate the economic, social, and emission reduction impacts of the system and suggest further modifications.
Implementation Issues
The most important implementation issues under this approach concern the assumptions on which the initial fee is based and evaluated. Setting the fee too high could result in significant market impacts, including elimination of the controlled products from the California markets entirely or very large price increases. Setting the fee too low could result in little or no change in current emissions from the controlled products. One of the most important steps in this process, therefore, will be the collection of accurate and detailed information concerning these markets, the technical alternatives available, the cost of these alternatives, and the reactions of consumers and producers to changes in the prices of the products.
Specific information that will be required includes:
o technical alternatives, both present and future, for reducing PROC emissions from the controlled products;
o fixed and variable costs of using each technical alternative;
o detailed descriptions of and data for the markets in which the products are produced and sold;
o price and income elasticities for the products.
ARB will also need to determine an appropriate period of time over which to phase in implementation of the incentive system. The time period over which phase-in occurs should provide manufacturers a reasonable amount of time to take whatever compliance measures they require. The phase in period should be at least a period of years, during which time manufacturers could reformulate and test their products. A period of two to five years seems appropriate. During this time the ARB could also promote the dissemination of information on technical options for reducing emissions. The dissemination of such information may speed the pace at which modifications are made, as well as reduce the costs faced by manufacturers.
Variations in Approach
As discussed above, the approach involves selecting a fee to achieve a given level of emissions reduction. The fee could also be set at a level that represents the costs of achieving emissions reductions from other sources. Alternatively, the fee could also be set at a level that represents the costs of the damage caused by the emissions in terms of reduced air quality.
126
The fee could also be set to change in response to estimated emissions levels over time. For example, the fee would increase if emissions reductions targets were not achieved.
5.1.4 Use of Revenues From the Fee
Revenues from the fee will be deposited in a fund to be used for operation of the program, with the balance of revenues transferred to the State General Fund.
Under this approach revenue from the fee will be deposited into a fund that will be used to operate the program, including study, administration, compliance, and enforcement activities. Depending on the level of the fee, surpluses may build up. Such surpluses could be transferred to the State General Fund periodically.
_Implementation Issues
The use to which the revenues will be put will likely be a controversial issue, regardless how the fee program is designed. If large revenues are anticipated (e.g., tens of millions of dollars per year), then revenues in excess of the costs of operating the program will exist.
From an incentive perspective, the funds should be used in a manner that does not counter-act the economic incentives for reducing emissions. From a fee-program design perspective, it is preferred not to promote the development of a program that grows to depend on the fee for its funding. The fee is designed as an incentive, not as a revenue-generating tax. Consequently, it is preferred not to create a program that depends on the revenues.
Variations
The funds could be used to further the development of technical alternatives for reducing emissions, or for other environmental quality programs. Care should be taken so that future fee-level decisions are not driven by a desire to fund such programs. Alternatively, excess funds could be returned to the population at large, e.g., through the tax law.
5.1.5 Steps Necessary to Ensure Compliance
Hair spray and spray paint containers are required to bear, in a visible location, a label, stamp, metered impression, or other printed notification indicating the PROC content, by percentage of net weight, and signifying that the fee for the product has been paid. Sale or distribution for sale within California of products that have not complied with these requirements shall be subject to penalties and fines. Each manufacturer will submit appropriate records, receipts, invoices, and other documentation to support the fee paid, including any additional fee that is
127
required to balance an account. Reports and documentation submitted by manufacturers will be subject to audit and inspection for accuracy.
Under this approach, products are required to bear some form of easily distinguishable marking to identify that a fee has been paid by the manufacturer, and to certify that they are approved for sale within California. In addition, as indicated in the prior sections, extensive reporting and documentation will be required on a periodic basis in order to substantiate manufacturers' payment of fees.
As discussed, it is important that the administrative requirements of the fee-based system not be overly burdensome to manufacturers or the implementing agency. However, documentation, tracking, reporting, and a system for real and enforceable penalties are essential to ensuring not only that manufacturers comply with the requirements of the regulation, but to ensure that markets are not unduly disrupted by "black market" or covert sales and that the system achieves its intended responses. Because manufacturing is both a focal point of the incentive system (i.e., reformulation of products) and the most centralized activity in both the hair spray and spray paint markets, the overall commitment required to ensure compliance can be minimized by focusing reporting and enforcement efforts upon manufacturers.
Implementation Issues
Three main points exist with regard to ensuring compliance with the requirements of the incentive system. These are: (1) ensuring that products sold in California have met the requirements of the regulation and that appropriate fees have been paid; (2) the level of reporting that will be required; and (3) enforcing regulations and penalizing violators.
Labelling products to be sold in California in a manner that signifies compliance will be a key step in ensuring that products sold in California have met the requirements and that manufacturers have paid the appropriate fees for these products. The labelling requirements and the system for distributing or licensing the label must be developed. The system could be patterned after the current system used to put stamps on cigarette packages. Cigarette packages bear a stamp that indicates that the cigarette tax has been paid. The stamp may be purchased (for the cost of the tax) or machines may be used to print the stamp, with the meters on the machines used to compute the tax owed. Because the PROC content of each product would be different, meaning that the fee owed would also be different for each product, more flexibility would be required than is currently available in the cigarette tax system.
To ensure that requirements have been met, a system of reporting, inspecting, and auditing will be required. This system must be able to substantiate all aspects of the fee program, including: fee payment; product formulations; number of containers of product sold; and final destination of products. Inspections, records reviews, and audit
128
procedures must be developed, and a specially trained staff will be required to implement the program. In addition, some additional rules and procedures may need to be established to give inspectors and the administering agency the authorities necessary to fulfill these functions.
Other staff and administrative issues to be resolved concerning reporting, auditing, and inspecting include:
o how often reports should be required;
o whether certain exemptions will be granted, such as less frequent reporting for small manufacturers;
o whether compliance and enforcement authorities will be developed within ARB or another agency;
o what reports should be required and how detailed the documentation should be;
o whether and to what extent will requirements apply to distributors, retailers, and transporters of the products; and
o the level of commitment the administering agency wants to make to tracking and enforcement activities.
In addressing these issues, innovative and time-saving techniques should be explored. For example, in the implementation of its rule restricting the production and consumption of CFCs in the U.S., the U.S. EPA has established a system whereby CFC manufacturers can submit reports electronically. This system reduces the reporting burden on both industry and EPA.
Penalties for non-compliance may be one component of the enforcement system. Penalties should be clearly stated and sufficiently onerous to deter any willing evasion of the requirements of this system. However, no penalty will be effective if the agency does not enforce the regulations and impose those penalties. Within this scope, it is again important to explore what authorities may or may not be possible. For example, it may not be possible (or at least very difficult) to enforce the regulations upon out-of-state manufacturers.
Variations in Approach
If evasion of the requirements is considered particularly serious, one alternative, albeit resource intensive, is to establish a greater tracking system of "cradle to grave" manifesting of shipments of the consumer products. Such a system would be similar to that used for hazardous wastes in that each product or group of products that reaches a retail outlet in California would be required to be accompanied by a "manifest" or invoice record that would indicate clearly each party that handled the product all

129
the way back to its original manufacture. Auditing of retail sales and distribution operations would provide this information as a ready check of the compliance status of firms manufacturing hair spray and spray paint consumer products for sale in California.
Given the number of parties involved in the sale of consumer products, such manifesting would be intrusive and costly. A modified approach would be to "register" the major parties that are involved, including manufacturers, wholesalers, and distributors, but excluding retailers. The registered parties would be required to keep records of shipments of the affected products. Enforcement would then be focused toward these registered parties. Sales to non-registered organizations in California would be presumed to be sold in California and be subject to the fee.
5.2 IMPLEMENTATION OF A QUOTA-BASED ECONOMIC INCENTIVE SYSTEM
The issues associated with implementing a quota-based incentive system have many parallels to the implementation of a fee-based system. Unlike a fee-based system, however, a quota-based system imposes a firm limit on the total quantity of PROC that is allowed to be used in the consumer products sold in the State. It is important, therefore, that the activity upon which the quota is placed be defined carefully, that the initial allocation of the quota be meaningful in terms of the amount of PROC allowed for use, and that some trading be allowed for the .redistribution of the limited rights to use PROC in order to promote efficient attainment of the quota.
This section discusses the implementation of the quota-based economic incentive system for reducing PROC emissions from hair spray and spray paint consumer products in the California market with regard to the following five key components:
o what the quota is placed upon;
o the initial allocation of the quota;
o the trading of quota allowances;
o evaluation of emissions reductions and revisions of the quota; and
o steps necessary to ensure compliance.
A summary of the key components of the quota-based system is presented in Exhibit 5-2.

130
EXHIBIT 5-2
IMPLEMENTATION OF QUOTA-BASED SYSTEM
What the Quota is Placed Upon
The quota is placed upon the use of PROCs during the manufacture of any hair spray or spray paint consumer product for sale in California. The quota limits the overall quantity of PROCs that manufacturers may use in the production of products for sale in California.
Initial Allocation of Quota
The quota allowances will be allocated to product manufacturers based on historical usage of PROCs in consumer products in California. A quantity of allowances will be set aside for new manufactures that can demonstrate that they have a promising low-PROC product.
Trading of Quota Allowances
An "aftermarket" for trading the allowances will be structured to allow unrestricted trading of the allowances at any time without penalty.
Evaluation of Emissions Reductions and Revisions of the Quota
An evaluation of the effects of the quota allocation and potential adjustments necessary to meet the emissions reductions goal will be completed after some predetermined time following implementation of the quota system.
Steps Necessary to Ensure Compliance
Hair spray and spray paint containers are required to bear, in a visible location, a label, stamp, metered impression, or other printed notification indicating PROC content, by percentage of net weight, and that manufacture of the product is authorized under allowances held by the manufacturer. Sale or distribution for sale within California of products that have not complied with these requirements shall be subject to penalties and fines. Each manufacturer will submit appropriate records, receipts, invoices, and other documentation to support the quantities of product sold in California under their permit. Reports and documentation submitted by manufacturers will be subject to audit and inspection for accuracy.

131
5.2.1 What the Quota is Placed Upon
The quota is placed upon the use of PROCs during the manufacture of any hair spray or spray paint consumer product for sale in California. The quota limits the overall quantity of PROCs that manufacturers may use in the production of products for sale in California.
Under this approach, an overall limit or quota will be set upon the total amount of PROC allowed in the applicable products (e.g., hair sprays and spray paints) that are intended for sale in California. It is presumed that the PROCs in the products will be emitted at some point, although manufacturers should have an opportunity to demonstrate that some PROCs that are used to formulate their products are not subsequently emitted, and would therefore not be subject to the quota. The total PROC quota will be allocated to current manufacturers/marketers of these products in California. These quota allowances will serve as the main control over the use of PROCs in consumer products solid in California.
Implementation Issues
The steps necessary to implement,this type of quota include several of the same steps required for implementing a fee-based system, including the following.
0 Definition of products. The products covered by the quota must be defined precisely.
0 Definition of PROC. For the products of interest, a precise PROC definition must be prepared. All substances that meet the definition criteria will be subject to the quota. If PROCs are to be treated differently based on physical criteria (such as reactivity), the trade offs among the PROCs must be defined precisely.
o Definition of "anticipated to be emitted". It is appropriate that the quota only be applied to the PROCs that will be emitted.
o Definition of manufacture and import. The activity that requires a quota allocation must be clearly defined. As in the case with the fee-based system described above, it is recommended that manufacturing be defined as the placing of ingredients into packages that are intended for sale in California. Given that the final sales location cannot be determined precisely for all products at the time of filling, a mechanism will be required that allows for prospective estimating of expected sales, and retrospective adjustments deviations from anticipated levels.
o Certification of PROC usage. Techniques will be required for evaluating the quantity of PROC usage. As in the case with the fee-based system described above, it may be preferred to certify

132
the PROC usage per container manufactured, and to estimate the number of containers sold in the state.
In addition to these steps, it will be required to develop a comprehensive list of all parties who hold quota allocations. This is discussed further below.
Variations in Approach
As with the fee system, the quota system could, if necessary, be imposed upon the distribution of products within California. T.Jhile such an approach may be feasible, tracking and implementing the program would be very complex. Distributors would be required to keep records of products distributed in the state. Each distributor would have to be registered with the sate, and procedures for record-keeping would be required.
5.2.2 Initial Allocation of The Quota
The quota allowances will be allocated to product manufacturers based on historical usage of PROCs in consumer products in California. A quantity of allowances will be set aside for new manufactures that can demonstrate that they have a promising low-PROC product.
The initial allocation of the quota is one of the most important, and difficult, aspects of this type of incentive system. Under the approach proposed here, the majority of the allowable level of PROC usage would be allocated to current manufacturers by the ARB based on historical usage. A small portion of the allowances would be set aside for new manufacturers that have promising low-PROC products. As discussed in Chapter 2, the purpose of this set aside is to reduce the barriers to entry caused by the quota system.
Implementation Issues
The following steps are required to allocate the quota based on historical usage.
o Authoritative Historical Use Estimates. Authoritative data must be collected that describe the historical use of PROCs in the affected products sold in California. To collect these data, the following will be required: 44
44 This procedure is based on the approach used by the U.S. EPA to establish historical production and consumption data for chlorofluorocarbons (CFCs) and halon compounds. The CFCs are currently being limited in the U.S. using a quota system. The quota was allocated initially based on historical patterns. See Appendix G for a copy of the EPA regulation.
133
A base period for the analysis must be chosen. The base period should be in the past so that future activities cannot be undertaken to influence the share of the quota that will be received. A given year (such as 1988) should be specified. Manufacturers could also be given an option to use an average over a longer period (e.g., 1985 to 1988).
A reporting requirement must be promulgated by ARB. Parties that consider themselves to be eligible to receive quota allowances would be required to report their claim of historical usage. Claims would be accompanied by documentation of the basis for the claims, and a certification that the information provided was accurate.
A reporting form must be prepared that describes the basis for a party's estimate of its historical PROC usage. The need to report must be publicized and assistance in completing the form must be made available. 45
Claims of historical usage would have to be validated by ARB staff to ensure accuracy. Procedures for settling conflicting claims would be required. 46 A mechanism for dealing with confidential information will also be required.
The final data developed by ARB based on the reported historical activity would be published. These published data would subsequently be the basis for allocating quota allowances.
o The ARB would select a quantity of annual PROC usage as the quota. This quantity could change over time (e.g., be phased down) and would be selected based on evaluations of the technologies available and the costs of meeting various quota limits. For example, as described above, if aerosol hair sprays were reformulated with HCFCs, PROC emissions could be reduced by about
45 For example, a "hot line" could be set up to answer questions about how to fill out the form. Similarly, workshops could be held (e.g., jointly sponsored by industry groups) to provide information about how to report.
46 Conflicting claims arose when the U.S EPA collected data on historical production and consumption of CFCs and halons. In particular, several parties claimed historical consumption based on imports. To resolve these conflicting claims, a clear definition of the "importer of record" was adopted that corresponded to the definition of the U.S. Customs Service. Similar definitions will likely be required to resolve conflicting claims for products that were shipped for sale in California via various arrangements (e.g., under contract).

134
30 to 80 percent. The ARB would have to determine whether the costs of such a switch were acceptable.
o The ARB would allocate the selected quantity of annual PR0C usage to the parties with valid claims of historical usage. The allocations would be made in proportion to historical usage. A mechanism for demonstrating ownership of the allowances would be required, and official state recording (e.g., by ARB) may be preferred.
o A procedure will be required to allocate the allowances set aside for new manufacturers. Given that the objective of the set aside is to allow new manufacturers with low-PR0C products to enter the market, definitions will be required for those parties that will be considered new manufacturers and those product formulations that will be considered low in PR0Cs. A procedure for applying for these set aside allowances will be required, as well as procedures for allocating allowances when the demand for them is over subscribed. One approach would be to allocate the set aside quota allowances to those qualified entities with the lowest effective PR0C formulations. Retaining the set aside allowances in future years would be contingent on actually marketing the products in the state.
Variations in Approach
Numerous variations are possible in the manner in which the quota is allocated and set. Rather than allocate the quota, it can be auctioned by the state. A wide range of auction types are possible, and set-asides or other special rules for small businesses may be established. The following types of activities would be required to hold an auction:
o establish the auction procedures, for example, sealed bid auction with or without minimum bids, dutch auction, auction with entrance fees;
o define the quantities of quota allowances to be auctioned, i.e., the lot sizes, in pounds; 47
o define the parties that are eligible to participate in the auction, for example, participation may be limited to certain parties, or may be open;
o identify how the revenues from the auction will be used; and
47 The choice of the lot sizes may be important. Lots must be small enough to allow companies of all sizes to participate effectively. The order in which the lots are auctioned could also be important for the same reason. To protect small businesses, set-asides may be desireable.

135
o publicize and hold the auction.
The advantage of an auction is that it allocates the quotas initially based on a market. If the market (i.e., the auction) works well, the allocation will be efficient.
Unfortunately, because such an auction will be the first time that the allowances are distributed, there is no experience upon which to judge whether the auction will work well. There will be a lot of uncertainty regarding the value of the allowances, and consequently it will be difficult for firms to develop bidding strategies. Although the markets for the consumer products analyzed here are quite competitive, it is not necessarily the case that an auction will not be heavily influenced by a small number of players. Because of the uncertainty that an auction will create, and because the auction will produce revenues, it,is not recommended at this time. The potential inefficient allocation of allowances based on historical usage can be addressed by allowing the tra~ing of the allowances, which is discussed below.
The manner in which the allowances are used can also vary. Implicitly, the approach recommended above requires that all allowances be for individual years, i.e., an allowance for 100 pounds of PROC usage would be for a given year, such as 1992. The allowance does not permit trading across years.
Alternatively, firms could be given flexibility regarding the timing of the use of their allowances, e.g., within a several year period. This flexibility could reduce the costs of meeting the quota limits, in particular if new non-PROC technologies are anticipated to be introduced in the future. Trading across years increases the complexity of the program and reduces control over annual emissions.
5.2.3 Trading of Quota Allowances
An "aftermarket" for trading the allowances will be structured to allow unrestricted trading of the allowances at any time without penalty.
Under this approach, restrictions would not be placed upon the transfer of the PROC-use quota allowances in order to allow free movement of the allowances to the most highly valued uses. Manufacturers will be allowed to sell the allowances at any time. Transfer or intention of transfer will, however, require a pre-transfer notification of intent to buy of sell PROC allowances. Such notifications, made to the ARB, will allow ARB to notify the parties if the proposed seller of the allowances does not have the number of allowances that he proposes to sell. By maintaining a "clearing house" in this manner, information about the parties who hold allowances will be readily available.
One exception to the unregulated transfer of quota allowances are those allowances that were obtained as part of the set aside. These allowances

136
should not be transferable. If these allowances could be transferred, the intended objective of the set aside would not be met, namely to facilitate the introduction of low-PROC products by new entrants to the market. Additionally, if these allowances could be sold, entities might apply for the set aside allowances with the primary objective of selling them once they were obtained. Again, this set of activities would not be in accordance with the objectives of the set aside program.
Implementation Issues
This approach allows industry to trade allowances as freely as possible. Tracking by ARB is proposed as a means of providing information about the parties that hold allowances. Under this scheme ARB approval is not a precondition to the transfer of allowances among parties. However, ARB could be given a period (e.g., 5 working days) during which it could disapprove a transfer based on a finding that the party proposing to sell the allowances does not, in fact, own them.
'Reporting to ARB would also assist in enforcement of the quota limitations. As described below, the ARB needs to track which parties have quota allowances.
To perform this tracking role, the ARB would require staff and procedures for collecting information and making determinations regarding the ownership of allowances. A secure centralized data-handling facility would be required. Forms and procedures for reporting to ARB would have to be developed. Such procedures could be patterned after the U.S. EPA program that has recently been established for tracking the trading of allowances for CFC production and consumption.
Variations in Approach
The type of trading allowed and the control over the aftermarket exercised by the ARB are likely to be controversial issues. A well-working aftermarket that allows trading is important for ensuring that PROCs are used in their most highly-values uses. The aftermarket, if it works well, helps to reduce the overall industry costs of meeting the quota limits.
As a means of controlling the aftermarket and reducing emissions, it may be recommended that the quota allowances be devalued when they are transferred. Such a devaluation procedure would tend to limit the number of transfers made, and would tend to "lock in" PROC usage with the parties that received the initial allowance allocations. The potential benefits of reducing emissions through trading would need to be balanced against the costs of making it less likely that PROCs would be used in their most highly-valued uses.
As described above, trades would also be allowed among products that are covered by the quota. By allowing trades among products (e.g., hair sprays and spray paints), advances in non-PROC technologies in one product would

137
potentially "free up" PROCs for use in other products. Such trading would help to reduce the overall costs to industry of meeting the quota limits. Separate quotas could, however, be set for each product (or group of products), and trade between products (or product groups) could be restricted.
5.2.4 Evaluation of Emissions Reductions and Revisions of the Quota
An evaluation of the effects of the quota allocation and potential adjustments necessary to meet the emissions reductions goal will be completed after some predetermined time following implementation of the quota system.
Under this approach, ARB will undertake a study to determine whether the intended emissions reduction goals have been achieved and whether further reductions are possible. This study would be undertaken after some predetermined moderate time period deemed sufficient for allowing efficient use·and redistribution of the PROC-use allowances (e.g., five years). Revisions to the quota system would then be implemented.
Implementation Issues
As with the fee-based system, one of the most important implementation issues to be addressed in facilitating evaluation of the quota system will be the collection and analysis of accurate and detailed information concerning the use and impact of the quotas. For purposes of the study, therefore, one key issue to be resolved will be what information is required for this study and how to structure reporting to provide this information. Specific information that would be required for such a study includes:
o technical alternatives used, and their costs;
o impacts on prices and consumers;
o trading of the PROC-use allowances; and
o emissions reductions achieved.
Following this study, ARB will determine whether changes in the quota system are required to enhance/ensure its effectiveness. Issues that may need to be addressed at this point include:
o whether the quota for PROC-use should be increased or decreased;
o whether some intervention in the market for PROC-use allowances is necessary to ensure effectiveness of the system; and
o whether the program can achieve its intended goals.

138
Variations in Approach
To minimize potential impacts of the quota is may be preferred to put a ceiling on potential increases in the prices of consumer products. For example, an index of prices for selected products could be developed. If the index exceeded a given level, additional quota allowances could be allocated. Other "automatic adjustments" could also be added to the program, such as relating adjustments to the quota to observed prices for trading in the aftermarket.
5.2.5 Steps Necessary to Ensure Compliance
Hair spray and spray paint containers are required to bear, in a visible location, a label, stamp, metered impression, or other printed notification indicating PROC content, by percentage of net weight, and that manufacture of the product is authorized under allowances held by the manufacturer. Sale or distribution for sale within California of products that have not complied with these requirements shall be subject to penalties and fines. Each manufacturer will submit appropriate records, receipts, invoices, and other documentation to support the quantities of product sold in California under their permit. Reports and documentation submitted by manufacturers will be subject to audit and inspection for accuracy.
Under this approach, products are required to bear some form of easily distinguishable marking to identify that the product has been manufactured in accordance with the quota limitations. In addition, as indicated in the prior sections, extensive reporting and documentation will be required on a periodic basis in order to substantiate manufacturers' compliance with the quota system.
As with the fee-based system, it is important that the administrative requirements not be overly burdensome to manufacturers or the implementing agency. Documentation, tracking, reporting, and a system for real and enforceable penalties are essential to ensuring not only that manufacturers comply with the requirements of the regulation, but to ensure that markets are not unduly disrupted by "black market" or covert sales and that the system achieves its intended responses.
Unlike the fee-based system, no funds will be submitted to ARB or the administering agency, so audit and monitoring of fee payments will not be necessary. However, reporting requirements and milestones will need to be established in order to ensure reporting of the information concerning units sold and PROC content of formulations necessary for ensuring compliance.
139
Implementation Issues
Many of the issues key to the successful implementation of this approach are similar to those identified and discussed for the fee-based system. As with a fee-based system, to ensure that requirements have been met, a system of reporting, inspecting, and auditing will be required. This system must be able to substantiate all aspects of the quota program, including:
o product formulations;
o number of containers of product sold and total PROC used; and
o final destination of products.
Inspections, records reviews, and audit procedures must be developed, and a specially trained staff will be required to implement the program. In addition, some additional rules and procedures may need to be established to give inspectors and the administering agency the authorities necessary to fulfill these functions.
Unlike the fee system, the quota system requires that the ownership of the PROC-use allocations be tracked. Adequate tracking will require periodic or annual reporting by the holders of the allowances, along with notification any time a PROC-use allocation is bought or sold. Issues to be resolved with regard to this effort include:
o who will maintain records;
o how often reporting will be required;
o the extent of the information to be reported; ahd
what fees or penalties will be levied for non-compliance.
Variations in Approach
The extent of compliance activities may vary depending on the level of attention given to the program. As with a fee-based system, detailed "cradle-to-grave" manifesting could be implemented, but only at great cost.

6. EVALUATION OF ECONOMIC INCENTIVE SYSTEMS
This section presents the estimates of the costs of reducing PROC emissions from hair sprays and spray paints in California via fee and quota economic incentive systems.
This section is divided into the following two parts:
6.1 Sunnnar:y of Approach presents the methods and assumptions used to estimate costs; and
6.2 Cost Estimates presents the estimates of the costs of reducing PROC emissions.
6.1 SUMMARY OF APPROACH
'The costs of reducing PROC emissions from hair sprays and spray paints are estimated by:
o dividing the market for the products into product categories;
o identifying the technical options for reducing PROC emissions for each of the product categories and their emissions reduction potential;
o estimating the costs of implementing these individual technical options using a discounted cash flow analysis;
o simulating the extent to which each of the technical options would likely be adopted for ranges of fee levels and quota levels; and
o estimating the overall emissions reductions and costs across the set of technical options simulated to be adopted.
6.1.1 Product Categories
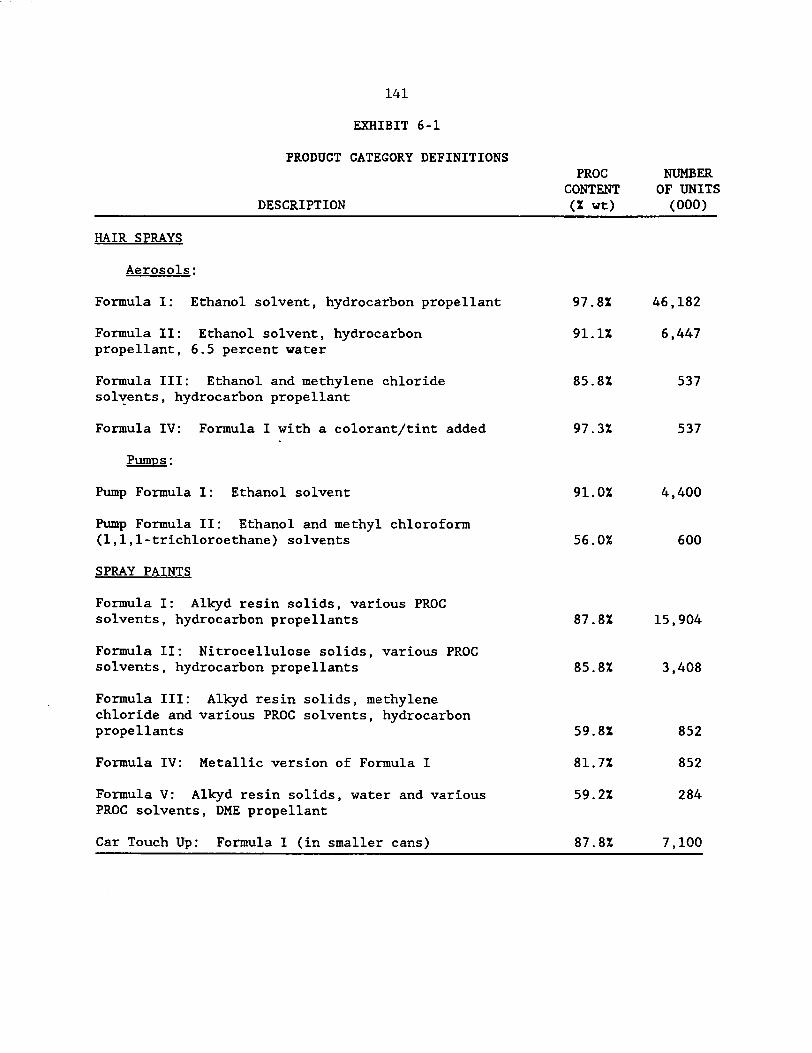
Exhibit 6-1 shows the product categories used in this analysis which are described in section 4 above. As shown in the exhibit, six product categories were used for hair sprays to represent the four main formulations of aerosol hair sprays and the two formulations of pump hair sprays. The estimated number of aerosol cans and pump containers sold in 1987 for each product category is also shown. In terms of number of units sold, Formulation I is clearly the major market formulation.
As shown in Exhibit 6-1 there are five major spray paint formulations discussed in section 4. Additionally, car touch up paint is also separated as a product category because it is anticipated that the these paints are a
141
EXHIBIT 6-1
PRODUCT CATEGORY DEFINITIONS
DESCRIPTION
PROC CONTENT
(% wt)
NUMBER OF UNITS
(000)
HAIR SPRAYS
Aerosols:
Formula I: Ethanol solvent, hydrocarbon propellant
Formula II: Ethanol solvent, hydrocarbon propellant, 6.5 percent water
Formula III: Ethanol and methylene chloride sol~ents, hydrocarbon propellant
Formula IV: Formula I with a colorant/tint added
Pumps:
Pump Formula I: Ethanol solvent
Pump Formula II: Ethanol and methyl chloroform (1,1,1-trichloroethane) solvents
SPRAY PAINTS
Formula I: Alkyd resin solids, various PROC solvents, hydrocarbon propellants
Formula II: Nitrocellulose solids, various PROC solvents, hydrocarbon propellants
Formula III: Alkyd resin solids, methylene chloride and various PROC solvents, hydrocarbon propellants
Formula IV: Metallic version of Formula I
Formula V: Alkyd resin solids, water and various PROC solvents, DME propellant
Car Touch Up: Formula I (in smaller cans)
97.8%
91.1%
85.8%
97.3%
91.0%
56.0%
87.8%
85.8%
59.8%
81. 7%
59.2%
87.8%
46,182
6,447
537
537
4,400
600
15,904
3,408
852
852
284
7,100

142
distinct market from general spray paints, in part because performance and marketing requirements may be quite different. Like the hair spray categories, these data are for 1987.
6.1.2 Technical Options
Exhibit 6-2 lists the major technical options for reducing PROC use and emissions in hair sprays and spray paints. The primary means for reducing emissions from hair sprays include the following:
o Reformulate the hair sprays to include non-PROC propellants, such as partially-halogenated chlorofluorocarbons (HCFC-22 and HCFC-142b). The HCFC substitute ingredients are more costly than current ingredients, and their performance remains to be evaluated fully. Concerns over the impacts of the HCFCs on stratospheric ozone may limit the future availability of these compounds. Methylene chloride could also be used, but this compound has been almost completely phased out of hair spray use due to concerns over toxicity. Consequently, methylene chloride based formulations are not considered further. The advantage of reformulating with HCFCs is that it enables aerosol packaging to remain in use.
o Reformulate the hair sprays to include water and dimethyl ether (DME) as a solvent. The use of water as a solvent reduces the PROC content of the formulation. The use of DME (which is a PROC) increases the evaporation rate of the water, thereby improving its performance as a hair spray. For good performance, it is important that the solvent in the hair spray evaporates quickly. As shown in the exhibit, the PROC emissions reductions from this option are modest.
o Reformulate the hair sprays to include high levels of water, DME, and no alcohol. This formulation has recently been introduced and there is uncertainty regarding potential consumer acceptance. As discussed in Chapter 4, reports are that initial focus group and market research have indicated positive results.
o Replace the aerosol package with a non-propellant-based package. Two options include:
Growpak and Exxel packaging: These packages reportedly provide aerosol-type sprays, so that from the consumer's point of view, performance of the product is similar to the current aerosol package. These technologies are currently being developed, and various questions remain (such as the development of package components that are compatible with the product formulations). The formulations of the products would be anticipated to be similar to current pump packaging

143
EXHIBIT 6-2
TECHNICAL OPTIONS FOR REDUCING PROC EMISSIONS4
DESCRIPTION COST/LB REDUCTION COMMENTS
HAIR SPRAYS
Aerosols:
HCFC I: use HCFC-142b as a solvent/propellant
HCFC II: use HCFC-22 with ethanol
HCFC III: use HCFC-22 with DME
DME,/Water: use increased amounts of water in conjunction with DME
High H20 No Alcohol: use 60% water in conjunction with DME and eliminate the alcohol entirely
Switch to pumps
2.60
1.20
0.90
0.90
0.20
<.25
This is a new formulation that remains to be fully tested.
31% HCFC-22 has been tested in aerosol hair sprays.
31% This propellant/solvent system is currently being marketed to hair spray manufacturers.
13% This propellant/solvent system is currently being marketed to hair spray manufacturers.
This formulation has recently been introduced. Uncertainty remains regarding consumer acceptance.
Switching will probably be limited due to consumer preferences. The PROC reduction is achieved by eliminating the propellant, and thereby reducing the amount of PROC required per effective application.
a Costs and emissions reductions shown are relative to Formula I for both aerosol hair sprays and spray paints.
b Emissions reduction is estimated based on the composition of the formulations. As described in Chapter 4, a recent study by ART! (1988) found that emissions reductions may be smaller if consumers do not adjust their application rates as anticipated based on product composition.

144
EXHIBIT 6-2 (continued)
TECHNICAL OPTIONS FOR REDUCING PROC EMISSIONS8
DESCRIPTION COST/LB REDUCTION COMMENTS
HAIR SPRAYS (continued)
Alternative packaging: switch to GrowPak and Exxel packaging
<.25 45% The packages are currently being marketed. They may be able to achieve aerosol-like performance. Costs are uncertain, and may be negligible.
Switch from pump formula I to pump formula II
<.25 38% This switch may not be possible if the use of methyl chloroform (a nonPROC used in pump Formula II) is limited due to concern about its impacts on stratospheric ozone.
SPRAY PAINTS
Yater/DME: DME
use water and 1.80 32% This is currently marketed as Formulation V. Its use is limited to applications that do not require high gloss finishes.
HCFC/DME: use HCFC-22/DME as the propellant
1. 50 33% This requires that HCFCs not be limited in these applications.
a Costs and emissions reductions shown are relative to Formula I for both aerosol hair sprays and spray paints.
c
145
EXHIBIT 6-2 (continued)
TECHNICAL OPTIONS FOR REDUCING PROC EMISSIONS•
DESCRIPTION COST/LB REDUCTION COMMENTS
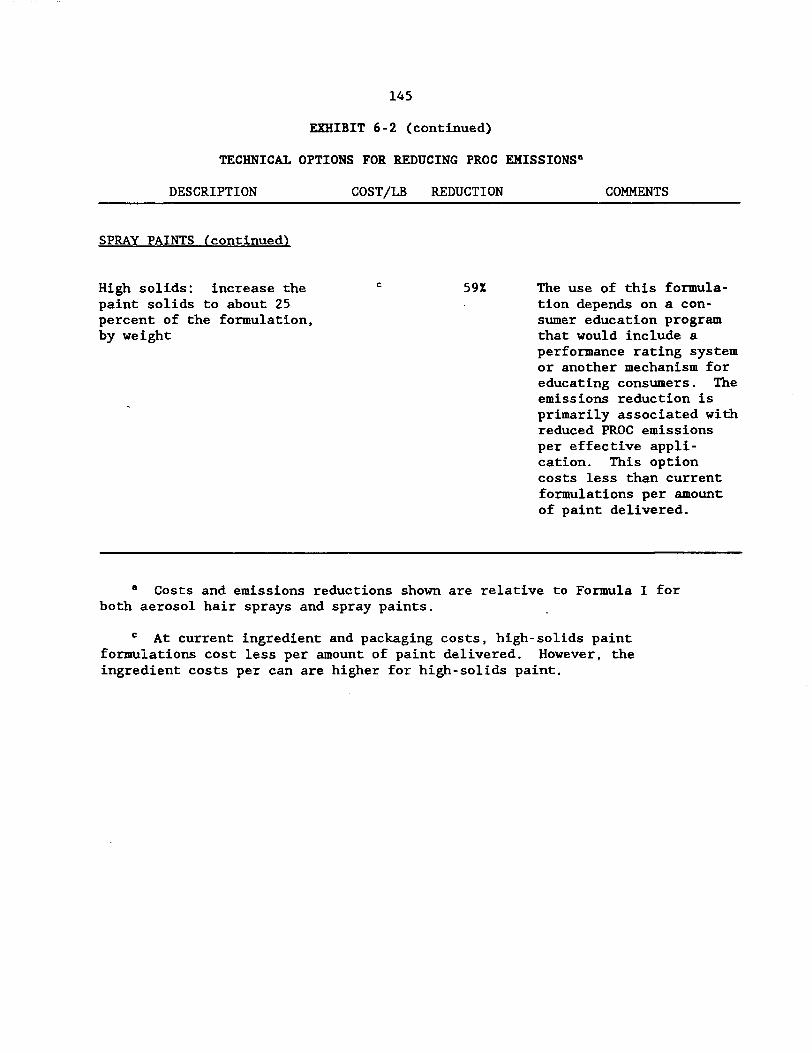
SPRAY PAINTS (continued)
High solids: increase the C 59% The use of this formulapaint solids to about 25 tion depends on a conpercent of the formulation, sumer education program by weight that would include a
performance rating system or another mechanism for educating consumers. The emissions reduction is primarily associated with reduced PROC emissions per effective application. This option costs less than current formulations per amount of paint delivered.
• Costs and emissions reductions shown are relative to Formula I for both aerosol hair sprays and spray paints.
At current ingredient and packaging costs, high-solids paint formulations cost less per amount of paint delivered. However, the ingredient costs per can are higher for high-solids paint.

146
formulations. The reduction in PROC emissions is achieved by eliminating the PROC propellant.
Pump packaging: Pump packaging has been and continues to be used for various hair care products, including hair sprays. Following the U.S. ban on chlorofluorocarbon (CFC) aerosol propellants in non-essential applications (including hair sprays) in 1978, pump sprays gained as large as 30 to 40 percent of the hair spray market. Current estimates are that pumps account for a smaller fraction of hair sprays today (see Chapter 4). The reduction in PROC emissions is achieved by eliminating the PROC propellant.
Of note is that the past experience with pump packaging after the CFC aerosol propellant ban may be interpreted to indicate that pump sprays do not have adequate performance characteristics to replace aerosol packaging for most hair spray users. Consequently, switching to pumps is not an option that is applicable to all hair spray use. Therefore, in this analysis it is assumed that at a maximum pump sprays can only penetrate the market an additional 20 percent, for a total of a 30 percent market share.
o Reformulate pump spray formulation I to pump spray formulation II. As shown in Exhibit 6-1, pump spray formulation II has a lower PROC content than pump spray formulation I.
As shown in Exhibit 6-2, reformulation to use non-PROC ingredients (such as HCFCs or water/DME) is also the primary means via which PROC emissions may be reduced from spray paints. Unlike hair sprays, however, non-aerosol packaging (e.g., pumps) are not considered as options.
In addition to reformulation to non-PROC ingredients, there is the potential to produce paints with "high-solids" formulations. The process of using a spray paint consists of transferring the paint (e.g., a resin) to a surface. The PROC solvents and propellants are used to accomplish this transferring process. A "high-solids" formulation is one that increases the amount of paint in the can to be transferred (i.e., the "solids") in relation to the other ingredients.
For example, spray paint Formulation I has about 12 percent solids, meaning that 12 percent of the formulation (by weight) is the actual paint that is being transferred to the surface being painted. The upper limit on the solids content of spray paint is believed to be about 25 percent. By increasing the solids content of Formulation I to 25 percent, the amount of PROCs emitted per amount of paint transferred to a surface would be reduced by about a factor of two (25 + 12). The cost of high solids paints, per amount of paint transferred, is actually lower than the cost of the current popular formulations.

147
The primary obstacle to the introduction and acceptance of high-solids paints is consumer awareness and education. It is believed that most spray paint consumers purchase sprays paints infrequently. Consequently, paints are often purchased based on the price of the can, without consideration of potential differences in quality. Because the ingredients of a high-solids paint formulation would be more costly than current formulations for a given volume (a 12 ounce container for example), consumers would only purchase it if they realized that the high-solids formulation would actually paint more of an area. Because there is no standard performance rating for spray paints, and because most consumers are believed to purchase spray paints infrequently, it is likely that high-solids formulations would not gain a large market share unless consumer attitudes are changed. By educating consumers, for example, through the development of a paint rating system and a public information program, the potential acceptance of high-solids formulations could likely be increased.
Like with hair sprays, methylene chloride based formulations are not con~idered as options for reducing PROC emissions from these products. Similarly, the airless sprayer (discussed in Chapter 4) is not considered here due to its high costs,
6.1.3 Costs of Individual Options
Exhibit 6-2 also shows the estimated costs of the various technical options for reducing PROC emissions per pound of PROC emissions avoided. These costs are estimated using discounted cash flow analysis, taking into account depreciation and tax effects, 48 and include:
0 costs of different ingredients based on price quotes received in July 1989 from vendors;
0 costs of developing and market testing the new formulations;
0 capital costs of upgrading filling facilities DME; 49 and
to store and handle
48 This discounted cash flow analysis is described in Appendix F.
49 It is assumed in this analysis that over time most brands are filled at more than one location. For example, the larger brands may be filled at four different locations (some in-house, other contract fillers). Consequently, under this assumption four filling lines may be required to be upgraded to handle DME, even though a single line could theoretically handle the filling requirements. It is further assumed in the analysis that the costs of these capital investments must be recovered from increased revenues received from the cans marketed in California. If DME-based formulations are marketed elsewhere as well (e.g., due to PROC emissions concerns elsewhere), the cost estimates presented here may be biased upward because the costs of the capital investments could be spread across a larger market.

148
o costs of different packaging (e.g., pump packaging).
The estimates shown in Exhibit 6-2 are sensitive to some extent on the market share that the option receives. Larger market shares allow up-front expenditures (such as market testing of new formulations) to be spread over more units, thereby reducing the per pound costs of reducing PROC emissions. The differing market shares are reflected in the analysis.
These cost estimates per pound of PROC emissions avoided reflect expenditures that would be required by industry. Depending on the characteristics of the market and demand by consumers, these costs will be passes along to consumers to various extents as discussed below.
6.1.4 Simulating the Technical Options Undertaken
To simulate the extent to which the various technical options are adopted in response to fees imposed on the use of PROCs it is assumed that:
o Technical options become candidates for adoption when they are less costly than continuing with current practices and paying the fee. A technical option is less costly when its cost per pound of PROC emissions avoided is less than the fee level imposed. For example, if a $2.00 per pound fee were imposed, options that cost less than $2.00 per pound of PROC emissions avoided would be cost effective. Those options costing more than $2.00 per pound would not be cost effective.
o Of those options that are candidates, any that are not likely to be acceptable from a performance or other perspective will not be undertaken. For example, methylene chloride-based formulations were eliminated from consideration in this analysis due to toxicity concerns even though they are inexpensive PROC reduction options. Similarly, a hair spray case was constructed that assumes that HCFCs are not viable options due to concerns about their ozone depleting potential. Also, a separate scenarios were analyzed with and without the High H20 No Alcohol formulation.
o The relative cost of the options is the primary driver of the extent to which the acceptable candidates are undertaken. The other factor driving the extent to which the options are implemented is consumer acceptance. The total expenditure required by industry is used to evaluate the relative costs of the options, including both the costs of the technical options and the fees that must be paid on the PROC emissions that remain. The following is an example of how this is done.

149
For this example, assume that there are four options under consideration for aerosol hair sprays: (1) do nothing (i.e., do not change from the current formulation); (2) reformulate with HCFC-22/DME; (3) reformulate with HCFC-22/ethanol; and (4) reformulate with HCFC-142b. At a fee level of $0.50 per pound the HCFC reformulations are not cost effective (see Exhibit 6-2). Consequently, it is assumed that the "do nothing" alternative is adopted.
At a fee level of $1.50 per pound, the two HCFC-22 reformulations are cost effective. The increased cost of producing hair sprays using these reformulations is estimated at about 25 percent. This estimate includes the cost of paying the $1.50 per pound fee on the remaining PROCs. By comparison, the cost increase associated with the "do nothing" alternative is about 27 percent. Although the HCFC-22 reformulation is preferred on a cost basis, it is only by a small amount. Because the cost differential is small, the switch to the HCFC-22 reformulations is expected in this example to be fairly modest.
-At higher fee levels, the cost differential between the HCFC-22 reformulations and the "do nothing" alternative increases. Consequently, the penetration of these alternatives would also increase. At a fee level of $3.00 per pound, the HCFC-142b alternative is cost effective (see Exhibit 6-2). Because the HCFC-142b reformulation reduces PROC emissions more than the HCFC-22 alternative, it becomes preferred to the HCFC-22 alternatives at high fee rates (e.g., $4.00 per pound).
This choice of penetration of the various options is clearly judgmental and alternative plausible assumptions may be used. However, the overall estimates of emissions reductions and costs are not overly sensitive to the details of the specific assumptions made. In general, the results are more sensitive to assumptions about which controls are available to be undertaken at all, as opposed to the relative mix of available controls that are undertaken.
To simulate the options undertaken in response to quotas, a similar assessment is made. In the case of quotas, however, it is assumed that the quota allowances are allocated to industry (as opposed to auctioned) so that transfer payments are not paid. In this case, the increases in the costs of producing the product are driven solely by the costs of the technical controls. Consequently, the lowest cost technical controls that will meet the quota limitation are assumed to be undertaken.
6.1.5 Total Emissions Reductions and Costs
To evaluate the total emissions reductions the following is done:
o For each technical control option simulated, an increase in product price is estimated. This increase in price includes the impacts of fees paid under the fee-based incentive system. The anticipated change in consumer demand associated with the change
150
in price is estimated using a range of demand elasticities. This procedure produces an estimate of the change in product quantity.
o The remaining PR0C contents of the products, reflecting the reductions associated with, for example, reformulation, are multiplied by the estimate of the product quantity that reflects the demand response due to higher prices to estimate total PR0C emissions.
o The reduction in emissions is estimated as the difference between the current emissions and the emissions simulated as the result of the influence of both the demand response and the technical control options.
This procedure does not take into account potential growth in the size of the market. The hair spray market, for example, has grown significantly in the past 10 years. Future growth would likely, in part, offset the emissions reductions estimated here for the fee-based system.
The overall costs of the reductions are estimated by summing across the technical control options simulated to be implemented. Several types of costs are estimated:
0 Private annualized costs of the technical controls represent the annual expenditures by industry to implement the controls. These costs are used to evaluate how technical controls will be implemented in response to the incentives.
0 Capital costs and one-time expenditures are the amount of outlays required initially to upgrade filling lines and reformulate products. These costs are not borne annually, but indicate the amount of investment that the industry will need to make when the incentives go into effect.
0 Transfer payments are the amounts that industry would pay to the state in the form of a fee on the remaining PR0C usage. Depending on the characteristics of the market, a portion or all of this fee payment will be passed on to consumers in the form of higher prices.
0 Lost consumer surplus represents the amount that consumers are "less well off" due to increased prices and reduced quantities of consumption. This measure is defined precisely in the field of economics and is an estimate of the costs that are incurred by consumers. In general, the lost consumer surplus is the amount that consumers are willing to pay to avoid foregoing some amount of consumption and to avoid some price increase.

151
0 Social costs are the net real resource costs that society has incurred. This cost is estimated as the lost consumer surplus minus the transfer payments made by industry.
These cost quantities are described in Appendix F.
To evaluate industry and macroeconomic impacts these cost estimates are compared to average annual industry profits and overall economic activity. Additionally, total social costs per pound of PROC emissions avoided may be estimated for purposes of comparing the costs of emissions reductions from these products to the costs of alternative means of reducing emissions.
6.2 COST ESTIMATES
This section presents results for fee and quota economic incentive systems as applied to hair sprays and spray paints.
6.2.1 Hair Sprays
Exhibit 6-3 presents estimates of the social costs per pound of reducing PROC emissions from hair spray formulations in California using a fee system in which a fee is imposed on the PROCs used in hair sprays. The horizontal axis is the percent reduction in emissions, and the vertical axis is the social cost per pound of emissions avoided. The points on each line are labeled with the fee levels, in dollars per pound, that produce the social cost and percent reduction estimates shown in the graph. As mentioned above, the percent reductions are estimated using the 1987 level of emissions as a base. If the market for hair sprays grows, realized reductions from the 1987 level will be smaller.
The social cost is a measure of how much it costs society to eliminate a pound of PR0C emissions from these products. High social costs imply that it is very costly to eliminate these emissions. Conceptually, social costs represent the real resources that society must expend to avoid these emissions. The fee that is paid is not included in the social costs because the fee is merely a transfer from one party to another. Social cost is one of the several different types of costs that are important to examine when evaluating emissions reduction policies.
Three cases are shown in the exhibit. The HCFC Substitutes Scenario assumes that HCFC compounds will be available for use in hair spray products at current prices, and that they are the principal means via which emissions are reduced in response to the incentives. Under this case, fee levels of $1.36 to $4.08 per pound ($3.00 to $9.00 per kilogram) could produce emissions reductions of about 10 to 60 percent, at average social costs on the order of $0.90 to $2.25 per pound ($2.00 to $5.00 per

No HCFC Substitutes Scenario
$1.36 $1.81 $2.27 $4.08 • • •S2.
72-fjs3.63
3.18 S0.00 -+------r-...;;.;;.;.;.;;,..-----,---..----.......----r----,---....,..-------.----1
152
EXHIBIT 6-3
SOCIAL COSTS PER POUND OF REDUCING PROC EMISSIONS FROM HAIR SPRAYS USING A FEE SYSTEM
$2.40 -,----------------------------------.
'.c c::::. Efi--0 .g $2.00
HCFC Suooti.tutes Scenario ·a ;>
< "' C: o $1.60·;;
"§ "' .
UJ u O $1.20 e::: 0.. '-0 -0 § S0.80
&. ... C)
0.. .... 0 50.40 High Water No Alcohol Scenario u
0% 20% 40% 60% 80% 100%
Percent Reduction in PROC Emissions
The points on each line are labeled with the fee levels, in dollars per pound, that produce the social cost and percent reduction estimates shown in the graph.

153
kilogram) of emissions avoided. The fee levels per pound of PR0C emissions simulated to produce these emissions reductions are shown on the exhibit next to the lines.
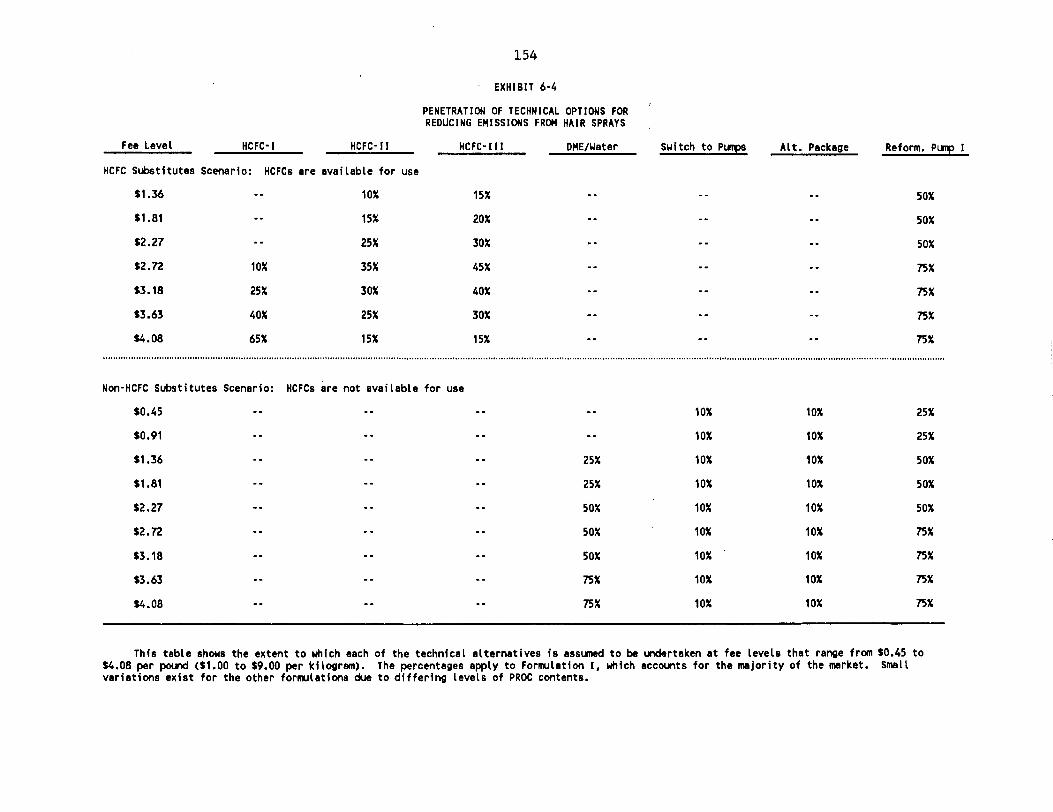
As discussed above, at increasing fee levels it is estimated that the HCFC formulations will achieve increasing penetration into the market. These estimates also assume that some pump formulations change to lower PROC formulations. Exhibit 6-4 summarizes the technology implementation assumptions made in the HCFC Substitutes Scenario. The first 6 columns to the right of the fee level refer to the penetration of options for reducing emissions from aerosol packages. The last column refers to the reformulation of pump packages.
A second case is also shown on the exhibit in which it is assumed that HCFC compounds are restricted so that they may not be used in hair spray products in the future. This No HCFC Substitutes Scenario also assumes that the High H20 No Alcohol formulation is not used widely. In this sceqario, the main sources of emissions reductions are reformulation with water/DME in aerosol products and limited switching to pump sprays. This No HCFC case cannot achieve reductions in emissions as large as the HCFC case. The social costs· in this scenario are in the range of up to $0.80 per pound ($1.75 per kilogram) of emissions avoided and the fee level ranges from $0.45 to $4.08 per pound ($1.00 to $9.00 per kilogram).
The third scenario shown in the exhibit is the High H20 No Alcohol Scenario. Under this scenario the High H20 No Alcohol formulation achieves widespread use. This formulation produces emissions reductions at social costs that are well below the other formulations. Consequently, as shown in the exhibit, the ability to reduce emissions at low social costs is sensitive to the ability to use this formulation widely. The social costs in this scenario are on the order of $0.20 per pound ($0.45 per kilogram) of emissions avoided.
Exhibit 6-5 shows the total annualized expenditures by industry at the various reduction/fee levels for the three scenarios. These expenditures include the increased costs of formulations, the annualized costs of capital expenditures and reformulation costs, and fee payments required on the remaining PROC usage. For both the HCFC and non-HCFC scenarios the expenditures by industry are similar for given fee levels, even though the emissions reductions are quite different. Under the High H20 No Alcohol Scenario industry expenditures are somewhat lower.
For all three scenarios, the total expenditures by industry are large compared to the revenue it receives from these products. The total annual revenue received by hair spray manufacturers from sales in California is about $0.85 per unit times 60 million units sold, or $51 million. Under the various scenarios shown in the exhibit, annualized expenditures by industry, which are almost entirely paid by manufacturers under this incentive system, are in the range of $10 to $90 million, which is the same magnitude as the revenues generated by the products.
154
EXHIBIT 6·4
PENETRATION OF TECHNICAL OPTIONS FOR REDUCING EMISSIONS FROM HAIR SPRAYS
Fee Level HCFC· I HCFC·II HCFC· II I OME/lolater
HCFC Substitutes Scenario: HCFCs are available for use
S1.36
S1 .81
S2.27
s2.n 10X
S3.18 25X
S3.63 40X
S4.08 6SX
Non·HCFC Substitutes Scenario:
S0.4S
S0.91
S1.36
S1.81
S2.27
S2.72
S3.18
S3.63
S4.08
10X
1S%
25X
3SX
30X
25X
1SX
HCFCs are not available for
1SX
20X
30X
4SX
40X
30X
1SX
use
2SX
2SX
SOX
SOX
SOX
75X
75X
Switch to P.!:!!E! Alt. Package
10X 10X
10X 10X
10X ,ox 10X 10X
10X 10X
10X 10X
10X 10X
10X ,ox ,ox ,ox
Reform. P~ I
SOX
SOX
SOX
75X
75X
75X
75X
2SX
2SX
SOX
SOX
SOX
75X
75X
75X
75X
This table shows the extent to which each of the technical alternatives is assl.llled to be undertaken at fee levels that range from S0.4S to S4.08 per poLl'ld (S1.00 to S9.00 per kilogram). The percentages apply to Forrr,.ilation I, which accounts for the majority of the market. small variations exist for the other foM1Ulations due to differing levels of PROC contents.

155
EKHIBIT 6·4 (Continued}
PENETRATION OF TECHNICAL OPTIONS FOR REDUCING EMISSIONS FROM HAIR SPRAYS
fee Level HCFC·I HCFC·II HCFC·III High H 0
No AlcJol Switch to P~ Alt. Package Reform. PI.Jl1) I
High H20 No Alcohol Scenario: HCFCa are not available for use and the High H20 No Alcohol Fornulatlon Is used widely
S0.45 51 101 101 25X
S0.91 ,ox 101 101 25X
S1.36 35X 101 ,ox SOX
S1 .81 SOX 101 101 SOX
S2.27 65X 101 101 SOX
S2.72 751 1DX 101 75X
S3.18 BOX ,ox sx 75X
S3.63 85X 51 51 75X
S4.08 901 sx 75X
This table ahows the extent to which each of the technical alternatlvn Is asst.llll!d to be undertaken at fee levels that range frOIII S0.45 to S4.08 per pol.l'ld (11.00 to S9.00 per kllogr■111). The percentages apply to Fo.,..latlon I, which accou,ts for the •Jority of the 111rket. Small variations exlat for the other fornulatlons due to differing levels of PROC contents.
The first 6 colllll'IS to the right of the fee level refer to the penetration of options for reducing e111laalons fr011 aerosol packages. These first 6 colU111S .,.t &U'II to lesa than or equal to 1001. The last collffl'I on the right refer• to the refoMM.1lation of~ fol'lllllation I. This collffl'I is Independent of the penetration estimates in the other 6 colwms. This seventh collffl'I 111111t, by Itaelf, be leas than or equal to 1001.

156
EXHIBIT 6-5
TOTAL EXPENDITOB.ES BY INDUSTI.Y FOi. REDUCING Pl.QC EMISSIONS PB.OH BAIi. SPRAYS USING A FEE SYSTEM
too, -.... 0
.§ 90
:::E 80
<I)... ~ 70"' ij.... E-00 60 C :a::, .:; .5._,
so
= >,.
"' 40
·] ::,
-{=. 30
0"' u 20 .;
§ ::I
10< .; 0 E- 0
Sl.36
S0.91
S0.4,
$4.01 No HCFC Substitutes Scenario
HCFC Substitutes Scenario
High Water No Alcohol Scenario
20'l, }OO'l,0% 40% 60% so-.
Pcrcc:nt Reduction in PROC Emissions
The points on each line are labeled with the fee levels, in dollars per pound, that produce the total cost and percent reduction estimates shown in the graph.

157
Of note is that the majority of the expenditures by industry are associated with paying the fee. These •transfer payments• are shown in Exhibit 6-6 for the three scenarios. These payments account for nearly all the expenditures by industry in the No HCFC Substitutes Scenario. In the HCFC Substitutes Scenario, transfer payments decline at high fee levels as larger reductions are made in the use and emissions of PROCs. In this situation, the increased costs of the formulations account for an increasing share of total expenditures, although fee payments remain responsible for most of the expenditures even in this case.
Like the No HCFC Scenario, nearly all the expenditures under the High H20 No Alcohol Scenario are associated with the fee payments. The expenditures associated with reformulation and product ingredients are less than 10 percent of the total expenditures.
This result, that industry expenditures are principally associated with the fee payment, is the result of two factors:
o the assumptions made regarding the penetration of the technologies at the various fee levels; and
o the emissions reductions achieved by the technologies.
Because none of the technologies eliminate emissions entirely, fee payments will always exist under the fee-based incentive system analyzed here. Because it is assumed that the technologies are implemented to various degrees as the fee level is increased, significant amounts of fees are paid on the remaining PROC emissions.
These estimates of the fee payments are too low if the anticipated levels of emissions reduction in fact cannot be achieved. In this case, more PROC emissions remain and consequently more fees are paid. These estimates are too high if larger reductions are in fact achieved. Nevertheless, the transfer payments will likely exceed at least $10 million even under extremely optimistic assumptions. For example, if a $1.36 per pound ($3.00 per kilogram) fee were introduced that triggered switching to cost effective technologies by 100 percent of the industry, fee payments would still be in the following range:
o assuming that only the No HCFC Substitute Scenario technologies were introduced, fee payments would be about $30 million;
o assuming that the HCFC Substitutes Scenario technologies are used, fee payments would be about $15 million;
o assuming that the High H20 No Alcohol formulation is used widely, the fee payments would be about $15 million.

$1.36
S0.45
S272 $3.18 S3.63
High Water No Alcohol Scenario
158
The points on each line are labeled with the fee levels, in dollars per pound, that produce the transfer payment and percent reduction estimates shown in the graph.
90
"4 - 80'-0
"' -~ 70
·i ._, ~ 60 C u E ;:,,,,
Q.."' so ... ~
= 40 ..."' -;; ~
30= i: <
20
10
0 0-.,
EXHIBIT 6-6
TltABSFEll PAYMENTS HADE BY IRDUSTllY FOB. I.EDUCING PI.OC EMISSIONS FllOK BAIi. SPRAYS USING A FEE SYSTEM
$4.08
S3.63 No HCFC SubstiDltcs Scenario $3.18
$272
HCFC Substirutcs Scenario
$4.08
20'I, 40'l, 60I,
Percent Rcductioo in PROC E~ions

159
Consequently, even under fairly optimistic assumptions, fee payments will likely be the same general magnitude as current revenues earned by manufacturers.
Of note is that reduced demand plays a relatively small role in the reductions in emissions estimated above. As shown in Exhibit 6-7, the reduced demand accounts for about 1.5 percent to about 9 percent reductions in emissions. Even at high fee levels such as $3.00 to $4.00 per pound ($7.00 to $9.00 per kilogram) of PROC, the reduction in demand is less than 10 percent for both cases. The demand reduction is small because:
o The demand elasticity assumed for these estimates is -0.2. At an elasticity of -0.5 the reduction in demand would be much larger, ranging up to about a 20 percent reduction in demand in response to the high fee levels. If the demand elasticity were -1.0, which seems unlikely given the nature of the product, demand could decline by as much as 35 or 40 percent in response to the high fee levels.
o The increased cost of the product is primarily influenced by the increased costs of the formulation ingredients and the transfer payments (i.e., the fee on the remaining PROCs). The costs of the container, transportation, storage, and distribution are assumed to remain unchanged. Consequently, a 100 percent increase in the cost of the product ingredients translates into only about a 10 percent increase in the final product price.
Although the reduction in quantity demanded is expected to be fairly modest, the change in manufacturing costs is quite substantial. Exhibit 6-8 shows how the cost of ingredients per can will change under the various scenarios. As shown in the exhibit, current ingredient costs are on the order of $0.20 per can. The ingredient costs, including the payment of the fee, will at least double, and may increase by a factor of five or more for the high fee levels.
These increased costs will substantially be passed on to consumers. For example, at a fee level of $1.36 per pound ($3.00 per kilogram), ingredient costs will increase by about $0.40 to $0.60 per can. If these costs are passed on to consumers, prices will increase by the same amount. Given that current prices per can are on the order of $2.50, these price increases would be on the order of 16 to 24 percent of current prices.
Exhibit 6-9 examines the results for a quota system using the combined results of the HCFC and No HCFC cases. The combined case uses the No HCFC results at fee levels less than or equal to $2.27 per pound ($5.00 per kilogram), and the HCFC results at fee levels above this amount. The quota is simulated assuming that the quota allowances are allocated to industry, so that no transfer payments result.
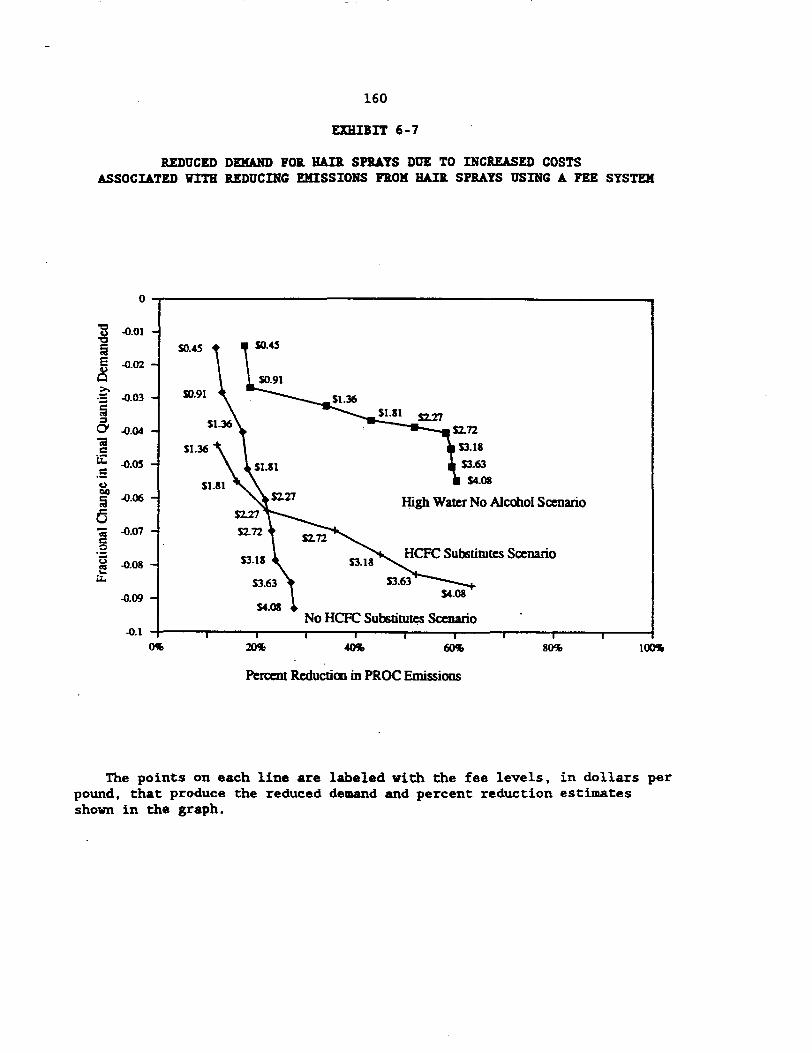
$4.08
High Water No Alcohol Scenario
160
EXHIBIT 6-7
REDUCED DEMAND FOB. BAIi. SPIAYS DUE TO INCREASED COSTS ASSOCIATED WITH REDUCING EMISSIONS Fl.OK BAIi. SPB.AYS USING A FEE SYSTEM
()'l, 20'l, 80'I,~
Pcra:nt Rcductioo in PROC ~ions
The points on each line are labeled with the fee levels, in dollars per pound, that produce the reduced demand and percent reduction estimates shown in the graph.
0
.0.01~ 5 E -0.02 ~ -~ -0.03
~ O' ~
-0.04 ai = ii: .0.05 .5
1:11) " -0.06;j
a i .0.07
0
u .0.08..."' u.
.0.09
.0.1
$0.4S
$0.91
Sl.36
No HCFC Substiru~ Scenario

161
EXHIBIT 6-8
INGREDIENT COSTS PU AVERAGE SIZED CAN RESULTING Fl.OK PROC EMISSIONS REDUCTIONS PB.OK HAll SPRAYS USING A FEE SYSTEM
S1.60
S1.40
- S1.20.!-{o4
a S1.00 u ... ~
so.sos u... C
S0.60:.su
~ tlQ C- S0.40
S0.20 ________ ••. __ ........ _............... _.............. ____ ...... Current Ingredient Costs .. ..
S0.00 ~-----.......--..----....---------,------.....---~ 20'1, ~ 60'1, 80'1,
Percent Reduction in PROC Emiaions
No HCFC Substitutes Scenario
HCFC Substitutes Scenario
High Water No Alcohol Scenario
S0.4S
The points on each line are labeled with the fee levels, in dollars per pound, that produce the ingredient cost and percent reduction estimates shown in the graph.
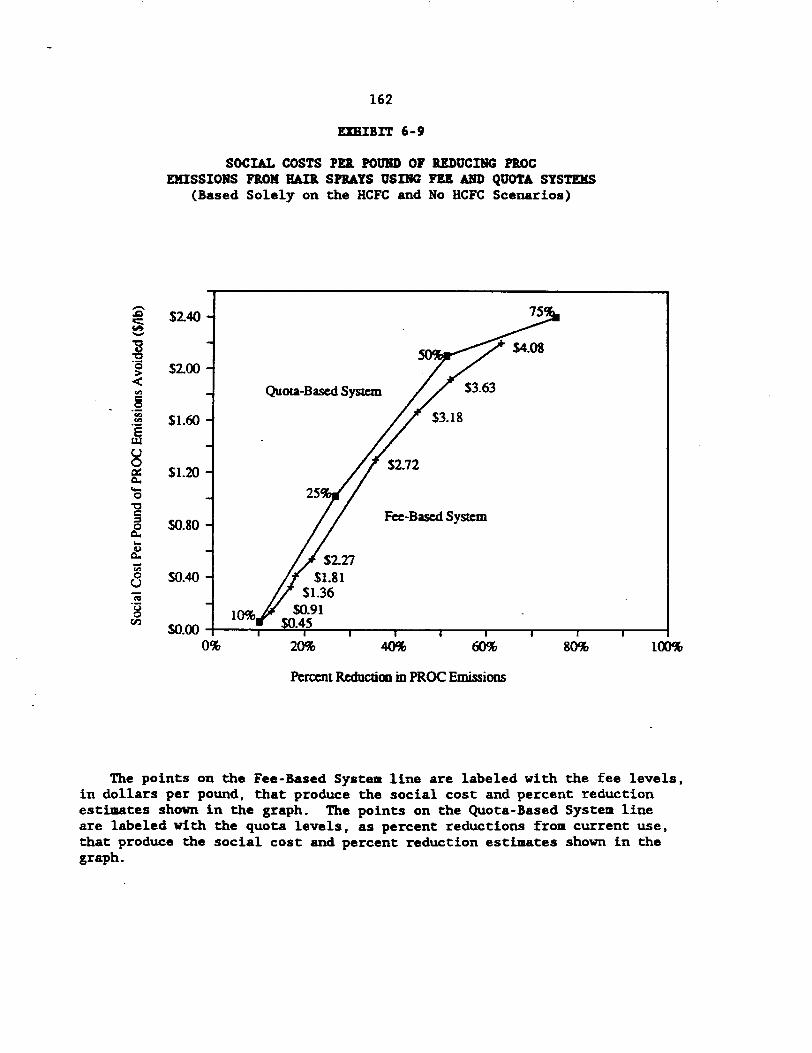
162
EmIBIT 6-9
SOCIAL COSTS PEI. POUBD OF I.EDUCING PB.0C EMISSIONS Fl.OK BAll SPRAYS USING FEE AND QUOTA SYSTEMS
(Based Solely on the HCFC and No HCFC Scenarios)
-~ $240-$200
$1.60
$1.20
50.80
-"' 50.408
10% S0.00
Quota-B~ Sysrcm
Fee-Based System
.27 .81
.36 I
0% 20% 40% fl()% 80% 100%
Percent Rcductioo. in PROC Emissions
The points on the Fee-Based System line are labeled with the fee levels, in dollars per pound, that produce the social cost and percent reduction estimates shown in the graph. The points on the Quota-Based System line are labeled with the quota levels, as percent reductions from current use, that produce the social cost and percent reduction estimates shown in the graph.

163
The social costs per pound of PROC emissions avoided are essentially the same for the quota and fee systems, as would be expected because the social costs do not reflect fee payments. Of note is that in order to achieve reductions of 25 percent and larger in Exhibit 6-9, it is assumed that HCFCs are available for use in these products.
Exhibit 6-10 shows the social costs per pound of PROC emissions avoided for the High H20 No Alcohol Scenario. Again, the costs under the fee and quota systems are very similar as is expected. The costs under this scenario are much smaller than under the combined No HCFC/HCFC scenario shown in the previous exhibit. Clearly, if the High H20 No Alcohol formulation is accepted by consumers, the costs of reducing PROC emissions from hair sprays can be fairly low.
The total expenditures by industry are much smaller under the quota system than under the fee system because the quota system does not require fee_payments, so that there are no transfer payments. Because transfer payments do not increase production costs in the quota system, the changes in product prices and the impacts on consumers are much smaller under the quota system. Because product prices are not expected to increase substantially, the reductions in demand are smaller under the quota system as compared to the fee system at comparable levels of emissions reductions.
6.2.2 Spray Paints
The analysis indicates that high-solids spray paint formulations are the least costly means of reducing PROC emissions from consumer spray paints. At current ingredient costs, high solids pains actually cost less per amount of paint delivered as compared to current formulations.
A 12 ounce can of a high-solids spray paint will paint twice the area of a 12 ounce can of a current formulation. The cost of making 12 ounces of the high-solids paint may be 5 or 10 percent higher than the costs of making 12 ounces of the current formulation. Clearly, the cost per effective painted area is lower for the high-solids paint.
Given that the high-solids paints are less costly than the current formulations per amount of paint delivered, it appears that cost per effective amount of paint is not the barrier that is preventing these paint formulations from being implemented widely. The primary barrier preventing the widespread use of the high-solids paints is that the consumer purchases paint solely on original purchase price, without recognizing that the highsolids paint is actually cheaper. Economic incentives that change the purchase price of paints so that high-solids paint formulations are cheaper per can than current formulations should therefore help promote the use of the low-PROC formulation.
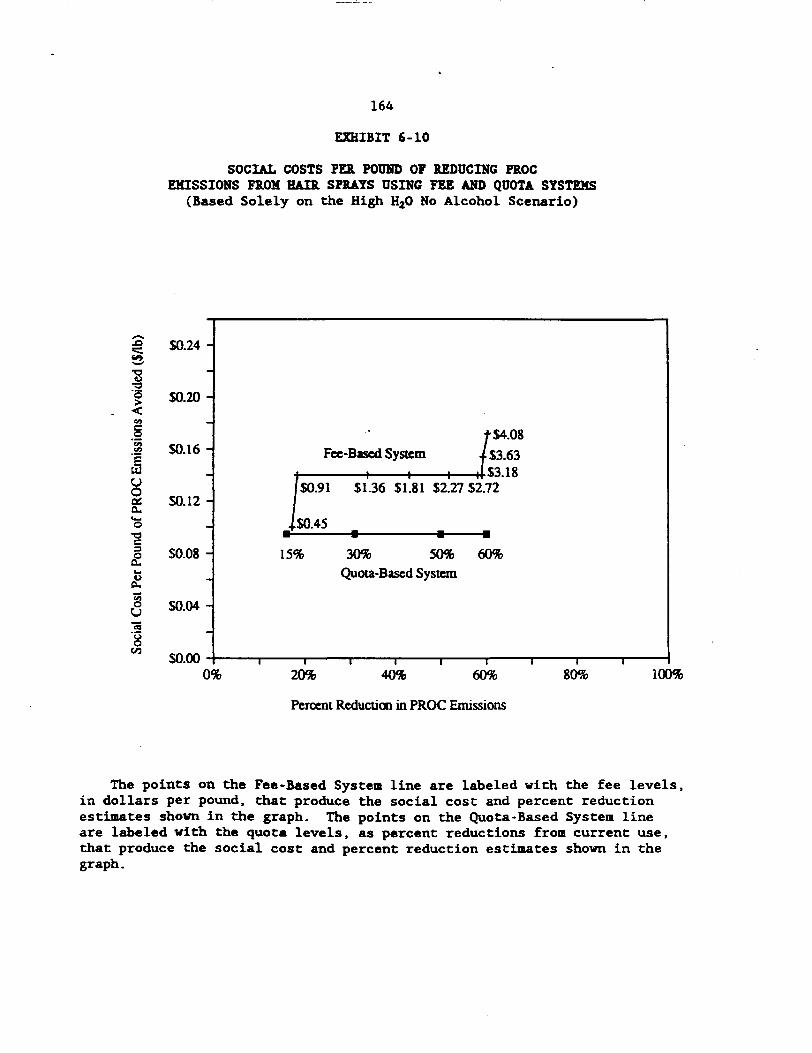
• • • •
164
EXHIBIT 6-10
SOCIAL COSTS PEil POURD OP REDUCING PROC EMISSIONS FB.Oll BAll SPRAYS USING FU AND QUOTA SYSTEMS
(Based Solely on the High H20 No Alcohol Scenario)
-.D $0.240::::. ~ ._,
'E "O·c5 $0.20>
- < "' _§ "' $0.16i 8 a: 50.12 0.. ._ 0
"O C :::, SO.OS ~ ... u 0.. ;; 0 S0.04u -;; ·g er.I
$0.00
$4.08
Fee-Based System S3.63 $3.18
$0.91 Sl.36 SI.SI S2.27 52.72
$0.45
15% 30% 50% 60% Quota-Based System
0% 20% 40% 60% 80% 100%
Percent Rcductioo in PROC Emissions
The points on the Fee-Based System line are labeled with the fee levels, in dollars per pound, that produce the social cost and percent reduction estimates shown in the graph. The points on the Quota-Based System line are labeled with the quota levels, as percent reductions from current use, that produce the social cost and percent reduction estimates shown in the graph.

165
Consumer education would also be required in order to allow the high solids paints to gain acceptance. A reliable system for evaluating and reporting the performance of spray paint products would be required in order to educate consumers regarding the value of high-solids spray paints.
Given the importance of the consumer education aspect of this opportunity for reducing PROC emissions from spray paints, it is difficult to evaluate quantitatively the effect that various fee levels would have on the PROC emissions from spray paints. For this analysis, a range of assumptions is used to represent the potential magnitudes of emissions reductions at various fee levels. Exhibit 6-11 shows the assuaptions used.
As shown in the exhibit, the consumer awareness program could, by itself, lead to the introduction of high-solids spray paints. The extent to which these paints are adopted will depend on the effectiveness of the program. For this example, a fairly modest penetration is assumed (15 per~ent).
With increasing fee levels of up to $1.81 per pound ($4.00 per kilogram) of PROC, the relative ihgredient costs for the high-solids paint formulation improves relative to the ingredient costs of the current most popular spray paint formulation. In the absence of an incentive fee, the ingredient costs of the high-solids paint formulation is about 31 percent higher. This higher ingredient cost leads to a higher original purchase price which, as discussed above, appears to be an important barrier preventing the widespread adoption of this formulation.
With an incentive fee of $0.91 per pound ($2.00 per kilogram), the highsolids paint formulation ingredient costs are about equal to the costs of the current formulation. The costs are about equal because a can of the current formulation has about 88 percent PROCs, whereas a can of the high• solids paint has 75 percent PROCs. Therefore, the incentive fee increases the ingredient costs for a can of the current formulation by a larger amount than it increases the ingredient costs of the high-solids formulation.
As shown in Exhibit 6-11, at an incentive fee of $0.91 per pound it is assumed that the high-solids paint formulation achieves a 50 percent share of the market. At high fee levels, the market share increases because it has a cost advantage in terms of ingredient costs per can.
The transfer payments associated with the fees are also shown in Exhibit 6-11. Of note is that such transfer payments could be used to fund a consumer awareness program. The transfer payments increase by only about a·factor of two when the fee is increased from $0.45 to $1.81 per pound because it is assumed that the higher fee leads to increased use of high· solids paints. Of note is that at demand elasticities of -0.2 (used in the

166
EXNIIIT 6-11
ASSllED PalETIATIOII Of NIGN·IOLIDS PAINTS AT VAIUIJS INCENTIVE FEE LEVELS
EMISSIONS TRANSFER RELATIVE
FEE (I/LB) PENETRATION
(X) REDUCTION
(X) PAYMENTS (106 S)
INGREDIENT COST COIMENTS
No FN 151 ax (none) +31X The cona..-r edJcatlon awareneu progr• would likely lead to IOIMI I.Ill of high-1ol ldl pefnt1 without a fee Incentive.
0.45 25X 15X 4.7 +5X The tranafer 1)1',Wntl are due to the fee on the reMlnlng PROC uaage.
0.91 SOX 30X 7.8 -2X
1.36 751 44X 9.3 ·5X
1.81 951 55X 10.0 ·7l
The relative Ingredient c01t1 are estfNted for the difference In the product Ingredient c01t1 per can, Including the coat of the Incentive fee. The c~rl1on 11 Nde between the Mlt popular current fort11Ulatlon and the prototype hlgh•1ol Ida forllllatton. A poaftfve relative Ingredient coat •ana that the high 1ollda paint fortlllatlon 11 110re costly per 12 ounce can then 11 the current forllllatlon for the ,._ 1he can. Of note 11 that the hfgh•1ollda forllllatlon h l111 costly then the current forllllatlon per ~t of paint delivered even without an Incentive fee.
167
estimates shown in Exhibit 6-11) and -0.5, the reductions in emissions associated with reduced demand are small compared to the total reductions in emissions.
The results of this assessment are clearly based on judgment. A highly effective consumer awareness program could, by itself, lead to larger penetrations of high-solids paints. Alternatively, economic incentives aimed specifically at promoting the adoption of high-solids paints (as opposed to reducing PROC emissions) could be developed.
For example, a fee could be developed based on the solids content of spray paint formulations. No fee would be due if a high-solids paint were sold (e.g., 25 percent solids by weight). However, a fee would be due if low solids formulations were sold, with the fee designed to be a function of the solids content. Although this fee approach would promote the use of high-solids paint with likely lower transfer payments than would a fee system based on PR0Cs, it would not necessarily achieve the maximum pos~ible reductions in PR0C emissions over time. 50
As a comparison to the high-solids formulations case, a separate case was also analyzed that assumes that consumer purchasing behavior cannot be changed substantially, so that high-solids paint formulations are not marketed widely. In this case, substitution with formulations based on water/DME and HCFC-22/DME are the primary means of reducing emissions. These options are more costly than the high-solids formulations (see Exhibit 6-2), requiring fees on the order of $1.75 per pound of PR0C in order to make them cost effective.
Exhibit 6-12 displays the results of this analysis. As shown in the exhibit, fees ranging from $1.81 to $3.63 per pound ($4.00 to $8.00 per kilogram) could produce emissions reductions on the order of 10 to 30 percent. The reduced demand for the products associated with the increased costs of production account for about one-half to one-third of the total simulated reductions. The transfer payments, which account for over 90 percent of the total costs to industry, are shown in the exhibit. These transfers (on the order of $20 to $30 million annually) are very large relative to the total sales revenue for these products. At about $2.70 per can of paint, the total sales revenue for the 28 million can is about $75 million. Manufacturers' revenues would, of course, be only a fraction of this total.
5° For example, if a new spray paint formulation were developed that had both high solids and reduced levels of PR0C solvents and propellant, the fee based solely on the solids content would provide no incentive to introduce the new low-PR0C formulation. A fee based on total PR0C content would provide such an incentive.

168
EXHIBIT 6-12
ANALYSIS OF EMISSIONS REDUCTIONS FROM SPRAY PAINTS AT VARIOUS INCENTIVE FEE LEVELS
ASSUMING THAT HIGH-SOUDS PAINTS ARE NOT USED VIDELY
F.MISSIONS TRANSFER. PENETRATION REDUCTION PAYMENTS
FEE ($/LB) (%) (%) (106 $) COMMENTS
1.81
2.27
2. 72
3.18
3.63
10% each•
15% each
25% each
35% each
45% each
111
14%
18%
26%
32%
20.
24.
28.
29.
30.
No reductions in car touch up paints.
No reductions in car touch up paints.
Car touch up paints assumed to use some high solids formulations.
• The penetration is for water/DME and HCFC-22/DME formulations .
169
As shown in the exhibit, it was assumed that high-solids paint formulations would penetrate into the car touch up market under the assumption that consumers shop for touch up paints differently because there would normally be only one supplier for each type of paint. Consequently, price comparisons are not made as readily, and high-solids formulations could more likely be marketed successfully.
The average social cost of PROC emissions avoided is about $1.25 per pound across all the cases shown in Exhibit 6-12. If high-solids paints are used as described in Exhibit 6-11, social costs are very small, less than $0.05 per pound, because high-solids paints are less costly per amount of paint delivered.
The results of imposing a PROC quota on spray paints should be similar to the results for a fee. Whether a high-solids paints are used will likely depend on changing consumer awareness. As with hair sprays, a quota system will not produce transfer payments, meaning that industry exp~nditures are lower as compared to a fee system.
6.2.3 Industry and Macroeconomic Impacts
The expenditures estimated above are large for the industries that are being affected. For example, even a $0.45 per pound ($1.00 per kilogram) fee on PROCs in hair sprays produces fee expenditures in excess of $10 million per year for industry. Larger fees, of course, produce larger expenditures,
The majority of these expenditures would be made by the product manufacturers. Given the types of products being sold, most of these costs will likely be passed on to consumers in the form of higher prices. Consequently, the impacts on consumers could be important.
Although the expenditures required to reduce PROC emissions under the various incentive systems would likely be passed on to consumers in the form of higher prices, it is useful to get a sense of the magnitude of the expenditures by comparing them to current industry profits. When compared to profits derived from product sales in California in this industry, these expenditures are quite large.
Annual sales in California by the manufacturers of hair sprays are on the order of $50 million per year. This estimate is computed as $0.85 per unit (see Chapter 3 above) times 58.7 million units of aerosol and nonaerosol hair sprays sold in California in 1987. This estimate is consistent with the most recent data available from the Census of Manufactures, which reports national value of products shipped of $372.5 million in 1987 for the estimated 488 million units, or about $0.76 per unit for aerosol hair sprays.
170
Return on revenues for firms in SIC code 284 (Soap, Detergents, and Cleaning Preparations; perfumes, Cosmetics, and Other Toilet Preparations) is estimated at about 5 percent. The median return on sales was obtained from Dun & Bradstreet Dunsprint Service, July 1989, for firms of all sizes in SIC Code 284. Data for 1986, 1987, and 1988 show median returns on sales ranging from 3.2 percent to 8.1 percent. The estimate for the largest firms (over $5 million in assets) was 5.3 percent for 1988.
Profits derived by hair spray manufacturers from hair spray sales in California, therefore are on the order of 5 percent of $50 million, or $2.5 million per year. The expenditures by manufacturers under fee-based incentives, even under the most modest assumptions, are many times this level of industry profit.
Relative to the total retail sales revenues of hair sprays in California (only a small fraction of which is obtained by the manufacturers), the expenditures by industry are still relatively large. Given that total ret~il sales are about 58.7 million units, and assuming an average retail sales price on the order of $2.50 per unit, total retail sales are on the order of $147 million per year. As described above, total expenditures by industry under a fee-based incentive system are estimated to vary from about $10 million per year to about $80 million per year. These levels of expenditures would be passed on to consumers and represent a potentially large fraction of the overall retail expenditures by consumers for these products.
Of note is that the expenditures and price impacts under the quota-based system are smaller because the transfer payments are avoided. Under the quota-based system, a given level of reduction in emissions can be achieved with expenditures by industry being much smaller than the expenditures anticipated with a fee-based system.
Despite the relatively large levels of expenditures anticipated under the fee-based system, reductions in demand for hair spray products are estimated to be fairly modest, less than 10 percent, because a demand elasticity of -0.2 was used. If demand is more elastic, larger reductions in product demand would be expected.
Small reductions in demand indicate that employment effects would likely be small. Nationally, the Census of .Manufactures reports total employment of about 58,400 in SIC code 2844 (Perfumes, Cosmetics, and Toilet Preparations). If a 10 percent decline in sales translated into a 10 percent decline in employment, about 5,800 people would be affected nationwide. The number of employees affected in California would be a small fraction of total affected nationally.
Employment in manufacturing would not be anticipated to decline linearly with sales, so employment impacts would likely be smaller. Given that hair sprays are a small fraction of total consumer products, no significant

171
employment effects are expected in other industries related to these products, including transportation, wholesale, distribution, and retail.
Given these small employment effects, it is very unlikely that significant macroeconomic effects would be experienced. Regional and local impacts should also not be significant because no region or location depend.a on these individual products to any large extent. M described above, the demand elasticity for hair sprays is not well quantified. If demand elasticities are large (i.e., if sales decline by a large amount when prices increase), then employment impacts could be larger than described here. However, it is unlikely that macroeconomic impacts would be large even if larger reductions in sales of hair sprays were experienced than are estimated here.
The conclusions for spray paints similar. If high•solids spray paints are introduced successfully, there should be no impact on the spray paint industry. In fact consumer demand could increase because the costs per amount of paint delivered would decline for the high•solids formulations. As described above, a consumer awareness program will likely be an important component of adopting this formulation.
If high-solids paints are not introduced as the primary means of reducing PROC emissions, industry expenditures will be large relative to industry profits and overall product revenues. Like with hair sprays, these expenditures will be passed on to consumers in the form of higher product prices. Nevertheless, the macroeconomic impacts will be very small.
Although the industry, macroeconomic and regional/local impacts are expected to be small for emissions reductions associated with these individual products, reducing emissions from a wide range of products could produce larger impacts. For example, if demand for all consumer aerosol products declines due to initiatives to reduce PROC emissions from these products, the aerosol filling industry could experience a large reduction in demand for their services. This situation could be similar to the situation that occurred when CFCs were banned from nonessential aerosol propellant applications in the late 1970s.
Although such impacts could be important, emissions reduction initiatives across a wide range of products would likely be required nationally to have large national or even regional impacts. If California and several other large states with air quality problems undertook to reduce PROC emissions from consumer products, the combined effect of such initiatives could produce shifts in formulations and packaging in a way that could produce employment effects in selected industries, such as the aerosol filling industry. The potential magnitude of these impacts cannot be quantified at this time.

7. SYNTHESIS AND RECOMMENDATIONS
The analyses in the previous chapters evaluate the potential to reduce PROC emissions from hair sprays and spray paints using fee-based and quotabased economic incentive systems. The analyses indicate that reductions in PROC emissions may be induced in both the hair spray and spray paint markets. Achieving large reductions in hair spray PROC emissions requires that HCFCs be made available for these products or that a new High H20 No Alcohol formulation be accepted by consumers. Due to concerns that the HCFCs may contribute to stratospheric ozone depletion, their availability in the future is not assured.
Of note is that large transfer payments (government revenues) are anticipated under the fee systems. An allocated quota system that did not generate transfers would likely produce similar emissions reductions with reduced expenditures by industry as a whole. An equitable mechanism for all~cating the quota is needed.
In the case of spray paints, the,introduction of high-solids paints could reduce PROC emissions. However, the success of such an approach would likely require an effective consumer education program. The effectiveness of such a program cannot be determined at this time. Although a fee system could be used to raise funds to conduct such a program, the fee levels needed to raise adequate funds for the program would likely be very small. For example, a fee of $0.25 per pound of PROC in spray paints sold in California51 would raise on the order of $3 million per year, which would likely be adequate for a consumer education program. Such small fees, however, would provide little or no incentive for modifying the formulations of spray paints.
If high-solids paints cannot be introduced significantly into the spray paints markets, water/DME and HCFC-22/DME based reformulations may be used to reduce emissions. The fees needed to make these options cost effective would be fairly large (over $1.80 per pound) resulting in large transfer payments from industry, and reductions in demand.
An important characteristic of the products analyzed is that there are uncertainties regarding the techniques for reducing PROC emissions and the level of emissions reduction that can be achieved. In the case of hair sprays several HCFC formulations may be possible, which could reduce PROC emissions by large amounts (by 30 percent or more). A new High H20 No Alcohol formulation could reduce emissions by about 60 percent. Emissions reductions will not likely be as large if the water/DKE formulation and alternative packaging are the prillary technologies employed.
51 Such a fee amounts to about $0.10 per can of spray paint.
173
Similar uncertainties exist in the spray paints products. While highsolids paint formulations hold good promise, other alternatives may have to be relied upon in order to achieve emissions reductions.
These uncertainties can only partially be resolved over time through additional study. The adequacy of various formulations and emissions reduction opportunities m.ust ultimately be tested in the marketplace. It is these uncertainties that make economic incentives a potentially useful mechanism for reducing emissions.
The advantage of using an economic incentives approach is that industry and consumers are provided with the maxilllUDl amount of flexibility for resolving these various uncertainties. The best technologies can be developed over time that are the most cost effective. 'While some technologies may not be as effective as believed today, others may come along that are even better. In the case of hair sprays again, an economic incentives approach allows alternative formulations and alternative packaging (such as Exxel, Growpak, and pump sprays) to compete on an equal
. basis. The most cost effective technologies that provide the product characteristics that are most valued by consumers will succeed.
Given this view that an important advantage of economic incentives is that they provide flexibility, to maximize the flexibility of industry and consumers to reduce emissions it would be preferred to cover a wide range of products under a single economic incentives umbrella. For example, rather than set up separate fees or quotas for each product, a single fee or quota system could be established for a group of products. If, for example, all personal care aerosol products were covered by a single quota system, the diversity of products would be fairly great. The opportunities for reducing emissions would vary (possibly significantly) from one product to the next, and would likely be numerous. Over time some opportunities for reducing emissions would be realized, while other opportunities are not. By covering a wide range of products the system automatically allocates emissions reductions over time as technologies develop.
This approach is analogous to the approach recently taken by the U.S. EPA in its control of CFCs. A quota has been set on the production and consumption of CFCs, which are used in a very broad range of products in the U.S. and around the world. Individual controls for selected products have not been required. The result is that a wide range of opportunities for reducing CFC use has been developed. Some product areas have found inexpensive avenues for making large reductions, while others have made little or no progress in reducing CFC use. The overall umbrella approach enables CFCs to be used in the most cost effective manner possible over time as progress is made.
A similar result would be anticipated if an umbrella approach were taken for implementing a quota on PROC emissions from consumer products. By covering a wide range of products, the rule would limit the risks associated with individual emissions reduction technologies not working

174
out. By limiting these risks, the likelihood of inadvertently imposing large costs on industry and consumers is minimized.
The analysis of spray paints presented above also indicates that economic incentives are not always sufficient for promoting emissions reduction. In this case it appears that consumer education would be an important companion to an economic incentives program.. Coordinated testing of alternative compounds and/or setting standards are also potentially important companion programs for some products.
Given the analyses of the two products presented above, and these perspectives on the value of economic incentives for reducing PROC emissions, the following is recommended:
o Several groups of products should be defined as candidates for economic incentive programs. Possible groups could include: personal care products; household products; automotive/industrial products; pesticide products; and miscellaneous products.
o For each group of products defined above, the potential range of emissions reduction that could be achieved under various assumptions should be assessed. The barriers that must be overcome to realize these emissions reduction should be identified.
o For each group of products defined above, the number of manufacturers that would potentially be affected by an economic incentives program should be estimated.
o Based on these assessments, an economic incentives program to reduce PROC emissions from each of the individual groups of products should be defined. Because an allocated quota system appears to produce smaller impacts than would a fee system, a quota system should be designed as part of this process. Additionally, if innovative fee systems can be identified that do not produce unreasonable levels of revenues, they should also be considered.
o If non-cost market barriers exist that will prevent the timely introduction of PROC emission-reducing technologies, strategies for overcoming these barriers should be defined as companions to the economic incentive system.

APPENDIX A
HAIUCETEllS/HANUFACTUREllS OF HAIi. SPRAY ARD SPRAY PAINT PRODUCTS IN CALIFORNIA

(Page Intentionally Left Blank)

APPENDIX A
HARDTEllS/lfANUFACTUllllS OF HAIJl SPRAY AND SPRAY PAINT PRODUCTS IN CALIFORNIA1
Altawood Inc. 18924 S. Broadway Gardena. CA 90248 (213) 321-0582
Behr Process Corp. 3400 W. Segerstrom Ave. Santa Ana. CA 92704 (714) 545-7101
California Custom Accessories Manufacturing Co. 23011 S. Wilmington Ave. Carson. CA 90745 (213) 775-8621
Colonial Dames Co .• Inc. 6820 East Watcher St. Commerce. CA 90022 (213) 773-6441
Deft Inc. 17451 Von Karman Ave. Irvine. CA 92714 (714) 474-0400
Flecto Co .• Inc. P.O. Box 12955 Oakland, CA 94604 (415) 655-2470
Image Laboratories 721 South San Pedro Los Angeles. CA 90014 (213) 623-9254
spray paints
spray paints
spray paints
hair products
spray paints
spray paints
hair spray
1 Includes national. regional. and local firms with operations in California. National marketers that distribute to California, but that do not have manufacturing facilities in California are not included.

A-2
Jhirmack Enterprises, 4350 Caterpillar Road Redding, CA 96003 (916) 246-2100
Inc. hair spray
Max Factor & Co. 1655 N. Mccadden Place Hollywood, CA 90028 (213) 856-6000
hair spray
Merle Norman Cosmetics 9130 Bellanca Ave. Los Angeles, CA 90045 (213) 641-3000
hair spray
Met-L-Chek Co. 1639 Euclid St. Santa Konica, CA 90404 (213) 450-1111
spray paints
National Aerosol Produc~s. Division of Grow Group 2193 E. 14th St. Los Angeles, CA 90021 (213) 627-2668
Co. spray paints
Pactra Industries, 420 S. 11th Ave. P.O. Box 280 Upland, CA 91786 (714) 946-3871
Inc. spray paints
Redken Laboratories 6625 Variel Ave. Canoga Park, CA 91303 (818) 992-2700
hair spray
San Leandro Color 555 East 14th St. San Leandro, CA 945 77 (415) 569-8236
spray paints
Sebastion International 6109 De Soto Ave. Woodland Hills, CA 91367 (818) 999-5112
hair spray

A-3
Standard Brands Paint Co. 4300 W. 190th St. Torrance, CA 90509 (213) 542-5901
spray paints
Trail Chemical Corp. 9904 Gidley St. El Monte, CA 91731
spray paints
Zynolyte Products Co. Subsidiary of Standard Brands Paint Co. 2320 E. Dominguez St. Carson, CA 90749 (213) 513-0700
spray paints
(Page Intentionally Left Blank}

APPENDIX B
HAIi. SPRAY AND SPRAY PAINT AEI.OSOL FILLERS IR CALIFORNIA

(Page Intentionally Left Blank)

APPENDIX B
HAIR SPRAY AND SPRAY PAINT AEROSOL FILLERS IN CALIFORNIA
Aerosol Paint Packaging, Inc. 4730 Astoria Circle Anaheim, CA 92807 (714) 998-4676
Aerosol Services Company, Inc. 425 S. Ninth Ave. City of Industry, CA 91746 (818) 968-8531
National Aerosol Products Co. (Division of Grow Group, Inc.) 2193 E. 14th St. Los Angeles, CA 90021 (213) 627-2668
Shield Aerosol Co. of California 5165 G Street Chino, CA 91710 (714) 628-4707
Sprayon Products Division The Sherwin-Williams Co. 3818 E. Coronado St. Anaheim, CA 92807 (714) 630-1400
Sun Labs 9151 Mason Ave. Chatsworth, CA 91311 (818) 709-7777
Zynolyte Products Co. Subsidiary of Standard Brands Paint Co. 2320 E. Dominguez St. Carson, CA 90749 (213) 513-0700
spray paints
hair spray
spray paints
spray paints and hair spray
spray paints
hair spray
spray paints

(Page Intentionally Left Blank)
APPENDIX C
HAIR SPRAY AND SPRAY PAINT DISTllIBUTOB.S IN CALIFORNIA

(Page Intentionally Left Blank)

HAIR SPRAY AND
Aerosol Services, Inc.
Altawood, Inc.
Amway
Armor-all Division
Behr Process Corporation
California Custom Accessories
California Hardware
Carter-Wallace
Champion's Choice, Inc.
Colonial Dames Company
Deft, Inc.
Duart Manufacturing Company
·Fleeto Company, Inc.
Image Laboratories, Inc.
Orb Industries, Inc.
Pactra Industries, Inc.
Redken Laboratories, Inc.
San Leandro Color
APPENDIX C
SPRAY PAINT DISTRIBUTORS
City of Industry
Gardenia
Orange
Irvine
Santa Ana
Carson
City of Industry
Obispo Beach
Anaheim
City of Commerce
Irvine
San Francisco
Oakland
Los Angeles
Upland
Upland
Canoga Park
San Leandro
IN CALIFORNIA
hair spray
spray paints
utlity/personal products
spray paints
spray paints
spray paints
spray paints
personal care products
spray paints
hair spray
spray paints
hair spray
spray paints
hair spray
spray paints
spray paints
hair spray
spray paints

Standard Brands Paint Company
E.A. Thompson Company Inc.
Trail Chemical Corporation
Zynolyte Products Company
C-2
Torrence spray paints
San Francisco spray paints
El Monte spray paints
Carson spray paints
APPENDIX D
DISCUSSION OF AVERAGE AND LAllGEST CAN SIZES
(Page Intentionally Left Blank)
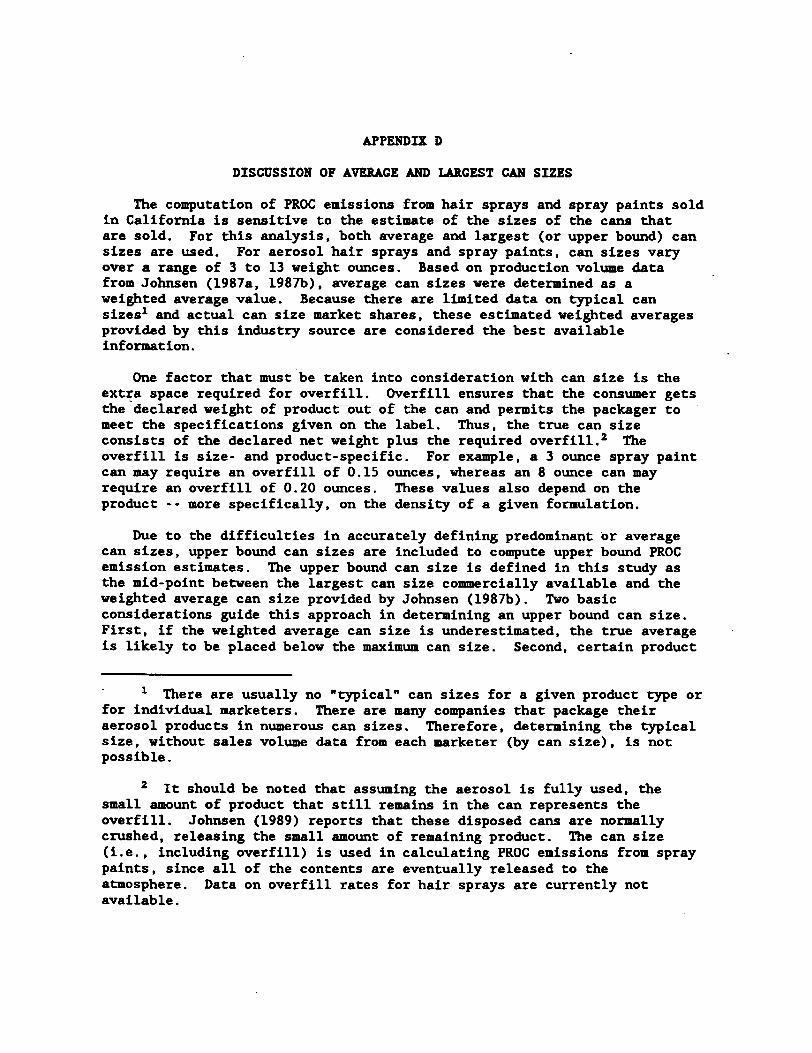
APPENDIX D
DISCUSSION OF AVEBAGE ARD L\llGEST CAR SIZES
The computation of PROC emissions from hair sprays and spray paints sold in California is sensitive to the estimate of the sizes of the cans that are sold. For this analysis, both average and largest (or upper bound) can sizes are used. For aerosol hair sprays and spray paints, can sizes vary over a range of 3 to 13 weight ounces. Based on production volume data from Johnsen (1987a, 1987b), average can sizes were determined as a weighted average value. Because there are limited data on typical can sizes1 and actual can size market shares, these estimated weighted averages provided by this industry source are considered the best available information.
One factor that must be taken into consideration with can size is the extra space required for overfill. Overfill ensures that the consumer gets the ·declared weight of product out of the can and permits the packager to meet the specifications given on the label. Thus, the true can size consists of the declared net weight plus the required overfill. 2 The overfill is size- and product-specific. For example, a 3 ounce spray paint can may require an overfill of 0.15 ounces, whereas an 8 ounce can may require an overfill of 0.20 ounces. These values also depend on the product·· more specifically, on the density of a given formulation.
Due to the difficulties in accurately defining predominant or average can sizes, upper bound can sizes are included to compute upper bound PROC emission estimates. The upper bound can size is defined in this study as the mid-point between the largest can size commercially available and the weighted average can size provided by Johnsen (1987b). Two basic considerations guide this approach in determining an upper bound can size. First, if the weighted average can size is underestimated, the true average is likely to be placed below the maximum can size. Second, certain product
1 There are usually no "typical" can sizes for a given product type or for individual marketers. There are many companies that package their aerosol products in numerous can sizes. Therefore, determining the typical size, without sales volume data from each marketer (by can size), is not possible.
2 It should be noted that assuming the aerosol is fully used, the small amount of product that still remains in the can represents the overfill. Johnsen (1989) reports that these disposed cans are normally crushed, releasing the small amount of remaining product. The can size (i.e., including overfill) is used in calculating PROC emissions from spray paints, since all of the contents are eventually released to the atmosphere. Data on overfill rates for hair sprays are currently not available.

D-2
categories have a wider range of can sizes than others and, presumably, the standard deviation from the reported average size will be higher for these products (e.g., spray paints). Compared to an arbitrary percent increase from the average can size (e.g., plus or minus 25 percent), the approach used in this study accounts for the actual range of can sizes available in the market.
Aerosol coatin&s
For aerosol coatings, the average can size was determined to be 8.1 ounces. Johnsen (1987a, 1987b) states that without accounting for overfill, 40 percent of aerosol coating cans are 3 ounces, 10 percent are 8 ounces, and 50 percent are 10 to 13.5 ounces (or an average of 11.75 ounces). These typical sizes, i.e., 3, 8, and 11.75 ounces, are adjusted to account for the overfill by adding in 0.15, 0.20, and 0.25 ounces, respectively. Thus, the weighted average is determined to be approximately 8.1 ounces as follows:
40% of 3.15 ounces - 1.26 10% of 8.20 ounces - 0.82 50% of 12.00 ounces - k....QQ
Average Fill - 8.08
It is important to note that 3-ounce cans are widely used in this market (Johnsen 1987b):
o The 3-ounce can is the most common size used for automobile touch-up work. These enamels come in approximately one thousand different colors. Few people will buy a large 12-ounce can just to cover a scratch on a painted surface. Additionally, the large cans are only available in a limited array of colors.
o Most of the major automobile dealers, supply stores, and body shops sell 3-ounce cans for touch-up work. These firms are supplied by distributors. Supermarkets and other general stores, however, tend to carry the larger sizes only.
As previously mentioned, there are no •typical• can sizes for specific product categories, nor are there typical sizes for individual marketers. New York Bronze, for example, markets no less than eight can sizes (Johnsen 1987b).
For aerosol coatings the upper bound can size is estimated at 10.1, i.e., the mid-point between the average can size of 8.1 and the maximum size of 12 ounces.
D-3
Hair sprays
For aerosol hair sprays the weighted average can size of 8.3 ounces is computed based on the can sizes and market shares of the 10 most popular brands (see Section 3 in the main body of the text). Data are currently not available on the amount of overfill used in aerosol hair sprays. The upper bound estimate of 9.7 ounces is computed as the mid-point between 8.3 and the largest prevalent can size of 11 ounces.
For pump hair sprays, an estimate of average container size of 6.3 ounces is used (Johnsen 1989). An upper bound estimate of 7 ounces is used to determine upper bound emission estimates.

D-4
REFERENCES
Johnsen, K. A. 1987a. Aerosol Chlorinated Solvent Market Survey, by Monfort A. Johnsen commissioned by ICF Inc., July 1987.
Johnsen, K. A. 1987b. Aerosol Market Report by K. A. Johnsen. Commissioned by ICF Incorporated. August 1987.
Johnsen, K. A., 1989. Personal communication. February 1989.
APPENDIX E
CALCULATIONS FOR CORRECTED RATIO OF illl.OSOL/POIIP PROC APPLICATION RATES

(Page Intentionally Lefc Blank)

APPENDIX E
CALGJLATHIIS FOi IDRECTED UTIO Of AEllOSOl/PIII' PIOC APPLICATICII UTEI
F-l• Adult Aerosol Fe.le Adult Puiip Wet ght Uled PROC X Tot■ l PROC U1ed Weight u,ed PROC X Tot■ l PROC U1ed (gr-> (gr-> (gr-> (gr->
256 98.1 251.136 1.7 89.3 1.5181 61.5 98.1 60.3315 7.9 89.3 7.0547
180.2 98.1 176.7762 12.3 89.3 10.9839 86.4 95.4 82.4256 32.8 89.3 29.2904 7.8 97.5 7.605 43 89.3 38.399
73.8 97.5 71.955 115.2 89.3 102.8736 30 98 29.4 a.a 89.2 7.8496
62.8 98 61.544 32.7 89.2 29.1684 103.7 98 101.626 41.7 89.2 37.1964 145.9 98 142.982 53.3 89.2 47.5436 153.7 98 150.626 70.7 89.2 63.0644 16.7 97 16.199 94 89.2 93.848 18.2 97 17.654 181.2 89.2 161.6304 23.2 97 22.504 34.a 95.5 33.234 30. 1 97 29.197 38.8 86.5 33.562 47. 1 97 45.687 146 86.5 126.29
106. 1 98 103.978 10.9 90.5 9.8645 124.4 97 120.668 128.7 90.5 116.4735 171.3 97 166.161 200.1 90.5 181.0905
85 94.6 80.41 12.7 90. 1 11.4427 76.7 98.4 75.4728 58.5 90. 1 52.7085 69.1 90.8 62.7428 64 94.3 60.352 80.6 90.8 73.1848 13.2 94.3 12.4476
193 90.8 175.244 20.5 94.3 19.3315 11.6 89.2 10.3472 26.1 94.3 24.6123 39.4 89.2 35.1448 31.5 94.3 29. 7045 43.8 89.2 39.0696 41.2 94.3 38.8516 49.7 89.2 44.3324 46.3 94.3 43.6609 55.4 89.2 49.4168 59.7 94.3 56.2971 12.1 98. 1 11.8701 60.6 94.3 57.1458 33.2 98.1 32.5692 11 .7 94.9 11.1033
48 98.1 47.088 28.2 94.9 26.7618 51.1 98.1 50.1291 28.6 94.9 27.1414 52.4 98. 1 51.4044 57;5 94.9 54.5675 52.8 98.1 51.7968 77.4 94.9 73.4526 99.3 98.1 97.4133 87.2 94.9 82.7528 37.a 98.1 37.0818 92.8 94.9 88.0672 40. 1 98.1 39.3381 135.3 94.9 128.3997
104.6 98.1 102.6126 27.6 90.7 25.0332 217.2 98. 1 213.0732 32.9 90.7 29.8403 27.5 95.1 26.1525 58 90.7 52.606 29.6 95.1 28.1496 58.9 90.7 53.4223 81.2 96.7 78.5204 69.3 90.7 62.8551

E·2
F-l• Aclllt Aerosol FeNle Aclllt P..., W.lllflt u,ec:1 PROC X Total PROC Used Weight Used PROC X Total PROC U1ed (gr-> (gr-> (gr-> (gr->
63.4 96.7 61.3078 8.5 91.9 7.8115 74 96.7 71.558 259.3 91.9 238.2967
81.3 96.7 78.6171 182.4 88.8 161.9712 89.1 96.7 86. 1597 23.7 ea.a 21.0456
108.4 96.7 104.8228 201.1 88.8 178.5768 5.4 94.6 5.1084 9.6 92.3 8.8608
10.5 94.6 9.933 16.6 92.3 15.3218. 14.7 94.6 13.9062 88 92.3 81.224
1]5.1 94.6 127.8046 105 92.3 96.915 71.7 93.5 67.0395 14.9 89.9 13.3951
171.6 93.5 160.446 50.9 89.9 45.7591 178. 1 93.5 166.5235 63.4 89.9 56.9966
9. 1 97.5 8.8725 87.4 89.9 78.5726 49. 1 97.5 47.8725 97.9 89.9 88.0121
142.9 97.5 139.3275 46. 1 92.6 42.6886 26.4 95.2 25. 1328 69.7 88.3 61.5451 31.5 95.2 29,988 11 .6 93.9 10.8924 59.5 95.2 56.644 24.6 93.9 23.0994 62.4 95.2 59.4048 26.3 93.9 24.6957
108.9 95.2 103.6728 27.8 93.9 26.1042 14 94.7 1].258 31.3 9].9 29.3907
16.8 97.4 16.3632 47.3 93.9 44.4147 26.8 97.4 26.1032 58.6 9].9 55.0254 26.9 97.4 26.2006 115.4 9].9 108.3606 29.8 97.4 29.0252 12.5 92.8 11.6 41.3 97.4 47.0442 38.9 92.8 36.0992
50 97.4 48.7 50.2 92.8 46.5856 68 97.4 66.232 75. 1 92.8 69.6928
110.6 . 97.4 107. 7244 12.2 92.8 11.3216 176.3 97.4 171.7162 32.6 92.8 30.2528 16.7 96.2 16.0654 52.2 92.8 48.4416 24.5 96.2 23.569 196.6 92.8 182.4441 78.] 96.2 75.3246 202.4 92.8 187.8272
123.2 96.2 118.5184 25. 1 94 23.594 154.3 96.2 148.4366 33.4 86.5 28.891 ]0.4 97.5 29.64 62.1 94.5 58.6845 58.6 97.5 57.135 31.4 96.9 30.4266
119.1 97.5 116.1225 40.7 96.9 39.4383 35.7 92.9 33.1653 50.4 96.9 48.8376 49.2 92.9 45.7068 63.] 93,8 59.3754 83.] 92.9 77.3857 299 93.8 280.462 88.4 92.9 82.1236 171.2 87.8 150.3136 96.8 92.9 89.9272 173.5 87.8 152.333

E·3
F-l• Acl.llt Aerosol F-l• Acl.llt PI.Wlp Weight U1ed PROC I Totel PROC Uled Weight Uled PROC I Totel PROC UNd (gr-> (gr-> (gr-> (gr->
106.7 92.9 99.1243 40. 1 87.5 35.0875. 151.2 92.9 140.4648 15.5 89.3 13.8415 13.8 97.8 13.4964 40.5 89.3 36.1665
171.6 95.9 164.5644 7.2 96.8 6.9696 25.7 96.6 24.8262 7.7 96.8 7.4536 43.4 96.6 41.9244 15.4 96.8 14.9072 7].5 96.3 70.7805 16.5 96.8 15.972
205,2 96.3 197.6076 20 96.8 19.36 11.7 98.8 8.5956 32.4 96.8 31.3632
32.6 98.8 32.2088 33 96.8 31.944 36.7 911.8 36.2596 46.5 96.8 45.012 39.7 98.8 39.2236 125.3 96.8 121.2904 39.8 98.8 39.3224 4. 1 96.9 3.9729 45. 1 98.8 44.5588 26 96.9 25.194 46.2 98.8 45.6456 43.8 96.9 42.4422 19.3 96.8 18.61124 52. 1 96.9 50.4849 19.8 ~-8 19.1664 58 96.9 56.202 41.6 96.8 40.2688 64.3 96.9 62.3067 42.2 96.8 40.8496 96.4 96.9 93.4116 · 42.8 96.8 41.4304 2.8 77.3 2.1644 60.4 96.8 511.4672 11.4 77.3 8.8122 711.6 96.8 76.0848 20.3 77.3 15.6919
123.5 96.8 119.548 27. 1 77.3 20.9483 125.8 96.8 121.7744 30.2 77.3 23.3446 10.8 95.7 10.3356 39.7 77.3 30.6881
13 95.7 12.441 41 77.3 31,693 15.6 95.7 14.9292 42.1 77.3 32.54]] 22.3 95.7 21.3411 43.8 77.3 33.8574 30.5 95.7 29.1885 47.5 77.3 36.7175 37.9 95.7 36.2703 71.4 77.3 55.1922 45.4 95.7 43.44711 76.2 77.3 58.9026 51.1 95.7 41.9027 99.8 77.3 77.1454 58. 1 95.7 55.6017 163.2 77.3 126.1536 58.7 95.7 56.1759 23.1 0 0 76.4 95.7 73.1148 41.7 0 0 711.8 95.7 75.4116 52. 1 0 0
102.8 95.7 911.3796 52.6 0 0 106.2 95.7 101.6334 60 0 0 113.6 95.7 108.7152 62.5 0 0 114.3 95.7 109.3851 66.9 0 0 118.2 95.7 113.1174 . 108.7 0 0 155.7 95.7 149.0049 141.8 0 0 167.6 95.7 160.3932 211 0 0

E·4
f-le Adult Aerosol f-le Aclllt Pu.p Wefoht Uaed (grMI)
PROC X Totel PROC Used (gr.,.)
Wefot,t Used (grMII)
PROC X Total PROC Uaed (gr.,.)
200.4 95.7 191.7828 13.3 91.8 12.2094 225.9 95. 7 216.1863 29.4 91.8 26.9892 239.7 95.7 229.3929 40 91.8 36. 72
7.8 97.6 7.6128 47 91.8 43.146 28.2 97.6 27.5232 71.5 91.8 65.637 47.4 97.6 46.2624 122.8 91.8 112.7304
152.5 97.6 148.84 93.8 o.o 0,0 47.7 96 45. 792 48.0 o.o 0.0 99.8 96 95.808 20.2 87.7 17.7154 28.3 96.8 27.3944 50.7 87.7 44.4639 29.4 96.8 28.4592 46.8 87.7 41.0436 93.8 96.8 90.7984 45.7 94. 7 43.2779 25.5 97.5 24.8625 62.1 94.7 58.8087 44.5 97.5 43.3875 155.4 94.7 147.1638
140 97.5 136.5 9.4 94.7 8,9018 68.4 94.4 64.5696 24.9 94. 7 23.5803 32.6 97.6 31.8176 21.8 94.7 20.6446
136.7 98
97.6 94.4
133.4192 92.512
41.3 75.8
94.7 87
39,1111 65.946
29.9 94.4 28.2256 41 91.4 37.474 64.4 94.4 60. 7936 52 91.4 47,528
131.3 94.4 123.94n 31.4 88.9 27.9146 174.2 94.4 164.4448 82.9 88,9 73.6981 10.6
40 97.5 97.5
10.335 39
88.1 88.9 78,3209
56.3 96,5 54.3295 98.2 96.5 94.763
Total 11631.6 111n.1 8379.3 7599.4 Average per UHr SMple Size
74.6 156
96,1 71.6 59.4 141
90.9 53.9
PRO C RATIO AEROSOL/PUMP (ADJUSTED f OR SAMPLE SIZE) ■ 1.33 -■■■■■-

APPENDIX F
FRAMEVORK AND METHOD FOR. ESTIMATING COSTS OF I.EDUCING THE USE OF
PR.OC COMPOUNDS IR CALIFORNIA

(Page Ineentionally Lefe Blank)

APPENDIX F
RAMEVOll ARD HETBOD FOi. ESTIMATING COSTS OF REDUCING THE USE OF
noc COMPOUNDS IN CALIFOIUUA
This appendix describes the analytical framework and methoda used to estimate the costs of reducing the use of photochemically reactive organic compounds (PROC) in consumer products sold in California. The emphasis of the approach is on estimating the net social cost1 of reducing the use of the compounds. An essential step in estimating these social costs is assessing potential industry responses to incentives which would be implemented to achieve the desired reductions. This assessment. in turn, calls for estimates of the private costs faced by the affected industries of complying with the regulations. Hence, the approach employed provides estimates of both private and social costs.
·The framework for estimating social costs essentially consists of measuring the changes in consumer surplus in the markets for products that contain PROCs. This appendix is organized as follows:
0 Section 1 discusses the conceptual approach for estimating social and private costs in response to economic incentives (fees and quotas).
0 Section 2 describes the methods used to estimate the costs.
0 Section 3 discusses some of the inherent limitations of the analytic methods used.
1. CONCEPTUAL APPI.OACH FOR ESTIMATING UGUIATOI.Y COSTS
This section discusses the economic theory that underlies the approach used to estimate the private and social costs of regulations that restrict the use of PROCs in consumer products. The basic method for estimating costs is to measure changes in producer and consumer surplus in the relevant markets that result from the implementation of incentives for reducing PROC emissions.
The section initially identifies the relevant markets and characterizes the supply and demand schedules that underlie them. The section then turns to the issue of measuring changes in producer and consumer surplus in these markets due to exogenously imposed incentives for reducing PROC emissions. The section ends with a discussion of the differences between private and social costs.

F-2
1.1 Affected Parties and Relevant Marketa
To analyze the costs of the proposed incentives it is necessary, first, to identify the parties that are likely to be significantly affected by the incentives and the markets in which the changes in the welfare of these parties can be measured.
The parties likely to be affected by the incentives are:
o firms that produce PROCs;
o owners of factors employed in the production of PROCs;
o firms that use PROCs in the production of PROC-containing consumer products;
o owners of factors employed in the production of PROC-containing consumer products; and
o final consumers of goods manufactured using PROCs.
For this analysis it is assumed that incentives for reducing PROC emissions from consumer products in California do not have important impacts on the overall markets for the production of PROCs. 1 Therefore, the impacts to be estimated are focused in the firms that produce PROC-containing consumer products and the final consumers of those products.
1.2 Estimating Consumer and Producer Surplus Changes
Consumer surplus is a measure of the difference between what consumers are willing to pay for a good and what they have to pay for it. As such, it indicates the net gain to consumers of being able to buy all units of the good at the prevailing price. In graphical terms, consumer surplus is given by the area under a demand curve above the price line.
Producer surplus is a measure of the difference between the price firms received for their output and the price at which they are willing to supply the output. Thus, it is a measure of the net gains to firms of being able to sell all of their output at the prevailing price. In graphical terms, the aggregate producer surplus of a competitive industry is given by the area above the industry's supply curve under the price line.
Specifically, the assumption is that the reductions in PROC use in consumer products in California does not change the price of PROCs in the market for PROCs. Under this •unchanged PROC price• assumption, there are no welfare impacts in the PROC market, even though total quantities of PROCs produced and consumed may change.
1

F-3
Exhibit F-1 shows graphically the changes in producer and consumer surplus quantities that are being estimated for this analysis. The exhibit shows quantity consumed on the horizontal axis (e.g., the number of hair spray cans sold in California in a year) and the price per unit on the vertical axis (e.g., the price per can of hair spray). The initial situation is described by the point A in the exhibit, which shows Qc, units consumed at a price of P0 • In response to the economic incentives, the cost of producing the product increases and the new situation is described by point B.
Yb.en going from A to B consumer surplus in this aarket falls by an amount equal to the rectangular area D+E. The change in producer surplus is equal to the difference between the lower triangular area F+G and the upper triangular area D+F; this difference is area G-D. If the higher PROC price simply results in a parallel shift in the output supply curve, and if total quantity consumed does not change, area Dis equal to area G and there is no change in producer surplus.
The net change in the sum of producer and consumer surpluses is equal to area D+E plus area G-D, which is areas E+G. Thus, the cost is driven by the shift in the supply curve.
To evaluate these quantities shown in the exhibit, data were collected on the manner in which the supply curve for consumer products produced with PROCs would shift in response to economic incentives. Such a shift is a change in the costs of producing the products associated with changing the product formulations and/or making capital expenditures and one-time expenditures. As the supply curve shifts in response to the incentives, the quantity of PROC emissions also changes.
To evaluate these shifts, a series of discrete technical options for reducing PROC emissions were defined. These options primarily include product reformulations, although product substitutes are also possible.. Under various incentives, manufacturers are assumed to switch to these various technical options to various extents, thereby shifting their supply curves. For purposes of this analysis, these shifts are evaluated as discrete jumps (i.e., from current formulations to new formulations).
The assumptions regarding the extent to which various switches take place are driven by estimates of the private costs of making the switches. The private costs represent the costs faced by manufacturers. In general, the least cost alternatives (given the incentives provided) are assumed to be implemented. Limits on the use of some technologies (principally alternative packaging) are assumed.
To evaluate an incentive fee, the switches that cost less than the fee are assumed to take place to various extents. To make this assessment, the cost of each technical option is evaluate in terms of its cost per kilogram

F-4
Price of Outputin Year t
EXHIBIT F.l
CHANGES IN CONSUMER AND PRODUCER SURPLUS
pl
pO
OQ Quantitf of
Output 1n Year t

F-5
of PROC emissions avoided. This cost can then be compared to the fee to assess whether it is cost effective to implement the technical option from the perspective of a manufacturer.
The extent to which the various options are undertaken in response to an incentive fee is also influenced by the fee that IIUSt be paid on the remaining PROC emissions. This fee payment results in a transfer of resources from the manufacturers to the fee collection agency. As such the transfer is not a real resource cost to society, although it is a cost incurred by manufacturers that will influence their response to the incentive fee.
Once the technical options that will be undertaken are identified, the costs are estimated in terms of the areas in the exhibit described above. The shift in the supply curve is evaluated in terms of an increase in the cost of manufacturing the product. The costs incurred by manufacturers includes the costs of the technical options and the fee payments. The .change in consumer surplus is associated with the increase in the price of the products and changes in quantity consumed. The net coat to society is equal to the lost consumer surplus minus the transfer payments in the form of fees paid.
A similar method is used to evaluate a quota system. In this case no fee is paid (the quota is allocated to manufacturers). The least cost options for reducing PROC emissions are assumed to be undertaken to various extents, and although no fee is paid, the mix of options undertaken is very similar in both the fee and quota systems. The costs incurred by manufacturers and the lost consumer surplus are estimated in a similar manner as with the fee incentive system.
1.3 Social Versus Private Costa
In the discussion thus far, no distinction has been made between the private costs of undertaking an action to reduce PROC use and the social costs of such an action. The distinction is unnecessary if private and social costs are identical. However, there are two reasons why the two costs measures diverge:
o industry is concerned with profits after taxes (absent exogenous forces) while society is concerned with total returns including taxes, and
o the private discount rate exceeds the social discount rate.
The first factor implies that social costs exceed private costs if the costs of reducing PROC emissions incurred by a firm is partially offset by tax effects (e.g., tax deductions). The second factor implies relatively higher private costs because the amortized value of capital expenditures increases with a higher discount rate.
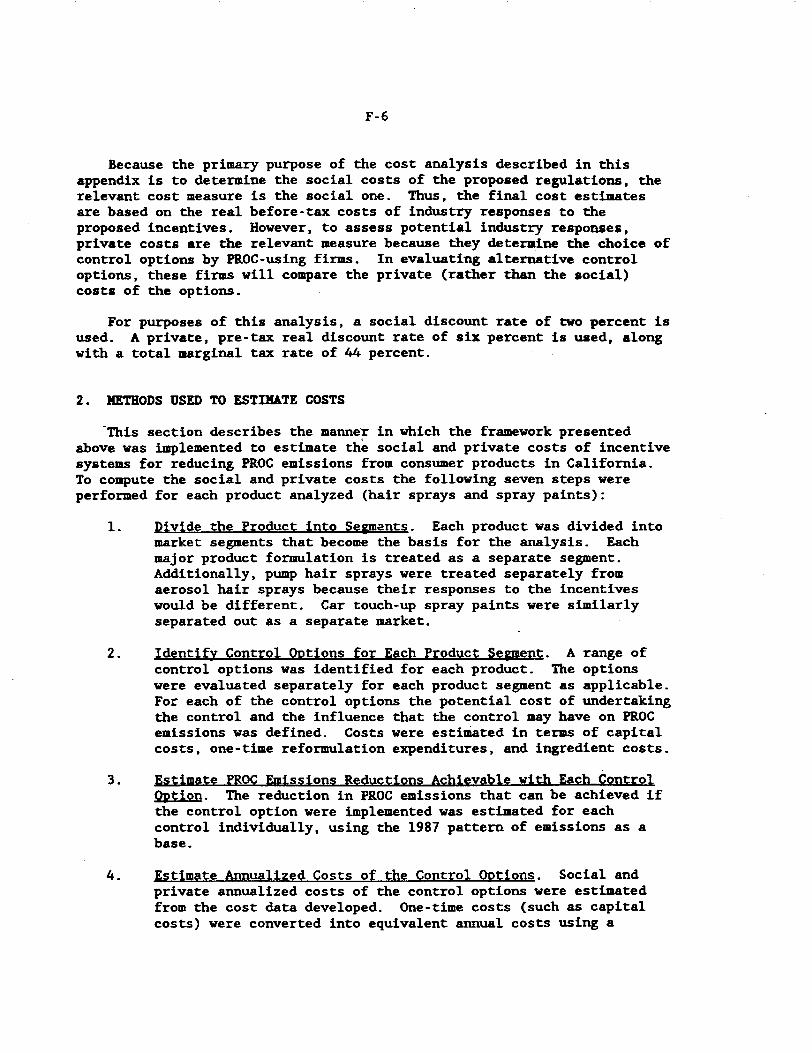
F-6
:Because the primary purpose of the cost analysis described in this appendix is to determine the social costs of the proposed regulations, the relevant cost measure is the social one. Thus, the final cost estimates are based on the real before-tax costs of industry responses to the proposed incentives. However, to assess potential industry responses, private costs are the relevant measure because they deteraine the choice of control options by PROC-using firms. In evaluating alternative control options, these firms will compare the private (rather than the social) costs of the options.
For purposes of this analysis, a social discount rate of two percent is used. A private, pre-tax real discount rate of six percent is uaed, along with a total marginal tax rate of 44 percent.
2. METHODS USED TO ESTIMATE COSTS
-This section describes the manner in which the framework presented above was implemented to estimate the social and private costs of incentive systems for reducing PROC emissions from consumer products in California. To compute the social and private costs the following seven steps were performed for each product analyzed (hair sprays and spray paints):
1. Divide the Product into Semants. Each product was divided into market segments that become the basis for the analysis. Each major product formulation is treated as a separate segment. Additionally, pump hair sprays were treated separately from aerosol hair sprays because their responses to the incentives would be different. Car touch-up spray paints were similarly separated out as a separate market.
2. Identify Control Options for Each Product Sepent. A range of control options was identified for each product. The options were evaluated separately for each product segment as applicable. For each of the control options the potential cost of undertaking the control and the influence that the control may have on PROC emissions was defined. Costs were estimated in terms of capital costs, one-time reformulation expenditures, and ingredient costs.
3. Estimate PROC Emissions Reductions Achievable with Each Control Option. The reduction in PROC emissions that can be achieved if the control option were implemented was estimated for each control individually, using the 1987 pattern of emissions as a base.
4. Estimate Annualized Costs of the Control Options. Social and private annualized costs of the control options were estimated from the cost data developed. One-time costs (such as capital costs) were converted into equivalent annual costs using a

F-7
standard annualization factor. The annualized costs were expressed in terms of dollars per kilogram of PROC emissions avoided by dividing the annualized cost estimate by the number of kilograms of PROC emissions that are avoided by implementing the control. Again the 1987 pattern of emissions was used as a base.
s. select the Candidate control Options and their Extent of Use. Based on the annualized costs per kilogram estimated above, the control options anticipated to be implemented in response to the economic incentives were identified. The extent to which the controls would be implemented were estimated based on judgment, taking into consideration the relative coata of the alternatives.
6. Revise the cost Estimates based on the Extent of Implementation.Based on the extent of implementation developed above, the cost estimates were adjusted. In particular, cost estimates per kilogram of PROC emissions avoided increase when the number of units of production over which capital costs and one-time costs are spread is reduced. Based on these revised costs, the extent of implementation of the various options may be revised.
7. Estimate Private and Social Costs. The social and private costs of various economic incentives were computed by aU11111ing the costs across all the control options implemented in each of the product segments.
These estimates were made for each of the economic incentives evaluated. Under fee systems, the evaluation is performed for each fee level. For a quota system, the evaluation is performed for each quota level.
The key steps in this evaluation are the estimates of the emissions reductions and the annualized costs of the controls. Each is discussed in turn.
2.1 Emissions Reduction Estimates
The emissions reduction achievable with each control option was estimated by comparing the emissions per unit anticipated with the control to emissions per unit estimated for each of the product segments. For example, DKE/water hair spray formulations were assumed to replace existing hair spray formulations on a one-to-one basis. In this case the emissions reduction per unit is driven by the differences in the PROC contents of the formulations. The total emissions reduction is estimated as the reduction per unit times the number of units that use the new formulation. The number of units that use the new formulation is driven by the extent to which the new formulation is expected to be implemented.

F-8
The emissions reduction can also be influenced by differences in the manner in which the products are used. For example, high-solids spray paint formulations have lower PROC contents than current spray paint formulations. This lower PROC content of the formula contributes to reductions in emissions. However, the more important factor driving emissions reductions in this case is that high-solids spray paint formulations cover more area per unit of product than do current formulations. Consequently, fewer units of spray paint are required to meet the same consumer need. The per unit emissions reduction is therefore driven by both the characteristics of the formulation and the manner in which the substitute formulation compares to the existing formulation. The total emissions reduction is again driven by the extent to which highsolids spray-paint formulations are used.
2.2 Annualized Costs Estimates
For each control option, both social and private annualized costs were estimated. These annualized costs reflect the capital, operating, and other costs that are incurred when the control is undertaken. These costs are based on engineering estimates and are defined as the costs that are incremental relative to continuing to manufacture and use the PROC-containing products in their current forms. The social costs reflect the total resource costs to society, and the private costs reflect the costs faced by firms, including appropriate adjustments for tax liabilities and costs of capital.
To enable the controls options to be compared and analyzed in relation to a policy of restricting the emissions of PROCs, the annualized costs are expressed on a per kilogram of emissions avoided basis. This •per kilogram" estimate is made by dividing the annualized c~st of undertaking the control by the amount of PROC emissions that may be reduced by the control. The resulting value {based on private costs) is taken as an indication of the increase in the price of PROCs that would be required in order for firms to be indifferent between undertaking the control or continuing to use the PROCs in their products. If the price of the PROCs exceeds this annualized value, the firm would be better off to reduce its use of PROC and undertake the control. Consequently, the cost estimates are designed to be used in the analysis framework described in the previous section, where economic incentives are used to promote reductions in PROC emissions.
The following types of costs were obtained (where applicable) for each control possibility: 2
2 Not all of these cost categories apply to all of the controls. Some chemical substitutes, for example, can be used without additional capital investment.

F-9
o capital costs -- such as the acquisition cost of equipment required to convert filling lines to use substitute chemicals. Capital costs are one-time costs that are subject to depreciation.
o non-recurrin& costs -- transitional, one-time costs such as research and development, reformulation, or training required to implement a control. For purposes of computing private annualized costs, non-recurring costs were considered not to be depreciable.
o annual operating costs -- incremental materials, and labor required to implement the control. In this analysis these costs are the costs of alternative ingredients in the formulations.
o salva1e of capital equipment·· residual value of equipment used to implement a control. 3
All of these reported engineering-based cost estimates are on a before-tax, real basis in 1989 U.S. dollars.
2.2.l Social Annualized Costs of Individual Control Options
The social costs of individual controls may be evaluated. For purposes of the overall cost estimates, however, changes in consumer surplus were used to estimate social costs.
To evaluate social costs for individual control options estimates of capital and non-recurring costs were annualized by multiplying these costs by:
[ 1 - [1/(l+r)]] t
where r is the real social discount rate and tis the estimated economic life of capital. This factor is used to spread capital and non-recurring costs over the economic life of the capital to which a control is applied. The economic life of the capital equipment for each control was estimated to be 5 years.
Non-recurring costs (such as research, development and market study costs) represent one-time costs which, in practice, will not be replicated in future years. Using this interpretation, such non-recurring costs should not be included in annualized costs because they will not recur at a constant scale (i.e., the costs only occur once, regardless of how long the control is undertaken). Nonetheless, non-recurring costs were included
3 A salvage value for necessary capital equipment was included in only a few instances.

F-10
with capital costs so that the annualized cost estimates would reflect the full aocial costs of controls.
To compute total annualized costs, annualized capital and non-recurring costs were added to estiaates of other annual pre-tax costs as follows:
o annual operatin1 costs -- annual costs of alternative ingredients were added directly.
o salva1e of control equipment -- few controls were expected to have salvageable capital. The present value of the salvage value of control equipment was estimated as:
S * C/(l+r)t
where Sis the percentage of capital costs estimated to be recoverable on salvage, C is the original capital cost, tis the useful life of capital, and r is the real social discount rate. This present value salvage-amount was annualized in the same manner as described above for capital and non-recurring costs. The resulting annualized salvage value was then deducted from total annualized costs.
These estimates were initially done presuming that each control option was implemented to its fullest extent possible. The estimates were subsequently revised to reflect the costs of implementing them to various extents which depend on the incentives provided.
To estimate the costs per kilogram of PROC emissions avoided, this cost estimate is divided by the number of kilograms of PROC emissions avoided.
2.2.2 Private Annualized Costs of Individual Control Options
For purposes of assessing firms' potential reactions to incentives for reducing PROC emissions, the costs faced by the firms must be estimated. These costs are referred to as private costs. As discussed above, private costs will differ from social costs because of tax effects, differences in discount rates, and possible differences in the kinds of costs incurred.
To estimate private costs, a discounted cash flow analysis was used. This cash flow analysis: (1) computes annualized before-tax costs using a before-tax private discount rate, (2) estimates incremental cash flows incurred by private entities including the effects of depreciation and taxes on cash flows, and (3) computes an annual cost as the net of all annualized cash flows.
In general, the methods used to compute private annualized costs follow those described to compute social annualized costs. The methods used to estimate private annualized costs are comprised of the following steps:

1. The magnitude and timing of pre-tax costs (i.e., capital and operating costs) were specified. Assumptions regarding the timing of the costs and expenses (relative to the initiation of the control) are:
o capital and non-recurring coats occur in year O;
o capital salvage occurs at end of the capital's operating life;
o depreciation expense occurs over five years; operating costs are incurred each year.
2. Total pre-tax costs were calculated for each year over the control's operating life (assumed to be five years).
3. Taxes were applied to costs incurred by multiplying the costs by Cl-marginal tax rate).
4. Depreciation was •added back• to net after-tax costs to account for the tax savings attributable to this non-cash expense.
5. The stream of after-tax cash flows was discounted using the private cost of capital to compute a net present value of the costs of the control over its entire life (assumed to be five years).
6. The present value of the after-tax costs was annualized using the private cost of capital as the discount rate. This present value is then divided by the total reduction in PROC use that can be achieved by the control to produce an annualized private cost per kilogram of use avoided.
Taxes were calculated using a marginal total tax rate of 44 percent. Investment Tax Credits (ITCs) were assumed not to be available. After-tax cash flows arising from capital salvage were calculated by multiplying pre-tax salvage by (1-tax rate). A tax loss would be included on undepreciated capital whenever the depreciable life exceeded the operating life of capital (however, this did not occur).
Annual depreciation expense was calculated using the straight line method over five years. This assumption is conservative because depreciation expenses occur uniformly over the depreciation period, whereas accelerated depreciation methods produce tax benefits in earlier years. Because depreciation is based on initial acquisition costs, annual depreciation expense was deflated by an inflation index to calculate real depreciation. An inflation rate of 4 percent was used.

0
F-12
To select the appropriate rate of private discount, the available literature was surveyed. 4 Little consensus existed aaong the experts who have studied this problem. The range of estimated values for the real rate of return on private investments was from 4 to 9 percent. Accordingly. 6 percent was selected as a median estimate.
This range of estimates agrees well with the cited range for the rate of social discount. One would expect the private rate to be from 2 to 5 percentage points higher than the social rate because of (a) the taxation of private income and (b) the need for society to subsidize capital formation to provide for future generations.
3. LIMITATIONS
The methods used to assess the social and private costs of proposed restrictions on PROC use are limited in terms of the data available and the manner in which the method is applie~. The primary limitations of the data include:
o Identification of Control Options. By definition. only those control options that are currently known are included in the analysis. It is likely that as incentives are provided to reduce PROC emissions that additional control options will be identified. The inability to incorporate unknown control options biases the estimates of costs upward, although the extent of the bias is not known.
A&&re,ation of Control Possibilities. The aggregation of the control possibilities to reflect the impacts of taking groups of controls is subjective. Alternative views of aggregation could lead to alternative estimates of control costs and achievable reductions.
4 Studies that address this issue include: Jacob Stockfish, •The Interest Rate Applicable to Government Investment Projects,• in Procram, Budcetin& and Benefit Cost Analysis, Hinrichs and Taylor (eds.); Daniel Holland and Stewart Myers, •Profitability and Capital Costs for Manufacturing Corporations and All Nonfinancial Corporations,• American Economic Review, Kay 1980; Barbara Fraumeni and Dale Jorgenson, •Rates of Return by Industrial Sector in the United States, 1948-1976,• American Economic Review, Kay 1980; William Brainard, John Shoven and Laurence Weiss, •The Financial Valuation of the Return to Capital,• Brookincs Papers on Economic Activity, 1980; Robert Lind, •A Primer on the Major Issues Relating to the Discount Rate for Evaluating National Energy Options,• in Discountin& for Time and Risk in Enerc: Policy. Resources for the Future, 1982.

F-13
o Uncertainty surroundin& New Chemical Substitutes. The uncertainty surrounding the data describing the new chemical substitutes (particularly the HCFCs) has a large influence on the cost estimates produced. The areas of uncertainty primarily include the timing of availability of the new chemical substitutes (which influences the level of emissions reductions that can be achieved), the cost of the new chemical substitutes, and the extent to which the new chemical substitutes can be used in existing products.
The method also assumes that the primary aechanism driving the allocation of PROCs across competing uses is price. Although this is a standard assumption for analyses of this type, other factors (such as the relationship between producers and their customers) may influence the allocation of PROCs. To the extent that PROCs are not allocated based on price, the estimates of costs will be biased downward. A related
_assumption is that manufacturers implement the least costly control options. If more costly controls are undertaken, the cost estimates are also biased downward.
Two types of costs not considered are transition costs and risks. Transition costs (e.g., temporary unemployment or premature retirement of capital equipment) are generally small over the long-term, but may be important when reductions are initially required. Because phase-in times are contemplated, transition costs are likely to be small. Also many of the control options are compatible with existing equipment (thereby avoiding the premature retirement of capital).
The additional health and environmental risks posed by the control options have not been evaluated. Methylene chloride-based options were deleted from consideration due to risks, so that the options used in the analysis may not result in significant risks. However, some examples of risks are evident (e.g., the potential impact of HCFCs on stratospheric ozone), and additional analysis to assess these risks may be warranted.

--------- ----------- --------- ---------------
F-14
EXHIBIT F-2 EXAMPLE SOCIAL COST FOR A CHEMICAL SUBSTITUTE
Control Option: HCFC I Hair Spray Formula Application Category: Hair Spray Formula I PROCs: Ethanol (solvent), Hydrocarbon Propellant
1. Estimated Use Reduction Potential For Application Category
PROC Use Market Reduction Use Reduction in 1987 X Penetration X Potential - For Application (000 KG) (Percent) (Percent) (000 KG)
10,628 65 81.5 5630
2. Estimated Costs of Replacement Product
Capital Cost and Non-Recurring Costs
91,520 Capital Cost ($) + 25,600 Non-Recurring Cost ($)
117,120 + 3,001,830 Number of Cans
- 0.039 ($/can)
Salvage of Capital<•>
91,520 Capital Cost($) X 0.10 Salvage as% of Capital Cost + 3,001,830 Number of Cans
- 0.003 ($/can) X 0.906 Present Value Factor - (1/(l+.02)) 5
0.002 ($/can)
Chemical Substitutions Cost
1.685 Price of HCFC I Product ($/can) X 1.0 Ratio of Substitute to Current Formulation
1.685 0.645 Price of Current Hair Spray I ($/can) 1.040 Cost of Substitution ($/can)
X 4.713 Discounted Present Value of Annual Stream -(1/.02) X [1-(l/(1+.02)) 5 ]
4.901 Total Discounted Substitution Cost ($/can)

F-15
EXHIBIT F-2
EXAMPLE SOCIAL COST FOR A CHEMICAL SUBSTITUTE (Continued)
3. Annualized Total Cost Per Can and Kilogram of PROC use Reduction
Total Cost Per Can
0.039 Capital and Recurring Costs ($/can) 0.002 Salvage of Capital ($/can)
+ 4.901 Total Discounted Substitution Cost ($/can)
4.938 Total Discounted Cost ($/can) X 0.212 Annualization factor - .02/[1-(l/(1+.02)) 5 ]
1.048 Annualized Total Cost ($/can) ♦ 0.188 Kilograms Per Can
5.587 Annualized Total Cost ($/KG) + 2.2046 Pounds Per Kilogram
2.534 Annualized Total Cost ($/LB)
4. Total Annualized Social Cost
1.048 Annualized Total Cost Per Can x 3,001,830 Number of Cans x 0.65 Penetration rate
2,044,846 Total Annualized Social Cost
V Operating life of Capital is assumed to be 5 years, at the end of which salvage occurs.

(Page Intentionally Left Blank)

APPENDIX G
EPA RULE ON STRATOSPHEllIC OZONE PROTECTION

(Page Intentionally Left Blank)

• • •
30Slll. Federal Regia&u / Vol. 53. No. 156 / Friday, Augual 12. 198& / Rulu &Ad Regulation&
Date: Au9ust 1. 1988. LNM.'l'llomu, AdminiSlrolOr.
For the reaaona aet fortb in the preamble, Title 40 CFR Part 82 is Mmendecl u follows;
PARTl2---fROTECTIOI OF STRATOSPHERIC OZONE
1. The authority citatialL for Par& az continu• to nad aa foUAw~
...... dty. U u.s.c. 71D(hJ.
2. Part 1Z la amended by addina H 82.1~14 and Appencllc:in A throupD to rud u foJlow1: Sec..12.1 ...,.._ _,._
IU ........._ IIU Daflailillm. au ProbiWIIGu. 112.S Apportioament o(baHline ptOduc:tiOll
allow--. au ApportiCllllllfflt of ba•Hm
comlaPltw ............. IIU Grat nd phued ,..._albaaeline
·p,odliilliuD _.. a •U111uaallowaw for G,oap aColltrolled SubatucN.
12.1 Grantandfnel9ofbuaUDa......._ and CIIIUIUllptioa allowaacN for Group Dertnu,, ..,.,. ...
IUA..........,af......._ ......... ........bulllaa...d:•-allowucn.
a.tO. -MIIIIHilll, of I ZZ$11W .U0-.1 ID addlllaa ID --OIIOMapllimn allow--.
12.11 lxparta to partia az.u Truafen•Ploclllctionad
-,lion allowUIW lR111ruedJ. 12.U Jlecmtdbepina and NpOltina
nquimnenta. 12.H Payment of fNt (RelerYad).
Appaadia A-Contrvlled _....._ and ozone depletion weiplL
Appendix a-Putin to tbe Maotnal Protocol (RelanedJ.
Appendix c-NaliCll!I complyiq with, but aot party to. tu p,olOCOI (lleNrvadJ.
Appendia D-Twenty•fiv•kilotonne parties (ReNIWCIJ.
fU.1 ,.,.......,.. (a) The purpose of tbeu rqulationa i1
to implement the Montreal Proloco/ on Subatant:11• that Deplete the Ozone Layer under authority provided by section 157 or the Clean Air Act. The Montreal Protocol requirn each nation that becomes a Party to the Protocol to limit its total production and consumption ( defined aa production plus imports minus export■) of certain ozonedepleting 1ubatances according to a specified schedule. The Protocol also require, Partie1 to impose certain restrictions on trade in ozone-depleting !lub1tance1 with nonparties.
(b) Thi1 rule applies to any individual. corporate. or governmental entity that
produces. importa. or exports controlled subslancea.
§12.2 Efr.ctlftdate. Section 8Z.13(f)(l) of this part takes
effect September lZ. 1988. The remainder of the rep)atfona under thl1 part will take effect when the Montreal Protocol enters into force. The Montreal Protocol will enter into force on jGDIW'J 1, 1918. provided that at lea1t 11 inatnament1 ofraliflcation. acceptance, approval of the Protocol or acceaaion thereto have been depo1ited by State, or f91ional economic intearaUon orpaizationa reprnentina at leut twothlrda af 19118 estimated alobaJ. conaumpllon of the controlled 1ubatucea. If theae canditiODI have aot been fulfllled by January 1. 1988. the Protocol will enter into force an the ninetieth day followina tba date on which the candiliona have been fulfilled.
f 1Z.J DellsclllaUL A1 a1ed in thi1 part. the tenn: (a) "Adminiatratm" meUIS the
Admmiatrator of the Enviroamantal Protaction A,ency or hi, authorized repruentative.
(b) "Baulfna eommnptlon allowances• meana the connmpdon allowanc:e1 apportioned under I az.e.
(c~~ procluctloaellowancel• mean, the production allowucn apportioned under I 82.5.
(d) "Calculated level'" meane the level or production. exporta or imports or controlled 1ub1tancea determined for each Group of controlled aubalalu:el by:
(t) MulUplYfns the amount (in kiloaram1) of production. exports or import■ of each controlled 1ub1tance by that 1ub1tance'1 ozone depletion weight li1ted in Appendix A to thla Part and
(2) Adelina together the reaultina products for the controlled 1ubatance1 within each Group.
(e) "Con1wnption allowances" meana the privilege, sruted by thl• Part to produce and import calc:ulated levels or controlled aubatanca: however, con1umption allowancea may be 1119d to produce controlled 1ubatance1 only ill coaiunction with production allowancu. A penon'1 comumption allowancea are the total of the allowancu ha obtain■ under I 82.7 (bueliae allowance1 for Group I controlled 1ubatance1), 182.8 (baseline allowance■ for Group II controlled 1ubataace1), and I 82.10 (additional comumption allowance, · upon proof of export, of controlled substance■). a■ may be modified under t az.12 1 (tran1fer of allowances).
• F.dl!llrial Nola: Section 12.12 1, cunwntly reHrved. Th ■ Environmental Pro1ec1- Apnc:y will add rqulaliona in lh■ I !'Klion ■ I ■ futur■ dale.
(0 "Control periods" meana thoae periou durina which the prohibitiona under I 8Z.4 apply. TbDH perioda are:
(1) For Group I controlled 1ubltance1: (reserved)
(2) For Group II controlled 1ubatam:e1: (re■erved)
(s) "Controlled auba~" meaaa ~Y subatance listed in Appendix A to thla Part. whetber uiatina aloDe or in • mixture. but exdudiaa any IUCh 1ubatance or mixture that ii ill • manllfadund product Giber than • COfttai,,.,. uaed for the lnDlpOrtalioD or atorap of tbe 1ubatance ar mlxbn, Any amount or a lilted aubltuce which ii not part ofa 1111 ayatem CGDtaiafaa the . eubstaace II a coatrolled 1ubltance. Ifa lilted aubatam:e or mixture aUll &at be tralllfemd from. buJk c:antalner to another container. veaaeL ar piece o~ eqwpmut in order to realize ita inlPded UN. tbe lilted 111batuu:e or mixlme ii a controlled aubatance. C.tralled aubatancea an divided into two poupa. Group I and Group IL u aet forth in Appadix A.
(h) "Export'" IDUDI tbe tnnlport af controlled 111bataace1 manfactured &om raw materials or fndltock chemicala (Le.. vbsin prodllCtlctn) from witbm the UaJtad Stata or ils lmltorin to pmQU,or coun.tdea•talde •• UaJted Stala or ill tenitorfa. excludlna United State1 Military baNI and sbfpe for on-board IIN,
(i) Exporter meana the penoa who contracts to aell controlled 1ubaluacn for export. or tranafera controlled 1ub1tancea to bia afraliate in uotber country.
(j) "Facility" meana any proceu equipment (e.a-. reactor, diatillation column) to convert raw ,naterials or feedltock chemicals into controlled aubatanceL
(k) "Import" meana the tranaport of virsill, used and recycled controlled aubatancn &om outaida the UDited . State■ or ill territorie1 to penoaa witbia the United State■ or ill tenitories.
(I) "Importer" means the Im~of record li1ted on U.S. Cuatoma Service Form 7501 for imported controlled 1ub1tanc:ea. ..
(m) "Montreal Protocol mN111 the Montreal Prolocol on Sulmtulata lhot Deplete 1h11 Ozone Layer which••• adopted on September 18. 1987, in Montreal, Canada.
(n) "Nation■ complying with. but not ioining, the Protocol'" me•~ any nation listed in Appendix C to th11 ~art. .
(o) "Party.. mean, any nation that 11 a party to the Montre~l Protocol and listed in Appendix B to th11 part.
(p) "Peraon" meana an~ in~i'.V'idual or legal entity, including an andiVJdual.

--
--
--------
Federal Resister / Vol. 53. No. 158 / Friday, August 12. 1988 / Rules and Regulations
corporation. partnership. Hsociation. state. municipality. political subdivision of a 1tate. Indian tribe. and any agency, department. or in1trumentality of the United States and any officer. agent. or employee thereof.
(q) "Plant" meant one or more facilities at the 1■me location owned by or under common control of the aama pel'IOn.
(r) "Potential prodnctim 'lllowancu" means the production allowance, obtained under t au (a) and (b).
(1) ..Production" meam the manufacture ofa controlled substance from any raw material or feedttock chemical (I.e .. vqin production): however. production don not Include the manufacture by ona penon of controlled aub■tancea lhat are med and entirely consumed In the manufacture by the nme penon of other chemicals.
(t) .. Production allowances" means the privilegea granted by tbf1 Part to produce calculated lewis of controlled 1ub1tances: however. production allowances may be used to produce controlled ■uhltancn on)y In conjunction with couwnptlon allowances. A penon'1 prodaction allowances are the total of Iha . allowanc:ea he obtains under I 8Z.7 (baseline allowanca for Group I controlled 111betencn). I 12.8 (bueline allowances for Group II ccmbolled 1ub■ tancut. and I 12.9 (c) ud (d} (additioaal prodaction allowance■). u may be modified aader I az.u • (transfer of allowances).
(u) "Twenty.ftve-kilotonne Party" means any nation lilted in Appendix D to thi1 Part.
(v) "Unexpended consumption allowances" means conaumption allowance, that have not been u.ed. At any time in any control period. a penon'1 unexpended consumption allowance, are the total of the calculated level of consumption allowance, he ha ■ authorization under thi1 Part to hold at that time for that control period. minua the calculated level of controlled •ub1tancu that the penon has produced and imported in that control period until that time.
(w} "Unexpended production allowances" meant production allowance, that have not been used. At any time in any control period. a peraon'1 unexpended production allowances are the total of the calculated level of production allowances he has authorization under this Part to hold at that time for that control period. minus the calculated
• £dilorial DOie: Section IZ.12 ia cwrently ,.,~,...,.;. TI,e En~ironmen1 ■l Protec1ion A11iency will ,aJd f1!8Ula1Jona 1n tha1 IIKIIOft ■ ta futurr date.
level of controlled substances that the penon has produced in that control period until that time.
§12.4 Pcote■•-(a) .No person may produce. at any
time in any control period. a calculated level of controlled substances in excen of th• amowit of unexpended prodw:tion allowaaca held by that peraon under the authority of this Part at that ti.me for that control period. Every kilopam of 1uch exceu conatituta a aepuate violation of this re,ulatioa.
(b) No person may produce or import. at any time ln any control period. a caladated leval of controlled aubltnces in excet1 of the amount ofunexpended conaumption allowanca held by that person under the authority ofthia Part at that time for that control period. 2nry kilogram of such excns coutitulel a 1eparate violation of this replatton.
(c) A penon may not uae hi• production allowancea to produce a quantity ofcantrou.d sabstanc:a un1eu he bolds under tM autbodty ol t1dl Part at the same time consumption a1lowanmaadlidat tocowadlat quantity of controlled 1ubetaca. DOI' may he a. hJa cmaaumptioa aJlowalu:ea to praduoe a quntlty of controlled sub,tancet anlen be holds tmder authority of this Part at the same time production allowanca ntlicient to cover that quantity of controlled 1ubsta.nceL However, CODIUlJ)tiDD allowance, alone are required to import controlled suhltanceL
(d} BeSinninl one year altar the effective data of this Part. ao perSGD
may import any quantity of c:cmtrolled 1ub1tance1 from any nation aot lilted Ill Appendix B to this Part (Parties to the Montreal Protocol), wdea1 that nation ill lilted in Appendix C to this part (Nations Complfinl with. But Not Party to, the Protocol). Every kilasram of canbolled aubatancu imported In contravention of this npletion comtitutea a 1eparate violation of this regulation.
fl2.5 AIIParllo! 11 ■ 1u,~111111n.pr,uua•-••• an Pel'IOn■ who produced one or more
controlled substance, in 1988 are apportioned calculated levels of baseline production allowances u set forth in paragraphs (a) and {b) of this section. Each penon's apportionment i1 equivalent to the calculated levels of that per■on'1 production of Group I and Group II controlled. 1ub1tance1 in 1988.
(a) For Group I controlled 1ub■ tancea:
Calo........... 13..111.1111Racaft.ClnCIIMI-CII-.._L.____-_-_-_:-_-_:_-_......~ Klilar- .,.,zn.......oai,______ ,1.1..... 77,701"20Mld-Signll.-......------1
t5UZ1.0UO£.l dy Panl da NlfflGln & Co.. Ille-
(b) For Croup D controHad ....tacn:
c11aru•
E.L .............c.a.._ GlalLaaQ--=al-waq-11----1 ICIAlnalCal,lnc-------1
fa.I_....._ • .,....... -··••a ■ ..... 1111
Persona who produc■d. Imported.• produced and imported cine or mon conbolled nt.tancn In 1111 ara apportioned calcalated lnela of bueline c:onaumptioa allowancea u Mt forth In parqraphl {a) and (b) of tbit aectfon.
(a) For Group I conbolled 111bttaacu:
0111111r1P9rllC,n .... 13,4N,,GIBAacan.lnc ~- Z,.,S1U,7
.,.....ca,p 1.....-Ul.t11MtELCluPa'ltda,.__.&C.O..•----··-~Allld-.~ I.IOl,1tJ,...._._,K
SUmilOmO Qno.111111, d Allali:a- ...,.Hoadlll~Olllp 420,931"-•--- 437.MOKll,Q,1 I Cap
3.Ca.Dl1.................-8.310.11710----.1nc
211.151HalcNllll.tnc
(b) For Group ll controlled 1ubatancn:
,.... ClicllMIII..... £.Lm,Po,11,..,..,,.&Co..lllC- 27.ffl.Cll7 G,NILaiata-..--- 11.15UM ICl~IIIC 8,3,&7,IOO AllllmOllt ~ Inc~- 2111.400
2.1:2S.427 ~Gall' t.m.lDO
f 12.7 Grant and ptiaNCI Nduc11on ot .,..... produetlOft and .......... allow•ICN lor Group I mlll II d a.lbCIMCII
(a} For each of the control periods that begin• before July 1, 1993. every person i• granted 100 percent of the b ..eline production and con1umplion allowance, apportioned to him under II 82.5(a) and 82.6(a).
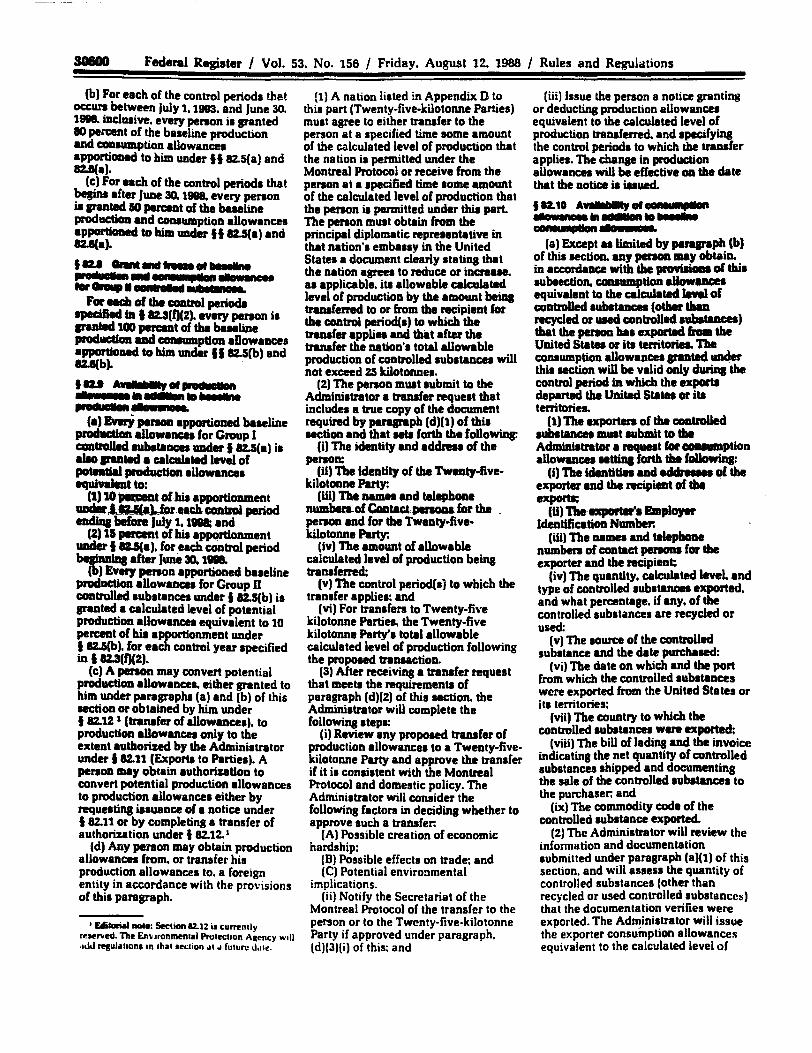
30800 Federal Register / Vol. 53. No. 156 / Friday, August 12. 1988 / Rules and Regulations
(b) For each of the control periods that OCCW'I between July 1, 1993. and June 30. 1918. inclusive. every pem,n i1 granted 80 percent of the ba■eline production and con■ umption allowances apportioned to him under H 82.S(a) and 81.l(a).
(c) For aach of the control period■ that !>9sina after June 30. 1998. every per■ on .. IPUted ao percent of the baseline production and CODIWllption allowances apportioned to bim under H IZ.5(a) and IZJl(a).
flZ.I ....................... P,IIIW...............,. ...W■ INe ........._ ...r••·HL
Far Neb of tbe control perioda apecilled In I IU(l)(Z). every pem,n i1 sranted 100 percent of the ba•line production and c:oumnptton aDowance1 apportioned to him under H IZ.S(b) and 82.l(b).
f a.t Aw • I 1NJ II PN• ■aan
PN••••...••11• -·-·--····.....(a) Every penon apportioned baseline production allowances for Group I controlled 111batanc:e1 under t 8Z.5(a) i1 alao panted a calculated level of potential production allowance■ equivalent to:
(1) 10 ~•of..bi1 apportionmentUDder,L,u(,J.Jor eac:ll-conuolpenodmadiaa before July t, t• and
(2) 11 percent of bi■ apportionmentunder I IU(a), for each control period belinnlm after June 30. 1998.
{I,) Every per■on apportioned baaeline production allowance■ for Group n controlled 1ub1tance■ under I IZ.S(b) ia snnted a calculated level of potential production allowancea equivalent to 10 percent of hi1 apportionment under I IZ.S(b), for each control year 1pecified in I 12.3(f)(Z).
(c) A person may convert potential production allowancea. either granted to him under paragraphs (a) and (b) of this aection or obtained by him under I 82.U • (transfer of allowances), to production allowance1 only to the extent authorized by the Adminiatrator under I IZ.tt (Exporta to Parties). A per■on may obtain authorization to convert potential production allowances to production allowance, either by requeltiftl i11uance of a notice under I 82.ll or by completing a transfer of authorization under I 82.12. 1
(d) Any peraon may obtain production allowancn from, or tranafer hia production allowances to, a foreign entity in accordance with the pro\·isions of this paragraph.
(t) A nation listed in Appendix D to this part (Twenty-five-kilotonne Parties) must agree to either transfer to the person at a apecified time some amount of the calculated level of production that the nation ia permitted under the Montreal Protocol or receive from the per■on at a 1pecified time 1ome amount of the calculated level of production that the per■on i1 permitted under thi1 part. The per■on must obtain from the principal diplomatic repreaentative in that nation· ■ embaasy in the United State■ a document clearly 1tatin, that the nation asree• to reduce or increaae. a■ applicable, ill allowable calculated level of production by the amount beiq tranafemd to or from the recipient for the control period(1) to which the tnnafer applin and that after the transfer the nation·• total allowable production of controlled 1ubstancea will not exceed 25 kilotonne■•
(2) The penon muat 1ubmit to the Adminiatrator a transfer requeat that include, a true copy of the document required by paragraph (d)(l) of thi1 aection and that NII forth the following:
(i) The identity and addres1 of the per■ on:
(ii) The Identity of the Twenty-fivekilotonne Party:
(iii) Tbe namn and telephonenumbeG.of Contact.penou for the peraon and for the Twenty-fivekilotonne Party;
(iv) The amount of allowable calculated level of production being transferred;
(v) The control period(a) to which the transfer applie1: and
(vi) For transfers to Twenty-fi\·e kilotonne Parties, the Twenty-five kilotonne Party'• total allowable calculated level of production following the propoaed transaction.
(3) After receiVing a transfer request that meet, the requirement, of paragraph (d)(2) of thia aection. the Adminiatrator will complete the followin, 1tep1:
(i) Review any proposed tranafer of production allowance■ to a Twenty-fivekilotonne Party and approve the transfer if it is conaistent with the Montreal Protocol and domestic policy. The Administrator will consider the following factors in deciding whether to approve auch a transfer:
(A) Possible creation of economic hardship:
(8) Possible effect ■ on trade: and (C) Potential environmental
implications. (ii) Notify the Secretariat of the
(iii) Issue the person a notice granting or deducting production allowance■ equivalent to the calculated level of production transferred. and 1pecifying the control period• to which the transfer applies. The chanp in production allowancn will be effective on the date that the notice ii iaued.
flZ.10 Av M bTlyolOOI ....IIOn IIIO••Wln8lldlllDIIIDlllleNllle ~-...••=••
(a) Except•• limited by parapph (b) of thia aection. any penon may obtain. in accordance with the Pfl)VilioDI of thia subaection. consumption allowancea equivalent to the calculated level of controlled aubatances (other lbu recycled or uaed controlled 1ubatance1) that the penon baa exportad &oa the United States or ill territoriel. 1be comumption allowance• panted un4er thi1 aection will be valid only durina the control period in which the exporll departed the United States or ill territories.
(1) The exporters of tbe amtrolled 1ubatancea muat 1ubmit to tbe Adminiatntor a requeat for CXN11111Dption allowance, •ttina forth the fallowint:
(i) The identities and addreuN of the exporter and the recipient of tbe exporta;
(ii) n....,,..~. Employer Identification Number:
(iii) The nama and telephone numben ofcontact penan1 for the exporter and the l'IICipient;
(iv) The quantity, calculated level. and type of controlled 1ub1tancn exported, and what percentage. if any, of the controlled substance■ are recycled or used:
(v) The 1ource of the controlled subatance and the date purchaled:
(vi) The date on which and the port from which the controlled 1ub1tances were exported from the United States or ill territories:
(vii) The country to which the controlled 1ubatancea were exported:
(viii) The bill of Jadiftl and the invoice indicating the net quantity of controlled substance• ahipped and documenting the sale of the controlled 1ubatance1 to the purchaser; and
(ix) The commodity code of the controlled 1ub1tance exported.
(2) The Administrator will review the information and documentation submitted under paragraph (a)(l) of this section, and will assess the quantity of controlled substance• (other than recycled or used controlled substance~)
Montreal Protocol of the transfer to the that the documentation verifies were person or to the Twcnty-five-kilotonne exported. The Administrator will issue 1 Edilmial -•: Section 12. IZ is curttnlly
ttsef'\led. The En\·1ronmen111I Prolecllon A11ency will Party if approved under paragraph. the exporter consumption allowance!! ,,JJ reiiul11hon1 1n 1ha1 aeclion -,1 ., future J,11e. (d)(3)(i) of this; and equivalent to the calculated level of

Federal Register / Vol. 53. No. 156 / Friday. August 12. 1988 / Rules and Regulatiem
controlled substances that the Administrator detennined were exported. The grant of the consumption allowances will be effective on the date the notice is iuued.
{b) No consumption allowances will be granted after January 1, 1993. for exports of controlled substances to any nation not li1ted in Appendix B to this Part {Partiu to the Montreal Protocol).
,a.,, Ex,o,tato ....... In accordance with the provisions of
this section. any peraon may obtain authorization to caanrt potential production allowanca to production allowance, by exporting controlled aubatanca to nations listed in Appendix B to tbia part (Partia to the Protocol). Authorization obtaimd under tbia section will be valid only during the control period in whicb the controlled subatanc:ea departed the United Statea or its territoria. A Nqaat for authorization under thia section will be considered a request for comwnption allowances under I &Z.10. u well.
(a) The exporter must submit to the Administrator a requnt for authority to convert potential production allowances to production allowances. That request must 1et forth the following:
(1) The identitiu and addruaea of the exporter and the ncipient of the exports;
(2) The exporter'• F.mployee Identification Number:
(3) The names and telephone numbers of contact penona for the exporter and for the recipient: .
{4) The quantity, the calcu.lated leveL the type of controlled substances exported. its source and date purcha1ed. and what percentqe. if any. of the controlled aubstances that are recycled or used:
(5) The date on which and the port from which the controlled substances were exported from the United States or its territories:
(6) The country to which the controlled substances were exported:
(7} The bill of lading and invoice indicating the net quantity shipped and documenting the sale of the controlled substances to the purchaser: and
(8) The commodity code of the controlled subttance exported.
(b} The Adminiatrator will review the information and documentation submitted under paragraph (a) of this section. and assess the quantity of controlled substances (other than recycled or used control substances) that the documentation verifies were exported to a Party. Based on that assessment. the Administrator will issue the exporter a notice authorizing the con\'ersion of a specified quantity of
potential production allowanc:a to production allowance, in a specified control year. and graotiDg consumption allowances in the aame amount for the same control year-. The authorization may be uaed to convert potential production allowanca to production allowances H aoon u the date on which the notice ii ilsued.
112.12 -r........otp111•1~ ... CC.-911MallOll-.lR11■f'NdJ. ,...___I a.13 llecordlleeplllg and r ■port1111
(a) Unlen otherwiae specified. the recordkeeping and reporting requimnenta set forth in this section take effect •• follows:
(1) For Croup I controlled aubatancn. beginning with the .lint day of the &nt control period 1pecified in t IZ.3(1)(1J.
(Z) For Graap D controlled nbttancel. beginnins with the fint day of the ftnt control period apecified in t IU(f)(Z).
(b) Reports and records reqwnd by this section may be uaed for purpo1a of compliance determinatiom. The requirements of ncorda and reports la not intended u a limitation on tba me ofother evidence admiaible under the Federal Rain of !Yldence.
(c) Unleu otberwile specified. nporta required by thia aec:tiOD mmt be mailed to the Admhdatrator within 45 daya of the end of the applicable repoJ'tina period.
{d) Records and copies of reports required by thil aection must be retained for three yean.
(e) In reports required by this aection. quantities of controlled aubatances must be atated In tefflll of kilograms.
(f) Every penon (Nproducer") who will produce controlled substances durin8 a control period muat comply with the following recordbeping and reporting requirementa:
(1) Within 120 days of the date this rule i1 publiabed in the Federal ftesists. every producer must provide a report to the Administrator dncribing:
(i) The method by which the producer in practice meaaurea daily quantitia of controlled aubatancu produced:
(ii) Convenion factors by which the daily record, as currently maintained can be converted into kilograms of controlled substances produced. including any constants or a11umptions used in making those calculations (e.g. tank specifications. ambient temperature or pressure. density of the controlled substance. etc.):
(iii) Internal accounting procedures for determining plant-wide production:
{iv) The quantity of any fugitive losses accounted for in the production figures; and
(v} The atimated. percent efficiancY of the pruduction proc:aa for the coouolled sub1tanca.
Within 80 days of uy c:bange in the meuurement procadura w tbe informatiaa apedW iD Iha abovw report. Iha producarmut IUboait the rmud data or proc:edma to the Admiaiatrator.
(Z) EQIJpradwraut maintailttbe followinF
(i) Dated ncotda al...qau.tlty of acb of tbe rmtralled ..._.ucn producad at NdafacilitJ:
(ii) Datad ncorda of Iha qualityof coatrolled aubetanca...u feedatoc:ka in tlw ~ of coalrolled aubatanca ud bl the manufactme of WI Cilildl'lliled tubataDcel and UlJ CXlldnlled subataaca introdumd. iDto the produetlcm proceu of mw CODtrOllad l"IJbat•nces •t etlda f.aciiitJ;
(ill} Dated ncarda tll.tha quality of H~ud CF'trttl pn,cbali witllin uch facility alao produdD1 r.oauolW aubatanca;
(iv) Dated racordl of the queatity of the followina rew matariela ucl feedstock chemicala ued at ndl pluat for the produclioa ofc:oatzalW aubatencin: cerboD ~de. ~ c:blamfarm. hydrofluoric ec:id. cblariM. bramble. CFC-113. Hac-zz. and CFC-Z3.
(Y) Dated Nc:orda of Iha ebipnea•• of controlled tubatenc:a prochaced at ach plant
(vi) Tbe quantity of c:oatrolled aubatancea. the date nceived. ud nemn and addrula of the source of recyclable or recoverable matariala. containina controlled aubetucM which are recovered at each plant
(3) For e•ch quarter, each producer must provide the Administrator with a report containins the following information:
(i) The production by plant in that quarter of each controlled aubatance. 1pecifyins the quantity of any controlled sub1tance used for feedstock purpoae■ for controlled and non-controlled subatances for each plant and totaled for all planll owned by the producer;
(ii) The calculated levell of production (expended •Uowancea) for Group I and Group II controlled substances for each plant and totaled for all plants for that quarter and totaled for the control period to-date;
(iii) The shipment• of each controlled substance from each plant in that quarter:
(iv) The producer's total of expended and unexpended consumption allowances. potential production allowances. expended and unexpended

. 30802 Federal Register / Vol. 53, No. 156 / Friday. August 12. 1988 / Rules and Regulations
production allowances and authorization to convert potential production allowances to production allowances. as of the end of that quarter:
(v} The quantity. the date received. and names and addresses of the source of recyclable or recoverable materials containina the controlled substance which are recovered at each plant: and
(4) For any penon who faU. to maintain the recorda required by this parapaph. the Administrator may assume that the penon bas produced at full capacity duriq l!be period for which l"P.COrda were not kepL for purpoaea of
· determinina whether the person bas violated the prohibitions at I 12.4.
(I) For Group I controlled substances. beainni111 with the fint control period specified under t 12.3(f)(1), and for Group U controlled substances. beainninl one year after the Montreal Protocol enters. into force, importers of controlled_1ubstances durin8 a control period maat comply with the following reconlkeepina and reportina requirements:
(1) Any importer must maintain the followi111 records:
(I) The quantity of each controlled substance imported. either alone or in mixtures:
(ii) The date on which the controlled 1ubstancea were imported;
(iii) The port of entry tbrouah which the controlled substances puaed;
(iv) The country from which the imported controlled substances were imported:
(v) The port of exit (vi) The commodity code for the
controlled 1ub1tancea shipped: (vii) The importer number for the
shipment:
(viii) A copy of the bill of lading for the import:
(ix) The invoice for the import: and (x) The U.S. Customs Entry Summary
Form. (2) For each quarter. every importer
must submit to the Administrator a report containinS the following information:
(i} Summaries of the records required in parqrapb (1)(1)(iHvii) of tbil section for the previous quarter:
(ii) The total quantity importfl!d in kilc,srama of each controlled substance for that quarter:
(iii) The calculated levels of import (expended allowances) of Group I and Group 11 controlled substances for that quarter and totaled for the controlperiod-to-date: and
(iv) The importer'• total sum of expended and unexpended consumption allowances at the end of that quarter.
(h) For any exporta of controlled substances not reported under I 82.10 (additional COlll\llllptiOD allowancn) or I 82.11 (Exporta to Parties), the exporter who exported the CDDtrolled aubstaacea muat submit to the Administrator the folloWina information within 4S daya of tht end of the control period in wbicb the unreported aporta 11ft the United States:
(1) 'Ibe names and addreuea of the exporter and the recipient of the exports;
(2) The exporter's Employee Identification Number:
(3) The type and quantity of controlled 1ubstancea exported and what percentage, if any, of the controlled substances that are recycled or used;
(4) The date on which and the port from which the controlled substances were exported from the United States or its territories;
(SJ The country to which the controlled substances were exported: and
(6) The commodity code of the controlled substance shipped.
! 12.14 ...,._,..of,_. [Aa11rnd).
APPENDIXA
0IDrW........CanNllldlllill 111:e ..... A. GnllllJt CFC13-T~
ICFC-11t t.0 CCt~DOAio,----
(CFC-12) 1.0 CCt2F-CCtFI-
T11tNG•--• ~ o.at13t CF2Ct-CCtF2-~ cCFC-n•t- t.0
CCtFMJ=S-
CMD/IOICtllUICIPII •• -• 0.6CCFC-115t a Glolltl 11:
CF211f1Ct-Ba•AGCNIIRI--•
3.0CHllantZttt a:IIIA ................
10.0(Hlllln t301t CIFet-OIi-i IYD-■ ,-
I.OMZJ-
Appendix 8-Puties to die MOlllrul Protocol IR...-ndl Appeadix G-Nalions ComplJial With. But Not Pardts to. die ProlallD1 (Rnervecll Appendix D-Tweaty-Five-Kllolaane Parties (Reeerved)
(FR Doc. M-17923 Filed ~11-aa: l:.a5 •ml ........ CCIDf ........

111111111111i1l1ili111i!1l1i11111111111 ASSET