5 frameworks of analytics
TRANSCRIPT

5 methodsof startup analyticsComparison and Choice

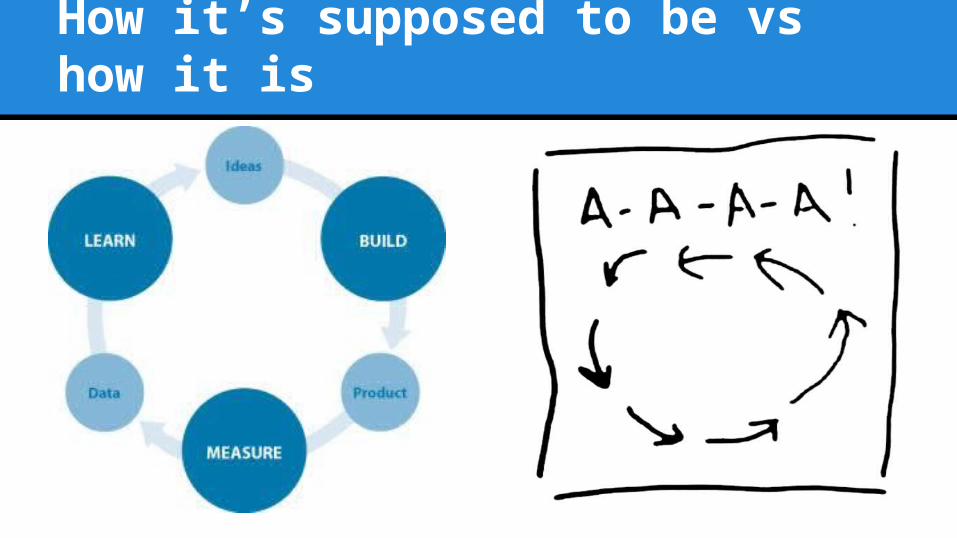
How it’s supposed to be vs how it is
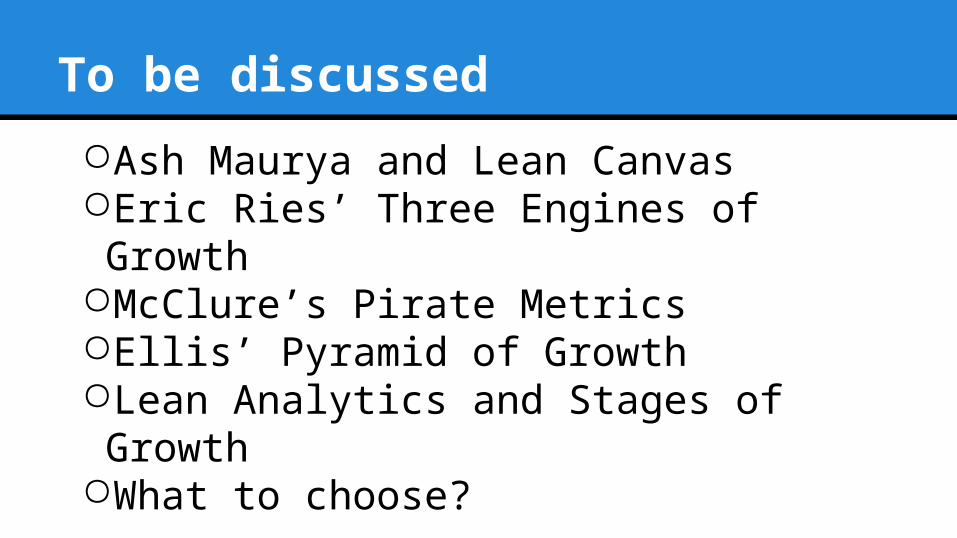
To be discussed○Ash Maurya and Lean Canvas○Eric Ries’ Three Engines of Growth○McClure’s Pirate Metrics○Ellis’ Pyramid of Growth○Lean Analytics and Stages of Growth○What to choose?
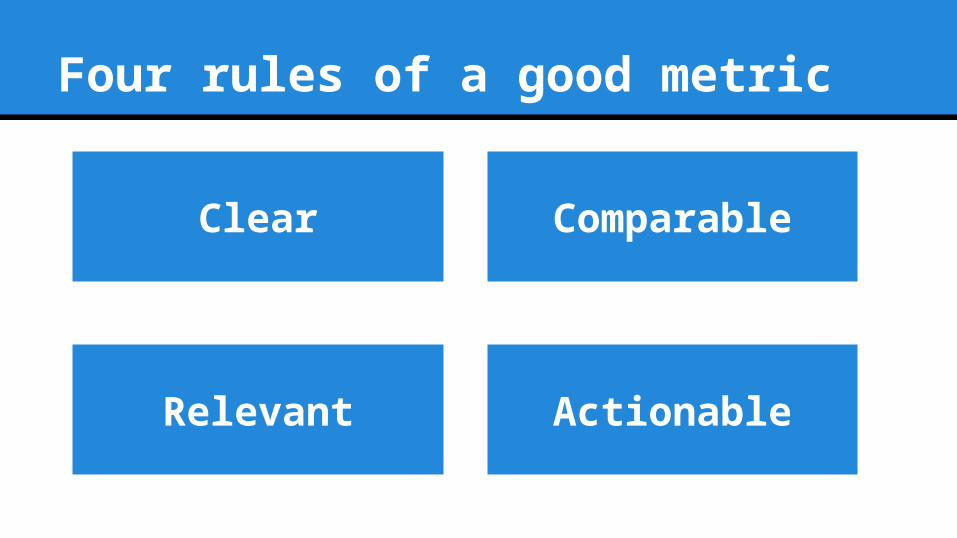
Four rules of a good metric
Clear Comparable
Relevant Actionable

Lean Canvasby Ash Maurya

Fill in and check in the noted order
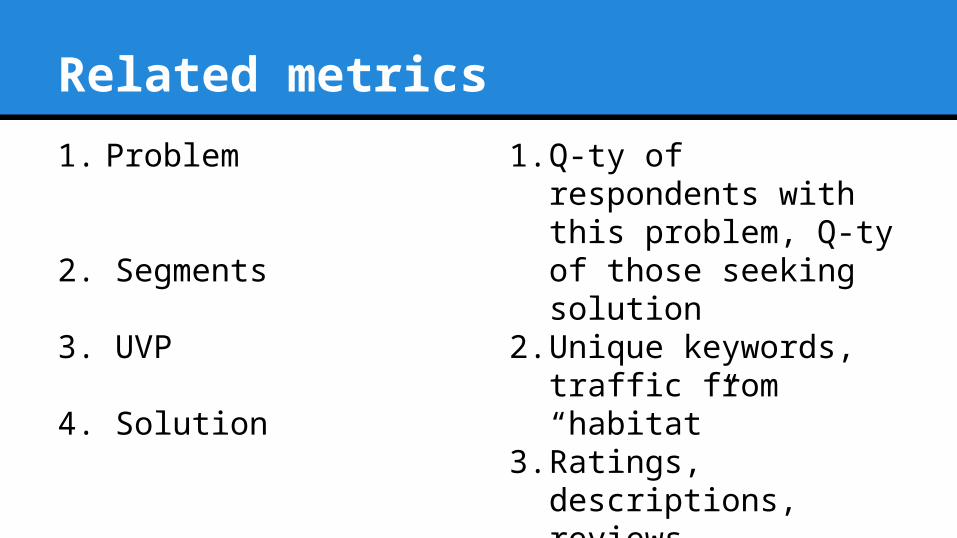
1. Problem
2. Segments
3. UVP
4. Solution
Related metrics1. Q-ty of respondents with
this problem, Q-ty of those seeking solution
2. Unique keywords, traffic from “habitat”
3. Ratings, descriptions, reviews, benchmarking
4. Retention, conversion to active, churn rate
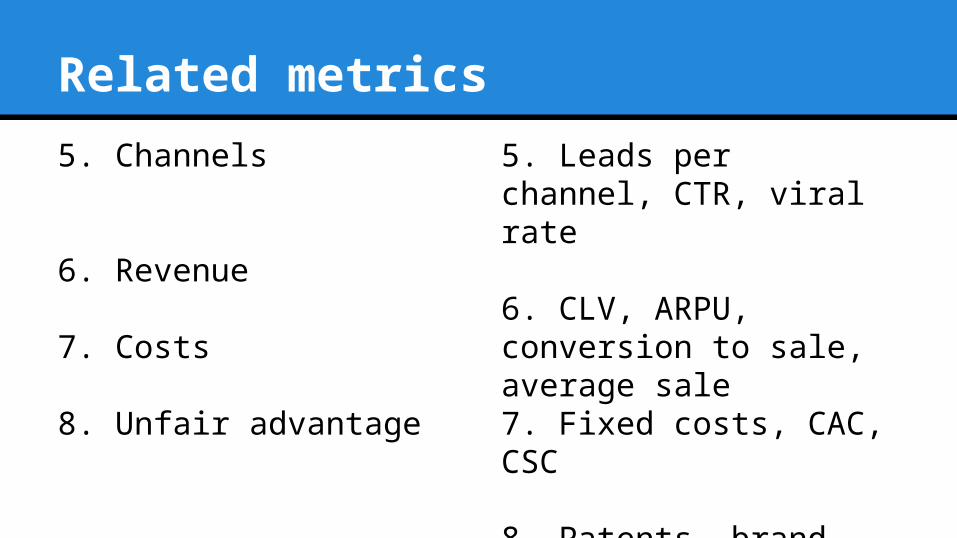
Related metrics5. Channels
6. Revenue
7. Costs
8. Unfair advantage
5. Leads per channel, CTR, viral rate
6. CLV, ARPU, conversion to sale, average sale7. Fixed costs, CAC, CSC
8. Patents, brand value, goodwill, number of deals

by Eric Ries
Growth Engines
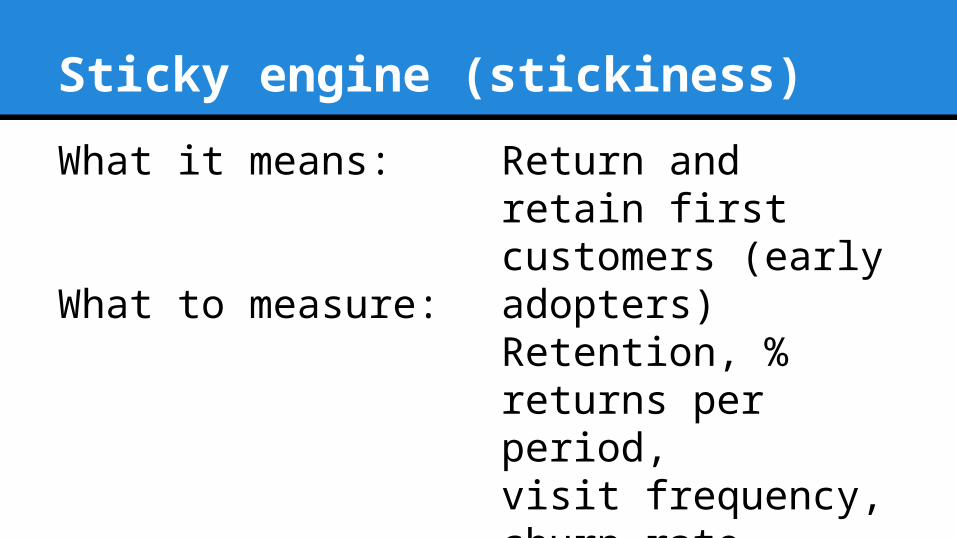
Sticky engine (stickiness)What it means:
What to measure:
Return and retain first customers (early adopters)Retention, % returns per period,visit frequency, churn rate
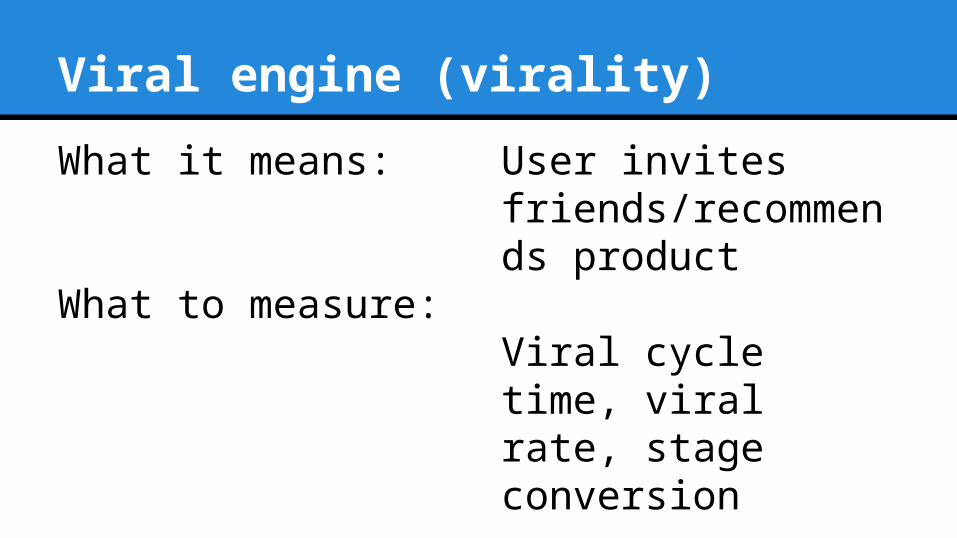
Viral engine (virality)What it means:
What to measure:
User invites friends/recommends product
Viral cycle time, viral rate, stage conversion
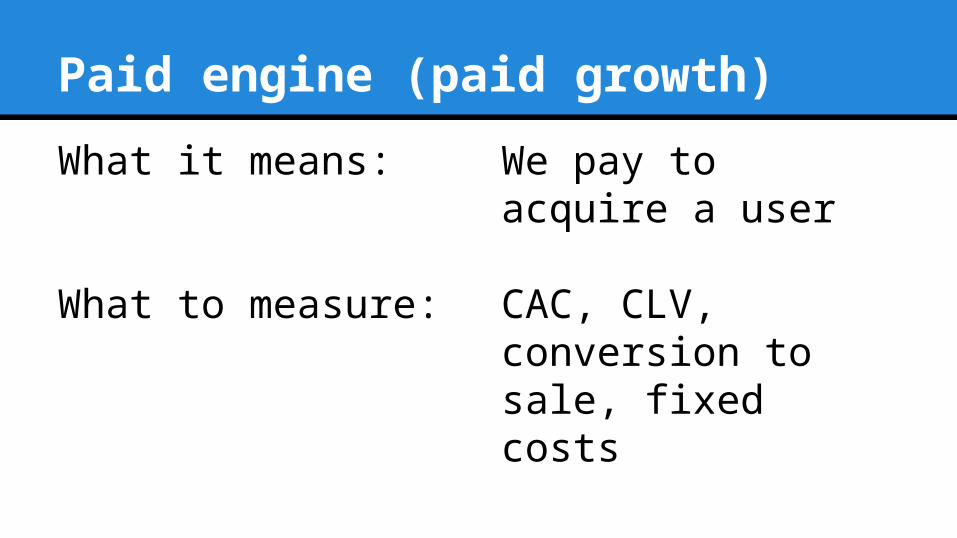
Paid engine (paid growth)What it means:
What to measure:
We pay to acquire a user
САС, CLV, conversion to sale, fixed costs

Pirate Metricsby Dave McClure
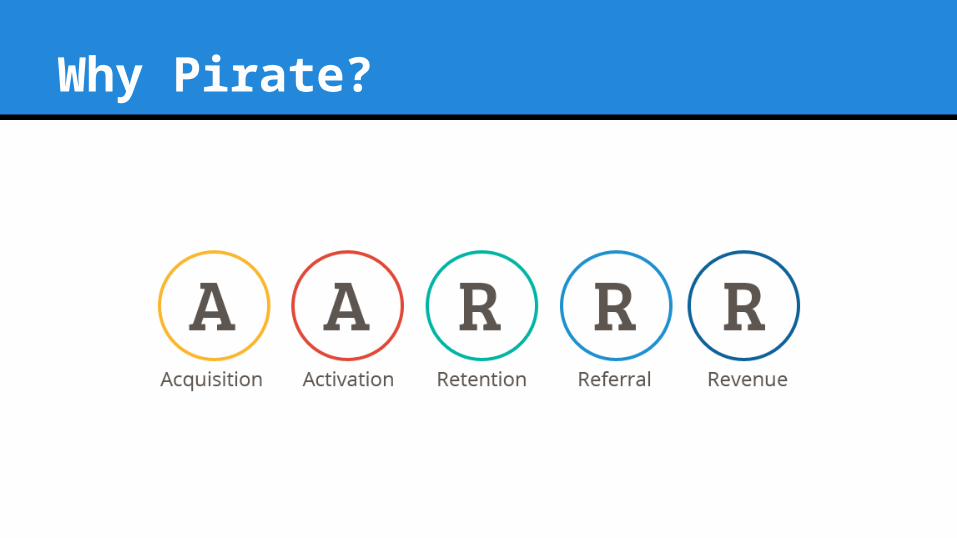
Why Pirate?
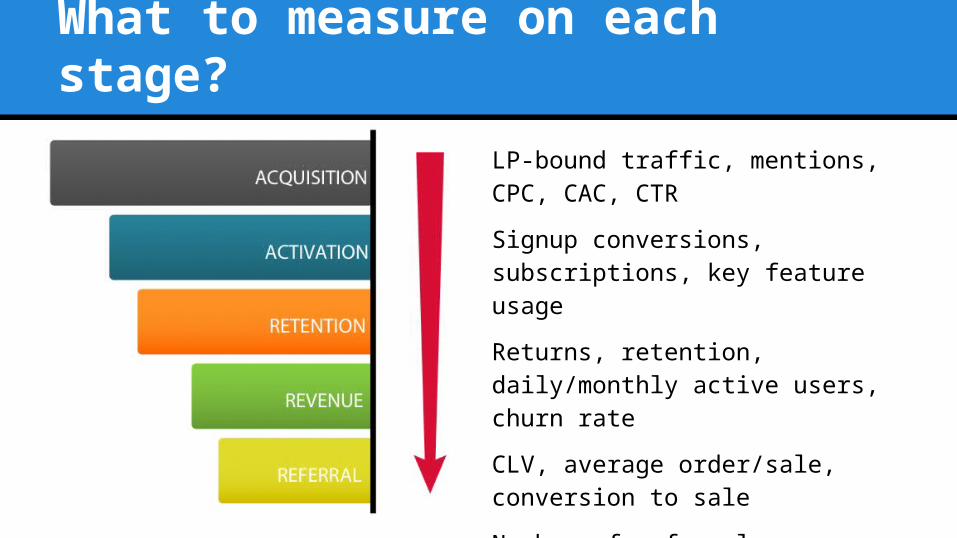
What to measure on each stage?LP-bound traffic, mentions, CPC, CAC, CTR
Signup conversions, subscriptions, key feature usage
Returns, retention, daily/monthly active users, churn rate
CLV, average order/sale, conversion to sale
Number of referrals per new user, viral rate, viral cycle time
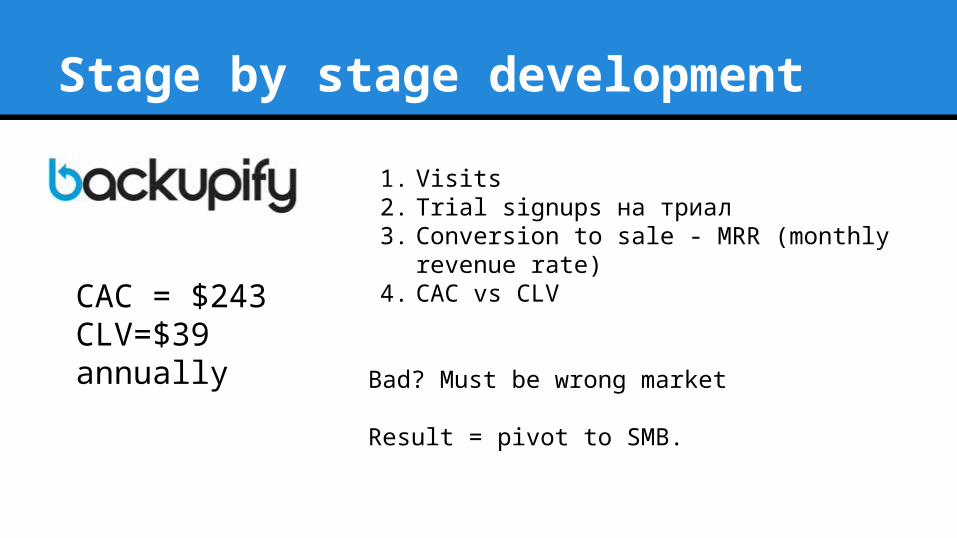
Stage by stage development
1. Visits2. Trial signups на триал3. Conversion to sale - MRR (monthly revenue
rate)4. САС vs CLV
Bad? Must be wrong market
Result = pivot to SMB.
CAC = $243CLV=$39 annually

Growth Pyramidby Sean Ellis
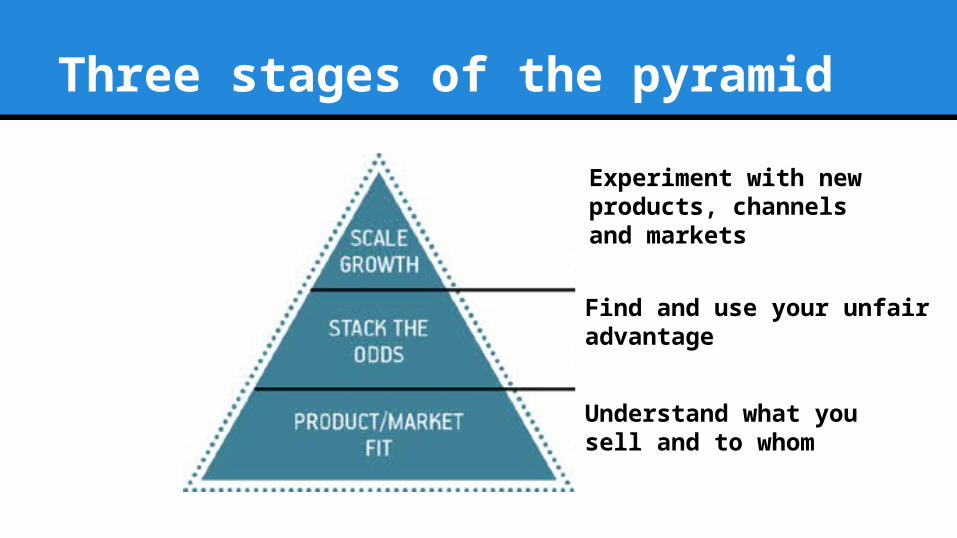
Three stages of the pyramid
Understand what you sell and to whom
Find and use your unfair advantage
Experiment with new products, channels and markets
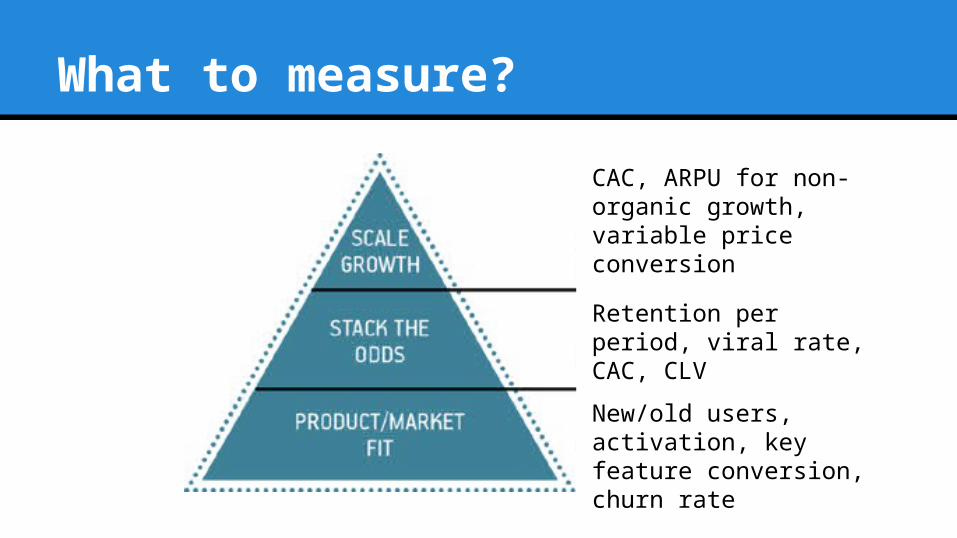
What to measure?
New/old users, activation, key feature conversion, churn rate
Retention per period, viral rate, САС, CLV
САС, ARPU for non-organic growth, variable price conversion

How do you know the market is “ready”?
If >40% of your users look like this, when your server is down.

Tale of One Metric That Matters
Lean Analytics
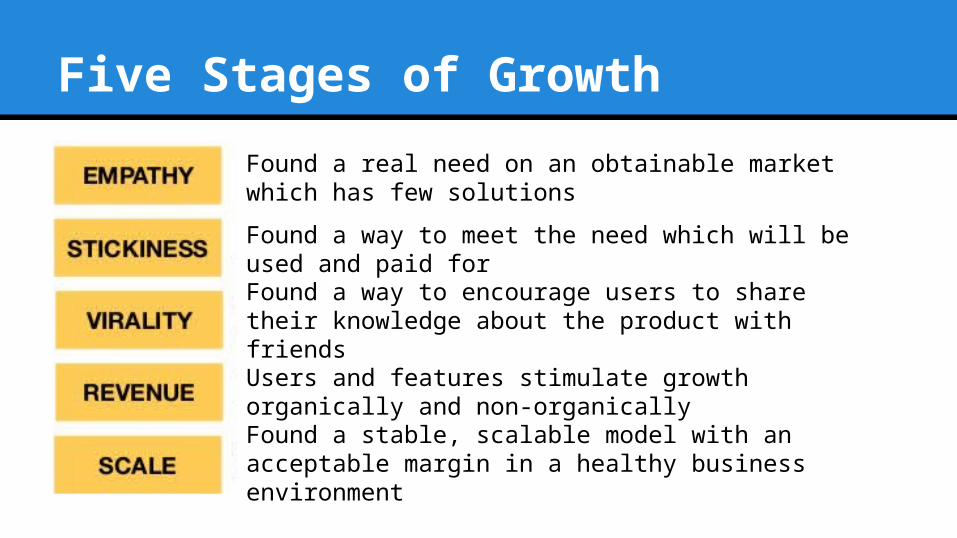
Five Stages of GrowthFound a real need on an obtainable market which has few solutions
Found a way to meet the need which will be used and paid for
Found a way to encourage users to share their knowledge about the product with friends
Users and features stimulate growth organically and non-organically
Found a stable, scalable model with an acceptable margin in a healthy business environment
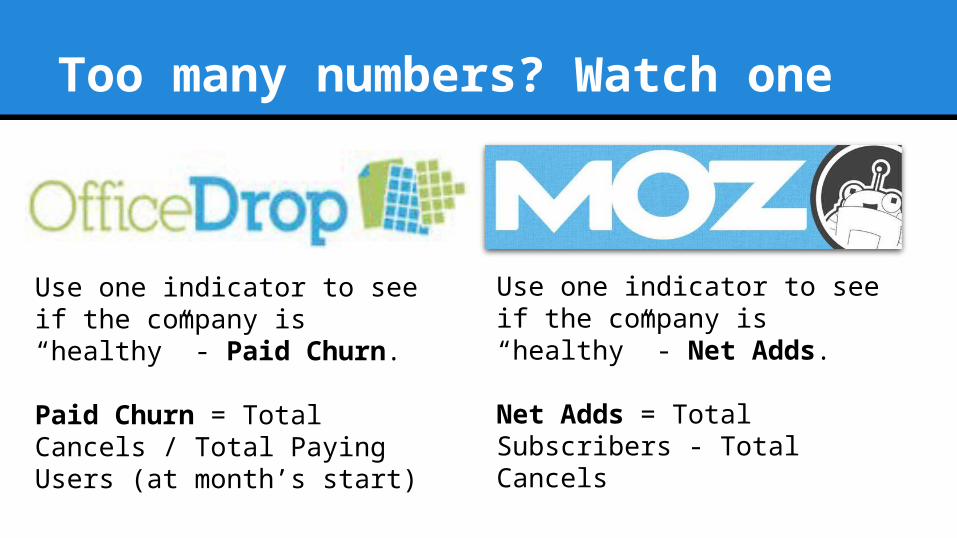
Too many numbers? Watch one
Use one indicator to see if the company is “healthy” - Net Adds.
Net Adds = Total Subscribers - Total Cancels
Use one indicator to see if the company is “healthy” - Paid Churn.
Paid Churn = Total Cancels / Total Paying Users (at month’s start)
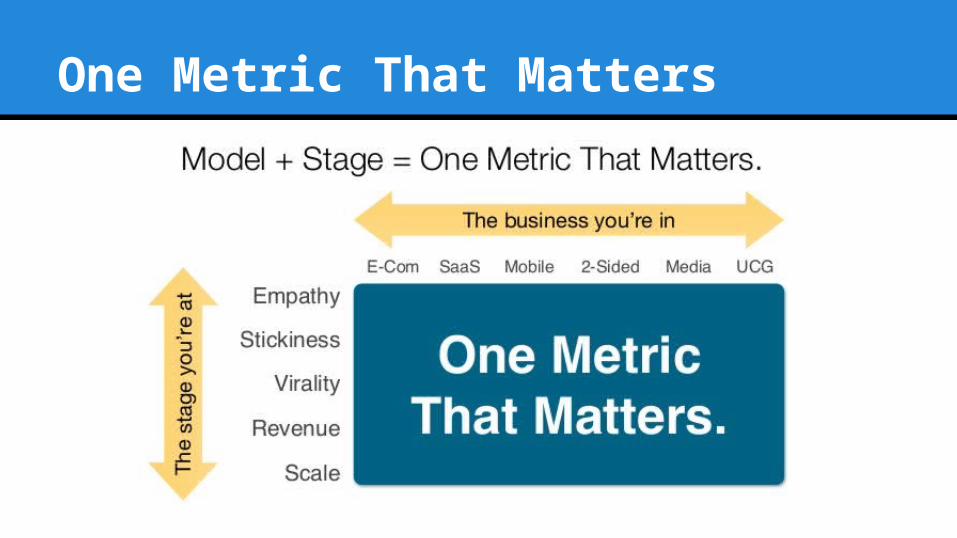
One Metric That Matters
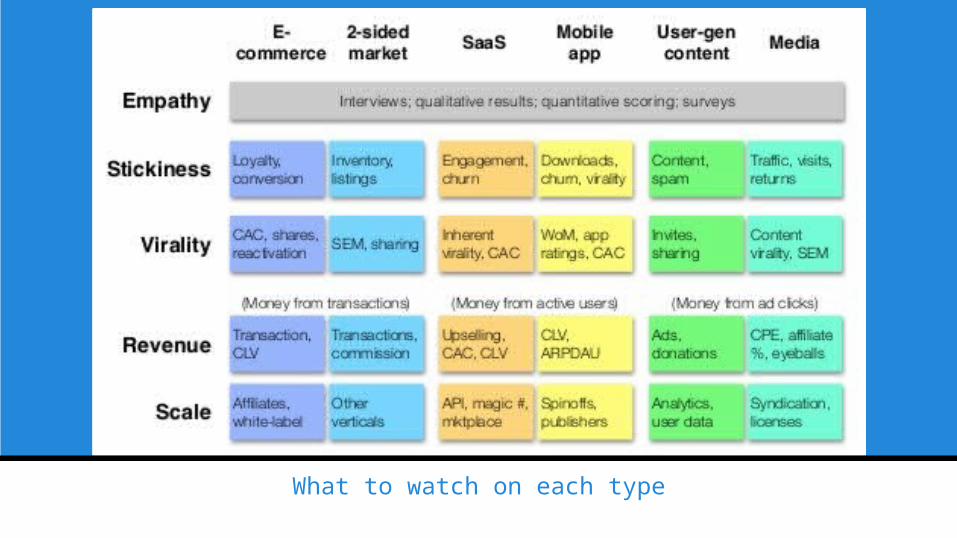
What to watch on each type


Data is an ocean
Analytics is a map and a compass