5. development of the timss context questionnaires
TRANSCRIPT
Chapter 5
5-1
Schmidt, W.H. and Cogan, L.S. (1996) “Development of the TIMSS ContextQuestionnaires” in M.O. Martin and D.L. Kelly (eds.), Third International Mathematicsand Science Study (TIMSS) Technical Report, Volume I: Design and Development. ChestnutHill, MA: Boston College.
5. DEVELOPMENT OF THE TIMSS CONTEXT QUESTIONNAIRES.... 5 - 1William H. Schmidt and Leland S. Cogan
5.1 OVERVIEW.................................................................................................................. 5-1
5.2 INITIAL CONCEPTUAL MODELS AND PROCESSES ............................................................ 5-2
5.3 EDUCATIONAL OPPORTUNITY AS AN UNDERLYING THEME................................................ 5-6
5.4 INSTRUMENTATION REVIEW AND REVISION...................................................................5-10
5.5 THE FINAL INSTRUMENTS.............................................................................................5-13
5. Development of the TIMSS ContextQuestionnaires
William H. SchmidtLeland S. Cogan
5.1 OVERVIEW
The Third International Mathematics and Science Study was designed to investigatestudents’ learning of mathematics and the sciences internationally. The IEA’s SecondInternational Mathematics Study (SIMS), recognizing the importance of curriculum in anystudy of student achievement, developed a tripartite model that placed the curriculum atthe center of the education process. The factors that influence the education process atthree different levels–system, classroom, and student–are represented in this model by threeaspects of curriculum: the intended, implemented, and attained curriculum. The intendedcurriculum refers to the educational system’s goals and the structures established to reachthem. The implemented curriculum refers to the range of practices, activities, andinstitutional arrangements within the school and classroom that are designed to implementthe visions and goals of the intended curriculum. The attained curriculum refers to theproducts of schooling, what students have actually gained from their educationalexperiences. Building on this conceptualization of the education process, TIMSS sought toassess, through context questionnaires, the factors at the system, school, teacher, andstudent level that are likely to influence students’ learning of mathematics and the sciences.
The Survey of Mathematics and Science Opportunities (SMSO) was funded by theNational Science Foundation and the U.S. National Center for Educational Statistics as asmall-scale international research project. Its task was, first, to construct a model of the

Chapter 5
5-2
educational experiences of students; and, second, to develop a comprehensive battery ofsurvey instruments for TIMSS that could be used to study the student, teacher, and schoolcharacteristics that explain cross-national differences in student achievement inmathematics and the sciences. A team of educational researchers from six countriescollaborated in the development, piloting, and revision of all aspects of the instrumentation.
The principal contributors to this effort were Richard Wolfe (Canada), Emilie Barrier(France), Toshio Sawada and Katsuhiko Shimizu (Japan), Doris Jorde and Svein Lie(Norway), Ignacio Gonzalo (Spain), Urs Moser (Switzerland), and Edward Britton, LeighBurstein, Leland Cogan, Curtis McKnight, Senta Raizen, Gilbert Valverde, David Wiley, andWilliam Schmidt (United States). Others made significant contributions by conductingteacher interviews and classroom observations and by participating in analyticaldiscussions. Among these people are Daniel Robin and Josette Le Coq from France, MasaoMiyake and Eizo Nagasaki from Japan, José Antonio López Varona, Reyes Hernández,Blanca Valtierra, and Icíar Eraña from Spain, Erich Ramseier from Switzerland, and CarolCrumbaugh, Pam Jakworth, Mary Kino, and Margaret Savage from the United States.
5.2 INITIAL CONCEPTUAL MODELS AND PROCESSES
The U.S. National Center for Education Statistics (NCES) provided funding for a seriesof focus groups to begin to identify issues for specific data-gathering instruments. Eachfocus group concentrated on one of four levels of the educational system–the system; theschool; the classroom and the teacher; and the student–and developed the correspondingquestionnaires. The group concentrating on system-level characteristics developed theTIMSS participation questionnaire, which was used to gather some of the earliest TIMSSdata. This group was chaired by David Wiley (United States) and included ManfredLehrke (Germany), David Stevenson (United States), Ian Westbury (United States), andTimothy Wyatt (Australia). The school questionnaire focus group was chaired by AndrewPorter (United States) and consisted of Ray Adams (Australia), David Baker (UnitedStates), Ingrid Munck (Sweden), and Timothy Wyatt (Australia). The focus group for theteacher questionnaire was co-chaired by Leigh Burstein and Richard Prawat (United States)and included Ginette DeLandshere (Belgium), Jong-Ha Han (Korea), Mary Kennedy (UnitedStates), Frederick K. S. Leung (Hong Kong), Eizo Nagasaki (Japan), and Teresa Tatto(Mexico). The student questionnaire focus group was chaired by Judith Torney-Purta(United States) and included Chan Siew Eng (Singapore), Lois Peak (United States), JackSchwille (United States), and Peter Vari (Hungary).
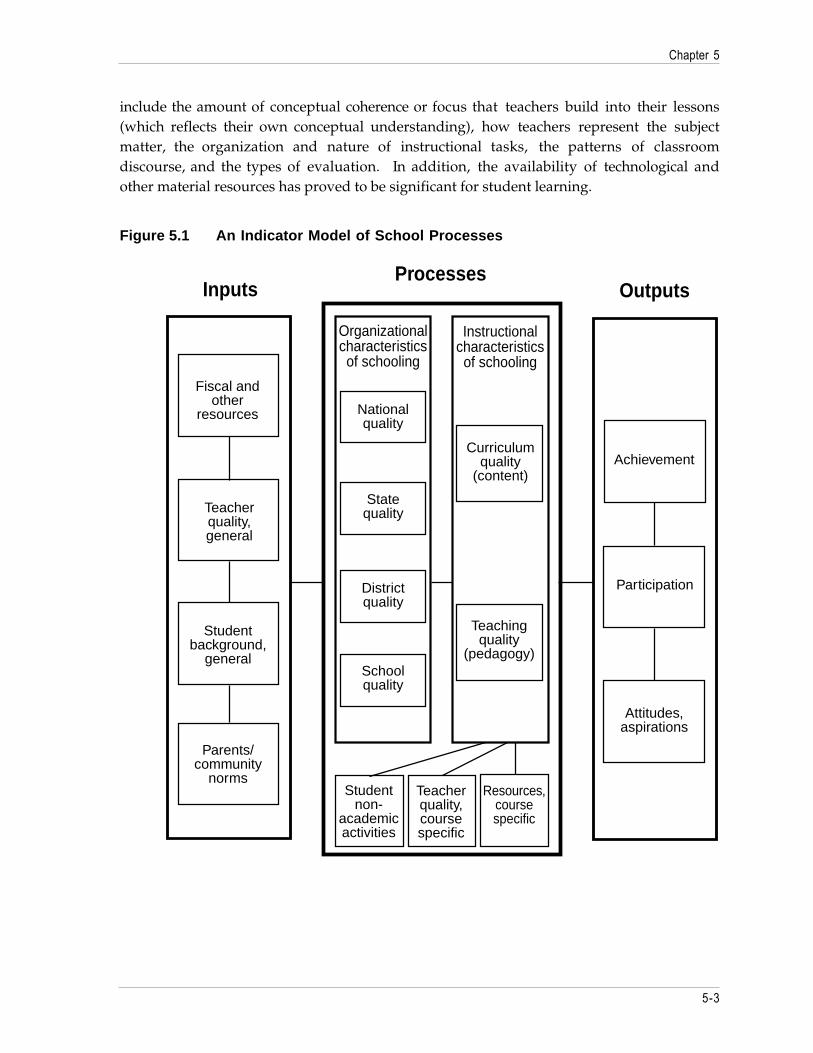
The development of each questionnaire began with a conceptual framework or model ofthe explanatory factors related to the object of the questionnaire. These models were basedon the research literature and on previous IEA studies. For example, the initialidentification of school-related concepts to be included in TIMSS was based on an indicatormodel of school processes developed by Porter (1991), shown in Figure 5.1.
The educational research literature has identified a profusion of important teachercharacteristics that are related to student performance in mathematics and science. These
Chapter 5
5-3
include the amount of conceptual coherence or focus that teachers build into their lessons(which reflects their own conceptual understanding), how teachers represent the subjectmatter, the organization and nature of instructional tasks, the patterns of classroomdiscourse, and the types of evaluation. In addition, the availability of technological andother material resources has proved to be significant for student learning.
Figure 5.1 An Indicator Model of School Processes
Fiscal andother
resources
Teacherquality,general
Studentbackground,
general
Parents/community
norms
Organizationalcharacteristicsof schooling
Nationalquality
Statequality
Districtquality
Schoolquality
Teachingquality
(pedagogy)
Curriculumquality
(content)
Instructionalcharacteristicsof schooling
Achievement
Participation
Attitudes,aspirations
Studentnon-
academicactivities
Teacherquality,coursespecific
ProcessesInputs Outputs
Resources,coursespecific
Chapter 5
5-4
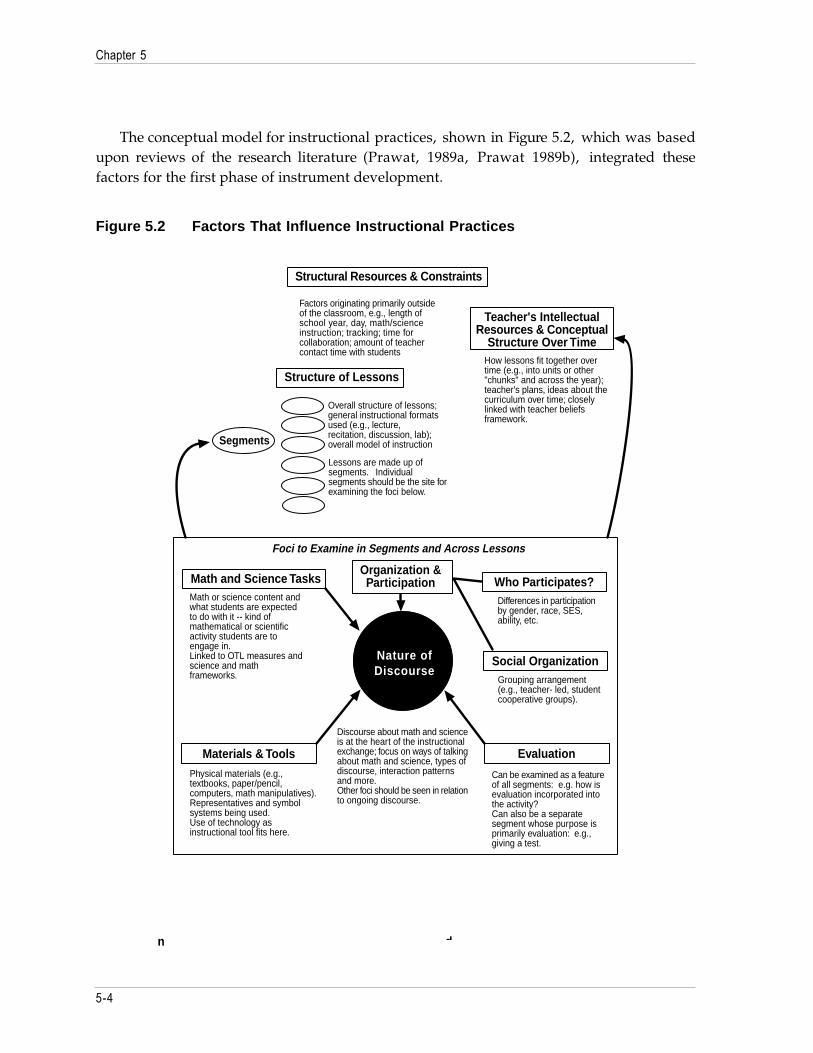
The conceptual model for instructional practices, shown in Figure 5.2, which was basedupon reviews of the research literature (Prawat, 1989a, Prawat 1989b), integrated thesefactors for the first phase of instrument development.
Figure 5.2 Factors That Influence Instructional Practices
Math or science content andwhat students are expectedto do with it -- kind ofmathematical or scientificactivity students are toengage in.Linked to OTL measures andscience and mathframeworks.
Math and Science Tasks
Physical materials (e.g.,textbooks, paper/pencil,computers, math manipulatives).Representatives and symbolsystems being used.Use of technology asinstructional tool fits here.
n d
Materials & Tools
Discourse about math and scienceis at the heart of the instructionalexchange; focus on ways of talkingabout math and science, types ofdiscourse, interaction patternsand more.Other foci should be seen in relationto ongoing discourse.
Can be examined as a featureof all segments: e.g. how isevaluation incorporated intothe activity?Can also be a separatesegment whose purpose isprimarily evaluation: e.g.,giving a test.
Evaluation
Grouping arrangement(e.g., teacher- led, studentcooperative groups).
Social Organization
Differences in participationby gender, race, SES,ability, etc.
Who Participates?Organization &Participation
Nature ofDiscourse
Overall structure of lessons;general instructional formatsused (e.g., lecture,recitation, discussion, lab);overall model of instruction
Lessons are made up ofsegments. Individualsegments should be the site forexamining the foci below.
Foci to Examine in Segments and Across Lessons
Segments
Structure of Lessons
Factors originating primarily outsideof the classroom, e.g., length ofschool year, day, math/scienceinstruction; tracking; time forcollaboration; amount of teachercontact time with students
Structural Resources & Constraints
Teacher's IntellectualResources & Conceptual
Structure Over TimeHow lessons fit together overtime (e.g., into units or other"chunks" and across the year);teacher's plans, ideas about thecurriculum over time; closelylinked with teacher beliefsframework.
Chapter 5
5-5
The initial list of student characteristics to be examined in TIMSS was drawn from theliterature. Conceptual models of student achievement abound in the literature and mosthave a common set of constructs. Given the limits of a large-scale survey and the amount ofstudent response time available, the TIMSS student focus group identified the followingstudent constructs for consideration: demographic characteristics; home and familyenvironment; attitudes and expectations; activities; perceptions of school context; andperceptions of classroom context.
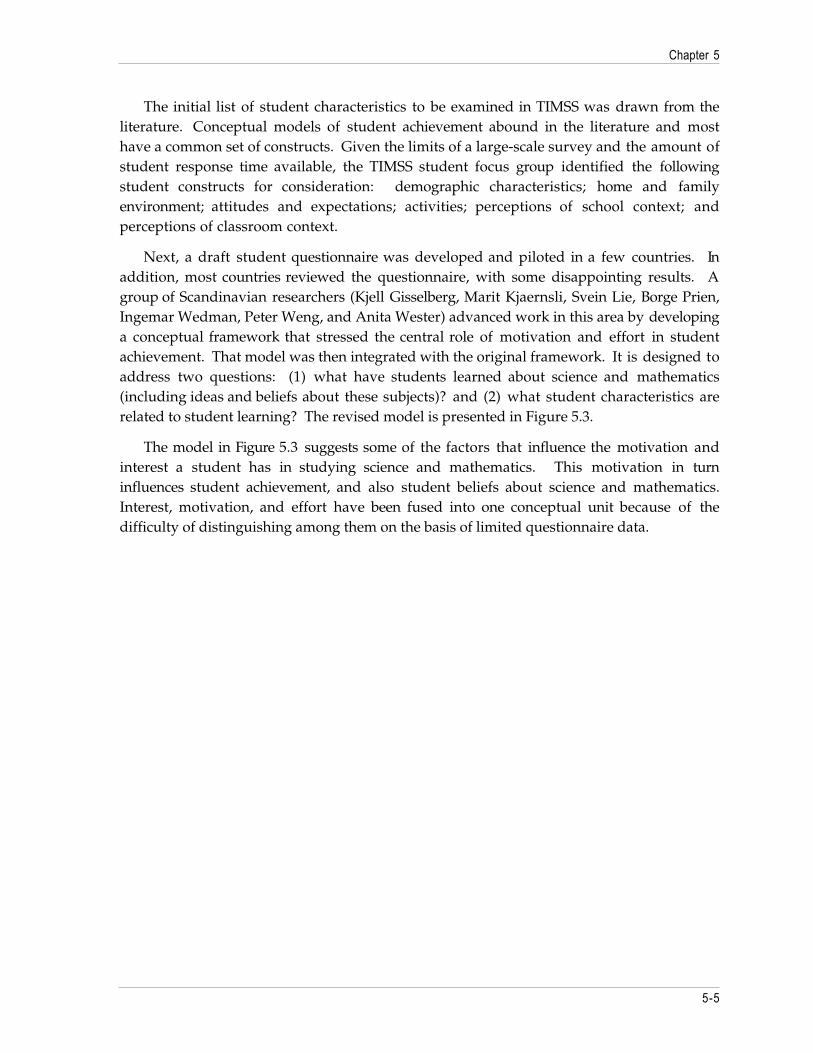
Next, a draft student questionnaire was developed and piloted in a few countries. Inaddition, most countries reviewed the questionnaire, with some disappointing results. Agroup of Scandinavian researchers (Kjell Gisselberg, Marit Kjaernsli, Svein Lie, Borge Prien,Ingemar Wedman, Peter Weng, and Anita Wester) advanced work in this area by developinga conceptual framework that stressed the central role of motivation and effort in studentachievement. That model was then integrated with the original framework. It is designed toaddress two questions: (1) what have students learned about science and mathematics(including ideas and beliefs about these subjects)? and (2) what student characteristics arerelated to student learning? The revised model is presented in Figure 5.3.
The model in Figure 5.3 suggests some of the factors that influence the motivation andinterest a student has in studying science and mathematics. This motivation in turninfluences student achievement, and also student beliefs about science and mathematics.Interest, motivation, and effort have been fused into one conceptual unit because of thedifficulty of distinguishing among them on the basis of limited questionnaire data.

Chapter 5
5-6
Figure 5.3 Revised Model of Student Characteristics
Student background
Student academichistory
Economic capital offamily, socio-economicstatus
Cultural capitalof family includingacademic expectations,possessions, andsupport
Student beliefs;self-concept inmathematics andscience, and beliefsabout related successfactors
Classroom environment,teacher and peerinfluence in mathematicsand science
Time spent outsideof school
Student beliefs aboutscience andmathematics, e.g.,environmental issues
Student achievement
Motivation,effort, andinterest inscience andmathematics
5.3 EDUCATIONAL OPPORTUNITY AS AN UNDERLYING THEME
The models described in the previous sections assume particular points of view, eachaimed at a specific aspect of school learning. The model of Figure 5.2 represents a psycho-social view of classroom instruction consistent with the cognitive-psychology literature. Themodel of Figure 5.3 portrays a view of student learning influenced by theories of individualdifferences and motivation and sociological concepts such as family background. Theschool framework is based on an indicator model of school processes (Porter, 1991).

Chapter 5
5-7
In a study of cross-national differences a more comprehensive perspective isessential–one in which instructional practices, individual student learning, and theorganization of the school are all part of a larger system in which educational experiencesare realized. Such a view recognizes that educational systems, schools, teachers, and thestudents themselves all influence the learning opportunities and experiences of individualstudents. From this perspective, educational opportunity can be regarded as a unifyingtheme of the TIMSS explanatory framework. Curriculum, instruction, and teachercharacteristics are factors that both provide and delimit the educational opportunities ofstudents to learn mathematics and sciences.
The curriculum, by specifying the learning goals at the national or regional level,emphasizes certain opportunities to learn and constrains others. For example, in a countrywith a mandatory national curriculum, the inclusion of a learning goal in that curriculumgreatly increases the probability that classrooms will offer an opportunity to learn thattopic. By the same token, the absence of a learning goal decreases the probability thateducational opportunities related to that goal will be provided.
Differences across countries in the specification of learning goals, and the policiesrelated to the learning goals, are critically important to understanding the nature ofeducational opportunity in those countries. The system-level specification of learning goalssets parameters by which educational opportunities are constrained in the first instance.
Schools and teachers, by their characteristics and activities, further frame educationalopportunities. Both the curricular organization of the school and the qualifications andsubject-matter knowledge of the teachers affect the provision and quality of educationalopportunities. Teachers’ instructional practices and the schools’ course offerings furthershape those opportunities.
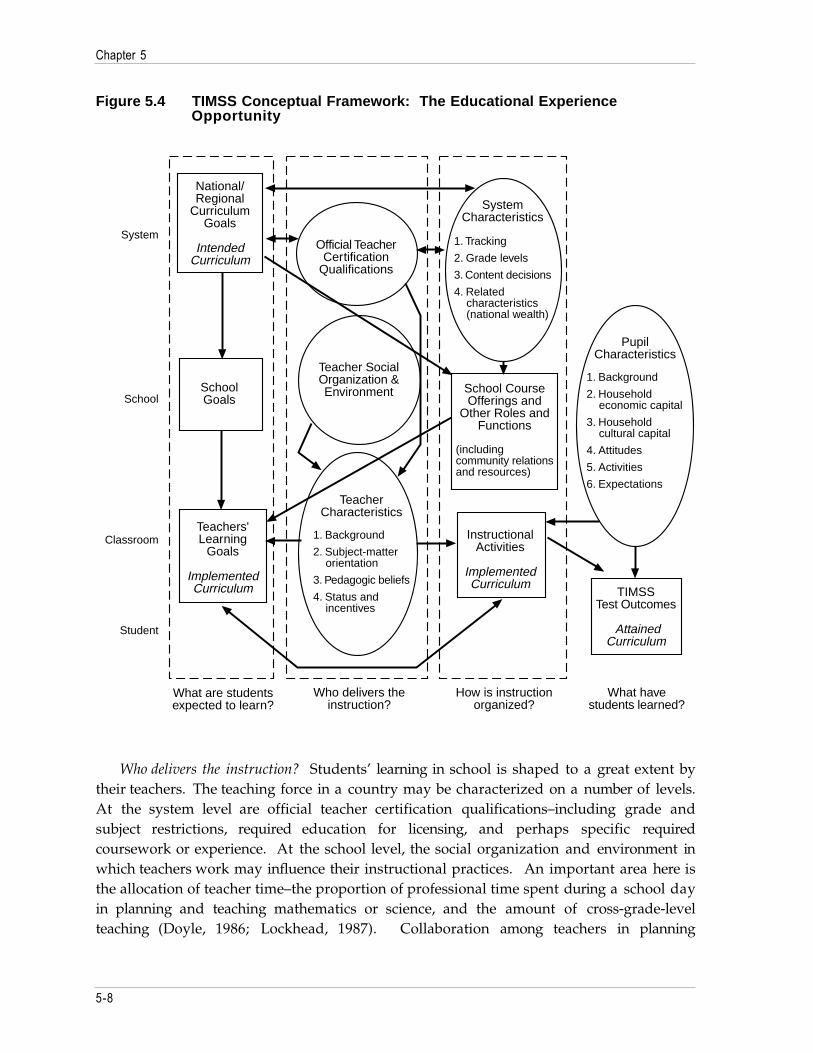
To undergird the development of the data collection instruments, provision ofeducational opportunity was considered at the levels of the educational system, the school,and the classroom in terms of the four general research questions of TIMSS: (1) What arestudents expected to learn? (2) Who delivers the instruction? (3) How is instructionorganized? and (4) What have students learned? This conceptual framework is presentedschematically in Figure 5.4.
What are students expected to learn? There are three main levels of the educational systemat which learning goals are commonly set: the national or regional level, the school level, andthe classroom level. This first research question addresses not only the specification oflearning goals for a system or country as a whole, but also the differentiation of such goalsfor divisions within the larger educational system, such as regions, tracks, school types, andgrade levels. Learning goals specified at the national or regional level are, in the terminologydeveloped within IEA for SIMS, the intended curriculum, whereas those specified at theschool or classroom level are part of the implemented curriculum.
Chapter 5
5-8
Figure 5.4 TIMSS Conceptual Framework: The Educational ExperienceOpportunity
National/Regional
CurriculumGoals
IntendedCurriculum
SchoolGoals
Teachers'Learning
Goals
ImplementedCurriculum
Official TeacherCertification
Qualifications
Teacher SocialOrganization &Environment
TeacherCharacteristics
1. Background
2. Subject-matterorientation
3. Pedagogic beliefs
4. Status andincentives
SystemCharacteristics
1. Tracking
2. Grade levels
3. Content decisions
4. Relatedcharacteristics(national wealth)
School CourseOfferings and
Other Roles andFunctions
(includingcommunity relationsand resources)
InstructionalActivities
ImplementedCurriculum
PupilCharacteristics
1. Background
2. Householdeconomic capital
3. Householdcultural capital
4. Attitudes
5. Activities
6. Expectations
TIMSSTest Outcomes
AttainedCurriculum
What are studentsexpected to learn?
Who delivers theinstruction?
How is instructionorganized?
What havestudents learned?
System
School
Classroom
Student
Who delivers the instruction? Students’ learning in school is shaped to a great extent bytheir teachers. The teaching force in a country may be characterized on a number of levels.At the system level are official teacher certification qualifications–including grade andsubject restrictions, required education for licensing, and perhaps specific requiredcoursework or experience. At the school level, the social organization and environment inwhich teachers work may influence their instructional practices. An important area here isthe allocation of teacher time–the proportion of professional time spent during a school dayin planning and teaching mathematics or science, and the amount of cross-grade-levelteaching (Doyle, 1986; Lockhead, 1987). Collaboration among teachers in planning

Chapter 5
5-9
instructional sequences and strategies may also greatly influence what occurs within theclassroom.
At the classroom level the characteristics of the individual teacher may affect the qualityof instruction and hence the quality of students’ educational experiences. Suchcharacteristics include teachers’ background and beliefs (see Porter, 1991). Teacherbackground variables include age, gender, education, subject taught, and teachingexperience. Teacher beliefs include subject-matter orientation–the views teachers haveabout the disciplines of mathematics and the sciences, which have been shown to affectinstructional practices and student achievement (Thompson, 1992; Putnam, 1992; Peterson,1990). Teacher beliefs also include pedagogical beliefs–their views about what is a goodway to teach a particular topic.
How is the instruction organized? The organization of instruction influences theimplemented curriculum and the learning experiences of students. Decision makingconcerning instruction is distributed across all levels of the education system. This diffusionaffects many organizational aspects–the age-grade structure of education systems, thenature of the schools serving different arrays of grades, and the various curricular tracksinto which students are placed. Economic resources also influence how instruction isorganized, as do the qualifications of the teaching force, the instructional resources availableto the teachers, and the time and material resources available to the students.
Instructional organization also subsumes course offerings and support systems formathematics and science instruction, and the implementation of curriculum in classrooms,including textbook use, structure of lessons, instructional materials, classroom management,student evaluation, student participation, homework, and in-class grouping of students.
What have students learned? Comparing what students have learned in terms of theirperformance on the TIMSS achievement tests is a major focus of the study. However,beyond such comparisons TIMSS wanted to investigate the factors associated with studentlearning. Aside from curriculum goals, teachers, and instructional organization,characteristics of the students themselves influence what and how they learn. Thesecharacteristics include students’ academic history, the economic and cultural capital of thefamily, students’ self-concept, how students spend time outside school, and students’beliefs, motivation, effort, and interest in education and school subjects.
It is not possible to identify and measure every possible factor that affects studentlearning. However, the educational-opportunity model recognizes the connections amongmajor components of the educational system in a very general way. This generic model canbe used to describe many specific educational systems. It does not advocate a particularsystem but rather is intended as a template against which to study systemic variations; inthis sense, it is particularly appropriate for cross-national comparisons.
The data collection instruments developed by SMSO, specifically the participation,school, teacher, and student questionnaires and the curriculum analysis, were all developed

Chapter 5
5-10
concomitantly with the educational opportunity model to examine specific modelcomponents. These are presented schematically in Figure 5.5.
Figure 5.5 TIMSS Instruments Assessing Educational Opportunity
CurriculumAnalysis
IntendedCurriculum
SchoolQuestionnaire
TeacherQuestionnaireContent goals
ImplementedCurriculum
ParticipationQuestionnaire
School andTeacher
Questionnaires
TeacherQuestionnaire
ParticipationQuestionnaire and
UNESCO data
SchoolQuestionnaire
StudentQuestionnaire
TIMSSTest Outcomes
AttainedCurriculum
What are studentsexpected to learn?
Who delivers theinstruction?
How is instructionorganized?
What havestudents learned?
TeacherQuestionnaire
Instructionalpractices
Specific lessonprofile
System
School
Classroom
Student
BackgroundSubject matter beliefs
5.4 INSTRUMENTATION REVIEW AND REVISION
In addition to the NCES focus groups that identified the initial issues and questions forthe various instruments, many others were involved in the review and revision process.National Research Coordinators (NRCs) from the countries participating in TIMSS hadopportunities to review the school, teacher, and student questionnaires at various stages.

Chapter 5
5-11
Comments from NRCs were always carefully considered in producing subsequent versionsfor further rounds of piloting, review, and revision.
Upon several occasions, special groups of researchers were assembled to review, revise,and reorganize the questionnaires. The SMSO, the International Coordinating Center (ICC),and the International Study Center brought together groups to work in this area. As part ofthe development of the questionnaires, TIMSS conducted small informal pilot studies withteachers, students, and school administrators, as well as large-scale formal pilot studies.The student questionnaire was piloted during the item pilot conducted by the ICC in most ofthe TIMSS countries in April and May 1993, and the teacher and school questionnairesduring September and October 1993; key portions of the latter two questionnaires were alsoincluded in the field trial in April and May 1994.
For the 1993 pilot study of the teacher and school questionnaires, each participatingcountry translated the questionnaires into the local language, obtained responses fromteachers and principals, and recorded those responses in computer files. Twenty-twocountries participated in this pilot in some fashion. Twenty countries–Canada (Alberta),Argentina, Australia, Czech Republic, Denmark, France, Greece, Indonesia, Iran, Ireland,Korea, Mexico, New Zealand, Portugal, Romania, Singapore, Spain, Sweden, Switzerland,and the United States–submitted data files. Table 5.1 shows the number of responsessubmitted and analyzed.
Table 5.1 Responses in Pilot Study of School and Teacher Questionnaires
Questionnaire Number of ResponsesTeacher Questionnaire Population 1 488
Population 2 296Population 3 290
School Questionnaire Population 1 133Population 2 174Population 3 58
In addition to the data files, 15 countries–Canada (Alberta), Australia, Czech Republic,France, Greece, Ireland, Korea, Netherlands, New Zealand, Portugal, Singapore, Sweden,Switzerland, Tunisia, and the United States–submitted written reports on the pilot studiesin their countries.
Three types of data from the pilot study were used to revise the teacher and schoolquestionnaires. First, all comments concerning the questionnaires made in NRCs’ reports orby other sources were placed into an electronic database. This was organized by itemwithin each questionnaire. Table 5.2 shows examples of comments on two items, one fromthe school questionnaire and one from the teacher questionnaire.

Chapter 5
5-12
Table 5.2 Examples of Comments on Questionnaire Items Entered intoDatabase
Question Country CommentSC1-12 CSK Principals teach regularly, they must prepare for their lessons, some of them even work
as homeroom teachers. These activities are missing in the list.
TQ1 General NLD Each questionnaire needs a general instruction in front of the questionnaire indicatingthe purpose of it (gathering information about the implemented curriculum, which isrelated to information about the attained and intended curriculum as well) and sayingthat most questions can be answered by checking one or more boxes. Note: samecomments for TQ2M-Gen. and TQ2S-Gen.
The second type of data from which revisions were made came from the writtenresponses to the “other” options that were part of many items in the piloted questionnaires.These responses were translated into English, placed into a database, and sorted byquestionnaire type and item. The third type of data came from multiple-choicequestionnaire items that were stored in the data files.
The written responses to the “other” options were used to expand the options for someitems and to revise others. Instructions and options were rewritten to clarify the intent ofsome questions and to facilitate the generation of an appropriate response. The multiple-choice item data were analyzed to eliminate options for some items, rewrite some options,and confirm that some options should be retained rather than eliminated.
The pilot study gave rise to the following conclusions about the draft questionnaires.
• The questionnaires were too long and took too much time to complete
• Some of the language was too technical
• Considerable cross-country variation in item responses was evident. This variation,which makes international comparisons interesting, also makes it difficult to developitems that are meaningful and relevant within all countries
• There was a good distribution of responses across the item options. Respondentsseemed to have no difficulty responding to options with three, four, or five categories
• Much of the formatting needed to be simplified. Some countries were unable toreproduce shaded areas and many respondents found the skip patterns difficult tofollow
The results of the pilot study led to extensive revision of the questionnaires. In June1994, a meeting was held in Hamburg, Germany, for the purpose of reviewing and revisingthe Populations 1 and 2 school and teacher questionnaires. Hosted by NevillePostlethwaite and chaired by William Schmidt, the working group included Michael Martin(International Study Center) and the following NRCs: Wendy Keys (England), ChristianeBrusselmans-Dehairs (Belgium, Flemish), and Wilmad Kuiper (Netherlands). TheInternational Study Center then made the recommended changes and disseminated therevised versions of the questionnaires to all NRCs and TIMSS committees. Simultaneously,
Chapter 5
5-13
the student questionnaires for Populations 1 and 2 were reformatted, revised, anddistributed for review. The Populations 1 and 2 context questionnaires were endorsed bythe TIMSS NRCs in August 1994 and both paper and electronic versions were provided tothe participating countries for translation, duplication, and administration.
In October 1994, the Population 3 school and student questionnaires were revised. Inearly November 1994, a group of NRCs reviewed the questionnaires and made suggestionsfor restructuring them. The International Study Center made the changes and distributed therevised versions to a small group of NRCs nominated by their colleagues for review beforedissemination. In December 1994, the final versions of the Population 3 student and schoolquestionnaires were disseminated to all participating countries for translation, duplication,and administration.
The model of educational opportunity guided questionnaire development, itemevaluation, and revision throughout. The identification of key research questions led to thecreation of a conceptual framework matrix in which various issues were assigned to specificinstruments. This model links the three main areas of investigation in TIMSS: the curriculumanalysis, the context questionnaires, and the student test.
5.5 THE FINAL INSTRUMENTS
The participation questionnaires gathered general information about a country’seducation system and its organization and structure. This information was used in the earlystages of TIMSS to make decisions about sampling and about which curriculum guides andtextbooks would be appropriate for the curriculum analysis. It was also used to identifyissues that would need further clarification from the other instruments.
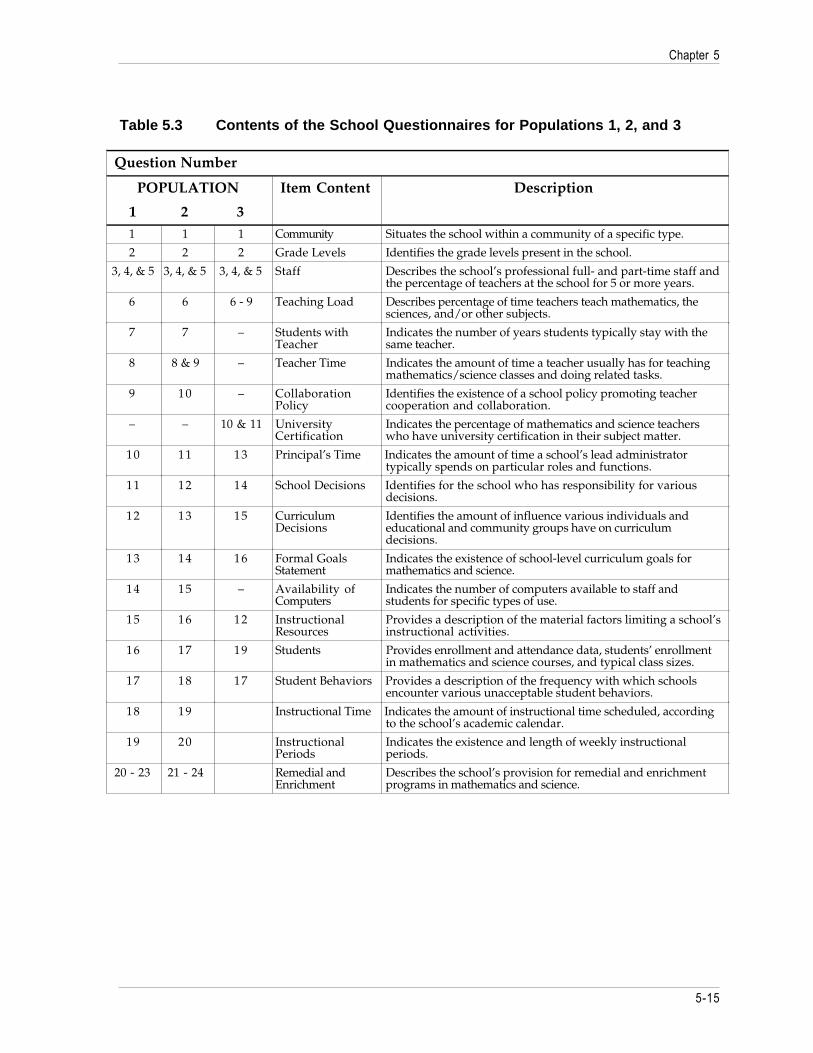
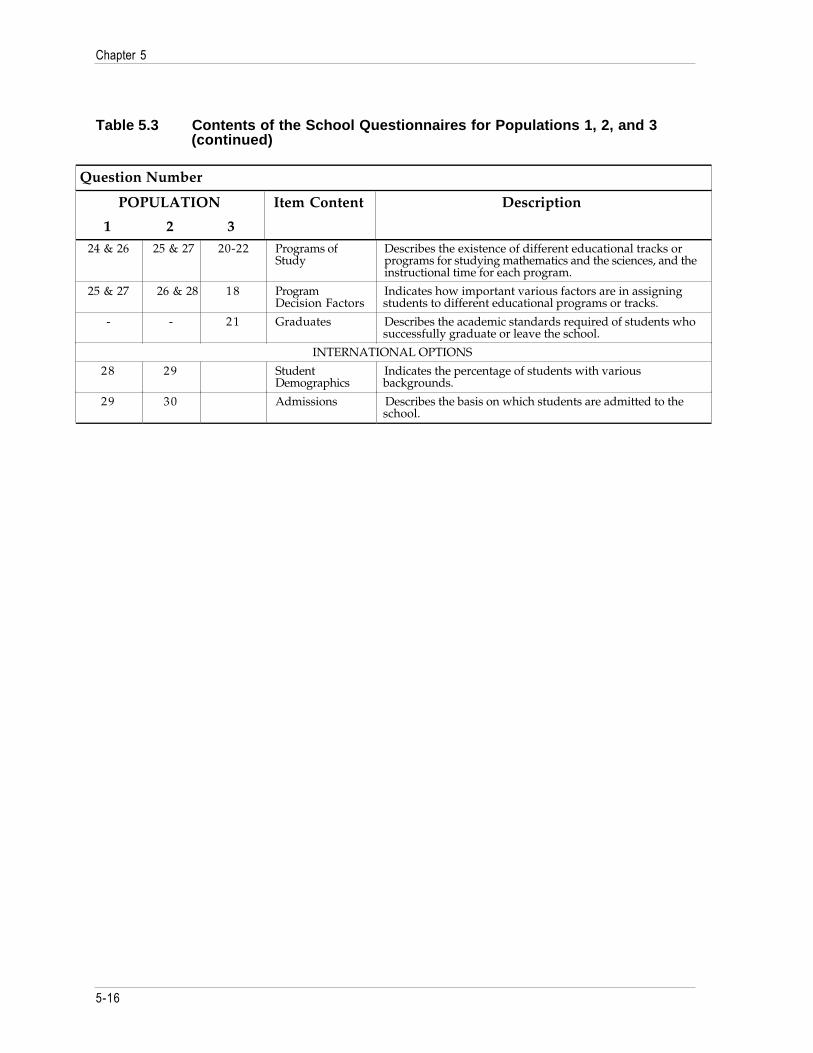
The school questionnaires at each population level sought information about the school’scommunity, staff, students, curriculum and programs of study, and instructional resourcesand time. The number of years students are taught by the same teacher is addressed in thePopulation 1 and 2 versions but is not relevant at the Population 3 level. The school’srequirements for graduation or successful completion of schooling are addressed in thePopulation 3 version but not in the others. Questions that address programs of study areexpanded in the Population 3 version since this issue is considerably more complex at thislevel. The content and purpose of each item and the correspondences and differencesamong the three versions are detailed in Table 5.3.
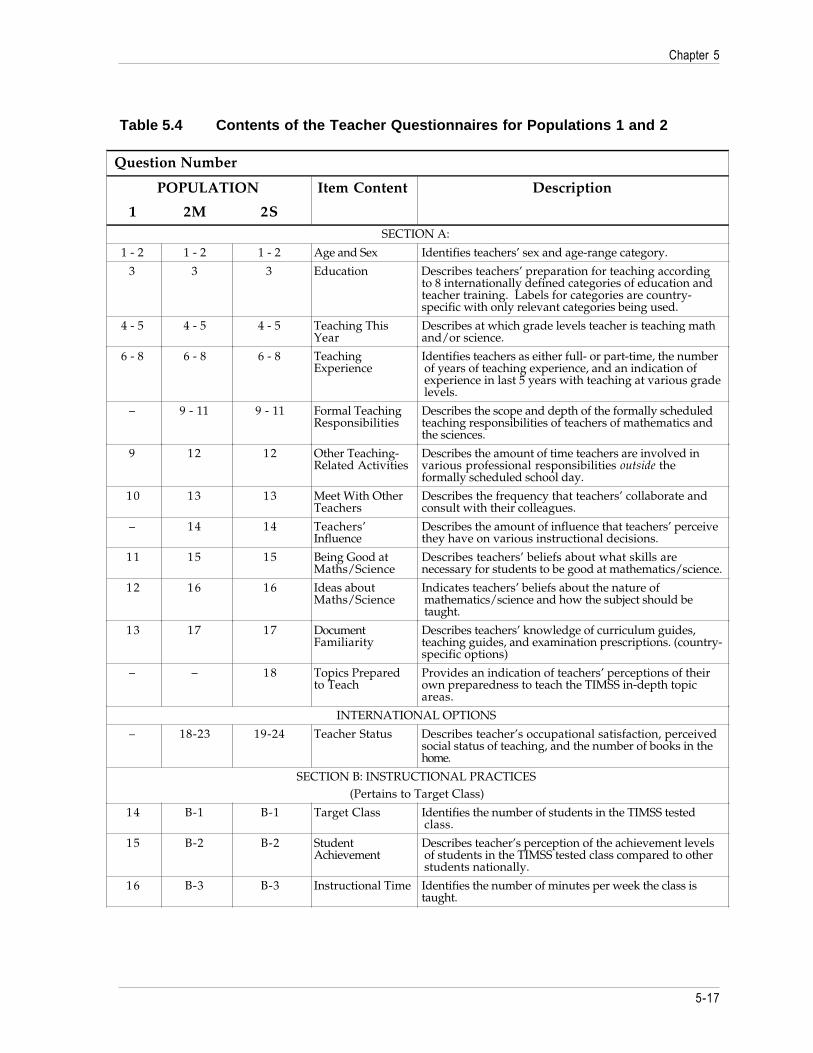
The teacher questionnaires for Population 2 address four major areas: teacher’sbackground, instructional practices, students’ opportunity to learn, and teacher’s pedagogicbeliefs. There are separate questionnaires for teachers of mathematics and of science. Sincemost Population 1 teachers teach all subjects, a single teacher questionnaire at this leveladdresses both mathematics and science. This has constrained coverage such that onlyitems addressing teacher’s background and instructional practices are included. In general,the focus for most questions is mathematics. However, the item assessing teacher’s contentgoals is asked about both mathematics and science, since this is the main link in the teacher

Chapter 5
5-14
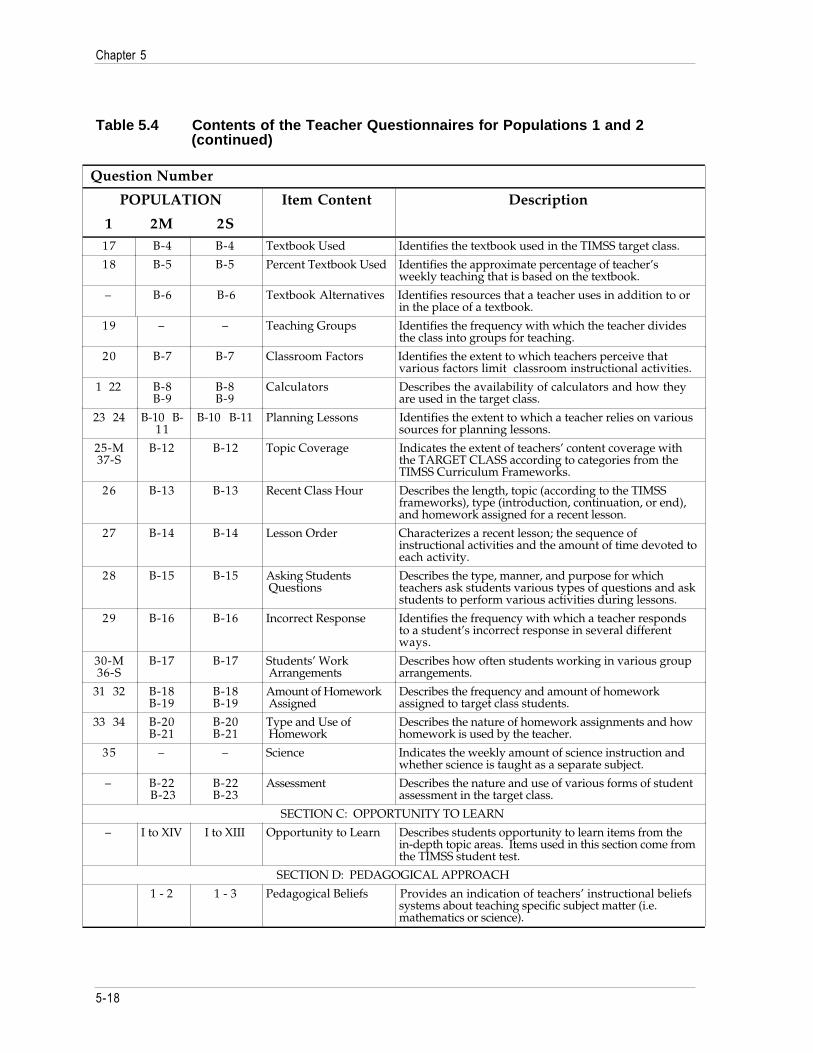
questionnaire to the TIMSS curriculum analysis. The content and purpose of each item andthe similarities and differences among the three versions are detailed in Table 5.4.
In general, the structure and content of the student questionnaires are consistent acrosspopulations. A few items were not included in the Population 1 version, such as students’reports of parents’ education, since responses were not considered reliable. Also, mostresponse categories were reduced in the Population 1 version from four to three. Twoversions of student questionnaires for Population 2 were developed: one for use in systemsteaching general science and another for use in systems where students take courses inspecific sciences such as biology, chemistry, earth science, or physics. Some items are uniqueto the Population 3 student questionnaire. These were developed to gather informationregarding students’ academic history and their plans for further education. The content andpurpose of each item is detailed in Table 5.5.
Chapter 5
5-15
Table 5.3 Contents of the School Questionnaires for Populations 1, 2, and 3
Question Number
POPULATION Item Content Description
1 2 31 1 1 Community Situates the school within a community of a specific type.
2 2 2 Grade Levels Identifies the grade levels present in the school.
3, 4, & 5 3, 4, & 5 3, 4, & 5 Staff Describes the school’s professional full- and part-time staff andthe percentage of teachers at the school for 5 or more years.
6 6 6 - 9 Teaching Load Describes percentage of time teachers teach mathematics, thesciences, and/or other subjects.
7 7 – Students withTeacher
Indicates the number of years students typically stay with thesame teacher.
8 8 & 9 – Teacher Time Indicates the amount of time a teacher usually has for teachingmathematics/science classes and doing related tasks.
9 10 – CollaborationPolicy
Identifies the existence of a school policy promoting teachercooperation and collaboration.
– – 10 & 11 UniversityCertification
Indicates the percentage of mathematics and science teacherswho have university certification in their subject matter.
10 11 13 Principal’s Time Indicates the amount of time a school’s lead administratortypically spends on particular roles and functions.
11 12 14 School Decisions Identifies for the school who has responsibility for variousdecisions.
12 13 15 CurriculumDecisions
Identifies the amount of influence various individuals andeducational and community groups have on curriculumdecisions.
13 14 16 Formal GoalsStatement
Indicates the existence of school-level curriculum goals formathematics and science.
14 15 – Availability ofComputers
Indicates the number of computers available to staff andstudents for specific types of use.
15 16 12 InstructionalResources
Provides a description of the material factors limiting a school’sinstructional activities.
16 17 19 Students Provides enrollment and attendance data, students’ enrollmentin mathematics and science courses, and typical class sizes.
17 18 17 Student Behaviors Provides a description of the frequency with which schoolsencounter various unacceptable student behaviors.
18 19 Instructional Time Indicates the amount of instructional time scheduled, accordingto the school’s academic calendar.
19 20 InstructionalPeriods
Indicates the existence and length of weekly instructionalperiods.
20 - 23 21 - 24 Remedial andEnrichment
Describes the school’s provision for remedial and enrichmentprograms in mathematics and science.
Chapter 5
5-16
Table 5.3 Contents of the School Questionnaires for Populations 1, 2, and 3(continued)
Question Number
POPULATION Item Content Description
1 2 324 & 26 25 & 27 20-22 Programs of
StudyDescribes the existence of different educational tracks orprograms for studying mathematics and the sciences, and theinstructional time for each program.
25 & 27 26 & 28 18 ProgramDecision Factors
Indicates how important various factors are in assigningstudents to different educational programs or tracks.
- - 21 Graduates Describes the academic standards required of students whosuccessfully graduate or leave the school.
INTERNATIONAL OPTIONS
28 29 StudentDemographics
Indicates the percentage of students with variousbackgrounds.
29 30 Admissions Describes the basis on which students are admitted to theschool.
Chapter 5
5-17
Table 5.4 Contents of the Teacher Questionnaires for Populations 1 and 2
Question Number
POPULATION Item Content Description
1 2M 2SSECTION A:
1 - 2 1 - 2 1 - 2 Age and Sex Identifies teachers’ sex and age-range category.
3 3 3 Education Describes teachers’ preparation for teaching accordingto 8 internationally defined categories of education andteacher training. Labels for categories are country-specific with only relevant categories being used.
4 - 5 4 - 5 4 - 5 Teaching ThisYear
Describes at which grade levels teacher is teaching mathand/or science.
6 - 8 6 - 8 6 - 8 TeachingExperience
Identifies teachers as either full- or part-time, the numberof years of teaching experience, and an indication ofexperience in last 5 years with teaching at various gradelevels.
– 9 - 11 9 - 11 Formal TeachingResponsibilities
Describes the scope and depth of the formally scheduledteaching responsibilities of teachers of mathematics andthe sciences.
9 12 12 Other Teaching-Related Activities
Describes the amount of time teachers are involved invarious professional responsibilities outside theformally scheduled school day.
10 13 13 Meet With OtherTeachers
Describes the frequency that teachers’ collaborate andconsult with their colleagues.
– 14 14 Teachers’Influence
Describes the amount of influence that teachers’ perceivethey have on various instructional decisions.
11 15 15 Being Good atMaths/Science
Describes teachers’ beliefs about what skills arenecessary for students to be good at mathematics/science.
12 16 16 Ideas aboutMaths/Science
Indicates teachers’ beliefs about the nature ofmathematics/science and how the subject should betaught.
13 17 17 DocumentFamiliarity
Describes teachers’ knowledge of curriculum guides,teaching guides, and examination prescriptions. (country-specific options)
– – 18 Topics Preparedto Teach
Provides an indication of teachers’ perceptions of theirown preparedness to teach the TIMSS in-depth topicareas.
INTERNATIONAL OPTIONS
– 18-23 19-24 Teacher Status Describes teacher’s occupational satisfaction, perceivedsocial status of teaching, and the number of books in thehome.
SECTION B: INSTRUCTIONAL PRACTICES(Pertains to Target Class)
14 B-1 B-1 Target Class Identifies the number of students in the TIMSS testedclass.
15 B-2 B-2 StudentAchievement
Describes teacher’s perception of the achievement levelsof students in the TIMSS tested class compared to otherstudents nationally.
16 B-3 B-3 Instructional Time Identifies the number of minutes per week the class istaught.
Chapter 5
5-18
Table 5.4 Contents of the Teacher Questionnaires for Populations 1 and 2(continued)
Question Number
POPULATION Item Content Description
1 2M 2S17 B-4 B-4 Textbook Used Identifies the textbook used in the TIMSS target class.
18 B-5 B-5 Percent Textbook Used Identifies the approximate percentage of teacher’sweekly teaching that is based on the textbook.
– B-6 B-6 Textbook Alternatives Identifies resources that a teacher uses in addition to orin the place of a textbook.
19 – – Teaching Groups Identifies the frequency with which the teacher dividesthe class into groups for teaching.
20 B-7 B-7 Classroom Factors Identifies the extent to which teachers perceive thatvarious factors limit classroom instructional activities.
1 22 B-8B-9
B-8B-9
Calculators Describes the availability of calculators and how theyare used in the target class.
23 24 B-10 B-11
B-10 B-11 Planning Lessons Identifies the extent to which a teacher relies on varioussources for planning lessons.
25-M37-S
B-12 B-12 Topic Coverage Indicates the extent of teachers’ content coverage withthe TARGET CLASS according to categories from theTIMSS Curriculum Frameworks.
26 B-13 B-13 Recent Class Hour Describes the length, topic (according to the TIMSSframeworks), type (introduction, continuation, or end),and homework assigned for a recent lesson.
27 B-14 B-14 Lesson Order Characterizes a recent lesson; the sequence ofinstructional activities and the amount of time devoted toeach activity.
28 B-15 B-15 Asking StudentsQuestions
Describes the type, manner, and purpose for whichteachers ask students various types of questions and askstudents to perform various activities during lessons.
29 B-16 B-16 Incorrect Response Identifies the frequency with which a teacher respondsto a student’s incorrect response in several differentways.
30-M36-S
B-17 B-17 Students’ WorkArrangements
Describes how often students working in various grouparrangements.
31 32 B-18B-19
B-18B-19
Amount of HomeworkAssigned
Describes the frequency and amount of homeworkassigned to target class students.
33 34 B-20B-21
B-20B-21
Type and Use ofHomework
Describes the nature of homework assignments and howhomework is used by the teacher.
35 – – Science Indicates the weekly amount of science instruction andwhether science is taught as a separate subject.
– B-22B-23
B-22B-23
Assessment Describes the nature and use of various forms of studentassessment in the target class.
SECTION C: OPPORTUNITY TO LEARN
– I to XIV I to XIII Opportunity to Learn Describes students opportunity to learn items from thein-depth topic areas. Items used in this section come fromthe TIMSS student test.
SECTION D: PEDAGOGICAL APPROACH
1 - 2 1 - 3 Pedagogical Beliefs Provides an indication of teachers’ instructional beliefssystems about teaching specific subject matter (i.e.mathematics or science).

Chapter 5
5-19
Table 5.5 Contents of the Student Questionnaires for Populations 1, 2, and 3
Question Number
POPULATION Item Content Description
1 2 2(s)
3
1 - 4 1 - 4 1 - 4 1 - 5 Student’sDemographics
Provides basic demographic information to contextualizestudents’ responses: age; sex; language of the home; if born in thecountry and if not how long he/she has lived in country.
5 5 5 15 AcademicActivities Outsideof School
Provides information on student activities that can impact theiracademic achievement.
6 6 6 16 Time Outside ofSchool
Provides information on students’ recreational and study habitsoutside of school.
7 - 8 7 - 8 7 - 8 6 - 7 People Living inthe Home
Provides information about the home environment as an indicatorof cultural and economic capital.
– 9 9 11 ParentalEducation
Provides an indicator of the home environment and data to createan indicator of socio-economic status.
9 10 10 4 Parent's Countryof Birth
Provides information regarding immigrant status.
10 11 11 8 Books in Home Provides an indicator of the cultural capital of the homeenvironment.
11 12 12 9 Possessions in theHome List
Provides information to create an indicator of socio-economicstatus.
– – – 10 Residence WhileAttending School
Identifies the type of living situation students have whileattending school.
– – – 12 Others' Ideas forStudent's Future
Describes students’ perceptions of what parents, teachers, andpeers think student should do upon completion of school.
12 13 13 13 Mother's Values Provides an indicator of the home environment and generalacademic press.
– 14 14 – Students' Behaviorin Math Class
Provides a description of typical student behavior during mathlessons.
13 15 15 13 Peers’ Values Provides a description of peers’ values and student’s socialenvironment.
14 16 16 13 Student’s Values Provides a description of student’s values.
– – – 14 Student's FutureEducation Plans
Identifies what plans student has for further education.

Chapter 5
5-20
Table 5.5 Contents of the Student Questionnaires for Populations 1, 2, and 3(continued)
Question Number
POPULATION Item Content Item Purpose
1 2 2(s)
3
15 17 17 22 Competence inMath/ Sciences
Provides an indication of students’ self-description of theiracademic competence in mathematics and the sciences.
16 18 18 17 Report on StudentBehaviors
Provides an indication of the existence of specific problematicstudent behaviors at school from the student's perspective.
17 19 19 20 Doing Well inMath
Identifies students’ attributions for doing well in mathematics.
18 20 20 21 Doing Well inScience
Identifies students’ attributions for doing well in the sciences
19 21 21 19 Liking Math/Sciences
Identifies how much students like specific subjects; a keycomponent of student motivation.
20 22 22 – Liking ofComputers
Identifies how well students like working with computers, a keyindicator of technology familiarity.
21 23 23 18 Interest,Importance, &Value ofMathematics
Provides a description of students’ interest, importance rating, andvalue afforded mathematics.
– 24 24 – Reasons to DoWell in Math
Provides the extent to which students endorse certain reasons theyneed to do well in mathematics.
– – – 23 Technology Use Identifies the type and frequency of student's technology use.
– – – 24 Student'sAcademicProgram/ Track
Identifies the educational program or track in which student isenrolled .
– – – 25 Most AdvancedMath
Identifies the most advanced math course student has taken.
– – – 26 Most AdvancedPhysics
Identifies the most advanced physics course student has taken.
– – – 27 Most AdvancedChemistry
Identifies the most advanced chemistry course student has taken.
– – – 28 Most AdvancedBiology
Identifies the most advanced biology course student has taken.
– – – 29 Most AdvancedEarth Science
Identifies the most advanced earth science course student hastaken.
– – – 30 Math Enrollment Identifies which math course(s) student currently take.
22 25 25 31 ClassroomPractices: Math
Provides a description of students’ perceptions of classroompractices in mathematics instruction.
– 26 26 – Beginning a NewMath Topic
Describes the frequency with which specific strategies are used inthe classroom to introduce a new mathematics topic.

Chapter 5
5-21
Table 5.5 Contents of the Student Questionnaires for Populations 1, 2, and 3(continued)
Question Number
POPULATION Item Content Item Purpose
1 2 2(s)
3
– 27 27 – EnvironmentalIssues
Provides an indication of students’ concern and involvement inenvironmental issues.
– – 28 34,35
SciencesEnrollment
Identifies which science course(s) students are currently taking.
21 28 29,33,37,41
– Interest,Importance, &Value of theSciences
Provides a description of students’ interest, importance rating, andvalue afforded mathematics.
– 29 30,34,38,42
– Reasons to DoWell in theSciences
Provides the extent to which students endorse certain reasons theyneed to do well in the sciences.
– 30 – – Science Use in aCareer
Identifies preferences for sciences in careers.
23 31 31,35,39,43
– ClassroomPractices: Sciences
Provides a description of students’ perceptions of classroompractices in science instruction.
– 32 32,36,40,44
– Beginning a NewTopic
Describes the frequency with which specific strategies are used inthe classroom to introduce a new topic in the sciences.
– – – 32 Math Textbook Identifies the textbook used by students in their math course.
– – – 33 Math Homework Identifies the frequency with which homework is assigned instudents' math course.
– – – 36 ClassroomPractices: Physicsor Other Science
Provides a description of students’ perceptions of classroominstructional practices.
– – – 37 Physics/ OtherScience Textbook
Identifies the textbook used by students in their physics or otherscience course.
– – – 38 Physics/ OtherScience Homework
Identifies the frequency with which homework is assigned instudents' physics or other science course.
OPTIONAL ITEMS
24,25
33,34
45,46
– Cultural Activities Provides a description of student’s involvement in cultural eventsor programming such as plays and concerts.
– – – 39,40
Academic ProgramProfile
Indicates whether students are repeating the current grade or ifthey have already completed any other educational program atschool.
Chapter 5
5-22
REFERENCES
Doyle, W. (1986). Classroom Organization and Management in M.C. Wittrock (ed.),Handbook of Research on Teaching (pp. 392-431). New York: Macmillan.
Lockhead, M. (1987). School and Classroom Effects on Student Learning Gain. Paperpresented at the annual meeting of the American Educational Research Association,Washington, D.C.
Peterson, P.L. (1990). Doing More in the Same Amount of Time: Cathy Swift. EducationalEvaluation and Policy Analysis, 12, 261-280.
Porter, A. C. (1991). Creating a System of School Process Indicators. EducationalEvaluation and Policy Analysis, 13, 13-29.
Prawat, R. S. (1989a). Promoting Access to Knowledge, Strategy, and Disposition inStudents: A Research Synthesis. Review of Educational Research, 59, 1-41.
Prawat, R. S. (1989b). Teaching for Understanding: Three Key Attributes. Teaching andTeacher Education, 5, 315-328.
Putnam, R. T. (1992). Teaching the "Hows" of Mathematics for Everyday Life: A CaseStudy of a Fifth-grade Teacher. The Elementary School Journal, 93, 145-152.
Thompson, A. G. (1992). Teachers' Beliefs and Conceptions: A Synthesis of the Research.in D. A. Grouws (ed.), Handbook of Research on Mathematics Teaching and Learning (pp.127-146). New York: Macmillan.