5 data for resource assessment - department of … · 5 data for resource assessment ... an...
TRANSCRIPT

Resource Assessment Framework 45
5 DATA FOR RESOURCE ASSESSMENT
5.1 Continuous or Project-Based Data
There are two general methods in which data are collected for resource assessment: continuous or project-based. Continuous data are repeatedly collected from a source or sources. The expression “monitoring” is frequently used to describe this type of activity. In contrast, project-based data are obtained for a particular research project and collected to test particular scientific hypotheses.
Within resource assessment, continuous data collection methods (for catch, effort, ages and lengths) are frequently used because continuous data contain information about the dynamics18 of a fish population. Dynamic relationships are the basis of assessment models that are required to make quantitative forecasts of managerial decisions.
Performance reporting commitments within the FMS are annual. Although there is no stated obligation that the data that are used to compile the reports would be updated every year, there would need to be some system in place that collected up-to-date information for the reports of managerial performance. The continuous data collection programs currently underway (relevant to resource assessment) in the NSW Department of Primary Industries are: the catch-effort reporting system; fishery-independent surveys for abalone; an observer and recruitment index project for rock lobster; the gamefish tournament monitoring program; and, some monitoring of the age and length structure of commercial landings.
Project-based data have been collected for particular projects. Once that project is finished and written up, no more data are collected, though the methods are well documented enabling replication of that sampling design. Individual projects can yield information very valuable to resource assessment, particularly biological information such as growth, maturity and vulnerability. Creel surveys are another example of a project that provides a snapshot of recreational harvesting. Project based data are, however, often compromised in their utility within stock assessment because there are no time-series of observations that enable the longer-term dynamics of populations to be measured.
Budgetary experience will make public administrators wary of continuous data-collection projects that can develop an expensive life of their own. In contrast, project-based data have clear endpoints and outcomes. Resource assessment requires both types of data.
Many of the following types of data for resource assessment could be considered project-based when they are initially planned and researched, but they would become continuous if they were to remain operational in the long term (beyond 5-10 years). The challenge for the NSW Department of Primary Industries is to decide which types of data should be collected continuously and which should be the subject of further research and evaluation.
5.2 The Cost of Data
Dollar costs will be the fundamental constraint on data collection (and the entire assessment process in general) because money is the easiest thing to measure and control. The other fundamental constraint is time. For the FMS to “work”, assessments must be completed within a timeframe appropriate for performance reporting. Although it is easy to argue that other components of this system, such as data being fully representative, should be given priority over time and money, this is not likely to be the reality, at least in the short term. The approach suggested here is to identify what can be done with the time and resources available and then continuously improve the representativeness of data over time. If, however, the data collection is so
18 A dynamic relationship describes the change of system state with time.
NSW DPI - Fish. Res. Assess. Ser. 15

46 Resource Assessment Framework
compromised by time and cost constraints that the data are essentially worthless, then alternative methods for managing and assessing these systems will need to be considered.
When costing out the collection of data a “life-cycle” approach should be used where the costs include defining/refining sampling protocols, collecting information, data entry/checking and archival costs. The expenditure on data collection and analysis must be consistent with economic principles within ecological sustainability: all users of the resource could be expected to contribute to the costs of monitoring and assessment.
It will be impossible to define a “perfect” data-collection strategy for this assessment strategy from the outset, there are simply too many unknowns. Qualitative cost-benefit analyses of various types of information can be completed quickly (such as table of pros and cons), but full quantitative analyses would be complex and time-consuming. It is beyond the scope of this document to provide accurate cost estimates of various data collection programs for resource assessment, but a general sense of the relative costs of various sources will be indicated. A representation of the approximate cost and value for resource assessment is presented in Figure 5. The exact nature of any particular project and species will, of course, determine the cost and likely benefits for resource assessment. Justifications of the approximate positions of data-sources within this plot are given below.
Value WithinResource Assessment
Rel
ativ
e Co
st
Low High
Low
High
Catch DataEffort Data
Observer Data(survey-based)
Observer Data(risk-based)
Samplingat Ports
Fishery IndependentSurveysTagging
Programs
CreelSurveys
LogbookPrograms
TournamentMonitoring
Value WithinResource Assessment
Rel
ativ
e Co
st
Low High
Low
High
Catch DataEffort Data
Observer Data(survey-based)
Observer Data(risk-based)
Samplingat Ports
Fishery IndependentSurveysTagging
Programs
CreelSurveys
LogbookPrograms
TournamentMonitoring
Figure 5. A representation of the relative costs and value of various sources of data for resource assessment in NSW. These sources of data are discussed in more detail in the text. Many of these sources of data will have values beyond resource assessment that justify their collection. The relative location of any type of data-source on this plot will depend upon the life-history of the species and the scope of the project that collected that information.
5.3 Role of “Basic Biological” Information in Resource Assessment
Basic biological information such as information on growth, maturity, selectivity, movement and mortality is valuable and sometimes crucial when applying input controls such as minimum legal lengths, closed seasons and closed areas. That said, these controls are always somewhat “blunt” and the marginal value of more detailed information may be small.
NSW DPI - Fish. Res. Assess. Ser. 15

Resource Assessment Framework 47
Understanding growth, maturity, selectivity, movement and mortality will also improve our interpretation of indicators. For example, understanding variability of length at age improves our interpretation of length data. Knowledge of length and, to a lesser extent, age at maturity is a critical factor in specifying a minimum legal length. Understanding the growth of individuals is crucial when estimating mortality rates from length data.
Any system to prioritise species for stock assessment needs to consider the basic life history of the animal. Low growth rate species must be given higher assessment priority than high growth rate species of similar commercial/recreational value, as they are simply higher managerial risk. Such comments are supported by the risk assessments being undertaken in the EIS.
There will be some species in NSW where there is insufficient biological information to make such judgments in regard to growth, maturity and mortality. These species have or will be identified and given a high priority for such studies. Obtaining such information is relatively inexpensive.
5.4 Sources of Data for Resource Assessment
5.4.1 Commercial Catch and Effort Data
Use of fishery-dependent CPUE data could not be described as international best-practice in higher valued fisheries but would probably be considered acceptable for the lower valued stocks that occur in NSW. There are examples of fisheries that have been well managed with fishery-dependent CPUE data and others that have been badly managed with expensive survey data. An understanding of the behaviour of the fish and the fleet can dramatically improve our ability to understand the relative value and usefulness of CPUE data.
Records of commercial landings from LCatch/ComCatch exist for many species but these records do not account for: pre-1984 data; recreational harvesting; discard mortality; or illegal harvesting. There exists within the NSW Department of Primary Industries enough expertise to identify the strengths and weaknesses of this database quite quickly. Pre-1984 data is available in other databases for some species (but not generally at the level of individual fisher activity) and relevant catch-effort information is held by Commonwealth agencies (e.g. AFZIS).
As assessment priorities are determined, there will need to be an identification of a credible time-series of effort from 1984-199719 (e.g. mesh netting in the EG fishery) or an acknowledgement that such a time-series is not useful. Similar steps will have to be taken for the post 1997 data, but this should be more straightforward as there was more satisfactory recording of effort data. This latter window will have to be the baseline for many species. If adding effort information degrades the robustness of the indicator of abundance (from the default of using landings data alone) then it will not be used. This degradation will occur if there are systematic biases in the effort data.
The catch records database is currently subject to a significant time lag (~6-12 months). Consideration needs to be given to developing mechanisms to update this database more rapidly including the timely arrival of records from fishers. Catch records were an integral part of the value of the property right in these fisheries. Measures should be imposed if individual fishers do not take their responsibility in maintaining accurate records of landings seriously20.
It is far more practical to check upon the quality of the catch data than the effort data. The Fish Receiver’s program (ss 117-120) could be used to validate that the total local purchases of a Receiver corroborate with the landings reported by fishers. Efficiencies in the recording of catch data could be found by developing automated systems for recording catch data. Such systems are presently being investigated in the Clarence River Fisherman’s Co-operative. 19 Restricted fisheries started on the 1-Jul-1997. Substantial and important revisions to catch and effort forms were undertaken at this time. These revisions significantly improved the interpretability of effort data. 20 Section 122 of the FMA (Commercial fishers to furnish records to Director) provides for this.
NSW DPI - Fish. Res. Assess. Ser. 15

48 Resource Assessment Framework
Changes to the commercial catch and effort record system need to be considered seriously but undertaken cautiously. There are some fundamental issues about commercial catch and effort data that will always constrain the application of these data and it is critical to understand the different source and roles played by catch and CPUE (the index of abundance) data. The costs and benefits of alternative mechanisms to record and/or validate total commercial landings need to be investigated. Alternative methods to obtain an index of abundance were summarised in Table 3 and all of these methods need robust debate in due course. An appropriate framework for comparing these sources of data is cost-benefit analysis.
Commercial catch data are essential and valuable for the NSW Department of Primary Industries and commercial fishers. The value of these data must be recognized and appropriate investments made. A census of commercial fishing effort is less valuable and a sample of higher quality effort information would be beneficial. Indicators of abundance must be specified for the primary/target species and should be specified for key-secondary species where possible. In the short-term, this will inevitably be done with commercial CPUE data. The data collection program for commercial catch and effort data should continue in the present, or an improved, form. Without this historical catch and effort data, any type of statewide resource assessment in NSW would be seriously compromised. The cost of this program is extremely small compared to the benefit.
5.4.2 Monitoring of Commercial Landings at Ports
Collecting information on the length and age structure of commercial landings is a cost effective method of monitoring the structure of harvested stocks. Such methods may have technical disadvantages over independent surveys of the fish population, but can be undertaken at a fraction of the cost. These data are an important low-cost complement to the use of commercial CPUE as an index of abundance. Issues such as grading of sizes and direct sales to retailers must be considered in the design and execution of sampling programs.
Information from Sydney Fish Markets will be logistically simpler to obtain and the sampling protocols are well documented and repeatable. Information from regional co-ops could be logistically more expensive to obtain but should better represent regional stocks. Documented and repeatable sampling protocols also need to prepared and used, particularly when non-departmental staff are involved. Approximate costs of a program to monitor the lengths and ages of the catch of primary/target and key secondary species across NSW (at ports) would be in the order of hundreds of thousands of dollars per year. This is inexpensive in comparison to any alternative method to measure the structure of commercially exploited stocks.
The structure of a port-sampling program should be based upon a consideration of the risk of the current management strategy and the currency of existing data. A system based upon multi-criterion decision analysis has been proposed (see “Proposed Prioritisation System”, page 20) which would provide guidance into the long-term structure of such a sampling program.
5.4.3 Commercial Logbook Programs
There are various types of logbook programs, but the general concept is that all or some commercial fishers within a fishery keep more detailed records of their fishing activity. Ideally, these fishers would have superior skills in species identification and record keeping. This information, which is more reliable than that provided on the standard catch and effort returns, could be used as a sample, rather than a census of commercial fishing activity. The most common application of a logbook program would be to provide superior records of commercial CPUE. All fishers within a fishery could, of course, be involved in such a program. Pease and Walford included a summary of a logbook program for the Estuary General Fishery in Gray et al. (2000).
The most difficult aspect of logbook programs is that they are, from the perspective of the NSW Department of Primary Industries, very labour intensive. Staff will need to be in constant
NSW DPI - Fish. Res. Assess. Ser. 15

Resource Assessment Framework 49
communication with fishers to resolve any issues within the program. This in itself is not a bad thing, but it could be expensive and frustrating. Equity issues could constrain any regulatory enforcement of logbook programs and some type of contractual arrangement may have to be considered if all participants within a fishery do not use logbooks. Some of the benefits of a logbook program for resource assessment may only be realised after several years.
5.4.4 Observer Programs
These programs are not completely within the scope of the “assessment strategy” as such but there are important issues of overlap. Observer programs have roles that are far broader than those described here; particularly with issues associated bycatch, discarding and threatened species.
It is unlikely that data from this program could, or should, be used as an index of abundance or recruitment because these outcomes are not usually within the goals of an observer program. Rather, the opportunity to collect more extensive and detailed samples of the catch will provide the following opportunities (in order of importance):
• Estimation of non-landed catch of primary/target and key-secondary/byproduct species. This is an important source of fishing mortality that should be included in resource assessments.
• Estimates of discards, or species caught but not landed.
• Information to help quantify the landings of difficult-to-identify species complexes (such as octopus or sharks) and provide relevant biological data for these species.
• Analysis of multi-species or population structure changes due to season, gear and location.
• Measurement of the effects of changes to fishing gear or other regulations.
• Collection of sub-legal fish for growth and maturity studies.
The type of information from the observer program is, in some respects, similar to the type of information that will be collected from fishery independent surveys. The important difference is that observer data aim to be representative of the catch (including bycatches) of the fishery, whilst independent surveys aim to be representative of the underlying fish population.
There are two alternative approaches to designing an observer program: a survey approach or a risk-based approach. A survey approach would apply a systematic sampling design across fisheries and methods each year. Data from such a program would be extremely valuable to resource assessment and could, if adequately funded, replace sampling of catches at ports. Such a program would also be required for ongoing monitoring of bycatches. Preliminary estimates of the cost of such a program across all fisheries in NSW is in the millions of dollars per year.
An alternative approach is risk-based prioritisation. This approach would only observe fisheries and methods where bycatches were either known or likely to be a significant problem or that existing data were out-of-date (see “Proposed Prioritisation System”, page 20). The costs of this approach will be much lower but could not replace port sampling of catches and would not offer insight into population processes.
5.4.5 Fishery Independent Surveys
Fishery independent surveys are designed to sample the underlying fish population rather than commercial or recreational fishing activity. The representativeness of such samples will depend upon many factors including: replication and stratification; spatial and temporal variation of fish populations; and the efficiency of the sampling gear. Saturation of fishing gear with increasing effort can bias the results of surveys. Data from such surveys should be less biased than data from fisher-dependent sources, but might not be that precise, particularly if few samples can be afforded.
NSW DPI - Fish. Res. Assess. Ser. 15

50 Resource Assessment Framework
The ecological sustainability of fishery independent surveys for commercial and recreational fisheries management is a complex and fascinating issue but is beyond the scope of this document.
The NSW Department of Primary Industries has a project (partly funded by FRDC) that will study fishery independent sampling in estuaries; this project will provide sufficient information to design a (continuous or operational) sampling program for estuaries in NSW. During this project, resources will be allocated to estimate the power of a design to detect changes to stock status. This is a complex problem because the sampling regime will have varying power depending upon life history of species being sampled. This project should also take the opportunity to consider multi-species, biodiversity and ecosystem issues. Data from gear with wide selectivity could be very valuable for “ecosystem” indicators. Another potential outcome of this approach is to use information about sub-legal fish as an indicator of recruitment. Fishery independent surveys also have the potential to use non-destructive sampling methods such as hydro-acoustic signals to measure the distribution, abundance and size-structure of live, undisturbed fish populations.
The EPT FMS states that fishery independent surveys will be used as the core data collection method for stock assessment (EPT at 49) “.. stock assessments for the Estuary Prawn Trawl Fishery will be based upon fishery independent methods involving stratified randomised surveys of relative abundances and size and age structures of wild populations. Such data will provide more robust and rigorous assessments of natural populations than that solely relying on data from the fishery.”. Similar suggestions were not made for the EG or OH fishery.
Determining the robustness of an indicator derived from a fishery-independent survey will be a complex analysis. If an indicator is unbiased but highly variable (because of the bias-variance tradeoff) then it may have less power to detect significant system change than an indicator that is biased but quite precise. The analysis completed by Scandol (submitted) considered some of these issues but, in general, it should not simply be assumed that unbiased indicators are always superior for monitoring. The most important advantage of independent surveys is that any biases present should stay constant with time. When these statistical issues are combined with cost-benefit arguments, independent surveys may most easily be justified in areas where commercial fishing is not feasible. Such areas include Recreational Fishing Havens or marine parks. A complete costing of fishery-independent surveys for all marine waters under NSW jurisdiction has not been completed, but it would likely cost in the order of several millions of dollars per year.
5.4.6 National/Statewide Telephone Surveys of Recreational Fishing
The recently released report on the National Recreational and Indigenous Fishing Survey (Henry and Lyle, 2003) has provided the best estimates to date of the magnitude and distribution of recreational fishing in NSW. The aims of this survey were to: obtain estimates of the level of participation, fishing effort and catch by recreational fishers; obtain information on the economic activity associated with fishing and the attitude of recreational fishers to prominent fisheries issues.
The cost-effectiveness of such a survey design for the ongoing monitoring of recreational fishing in NSW requires additional deliberation. Not all aspects of the survey have been interpreted with the same degree of credibility. In particular, estimates of magnitude and distribution of recreational effort have been far less controversial than estimates of recreational catch and economic value. The sparse spatial sampling required for the national survey has also resulted in limited resolution of recreational catch and effort estimates at the smaller spatial scales frequently used in management.
Recreational fishing is, however, a significant source of mortality of many species in NSW. Estimation of this mortality should be undertaken with a commitment that reflects the socio-economic value of recreational fishing in NSW. Credible estimates of total recreational catch are required for any biomass estimate of stocks.
NSW DPI - Fish. Res. Assess. Ser. 15

Resource Assessment Framework 51
5.4.7 Creel Surveys
Creel surveys have been used to estimate recreational catches in NSW (West and Gordon 1994; Steffe et al. 1996; Steffe and Chapman 2003). Creel surveys involve one-to-one interviews with anglers about their catches and the effort applied. Data collected within these surveys are usually of very high quality because trained staff complete interviews and assess the catch. The labour-intensive nature of creel surveys results in such studies being relatively expensive which will usually result in limited replication in space and time.
Creel surveys are currently being used to assess the Recreational Fishing Havens in Lake Macquarie and Tuross Lake (that were declared in 2002). This will be done by undertaking creel surveys of anglers in each of these two havens during 2003/04 and comparing the data with similar creel surveys completed in 1999/2000 (before the declaration of Havens). Thus a comprehensive before versus after comparison will be completed. Data collected will include changes in the number of anglers, their catch, catch rate and the size/species composition of their catch.
5.4.8 Charter Boat Logbooks
There is a statutory requirement for the master of a licenced charter fishing boat to keep records of catch and provide this information to the NSW Department of Primary Industries (s127E of the FMA). These data will form a valuable source of information for resource assessment and should be managed with similar standards and protocols as the commercial catch and effort data.
The future structure of the charter boat logbook program is under discussion within the FMS planning process, but it is widely acknowledged that these records are a valuable source of information for resource assessment. Data could readily be used to define an index of abundance for recreationally targeted species that is independent of commercial catch records.
5.4.9 Gamefish Tournament Monitoring Data
The gamefish tournament-monitoring program is designed to obtain data on catch, effort, catch per unit effort, and the species/size composition of catches (many species are tagged and then released) from the club component of the east coast recreational gamefish fishery. This fishery is a multi-species, multi-gear fishery that targets billfish, tuna, sharks and other gamefish in coastal waters off NSW, Victoria and Queensland (Lowry and Murphy 2003).
These data are valuable because commercial fishers do not target all of the species of shark subject to gamefishing (e.g. tiger sharks), and black, blue and striped marlin are protected from commercial fishing under s 20(1) of the FMA. The gamefish tournament-monitoring program provides an independent source of information and index of abundance on many species where commercial data are scarce. The Commonwealth “Eastern Tuna and Billfish Fishery” manages commercial harvesting of tuna and swordfish. In general, responsibility for the assessment of these species lies with the Australian Fisheries Management Authority.
5.4.10 Tournament Data from Anglers (Freshwater and Saltwater)
The Anglers Catch Research Program21 (ACRP) monitors numerous freshwater fishing events throughout NSW. Freshwater tournaments covered are being refined to those that are regarded as important and cover the diversity of fishing methods, eastern and western drainage systems, the latitudinal spread of river catchment systems and riverine habitats. Anglers contribute directly to the program by reporting their fishing effort, catch by species and size of all fish caught. The existing database contains records from 1993. These data are collected for stock assessment of
21 Based upon text and information provided by Tim Park (Scientific Officer - Angling Research)
NSW DPI - Fish. Res. Assess. Ser. 15

52 Resource Assessment Framework
recreationally important freshwater species and to elucidate the effects of fisheries management on freshwater angling. The success of freshwater ACRP aroused interest from marine angling groups and a pilot program was initiated in 2001 to determine the feasibility of data collection at marine tournaments. The Saltwater Anglers Catch Research Program was initiated in October. As with the freshwater ACRP, anglers provide effort, catch and size data directly for the purposes of measuring the quality of angling. These data will contribute to stock assessment of targeted species as well as providing a measure for the success of saltwater fisheries management initiatives. The saltwater program also has collected spearfishing tournament data and is also involved with the development of the gamefish tournament-monitoring database.
5.4.11 Fish Tagging Programs
There have been a number of fish tagging programs undertaken in NSW (Gillanders et al. 2001) and there is an ongoing gamefish tagging program. Fish tagging programs have the potential to enable estimates of growth (Laslett et al. 2002), movement (Hilborn 1990), mortality (Xiao et al. 1999) and abundance (Seber 1982). Valuable tuna fisheries have adopted the use of tagging programs to enhance their stock assessments, particularly to improve estimates of fishing mortality (Adam et al. 2003). Using tags to obtain estimates of population parameters is much more difficult than obtaining estimates of individual growth or migration (usually because of limits in effort data).
Hilborn and Walters (1992 at 164) noted the following important aspect of tagging programs:
“Most fish tagging programs concentrate most of their resources on tagging large numbers of fish, and tend to neglect the tag recovery end of the project; putting tags on fish is fun and somewhat glamorous, whereas groveling around on docks, trying to determine if fishermen are missing tags, or throwing them away, is dirty undesirable work.”
That said, there is recent (Martell and Walters, in press) recognition that tagging programs can provide timely estimates of fishing mortality (or harvest rate) and be an excellent method to measure and control fisheries. Direct estimates of fishing mortality avoid the issues associated with improving fleet efficiency (catchability). Fishing mortality is the primary indicator of interest in fisheries management.
There are ample opportunities to extend the application of tagging methods to improve stock assessments in NSW, but these programs will be time consuming and expensive. The objectives of any tagging program should be carefully evaluated before the fun of tagging begins (Gillanders et al. 2001). A tagging program that could make a significant contribution to the assessment of marine resources in NSW is likely to cost at least one million dollars to initiate and hundreds of thousands of dollars per year to run.
5.4.12 Notes on Age and Length Data
The importance of age and length datasets for resource assessment cannot be understated. Age composition data provides a unique demographic snapshot of a population and, based upon the relative strength of younger age-classes, is capable of predicting future exploitable biomass. The age-distribution of catch can be used to measure total mortality and thus used to estimate fishing mortality. Fishing mortality can be converted to the harvest rate that, in conjunction with an estimate of total catch, can be used to estimate the biomass of a stock. Furthermore, indicators such as maximum age provide a metric of the suitability of a species for commercial and recreational harvesting.
Length-composition data can be used for similar purposes as age-composition data but because of the highly variable and asymptotic relationship between age and length, the demographic
NSW DPI - Fish. Res. Assess. Ser. 15

Resource Assessment Framework 53
information content within length-composition data is compromised. Large numbers of fish-age estimates from the catch (or independent surveys) will always be considered international best practice within the assessment and management of higher valued fish stocks.
That said, for many/most of the species harvested in NSW there may not be the need for a superior demographic indicator, but simply an indicator that can detect substantial changes to population structure. For this latter purpose, length-based information may be sufficient and will certainty form the basis of a superior stock status indicator in comparison to a questionable indicator of abundance. It is notable that many invertebrate fisheries are equally as well assessed and managed on the basis of length-data as finfish are on age-data.
In terms of cost-benefit, lengths are at least 6× cheaper to collect than ages, and initial studies (Scandol 2002b) indicate that they are certainly not 6× inferior for detecting changes to the stock. Pragmatic issues such as costs are likely to dominate the sampling decisions for most species. Interpretation of length data will be dramatically improved if augmented with good quality length-age relationships (including information from sub-legal fish). If resources were constrained, otoliths could be archived and only processed if additional evidence of a trend was required.
NSW DPI - Fish. Res. Assess. Ser. 15

54 Resource Assessment Framework
6 REPORTING
6.1 Review of Resource Assessment Reporting in Other Jurisdictions
This section aims to give a brief overview of the reporting approaches to resource assessment undertaken by other Australian and New Zealand jurisdictions. As expected there are a variety of assessment methods and reporting mechanisms in use. Other jurisdictions in Australia publish similar documents to the NSW Status of Fisheries Resources reports, whilst others simply publish stock assessments of particular species or fisheries. The structure of recent and publicly available assessment or status reports are summarised below. Changes to the management of many fisheries to meet the provisions for export approval under the EPBC Act will likely change the nature of stock status reporting in all Australian jurisdictions over the next few years.
6.1.1 Commonwealth
The Bureau of Rural Sciences (BRS), within the Department of Agriculture, Fisheries and Forestry, compiles assessments of Commonwealth fisheries. These Commonwealth Fishery Status Reports (Caton 2002) summarise status of the Commonwealth managed fisheries and classify the status of fisheries as under-fished, fully-fished, over-fished or uncertain. There is also extended discussion of the target and limit reference points that are used to classify stock status. The resource status of each species or species group is classified and indicators of stock status are also summarised (for example catch per unit of effort). For all but the smallest Commonwealth fisheries, the value of fishery landings is in the millions of dollars (though many individual species have landings of much lower value). A range of methods are used to assess the stocks from simple interpretations of CPUE to complex synthetic stock assessment modelling completed by the BRS and CSIRO.
6.1.2 Western Australia
Fisheries Western Australia publishes an annual Status of the Fisheries Report (Penn 2003). Similarly to the Commonwealth document, this report presents the status of fisheries using a range of indicators and methods. Stock assessments are summarised (if completed) and the stock status given as over-exploited, fully-exploited, under-exploited or not available. In multi-species fisheries there is a mixed range of approaches for reporting upon the status of individual species. Assessment methods range from advanced biomass estimation methods for the more valuable stocks to simple catch and effort charts for the low value stocks. WA Status Reports also include a summary of bycatch, habitat, social and economic issues.
6.1.3 Queensland
The Queensland Department of Primary Industries does not publish annual status reports and has a less frequent reporting cycle. The last report, entitled “Queensland’s Fisheries Resources: Current Condition and Recent Trends 1988-2000” (Williams 2002), presents the data available for the targeted species. Most of this information is commercial catch and effort information from the compulsory log-book program. There are no formal summary judgments about stock status (over-fished etc.) and trends in stock status are usually implied from catch rates. There is some discussion in the Introduction about CFISH, the database system used to manage the information from the commercial log-book program. A recreational monitoring program RFISH is used to estimate patterns of recreational catch.
NSW DPI - Fish. Res. Assess. Ser. 15

Resource Assessment Framework 55
6.1.4 Northern Territory
The NT Department of Business, Industry and Resource Development published the NT Strategic Plan for Fisheries Research and Development 2002-2006 (Anon 1999). This document examines the outcomes of the Territory’s fisheries management and identifies specific Research and Development outputs to achieve these outcomes. The outcome of “sustainable harvesting” is associated with projects monitoring populations using catch and effort data, size structure (e.g. mud crabs), depletion estimates and tagging programs (e.g. barramundi and Spanish mackerel). Summaries of the major fisheries, including the status and reliability of the stock assessments are also published on the NTBIRD website (www.nt.gov.au/dbird/dpif). These 3-5 page brochures provide an excellent summary of the status of each fishery and would be an appropriate model for the NSW Department of Primary Industries. The NTBIRD also produces status reports that are similar to those prepared by WA and NSW.
6.1.5 South Australia
Primary Industries and Resources SA (PIRSA) sub-contracts resource assessment to SARDI (South Australian Research and Development Institute). Detailed stock assessments have been completed for the States’ valuable fisheries including abalone, rock lobster, King George whiting, pilchards and sardines. For example, for rock lobster (Prescott and Xiao 2001), these assessments are extensive analyses of stock status with an examination of standardized catch rates, mean weight, pre-recruitment abundance, exploitation rate and egg production. Assessments are available from the SARDI web site (www.sardi.sa.gov.au) for abalone (Rodda et al. 2000) and pilchards (Ward et al. 2001).
6.1.6 Tasmania
The Tasmanian Department of Primary Industries, Water and Environment (TDPIWE) contracts the Tasmanian Aquaculture and Fisheries Institute (TAFI) to complete Fishery Assessment Reports. These assessments are detailed and extensive reports for valuable stocks such as rock lobster (Gardner et al. 2001) and abalone (Tarbath et al. 2001). These assessments usually attempted to estimate biomasses of the stock using model-based methods. Less valuable giant crab (Gardner and Mackinnon 2002) and scalefish stocks (Lyle and Hodgson 2002) are assessed with catch and effort data and no biomass estimates are provided. Trigger points (limit reference points) for these stocks are specified as departures from historical catch data, effort data or trends in catch rates. Other general indicators, such as changes to age/length composition and “fish stock stress” are also used. An assessment report on recreational harvesting was also completed (Smith and Heran 2001).
6.1.7 Victoria
The Marine and Freshwater Resources Institute (MAFRI) undertakes stock assessments for the Victorian Department of Primary Industries (VDPI). Detailed annual assessments are undertaken for the abalone and rock lobster fisheries and these assessments are used within processes for setting the total allowable commercial catch in these quota-managed fisheries. Other coastal fisheries are assessed on a less-frequent basis of 3-8 years. Age and length data from commercial catches are monitored for the more valuable species such as snapper, black bream and King George whiting. Summaries of these assessments are available on the VDPI website (www.dpi.vic.gov.au). Effort is currently being directed at developing an index of recruitment for a range of commercially and recreationally valuable species22.
22 This summary was based upon a conversation with Dr Sandy Morison of MAFRI.
NSW DPI - Fish. Res. Assess. Ser. 15

56 Resource Assessment Framework
6.1.8 New Zealand
Summaries of stock assessment from New Zealand (NZ) fisheries were published in Annala et al. (2001). This compiled report follows the Fishery Assessment Plenary that presents the summaries of the Fishery Assessment Working Groups. NZ uses assessment methods that are, where possible, based upon the biological reference points MCY (maximum constant yield) and CAY (current annual yield). Various methods for estimating these reference points are provided depending upon the type of fishery being assessed and the type and quality of information available. Given the commitment that NZ has made to quota management systems it is not surprising that most of the assessments are focused upon methods to recommend an appropriate total allowable commercial catch for each fishery.
6.2 Outline of approaches used in the NSW Department of Primary Industries
Output controlled share-managed fisheries (abalone and rock lobster) require the preparation of an annual assessment report on the state of the stock. The draft version of this report is then given to the TAC Committee for consideration. Other stock assessments were reported upon in the NSW Fisheries Status of Fisheries Resources series, FRDC Reports, the NSW Fisheries Resource Assessment Series or journal articles23.
Assessments of other NSW stocks have been completed including: snapper (Ferrell and Sumpton 1997); yellowtail kingfish (Stewart et al. 2001); silver trevally (Rowling and Raines 2000); estuary finfish (Gray et al. 2000); sea mullet (Virgona et al. 1998; Smith and Deguara 2002); spanner crabs (Kennelly and Scandol 1999; Kennelly and Scandol 2002) and gemfish (Rowling 1987; Rowling 1990; Rowling 1997; Rowling and Makin 2001)24. Most of these publications presented analyses of the age-structure and length-structure of these stocks (from samples of the commercial fishery) along with plots of catch rates derived from appropriate sources. There is no lack of technical sophistication in any of these assessments but the emphasis was upon graphical and statistical analysis not model-based estimation of biomass or fishing mortality. Scandol and Forrest (2001b) completed some more technical calculations using the data within Gray et al. (2000) but did not calculate biomass estimates because of limitations of the data.
The Status of Fisheries Resources reports (Fletcher and Keech 1998; Fletcher and McVea 2000; Kennelly and McVea 2001) have provided a fishery-based (and sometimes species-based) assessment of fisheries resources in NSW. The species-based assessments are simple summaries of a few pages that provide the most recently available catch and effort data. Age and length structures of the exploitable stock are sometimes provided if the data are available. Recent editions of the Status of Fisheries Resources reports also included brief comments on bycatch issues. Many byproduct species were not reported upon in these documents.
The current resource assessment program undertaken by the NSW Department of Primary Industries is uneven. Abalone and rock lobster have substantial resources and expertise directed at stock assessment, for example Chen and Montgomery (1999); Worthington et al. (1998); Liggins et al. (2000). This is a consequence of the relative value of these fisheries, and therefore the resources for research and assessment available and the expectations of the TAC Committee. There is also a regulatory provision for a (model-based) stock assessment within the share management plans of these species (Anon 2000c; Anon 2000a).
There are consultative and review processes applied to the stock assessment of abalone and lobster stocks via the TAC Committee and the MAC. Other stock assessment reports are reviewed internally unless they are submitted to a peer-reviewed journal.
23 The nomenclature of these publications will change when NSW Fisheries becomes fully merged within the NSW Department of Primary Industries. 24 This summary is not an exhaustive review of all assessments conducted by NSW Fisheries.
NSW DPI - Fish. Res. Assess. Ser. 15

Resource Assessment Framework 57
6.3 Electronic Reporting Systems
6.3.1 Background
Since the development of the World Wide Web there has been a revolution in reporting and publishing. All major media channels, including scientific journals, have augmented print publications with electronic mechanisms for archival, searching and delivery. The reasons for this shift are clear: greater accessibility; lower cost; and, shorter delays to the delivery of content. At first (10 years ago) most web sites were static, i.e, the content was hard coded into HTML (hyper-text markup language) and then rendered to web browsers. It did not take long for computer scientists and software companies to define and implement systems that delivered dynamic content to web browsers. At present, most significant web sites are not displaying static web pages, but the results of instructions that render text, tables and graphics to web pages based upon information drawn from relational databases. Furthermore, most institutions (including the NSW Department of Primary Industries) have developed and implemented “Intranets” as an efficient approach to deliver internal information.
Given that the reporting requirements for resource assessment in NSW require greater accessibility, lower cost and shorter delays to delivery of content, it would be churlish not to consider the potential role of electronic reporting systems. Such considerations took place in early 2004 and it has been decided to invest modest resources into developing an effective intranet portal for Resource Assessment.
6.3.2 Objectives of the Resource Assessment Intranet
The Resource Assessment Intranet will have the following criteria:
Fast and Easy Access: Provide a single point of access (within the NSW Department of Primary Industries) for information, data and interpretations of stock status of harvested species in NSW.
Report Structure: Enable the specification and implementation of a hierarchical report of a species or a species-area combination. The report will have multiple pages of content that are described in more detail below.
Report Content: “Pages” will be based upon fixed templates that provide descriptive, tabular and graphical content. This content will also include a non-technical interpretation of the content of that page. These pages will include information on landings, catch per unit of effort, length composition and age composition. As information from recreational sources becomes available, page templates will be developed to report this content.
Security Standards: Depending upon the access rights of the user, all pages will be available or only approved pages (that have undergone internal reviews to be considered as Departmental output).
Taxonomic Information: Include a page that includes images of the species, or species that make up a species complex, and hyperlinks to external sites (such as FishBase or CSIRO CAAB) where additional information is available.
Managerial Information: Give a summary of pertinent management events that could be used to assist in the interpretation of the data.
References: All reports would include a bibliography.
Anecdotal Information: Provide an opportunity for people to include anecdotal commentary regarding a species.
NSW DPI - Fish. Res. Assess. Ser. 15

58 Resource Assessment Framework
Content Export: Functionality that enables content to be exported to XML files that can be transformed and used for publication of simple species reports or used as a stepping stone to a more detailed stock assessment report.
The Resource Assessment Intranet will provide a common portal for information about harvested species and the best available interpretation from Departmental officers on stock status. The system can be built relatively easily using intranet application systems. Assistance will be sought from professional software developers to get the skeleton of the system developed, but the ongoing maintenance will be undertaken in-house. Figure 6 illustrates the proposed interface of the Resource Assessment Intranet.
There will, initially, be no functionality for public access to the information stored on the intranet. Enabling public access to parts of the system to the public would, however, be straightforward.
Logo etc.
Export …
Fishery/Harvest Type Species Area
Page TitleText Content
Graphical Content Tabular Content
Frame 2 Frame 3
Frame 1Logo etc.
Export …
Fishery/Harvest Type Species Area
Page TitleText Content
Graphical Content Tabular Content
Frame 2 Frame 3
Frame 1
Figure 6. Illustration of the main interface of the Resource Assessment Intranet as viewable from a web browser. Frame 1 is the control frame and allows users to select species based upon particular fisheries and harvest types (primary, target species etc.). Frame 2 illustrates the hierarchical structure of a report for a particular species. Frame 3 is the page content frame and contains information based upon a fixed template.
6.4 Species Reports and Assessment Reports
The Resource Assessment Intranet would provide the day-to-day access point for information on stock status. There are, however, two other reporting requirements:
Simple Species Reports to be used for the annual FMS Performance Reports.
Detailed stock assessment reports that undertook a thorough examination of the data used in the reporting system, researched other indicators and generally undertook tasks that would be constrained by the Resource Assessment Intranet.
These two types of reports are discussed in turn.
NSW DPI - Fish. Res. Assess. Ser. 15

Resource Assessment Framework 59
6.4.1 Simple Species Reports
Within the FMS, there is a need for an annual reporting system of primary and target species whose catch is not determined by the TAC Committee. This will include all primary and target species except abalone and rock lobster. These Species Reports will not be full and detailed stock assessments, but rather performance reports of pre-agreed indicators. Changing the current assessment and reporting system for abalone or rock lobster is not recommended. There are also reporting requirements for key secondary species, secondary species and byproduct species.
The initial emphasis will be on the reporting of indicators already committed to within the FMS. For all but target species within the EPT (Table 14 at 104, Goal 2, Performance Indicator 3) this indicator is simply landed commercial catch. Associated with each Species Report will be any recommendations to revise indicators and trigger points for each species. This will be the mechanism within the resource assessment process to improve the quality of assessments beyond the use of commercial landings as the stock status indicator. Acceptance and implementation of these recommendations will require a small revision to the FMS that will be completed according to the mechanism outlined in the FMS (OH at 107, EPT at 100, EG at 98).
The Species Reports will be generated directly from content stored on the Resource Assessment Intranet. The XML export functionality will enable the rapid extraction of relevant content to a format that can be efficiently published. Species reports for each primary/target will be 2-4 pages and key secondary/byproduct species 1-2 pages. These reports would not be specific to any fishery but will note the composition of catches by fishery (including, where available, estimates of the discarded and recreational catch). Once these systems are set up it should take hours, not weeks, to publish simple reports for dozens of species.
Up-to-date Species Reports could easily be re-compiled to create the relevant chapters for a NSW Department of Primary Industries “Status of Fisheries Resources”.
6.4.2 Detailed Stock Assessment Reports
Species Reports will not permit the reporting of any detailed work completed by officers on the status of a particular resource. There will simply not be the time nor the space within these Species Reports. More detailed reports resulting from particular research projects should either take the form of a Fishery Resource Assessment Series document or a peer-review scientific publication. Projects that are partially funded by FRDC will require a FRDC Final Report. These more detailed reports or papers will be made available to those involved in the consultative stages of the Species Reports, as they will enable a richer understanding of any issues of stock status. Recommendations within the Species Reports are likely to be derived from a range of sources (much of it available on the Resource Assessment Intranet), not just the information presented within these short documents. These more detailed reports and papers would not be annual assessments, like the current abalone and lobster assessment documents, but rather one-off research outputs that summarise significant developments in the assessment of a resource.
The XML export functionality in the Resource Assessment Intranet could be used to create a substantial body of content for a detailed assessment report and would potentially make this process more efficient. This is not, however, the main purpose of a detailed assessment report. Rather such documents would question the existing interpretations, content and data used on the Resource Assessment Intranet and Species Reports. These longer reports would play a key role in the continuous improvement of resource assessment of harvested fish species in NSW.
NSW DPI - Fish. Res. Assess. Ser. 15

60 Resource Assessment Framework
6.5 Classes of Resource Assessment for Species Harvested in NSW
6.5.1 Overview
Previous material in this framework has deliberately avoided the details of what assessment method is suggested for each species. This is because until the bigger picture is in place there is no way of knowing what should, and could, be done. A detailed description of the assessment classes follows and Appendix B contains a table of the initial assessment classes that are proposed for species harvested in NSW. Content within Appendix B will require continual revision. Table 4 summarises the characteristics of each class.
Table 4. Summary of the attributes of the various classes of resource assessment proposed in this framework.
Class of Resource Assessment Attribute
One Two Three Four Five Biomass estimate •
Estimate of fishing mortality •
Quantitative risk analysis of future harvesting •
Standard fisheries biological reference points •
Credible indicator of abundance • •
Representative time-series of commercial catch • • • •
Age structured data (where possible) • •
Local information for growth, mortality, selectivity and maturity • • •
Length-structured data • • •
Non-local information for growth, mortality, selectivity and maturity
• • •
Externally reviewed or publishable • • • • •
6.5.2 Class One
Class One or dynamic assessment models have been built and successfully applied to the management of the NSW eastern rock lobster, abalone and gemfish fisheries. This class of assessment calibrates complex population models to indices of abundance and other information about population structure. These models require a credible and high contrast index of abundance or the integration of other data. Projecting the stock dynamics forward in time can be used as the basis of a quantitative risk analysis of alternative harvesting options. The “trigger points” of these models should be interpreted in terms of the limit/target biological reference points that are used to manage international fisheries such as Bt/B0 or Ft/F0.1. Such models are time consuming and expensive to prepare, execute and analyse. The best forecast results of these models are obtained when an index of recruitment is available and applied. Application of stock-recruitment relationships will degrade the forecasts from these models.
It is recommended that lobster and abalone fisheries continue to use Class One assessments. Other primary/target species will be provided with Class One assessments upon the basis of assessment priority and research opportunity. In the short term (less than three years) most species will not
NSW DPI - Fish. Res. Assess. Ser. 15

Resource Assessment Framework 61
have a research program focussed upon the completion of Class One assessments. Effective and efficient management systems will be built upon other classes of resource assessment.
The proposal to use the TAC Committee to determine the effort in the commercial prawn fisheries will require improvements to the resource assessment of these stocks. The socio-economic and biological consequences of allocating effort between fisheries requires additional consideration and analysis. Prawns support the most valuable commercial fishery in NSW and require prioritisation within resource assessment research programs. The ARC Linkage (PhD-based) project to investigate these fisheries was initiated in March 200425. Even if the TAC Committee does not play a significant role in the management of these stocks, this research should generate important outcomes for these fisheries and raise the assessment of these important stocks to Class One.
6.5.3 Class Two
Class Two assessment would be applied when there is a good understanding of the individual growth and total mortality in NSW and a credible, though not necessarily excellent, index of abundance for that species (such as a credible CPUE time-series). The population structure would be monitored with indicators derived from age and length-based data (only lengths would be used for crustaceans).
Class Two assessments would thus be completed using empirical indicators only. These indicators and the associated target and trigger points would be determined and, after appropriate consultation, included in an amended FMS. Targets and trigger points for these indicators will be determined using: biological knowledge of a species (such as length at maturity); and/or simulation testing methods. Certain primary/target species would be promoted to Class One assessments as priorities indicate.
Species identified as primary or target species within an FMS would be given Class Two assessments along with as many key secondary species as possible (but with lower priority).
6.5.4 Class Three
Class Three assessment would be applied to the more valuable species when the indicator of abundance was less credible or there was no potential for any age structured monitoring to occur. Length structured monitoring and assessment would be applied to these species only. There should be basic local information on the biology and mortality of species undergoing Class Three assessments.
Class Three assessments would thus be completed using empirical indicators only. These indicators and the associated target and trigger points would be determined and, after appropriate consultation, included in an amended FMS. Targets and trigger points for these indicators will be determined using: biological knowledge of a species (such as length at maturity); and/or simulation testing methods.
All species identified as byproduct or key secondary species (but not given a Class Two assessment) should be assessed in this way. Some non-key secondary or byproduct species could be included as growth and mortality information became available.
6.5.5 Class Four
Class Four assessments would be applied only to species of very low value and where very little information exists apart from landings data. Resource assessment would be based upon landings or
25 Mathew Ives was selected as the successful candidate and is expected to complete his PhD on a “Quantitative Analysis of Prawn Harvesting Strategies in NSW” by the end of 2006.
NSW DPI - Fish. Res. Assess. Ser. 15

62 Resource Assessment Framework
catch per fisher data only. The method currently used to define the trigger points for commercial landings within the completed FMS will continue to be used until a superior methodology can be justified.
This would be the simplest form of resource assessment and only used for any secondary or byproduct species that are not assessed with Class Two or Class Three methods. There must be at least credible information on commercial landings for this method to be applied.
6.5.6 Class Five
Class Five assessment recognises that no species-specific resource assessment can be undertaken (usually because there is no locally collected information from commercial or recreational fisheries). Assessment of these species could be based upon data from the observer program or fishery independent surveys as it became available but such work is not likely to be high priority. It is probable that assessment of these species will be via “ecosystem” indicators and/or indicators of discarding.
This class is reserved for species where there is no information at present but where the species is known to experience some type of fishing mortality.
NSW DPI - Fish. Res. Assess. Ser. 15

Resource Assessment Framework 63
7 MANAGEMENT OF DATA
7.1 Data Management for Fisheries Resource Assessment
There has been little written about data management within fisheries resource assessment, or for that matter, ecology (exceptions include Michener and Brunt (2000) and Evans and Grainger (2002)). Resource assessment within NSW requires the implementation of competent data management systems. Without systems to efficiently extract and analyse information that has been collected, resource assessment, or for that matter any aspect of performance reporting, will be expensive, inefficient and potentially inaccurate.
This data management system should be within a controlled environment. That is, policies should be associated with the reading and writing of data, preparation and execution of queries as well as other algorithms. The importance of this control is easily illustrated with the calculation of an index of abundance using CPUE. There are many possible methods to calculate CPUE for a species, but usually a subset of fishers and/or methods are used. If the NSW Department of Primary Industries adopts a particular algorithm or algorithms for a species then the same algorithm(s) must be used from year to year. Departmental officers should not be able to change that algorithm without an appropriate pattern of workflow approval. Furthermore, that algorithm (which defines the indicator) should be kept in a single location and not duplicated on individual computer workstations. The same standards should be applied for any indicator requiring extensive calculation.
The NSW Department of Primary Industries has approved a Data Management Strategic Plan (Anon 2003) with the following mission:
“NSW Fisheries [now the NSW Department of Primary Industries] aims to create and maintain a data management environment that recognises the strategic value of data and information as enterprise assets, and fosters a culture of information quality, enterprise collaboration and information reuse.”
This Plan includes recommendation 6:
“A project be initiated to implement a department wide Aquatic Resource Data Warehouse that provides a central repository for historical and current data holdings describing the aquatic resources of NSW, and complimented with appropriate analysis tools. Initiate a program to migrate existing data into the environment.”
The Data Warehouse will be built using Microsoft SQL Server 2000 and appropriate policies for data access will de developed. Designing the required databases, migrating legacy data and developing algorithms for the calculation of empirical indicators (in structured query language or other scripting languages) will take several years. Fortunately once an algorithm is defined that, for example, calculates median length, it will be able to be applied to all species harvested in NSW in seconds and the calculations will be completely repeatable.
The magnitude of this indicator-reporting problem cannot be over-emphasised. After the completion of all FMS, there will be around 40 primary or target species in NSW and similar numbers of secondary species. Primary species will require up to six empirical indicators and secondary species around one or two. This results in around 300 indicators that should be reported upon annually (probably by one or two staff) just for the species-based resource assessment. This is not a task for Microsoft Excel.
The overall architecture of the Data Warehouse is illustrated in Figure 7.
NSW DPI - Fish. Res. Assess. Ser. 15

64 Resource Assessment Framework
ComCatch AgeLength Observer Other
Stored Procedures& Other Algorithms Views
FMS Indicators
Tables and Graphical Output (Intranet)
QueriesFrom OtherApplications
Data Warehouse
ComCatch AgeLength Observer Other
Stored Procedures& Other Algorithms Views
FMS Indicators
Tables and Graphical Output (Intranet)
QueriesFrom OtherApplications
Data Warehouse
Figure 7. Architecture of the Data Warehouse and the relationship to the FMS resource assessment indicators. The shaded areas within the figure represents the boundaries of a “controlled environment”. Note that views (SQL queries) are available from other desktop applications as well the intranet reporting system. The “Other” sources of data could include results from fishery-independent surveys or results of surveys of recreational fishing.
7.2 The Data Warehouse
As described earlier, a controlled data management environment is required for the efficient and accurate calculation of empirical stock status indicators. This environment has been referred to as the Data Warehouse.
Three inter-connected databases will be built on this system: ComCatch (the commercial catch and effort data; AgeLength (the database for age and length records of samples of individual fish) and Observer (records from observer programs). This system has the advantage that the same queries (views) can be executed from Excel, Access, propriety software, statistics packages and other reporting packages. This will ensure the consistency of indicator reporting for resource assessment within the NSW Department of Primary Industries. There will also need to be a small database Species (that manages the various species codes used within the Department) and an integrating database Assess (that is used to store indicators and content for the Resource Assessment Intranet).
Existing recreational databases should also be migrated into the Warehouse. These include: Charter (catch and effort data from the charter boat logbook program); tournament monitoring data (Gamefish and Tournament); and creel survey databases (Creel).
7.3 Refinements to the Catch and Effort Database (ComCatch)
Improvements to the relational data model will address most of the constraints in the catch and effort database. Interfaces (queries available to end-users) can also be designed to improve interpretation. For example, it is known that there is confounding in the records of blue-swimmer crabs and sand crabs. An interface will be designed that ensures that users will not be provided the records of blue-swimmer crabs without the additional records of sand crabs. This system also needs
NSW DPI - Fish. Res. Assess. Ser. 15

Resource Assessment Framework 65
to be engineered so that “experts” (who are willing to take responsibility) have access to the full database. These issues reinforce the need for a controlled data environment.
The importance of this database for resource assessment was emphasised above (page 47). Investment in ComCatch is required to ensure that the benefits of this system can be fully realised. There are several improvements to the ComCatch database that will improve the privacy, performance and accessibility of the system for resource assessment. These improvements include:
• Updating the system from the FINS licencing system overnight.
• Indexing the main data tables. This will increase the processing speed of queries.
• Altering the relational structure of the tables to better reflect the structure of the catch and effort forms (rather than the FINS system).
• Making the results of common queries available through the Resource Assessment Intranet.
• Implementing the Departmental privacy policy to ensure confidential data are protected.
7.4 Comments upon the Management of Other Data
The NSW Department of Primary Industries has substantial historical records of age and length composition data for a variety of species. These data are of irreplaceable value for inferring current stock-status because they substantially increase the contrast in the datasets used for resource assessment. Fortunately, most of these data have already been entered into structured spreadsheets. This will make their transfer to a relational database management system straightforward.
A new relational database, AgeLength, will be designed and implemented within the Warehouse to improve accessibility and analysis of the age and length composition data. Data collected from a particular date would be entered directly into this system or imported via highly structured Excel spreadsheets.
Data from historical observer programs and some surveys are stored in AREV (Advanced Revelation) databases. Migration of these data to an appropriate database within the Warehouse will be straightforward.
Recent individual projects have stored their data in Access databases. In most cases there would be no need to migrate this information to the Warehouse as it represents a discrete body of work. If appropriate, subsets of data from individual projects should be included in the Warehouse, but this information would be carefully tracked to ensure no duplication could occur. Datasets existing within individual databases require acceptable standards of archival and documentation.
The Data Management Strategic Plan included a recommendation (4) that “A project be established to implement a data catalogue providing a central repository of departmental data holdings.”. Implementation of this recommendation will see an improvement in the availability of data for resource assessment within the NSW Department of Primary Industries.
NSW DPI - Fish. Res. Assess. Ser. 15

66 Resource Assessment Framework
8 DISCUSSION
8.1 Future Directions
This document provides a framework for the assessment of harvested marine fish resources under the jurisdiction of the NSW Department of Primary Industries. Aquatic resource assessment is a significant challenge within NSW and the discipline, and arcane language, of “stock assessment” can obfuscate many of the issues. In summary, this framework has presented four major recommendations. The NSW Department of Primary Industries should:
• Define and implement precautionary decision-making processes that utilise recommendations from resource assessment.
• Develop systems of indicators (with associated targets and trigger points) that enable the timely reporting of stock status. The sophistication and cost of these indicators should reflect the value of, and risk to, particular stocks.
• Continue to invest in the data management and information technology systems required to calculate, and report upon, empirical indicators.
• Use risk-based prioritisation to determine the data collection programs for resource assessment.
This framework suggests that, in the short term of up to 3-5 years, fisheries resource assessment at the NSW Department of Primary Industries should be dominated by the goal of calculating and reporting empirical indicators. Such a strategy is not uncontroversial and is determined upon pragmatic grounds. Empirical indicators can be calculated and they will mostly be credible. Biomass estimates and fishing mortalities may or may not be able to be calculated and may or may not be credible. As long as the resource assessment process is structured to interpret and act upon signals from empirical indicators (which is how the FMS are currently worded) in a precautionary manner then this should not result in any adverse outcomes to stocks. The overall quality of resource assessment in NSW will continuously improve over time as credible relationships between empirical indicators and biomass and fishing mortality estimates can be derived. The cliché often used for strategies to reduce pollution is to “pick the low fruit” (do the easy and low cost work first) and is appropriate in this context. Empirical indicators are the “low fruit” of resource assessment in NSW.
Significant decisions have to be made about what type of continuous data-collection projects the NSW Department of Primary Industries will invest in for the long-term. The highest priority is to maintain the catch-effort reporting system. Clearly improvements can be made, and some of these have been identified as goals within this framework, but the catch-effort system will be the dominant source of information for resource assessment in NSW in long term.
Alternative sources of information to generate indicators of stock status for primary species also require commitment. There are several choices: monitoring commercial catches at ports; systematic observer programs; creel surveys; and, fishery independent surveys. More expensive programs may provide better quality data, but there will be decreasing marginal benefit on expenditure. Many of the benefits from fishery independent surveys will take years to realise. Observer programs will, however, deliver immediate benefit to the management of fisheries in NSW.
The long-term role of systematic (not risk-based) observer programs and independent surveys within resource assessment is a complex issue that requires additional debate. These programs have ramifications for all principles of ecological sustainability (inter-generational equity, biodiversity, precaution, and the internalisation of environmental costs). Deliberative mechanisms need to be implemented within the Department to structure this debate.
NSW DPI - Fish. Res. Assess. Ser. 15

Resource Assessment Framework 67
Whilst this debate occurs, the NSW Department of Primary Industries needs to progress the tasks and processes that make up resource assessment. The short-term focus of this undertaking must be pragmatic. Pragmatism calls for the acceptance of monitoring commercial catch and effort until alternatives are committed to: both strategically and financially. Given that the additional funding required for any alternative programs will likely be on the basis of cost recovery from commercial or recreational stakeholders, it is doubtful that anything but the approach with the greatest benefit to cost ratio will be supported. The NSW Department of Primary Industries must continue to manage this economy by the application of risk assessment and the development and implementation of precautionary decision-making processes.
8.2 A Model for Continuous Improvement of Resource Assessment
Figure 8 illustrates a model for continuous improvement within this resource assessment framework. The lower part of the figure indicates the continuous data collection systems that are required for performance reporting and resource assessment. Two types of information are required: data for empirical indicators of abundance (such as catch and effort data, or catch data and surveys); and, data for empirical indicators of stock structure (such as age and length data from port monitoring, systematic observer programmes or surveys). These sources of data are used to calculate empirical indicators used for annual performance reporting within the management systems defined within the FMS.
Improvements in the quality of resource assessments will be facilitated by a series of “Resource Assessment Projects”. These projects will use data from the empirical indicators and exchange ideas with national and international peers in resource assessment. These projects will be expected to improve empirical indicators and contribute to international concepts in resource assessment. Given that several assessments in NSW already represent international standards, the top arrow has started well before “now”. Similar representation of existing data collection programs is indicated with the catch and effort data and the age-length data. The major system that needs investment in the short term is improved methods to calculate and report upon the empirical indicators. Goals in this framework have been designed to achieve this model.
8.3 Final Comments
The NSW Department of Primary Industries is in a strong position to advance the assessment of fish resources in NSW. Fishery Management Strategies provide an excellent prioritisation of the work required and a management framework that integrates and utilises outputs from resource assessment. The risk assessments completed within the environmental impact statements are an objective analysis of the threats facing stocks and a sound mechanism for prioritising research and management. The NSW Department of Primary Industries has some excellent datasets that will, with additional investment and frequent updating, provide a crucial basis for resource assessment, monitoring and management. Current and future research projects will enable a determination of the most effective mixture of information sources required for resource assessment.
Section 3(2)(a) of the FMA states that an object of the Act is to conserve fish stocks and key fish habitats. This framework addresses performance measures for the conservation of fish stocks but not key fish habitats. The extent to which this framework could be extended to the assessment and monitoring of habitats, which have many differences, but also many similarities, requires further consideration.
NSW DPI - Fish. Res. Assess. Ser. 15

68 Resource Assessment Framework
TimeNow
Stat
e of
Res
ourc
e As
sess
men
t
Low
High
Catch and Effort Monitoring Systems
Age and Length Monitoring Systems
Empirical Indicator Reporting and Management Systems
Res Assess Proj 1 Res Assess Proj 2
“Best Practice” Resource Assessment and Management Systems
TimeNow
Stat
e of
Res
ourc
e As
sess
men
t
Low
High
Catch and Effort Monitoring Systems
Age and Length Monitoring Systems
Empirical Indicator Reporting and Management Systems
Res Assess Proj 1 Res Assess Proj 2
“Best Practice” Resource Assessment and Management Systems
Figure 8. A model for the continuous improvement of resource assessment within the NSW Department of Primary Industries. The model emphasises the role of continuous data collection systems and their use in performance reporting via empirical indicators. Research projects exchange data and concepts from these empirical indicators and other assessment methods to continuously improve resource assessments in NSW.
NSW DPI - Fish. Res. Assess. Ser. 15
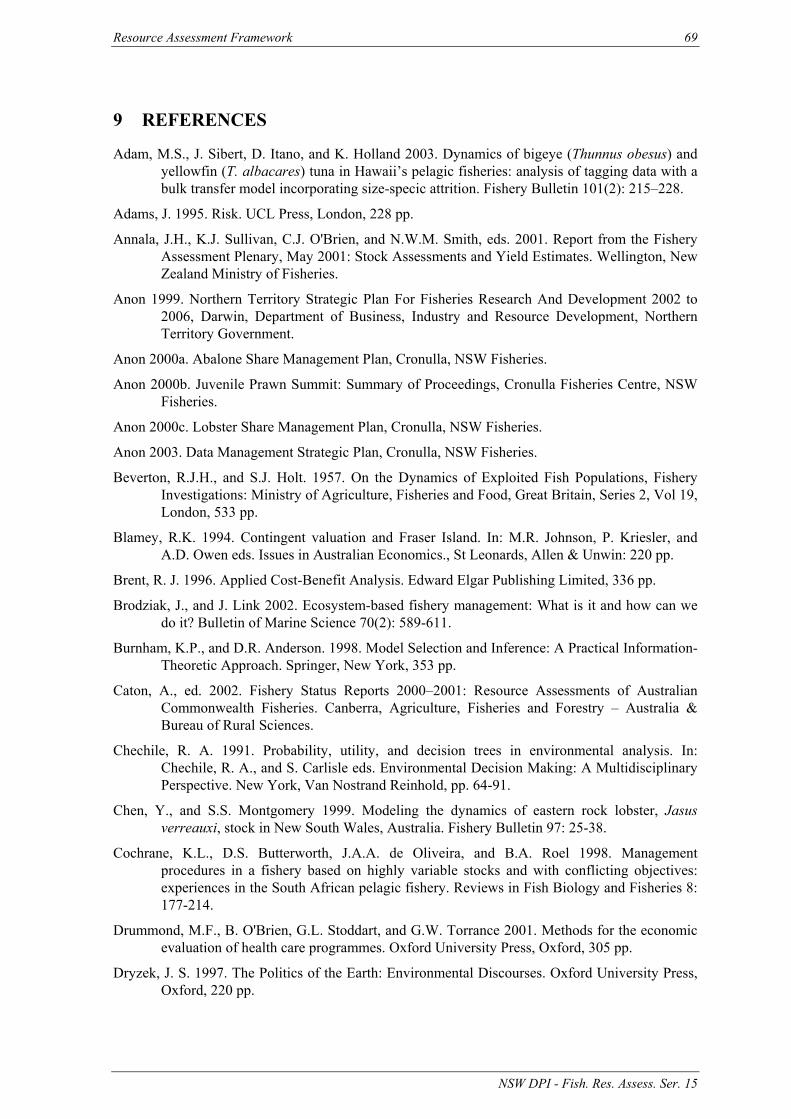
Resource Assessment Framework 69
9 REFERENCES
Adam, M.S., J. Sibert, D. Itano, and K. Holland 2003. Dynamics of bigeye (Thunnus obesus) and yellowfin (T. albacares) tuna in Hawaii’s pelagic fisheries: analysis of tagging data with a bulk transfer model incorporating size-specic attrition. Fishery Bulletin 101(2): 215–228.
Adams, J. 1995. Risk. UCL Press, London, 228 pp.
Annala, J.H., K.J. Sullivan, C.J. O'Brien, and N.W.M. Smith, eds. 2001. Report from the Fishery Assessment Plenary, May 2001: Stock Assessments and Yield Estimates. Wellington, New Zealand Ministry of Fisheries.
Anon 1999. Northern Territory Strategic Plan For Fisheries Research And Development 2002 to 2006, Darwin, Department of Business, Industry and Resource Development, Northern Territory Government.
Anon 2000a. Abalone Share Management Plan, Cronulla, NSW Fisheries.
Anon 2000b. Juvenile Prawn Summit: Summary of Proceedings, Cronulla Fisheries Centre, NSW Fisheries.
Anon 2000c. Lobster Share Management Plan, Cronulla, NSW Fisheries.
Anon 2003. Data Management Strategic Plan, Cronulla, NSW Fisheries.
Beverton, R.J.H., and S.J. Holt. 1957. On the Dynamics of Exploited Fish Populations, Fishery Investigations: Ministry of Agriculture, Fisheries and Food, Great Britain, Series 2, Vol 19, London, 533 pp.
Blamey, R.K. 1994. Contingent valuation and Fraser Island. In: M.R. Johnson, P. Kriesler, and A.D. Owen eds. Issues in Australian Economics., St Leonards, Allen & Unwin: 220 pp.
Brent, R. J. 1996. Applied Cost-Benefit Analysis. Edward Elgar Publishing Limited, 336 pp.
Brodziak, J., and J. Link 2002. Ecosystem-based fishery management: What is it and how can we do it? Bulletin of Marine Science 70(2): 589-611.
Burnham, K.P., and D.R. Anderson. 1998. Model Selection and Inference: A Practical Information-Theoretic Approach. Springer, New York, 353 pp.
Caton, A., ed. 2002. Fishery Status Reports 2000–2001: Resource Assessments of Australian Commonwealth Fisheries. Canberra, Agriculture, Fisheries and Forestry – Australia & Bureau of Rural Sciences.
Chechile, R. A. 1991. Probability, utility, and decision trees in environmental analysis. In: Chechile, R. A., and S. Carlisle eds. Environmental Decision Making: A Multidisciplinary Perspective. New York, Van Nostrand Reinhold, pp. 64-91.
Chen, Y., and S.S. Montgomery 1999. Modeling the dynamics of eastern rock lobster, Jasus verreauxi, stock in New South Wales, Australia. Fishery Bulletin 97: 25-38.
Cochrane, K.L., D.S. Butterworth, J.A.A. de Oliveira, and B.A. Roel 1998. Management procedures in a fishery based on highly variable stocks and with conflicting objectives: experiences in the South African pelagic fishery. Reviews in Fish Biology and Fisheries 8: 177-214.
Drummond, M.F., B. O'Brien, G.L. Stoddart, and G.W. Torrance 2001. Methods for the economic evaluation of health care programmes. Oxford University Press, Oxford, 305 pp.
Dryzek, J. S. 1997. The Politics of the Earth: Environmental Discourses. Oxford University Press, Oxford, 220 pp.
NSW DPI - Fish. Res. Assess. Ser. 15

70 Resource Assessment Framework
Essington, T.E. 2001. The precautionary approach in fisheries management: the devil is in the details. Trends in Ecology and Evolution 16(3): 121-122.
Evans, D., and R. Grainger 2002. Gathering Data for Resource Monitoring and Fisheries Management. In: P.J.B. Hart and J.D. Reynolds eds, Handbook of Fish Biology and Fisheries: (2) Fisheries. Blackwell, Oxford, pp. 84-102.
Fairweather, P.G. 1989. Where is the science in EIA? Search(20): 141-144.
FAO 1996. Precautionary Approach to Capture Fisheries and Species Introductions, FAO Technical Guidelines for Responsible Fisheries 2, Rome, FAO.
FAO 1997. Review of the State of World Fishery Resources: Marine Fisheries, Rome, FAO Fisheries Department.
FAO 2001. Towards Ecosystem-Based Fisheries Management: A Background Paper Prepared by FAO for the Reykjavik Conference on Responsible Fisheries in the Marine System, FAO Report Reykjavik 2001/4, Reykjavik, FAO.
FAO 2003. FAO Technical Guidelines For Responsible Fisheries: 4 Fisheries Management (2) The ecosystem approach to fisheries, Rome, Food and Agriculture Organization of the United Nations.
Ferrell, D., and W. Sumpton 1997. Assessment of the fishery for snapper (Pagrus auratus) in Queensland and New South Wales, FRDC Final Report FRDC 93/074, Cronulla, NSW Fisheries and QDPI.
Finlayson, A.C. 1994. Fishing for Truth: A Sociological Analysis of the Northern Cod Stock Assessments from 1977 to 1990. Institute of Social and Economic Research, Memorial University, St John's, 176 pp.
Fisher, E.C. 1999. The precautionary principle as a legal standard for public decision-making: The role of judicial and merits review in ensuring reasoned deliberation. In: R. Harding and E. Fisher eds, Perspectives on the Precautionary Principle. The Federation Press, Sydney, pp. 83-98.
Fletcher, W. J. 2001. ESD, environmental sustainability, EPBC, ecosystem based management, integrated fisheries management, EMS's: How will we ever cope? In: Newman, S. J., D. J. Gaughan, G. Jackson et al. eds, Towards Sustainability of Data-Limited Multi-Sector Fisheries. Perth, Australian Society for Fish Biology: 32-41.
Fletcher, W. J., J. Chesson, M. Fisher, K. J. Sainsbury, T. Hundloe, A. D. M. Smith, and B. Whitworth 2002. National ESD Reporting Framework for Australian Fisheries: The 'How To' Guide for Wild Capture Fisheries. Canberra, FRDC Project 2000/145, 120 pp.
Fletcher, W., and S. Keech 1998. Status of Fisheries Resources 1996/97, Sydney, NSW Fisheries Research Institute.
Fletcher, W., and T. McVea 2000. 1999/99 Status of Fisheries Resources, Sydney, NSW Fisheries Research Institute.
Francis, R.I.C.C., and R. Shotton 1997. "Risk" in fisheries management: a review. Canadian Journal of Fisheries and Aquatic Sciences 54: 1699-1715.
Garcia, S.M. 1994. The Precautionary Principle: its Implications in Capture Fisheries Management. Ocean and Coastal Management 22: 99-125.
Gardner, C., S.D. Frusher, and L. Eaton 2001. Tasmanian Rock Lobster Fishery 1999/2000, TAFI Fishery Assessment Report Hobart, Tasmanian Aquaculture and Fisheries Institute.
Gardner, C., and C. Mackinnon 2002. Tasmanian Giant Crab Fishery 2000/2001, TAFI Fishery Assessment Report Hobart, Tasmanian Aquaculture and Fisheries Institute.
NSW DPI - Fish. Res. Assess. Ser. 15

Resource Assessment Framework 71
Gillanders, B.M., D.J. Ferrell, and N.L. Andrew 2001. Estimates of movement and life-history parameters of yellowtail kingfish (Seriola lalandi): how useful are data from a cooperative tagging programme? Marine and Freshwater Research 52: 179-192.
Glaister, J.P., T. Lau, and V.C. McDonall 1987. Growth and migration of tagged eastern Australian king prawns, Penaeus plebejus Hess. Australian Journal of Marine and Freshwater Research 38: 225-241.
Glaister, J.P., S.S. Montgomery, and V.C. McDonall 1990. Yield-per-recruit analysis of eastern king prawns Penaeus plebejus Hess, in eastern Australia. Australian Journal of Marine and Freshwater Research 41: 175-197.
Gordon, G.N.G., N.L. Andrew, and S.S. Montgomery 1995. Deterministic compartmental model for the Eastern King Prawn (Penaeus plebejus) fishery in New South Wales. Australian Journal of Marine and Freshwater Research 46: 793-807.
Gray, C.A., B.C. Pease, S.L. Stringfellow, L.P. Raines, B.K. Rankin, and T.R. Walford. 2000. Sampling estuarine fish species for stock assessment. NSW Fisheries, Cronulla, 196 pp.
Gulland, J.A. 1983. Fish Stock Assessment: A Manual of Basic Methods. John Wiley & Sons, Chichester, 223 pp.
Henry, G. W., and J. M. Lyle 2003. The National Recreational and Indigenous Fishing Survey Project FRDC 1999/158. Cronulla, NSW Fisheries: 188 pp.
Hilborn, R. 1990. Determination of fish movement patterns from tag recoveries using maximum likelihood estimators. Canadian Journal of Fisheries and Aquatic Sciences 47(3): 635-643.
Hilborn, R. 2002. The dark side of reference points. Bulletin of Marine Science 70(2): 403-408.
Hilborn, R., and M. Mangel. 1997. The Ecological Detective: Confronting Models with Data. Princeton University Press, Princeton, 315 pp.
Hilborn, R., and C.J. Walters. 1992. Quantitative Fisheries Stock Assessment: Choice, Dynamics and Uncertainty. Chapman and Hall, London, 570 pp.
Kane, V.E. 1989. Defect Prevention: Use of Simple Statistical Tools. ASDC Quality Press, New York, 688 pp.
Kennelly, S., and T. McVea, eds. 2001. Status of Fisheries Resources 2000/2001. Cronulla, NSW Fisheries.
Kennelly, S.J., and J.P. Scandol 1999. Relative abundances of spanner crabs and the development of a population model for managing the NSW spanner crab fishery, FRDC Final Report 96/135, Sydney, NSW Fisheries.
Kennelly, S.J., and J.P. Scandol 2002. Using a fishery-independent survey to assess the status of a spanner crab Ranina ranina fishery: univariate analysis and biomass modelling. Crustaceana 75(1): 13-39.
Laslett, G.M., J.P. Eveson, and T. Tom Polacheck 2002. A flexible maximum likelihood approach for fitting growth curves to tag–recapture data. Canadian Journal of Fisheries and Aquatic Sciences 59(6): 976-986.
Liggins, G.W., J.P. Scandol, S. Montgomery, J. Craig, and W. Macbeth 2000. An Assessment of the NSW Eastern Rock Lobster Resource for 2000-2001, NSW Fishery Resource Assessment Series 10, Sydney, NSW Fisheries.
Lowry, M.B., and J.J. Murphy 2003. Monitoring the Recreational Game Fish Fishery off South Eastern Australia. Journal of Marine and Freshwater Research 54(4): 425-434.
NSW DPI - Fish. Res. Assess. Ser. 15

72 Resource Assessment Framework
Lyle, J. 1998. Providing stock assessments for Australian fisheries, Stock Assessment/Population Dynamics Committee Australian Society for Fish Biology Hobart, Tasmanian Aquaculture and Fisheries Institute.
Lyle, J.M., and K. Hodgson 2002. Tasmanian Scalefish Fishery 2001, TAFI Fishery Assessment Report Hobart, Tasmanian Aquaculture and Fisheries Institute.
Mace, P.M. 2001. A new role for MSY in single-species and ecosystem approaches to fisheries stock assessment and management. Fish and Fisheries 2(1): 2-32.
Manly, B.F.J. 2001. Statistics for Environmental Science and Management. Chapman and Hall/CRC, London, 326 pp.
Marsen, S., and S. Dovers, eds. 2002. Strategic Environmental Assessment in Australiasia. Annandale, The Federation Press.
Martell, S.J.D., and C.J. Walters 2002. Implementing harvest rate objectives by directly monitoring exploitation rates and estimating changes in catchability. Bulletin of Marine Science 70(2): 695-713.
Megrey, B.A. 1989. Review and comparison of age-structured stock assessment models from theoretical and applied points of view. American Fisheries Society Symposium 6: 8-48.
Michener, W.K., and J.W. Brunt, eds. 2000. Ecological Data: Design, Management and Processing. Methods in Ecology. Oxford, Blackwell Science.
Newman, S.J., D.J. Guaghan, G. Jackson, M.C. Mackie, B. Molony, J. St John, and P. Kailola 2003. Towards Sustainability of Data-Limited Multi-Sector Fisheries. Australian Society for Fish Biology Workshop Proceedings, Bunbury 23-24 Sep 2001, Department of Fisheries Western Australia.
Nielson, G.M. 1991. Visualization in scientific engineering computation. Computer. September 1991: 58-66.
Penn, J.W., ed. 2003. State of the Fisheries Report 2001/2002. Perth, Department of Fisheries (Government of Western Australia).
Peterman, R.M. 1990. Statistical power analysis can improve fisheries research and management. Canadian Journal of Fisheries and Aquatic Sciences 47(1): 2-15.
Platt, J.R. 1964. Strong Inference. Science 146: 347-353.
Pollock, K.H., C.M. Jones, and T.L. Brown 1994. Angler survey methods and their applications in fisheries management. American Fisheries Society Special Publication 25.
Prescott, J., and Y. Xiao 2001. Rock Lobster, South Australian Fisheries Assessment Series 2001/04, Adelaide, South Australian Research and Development Institute.
Price, C. 2000. Valuation of unpriced products: contingent valuation, cost-benefit analysis and participatory democracy. Land Use Policy 17(17): 187-196.
Punt, A.E., R. Campbell, and A.D.M. Smith 2001. Evaluating empirical indicators and reference points for fisheries management: Application to the broadbill swordfish fishery off Eastern Australia. Marine and Freshwater Research 52: 819-832.
Punt, A. E., and A. D. M. Smith 1999. Harvest strategy evaluation for the eastern stock of gemfish (Rexea solandri). ICES Journal of Marine Science 56: 860-875.
Quinn, T.J., and R.B. Deriso. 1999. Quantitative Fish Dynamics. Oxford University Press, New York, 542 pp.
Rodda, K., D. Casement, and H. Williams 2000. Fishery Assessment Report to PIRSA for the Abalone Fishery Management Committee, South Australian Fisheries Assessment Series 00/02, Adelaide, South Australian Research and Development Institute.
NSW DPI - Fish. Res. Assess. Ser. 15

Resource Assessment Framework 73
Rosenberg, A.A., and V.R. Repestro 1996. Precautionary management reference points and management strategies. FAO Fisheries Technical Paper 350(2): 129-140.
Rowling, K.R. 1987. The need for catch controls in the gemfish fishery, Fisheries Research Institute Internal Report 26, Cronulla, NSW Department of Agriculture: Fisheries Research Institute.
Rowling, K.R. 1990. Changes in the stock composition and abundance of spawning gemfish Rexea solandri (Cuvier), Gempylidae, in South Australian waters. Australian Journal of Marine and Freshwater Research 41: 145-163.
Rowling, K.R. 1997. The collapse of the eastern Australian gemfish stock - issues for management and the role of fisheries science. In: D.A. Handcock, D.C. Smith, A. Grant and J.P. Beumer ed., 2nd World Fisheries Congress. CSIRO Publishing, Collingwood, pp. 210-214.
Rowling, K.R., and D.L. Makin 2001. Monitoring of the fishery for gemfish Rexea solandri, 1996 to 2000, NSW Fisheries Final Report Series 27, Cronulla, NSW Fisheries and Australian Fisheries Management Authority.
Rowling, K.R., and L.P. Raines 2000. Description of the biology and an assessment of the fishery for silver trevally Pseudocaranx dentex off New South Wales, NSW Fisheries Final Report 24, Cronulla, NSW Fisheries.
Sainsbury, K.J., A.D.M. Smith, and H. Webb 2000. Current use and recommendations for future development of sustainability indicators to measure performance of Australian fisheries against ESD objectives, FRDC Final Report 98/168 98/168, Hobart, CSIRO Marine Research.
Sarewitz, D., R.A. Pielke, and R. R. Byerly, eds. 2000. Prediction: Science, Decision Making, and the Future of Nature. Washington D.C., Island Press.
Scandol, J.P. 2002a. Landed Catch as an Indicator for the Management of Fisheries, Sydney, Centre for Research on Ecological Impacts of Coastal Cities.
Scandol, J.P. 2002b. Stage Two Stock Status Indicators for Fisheries within NSW, Sydney, Centre for Research on Ecological Impacts of Coastal Cities.
Scandol, J.P. 2003. Use of Cumulative Sum (CUSUM) Control Charts of Landed Catch in the Management of Fisheries. Fisheries Research 64(1): 19-36.
Scandol, J.P., and R.E. Forrest 2001a. Commercial catches as an indicator of stock status in NSW estuarine fisheries: trigger points, uncertainty and interpretation. Towards Sustainability of Data-Limited Multi-Sector Fisheries, Perth, Australian Society for Fish Biology.
Scandol, J.P., and R.E. Forrest 2001b. Modelling Services for the Estuary General Fishery, Final Report Sydney, University of Sydney.
Schnute, J.T., and L.J. Richards 2001. Use and abuse of fishery models. Canadian Journal of Fisheries and Aquatic Sciences 58(1): 10-17.
Seber, G.A.F. 1982. The Estimation of Animal Abundance and Related Parameters. Oxford University Press, New York, pp.
Smith, J.T., and D.J. Heran 2001. Status of Tasmanian Recreational Fish Species: An Inventory for Planning and Management, TAFI Fishery Assessment Report Hobart, Tasmanian Aquaculture and Fisheries Institute.
Smith, K.A., and K. Deguara 2002. Review of biological information and stock assessment for the NSW sea mullet resource, Fishery Resource Assessment Series 12, Cronulla, NSW Fisheries.
NSW DPI - Fish. Res. Assess. Ser. 15

74 Resource Assessment Framework
Steffe, A.S., and D.J. Chapman 2003. A survey of daytime recreational fishing during the annual period, March 1999 to February 2000, in Lake Macquarie, New South Wales, NSW Fisheries Final Report Series 52, Cronulla, NSW Fisheries.
Steffe, A.S., J.J. Murphy, D.J. Chapman, B.E. Tarlinton, G.N.G. Gordon, and A. Grinberg 1996. An assessment of the impact of offshore recreational fishing in New South Wales waters on the management of commercial fisheries., FRDC Final Report 94/053, Cronulla, NSW Fisheries Research Institute.
Stewart, J., D.J. Ferrell, B. van der Walt, D. Johnson, and M. Lowry 2001. Assessment of the length and age composition of commercial kingfish landings, NSW Fisheries Final Report Series 36, Cronulla, NSW Fisheries.
Stobutzki, I., M. Miller, and D. Brewer 2001. Sustainability of fishery bycatch: a process for assessing highly diverse and numerous bycatch. Environmental Conservation 28(2): 167-181.
Tarbath, D., K. Hodgson, T. Karlov, and M. Haddon 2001. Tasmanian Abalone Fishery 2000, TAFI Fishery Assessment Report Hobart, Tasmanian Aquaculture and Fisheries Institute.
Thomas, I. 2001. Environmental Impact Assessment in Australia: Theory and Practice. The Federation Press, Sydney, 330 pp.
Thompson, J.R., and J. Koronacki. 1993. Statistical Process Control for Quality Improvement. Chapman and Hall, New York, 391 pp.
Underwood, A.J. 1990. Experiments in ecology and management: their logics, functions and interpretations. Australian Journal of Ecology 15: 365-389.
Underwood, A.J. 1997. Environmental decision-making and the precautionary principle: what does this principle mean in environmental sampling practice? Landscape and Urban Planning 37: 137-146.
Virgona, J., K. Deguara, D. Sullings, I. Halliday, and K. Kelly 1998. Assessments of the stocks of sea mullet in New South Wales and Queensland waters., FRDC Project No. 94/024, Cronulla, NSW Fisheries Final Report Series No. 2.
Walters, C., and J.-J. Maguire 1996. Lessons for stock assessment from the northern cod collapse. Reviews in Fish Biology and Fisheries 6(2): 125-137.
Walters, C.J. 1986. Adaptive Management of Renewable Resources. MacMillan Publishing, New York, 374 pp.
Ward, T., D. Tarte, E. Hegerl, and K. Short 2002. Policy Proposals and Operational Guidance for Ecosystem-Based Management of Marine Capture Fisheries, Sydney, World Wide Fund for Nature Australia.
Ward, T.M., L.J. McLeay, P.J. Rogers, and W.F. Dimmlich 2001. Spawning Biomass of Pilchard (Sardinops sagax) in South Australia in 2001, Report to the PIRSA Fisheries Adelaide, SARDI Aquatic Sciences: Great Australian Bight and Shelf Seas Research Program.
West, R.J., and G.N.G. Gordon 1994. Commercial and recreational harvest of fish from two Australian coastal rivers. Australian Journal of Marine and Freshwater Research 45(1): 1259-1279.
Williams, L.E., ed. 2002. Queensland's Fisheries Resource: Current condition and recent trends 1988-2000. Brisbane, Department of Primary Industries, The State of Queensland.
Worthington, D.G., R.C. Chick, C. Blount, P.A. Brett, and P.T. Gibson 1998. A final assessment of the NSW abalone fishery in 1997, NSW Fishery Resource Assessment Series 5, Sydney, NSW Fisheries.
NSW DPI - Fish. Res. Assess. Ser. 15

Resource Assessment Framework 75
Xiao, Y., J.D. Stevens, and G.J. West 1999. Estimation of fishing and natural mortalities from tag experiments with exact or grouped times at liberty. Canadian Journal of Fisheries and Aquatic Sciences 56(5): 868-874.
NSW DPI - Fish. Res. Assess. Ser. 15

76 Resource Assessment Framework
III APPENDICES
1 GLOSSARY
AB Abalone Fishery
ACCF Advisory Council on Commercial Fishing
ACFC Advisory Council on Fisheries Conservation
ACoRF Advisory Council on Recreational Fishing
ACRP Angler’s Catch Research Program
AFMA Australian Fisheries Management Authority
AFMF Australian Fisheries Management Forum
ARC Australian Research Council
B Symbol usually used for exploitable biomass
EBFM Ecosystem Based Fisheries Management
EG Estuary General Fishery
EIA Environmental Impact Assessment
EIS Environmental Impact Statement
EPT Estuary Prawn Trawl Fishery
ESD Ecologically Sustainable Development
F Symbol usually used for fishing mortality
FMA NSW Fisheries Management Act 1994
FMS Fishery Management Strategy/Fisheries Management Strategies
FRDC Fisheries Research and Development Corporation
LOB Lobster Fishery
M Symbol used for natural mortality
MAC Management Advisory Committee
MSE Management Strategy Evaluation
OFT Ocean Fish Trawl Fishery
OH Ocean Hauling Fishery
NSW DPI - Fish. Res. Assess. Ser. 15

Resource Assessment Framework 77
OPT Ocean Prawn Trawl Fishery
OTF Ocean Trawl Fishery (incorporating OPT and OFT)
OTL Ocean Trap and Line Fishery
REC Recreational Fisheries
XML Extensible Markup Language
Z Symbol used for total mortality
NSW DPI - Fish. Res. Assess. Ser. 15

78 Resource Assessment Framework
2 COMMITMENTS FOR STOCK ASSESSMENT WITHIN THE COMPLETED FMS
The FMS completed to date give objectives (OB) and management responses (MR) relevant to this resource assessment framework. The main ones are included below.
2.1 Estuary General
OB 2.1 To ensure that the quantity and composition (e.g. size, age, sex) of harvested fish of each species does not result in over-fishing.
MR 2.1(b) Monitor total commercial landings in each estuary (by species) and evaluate, where available, landings by other sectors and in adjacent State or Commonwealth fisheries.
MR 2.1 (c) Promote research that contributes to more robust and reliable fish stock assessments and continue to involve the Estuary General MAC in prioritising research programs.
MR 2.1 (d) Continue to use size limits on selected species to prevent the exploitation of juvenile, subadult and, where appropriate, mature fish.
MR 2.1 (e) Consider the need for minimum legal lengths for key secondary and secondary species.
OB 2.1.1 To maintain the stock of the primary species (yellowfin bream, sand whiting, dusky flathead, sea (bully) mullet, luderick, eels, mud crabs, school prawns, king prawns and pipis) at or above a level that minimises the risk of over-fishing.
MR 2.1.1 (a) Review and where appropriate implement minimum legal lengths for the primary finfish species to give a high probability that at least 50% of the fish of each particular species landed have reached reproductive maturity (unless alternative strategies apply to individual species).
MR 2.1.1 (b) Monitor the total commercial landings of each primary species annually for comparison against reference levels (see Table 17).
MR 2.1.1 (c) Develop a system for and conduct a formal stock assessment of the primary species within five years and review the assessment at least every three years thereafter.
MR 2.1.1 (d) The Minister for Fisheries will require the Total Allowable Catch Setting and Review Committee to make determinations relating to the maximum level of effort that may be applied to prawn stocks, after receiving advice from the Estuary General MAC and other stakeholders.
OB 2.1.2 To maintain local (catchment based) populations of glass eels and adult eels.
MR 2.1.2 (a) Monitor commercial landings of adult longfin and shortfin eels in each catchment.
MR 2.1.2 (b) Evaluate the quantity of eels taken for aquaculture purposes within stock assessment and monitoring processes.
OB 2.1.3 To contribute to the sustainability of the mud crab stock and to prevent localised depletion of mud crab populations in NSW waters.
MR 2.1.3 (a) Monitor commercial landings of mud crabs in each estuary.
NSW DPI - Fish. Res. Assess. Ser. 15

Resource Assessment Framework 79
OB 2.1.4 To detect fluctuations in commercial landings of the following key secondary species, and other secondary species, beyond reference points: mulloway, silver biddy, flat tail mullet, river garfish, trumpeter whiting, blue swimmer crabs, greasyback prawn, cockles and beachworms.
MR 2.1.4 (a) Monitor the total commercial landings of each key secondary species and species subsequently identified as requiring additional monitoring as a result of implementing management response 1.3c annually for comparison against reference levels.
MR 2.1.4 (b) Monitor the commercial landings of all other secondary species taken in the fishery annually for comparison against an historical range for each of those species.
MR 2.1.4 (c) Develop an objective system for defining and setting trigger points to detect concerning trends in landings of all species permitted to be taken in the Estuary General Fishery.
OB 2.5 To promote the recovery of over-fished species.
MR 2.5 (a) Where the fishery is a major harvester of an over-fished species, develop and implement a recovery program for the species within a specified timeframe.
MR 2.5 (b) Where the fishery is a minor harvester of an over-fished species, contribute to the development of a recovery program for the species and adopt any measures required by that program.
2.2 Ocean Haul
OB 2.1 To ensure that the quantity and composition (e.g. size, age, sex) of species harvested does not result in over-fishing.
OB 2.1.1 To maintain the stock of the target species: yellowfin bream, yellowtail, blue mackerel, sea garfish, luderick, sea mullet, pilchards, sweep, dart, jack mackerel, bonito, silver trevally, Australian salmon, sandy sprats (whitebait), anchovy and sand whiting at or above a level that minimises the risk of over-fishing.
MR 2.1.1 (a) Monitor the quantity, length, age and sex composition of commercial landings of the target species of the Ocean Hauling Fishery.
MR 2.1.1 (b) Develop stock assessments of target species within five years and ensure the assessments are reviewed every three years thereafter.
MR 2.1.1 (d) Continue to use size limits on selected species to prevent the exploitation of juvenile or subadult and/or mature fish as appropriate.
OB 2.5 To promote the recovery of over-fished species.
MR 2.5(a) Where the fishery is a major harvester of an over-fished species, develop and implement a recovery program for the species within a specified timeframe.
MR 2.5 (b) Where the fishery is a minor harvester of an over-fished species, contribute to the development of a recovery program for the species and adopt any measures required by that program.
OB 2.5.2 To actively promote research programs that will improve stock assessment of sea garfish.
MR 2.5 (l) Continue existing programs on garfish assessment and monitoring and where appropriate make grant applications to expand those programs.
NSW DPI - Fish. Res. Assess. Ser. 15

80 Resource Assessment Framework
2.3 Estuary Prawn Trawl
OB 2.1 To maintain the stocks of target and byproduct species of the Estuary Prawn Trawl Fishery at or above a level that minimises the risk of over-fishing.
MR 2.1 (a) Monitor the quantity, length, and/or age and sex composition of target and byproduct species caught in the Estuary Prawn Trawl Fishery.
MR 2.1 (b) Together with all harvest sectors of squid in NSW review the exploitation status of the squid resources.
MR 2.1 (c) Promote research that contributes to more robust and reliable stock assessments of prawn and squid populations and through the Estuary Prawn Trawl MAC prioritise research programs.
MR 2.1 (e) Review the maximum counts for eastern king and school prawns in light of available information and information collected between 2002 and 2005 on the growth and mortality of school prawns.
MR 2.1 (f) Ascertain the need for a legal minimum length for squid and implement as required.
MR 2.1 (h) Develop a system for and do formal stock assessments of the target species within five years and review the system of assessment at least every three years thereafter.
MR 2.1 (i) Having regard to the prioritisation of research projects related to the Estuary Prawn Trawl Fishery, develop a strategic approach for ascertaining the status of byproduct species taken in the fishery.
OB 2.2 To achieve levels of spawner biomass on a stock basis that will reduce the risk of recruitment over-fishing.
MR 2.2 (a) Encourage other prawn harvest sectors to adopt an appropriate level of fishing effort on the spawning stocks of target species.
OB 2.3 To conserve shellfish stocks by managing levels of active effort in the fishery.
MR 2.3 (a) Implement separate management rules for each estuary open to prawn trawling.
MR 2.3 (b) The Minister for Fisheries will require the Total Allowable Catch Setting and Review Committee to make determinations relating to the maximum level of effort exerted upon the target species in connection with this fishery, after considering submissions and advice from the public, management advisory committees and other stakeholders.
OB 2.6 To promote the recovery of over-fished species.
MR 2.6 (a) Where the fishery is a major harvester of an over-fished species, develop and implement a recovery program for the species within a specified timeframe.
MR 2.6 (b) Where the fishery is a minor harvester of an over-fished species, contribute to the development of a recovery program for the species and adopt any measures required by that program.
NSW DPI - Fish. Res. Assess. Ser. 15

Resource Assessment Framework 81
2.4 All Strategies
2.4.1 e) Monitoring performance of stock assessment
Within 12 months of the commencement of the management strategy a stock assessment process for primary species will be proposed. The process needs to be appropriate for the data available and the value of this fishery. This will be the long-term approach that will be used to assess the primary species of this fishery. Two principles will apply to the long-term proposal for stock assessments:
• assessment methods will be consistent with the data (i.e. the assessment program design will not rely on data sources that are not funded);
• assessment methods will be at least equivalent to approaches for fisheries of similar value in other Australian jurisdictions.
The exact methods that will be proposed may require the development of novel approaches. Trigger points will be an integral component of the stock assessment proposal for each species. Peer review of the assessment methods will be completed within three years of the proposal being developed, with the following terms of reference, to:
• report upon the technical soundness of the assessment methods proposed;
• report upon the cost-effectiveness of the assessment methods proposed;
• indicate if the assessment process will be likely provide timely information for the management of the fishery;
• report upon the conditions where the assessment process is likely to be unsatisfactory;
• recommend revisions to the proposed approach including additional data collection strategies that should be considered.
The schedule for providing stock assessments cannot and should not be the same for all primary species. Priorities for each species should be determined in consultation with the assessment scientists and the appropriate MACs. The Estuary General MAC will be briefed on information used in the stock assessment process and other research outcomes relevant to the fishery. This information will be used in the preparation of NSW Fisheries’ status reports.
2.5 Other Comments
The first iteration of this resource assessment framework contributes to the solution of these requirements and pre-empts developments in the FMS for the OTL and OTF Fisheries.
There has been a formal commitment in the FMS to review the stock assessment process by 2005. External reviews of this draft document now will be the first step towards achieving that goal. Recommendations resulting from this initial review will be addressed in the subsequent iteration of this assessment framework.
Note that the completed FMS only require (the equivalent of) Class Four assessments until better stock assessment processes are in place. The first iteration of the resource assessment reporting (completed in 2004) will therefore present Class Four Species Reports for all primary and target species in the EG, EPT and OH fisheries. Recommended revisions to indicators will also be included.
NSW DPI - Fish. Res. Assess. Ser. 15

82 Resource Assessment Framework
3 TABLE SUMMARISING THE PROPOSED RESOURCE ASSESSMENT CLASSES FOR HARVESTED SPECIES
3.1 Table Notes
3.1.1 Value within the commercial fishery (based upon 2000/01 landings)
• Greater than $500 000 (High).
• Greater than $100 000 (Medium).
• Less than $100 000 (Low).
• Less than $1000 (ignored).
3.1.2 Value within the recreational fishery (based upon results from the National Recreational and Indigenous Fishing Survey)
• Greater than 100 000 fish (High).
• Less than 100 000 but greater than 10 000 fish (Medium).
• Less than 10 000 fish caught (Low).
• Less than 1000 fish (ignored).
3.1.3 Risk Ratings
• EIS risk rating is taken from Table E4 or Figure B2.5 of the EIS.
NSW DPI - Fish. Res. Assess. Ser. 15

Spec
ies
Fi
sher
y(V
alue)
Re
sour
ce
Asse
ssm
ent
Clas
s
FMS
Clas
sifica
tion
(SAP
: Sto
ck
Asse
ssm
ent P
riorit
y)
EIS
Risk
Rat
ing
Indi
cato
rs
Com
men
ts
Abalo
ne
AB(H
)RE
C ()
1 Pr
imar
y spe
cies A
B
Surve
ys of
ab
unda
nce a
nd
size s
tructu
re
Catch
Cp
ue
Clas
s one
asse
ssme
nt is
alrea
dy in
plac
e. Ca
tch se
t by t
he T
AC C
ommi
ttee.
Anch
ovy
OH(L
)EG
(L)
3 Ta
rget
spec
ies O
H OH
SAP
#14
High
OH
Catch
Cp
ue
Austr
alian
Sa
lmon
OH
(H)
EG (L
) OT
L (L)
RE
C (H
)
2 Ta
rget
spec
ies O
H OH
SAP
#8
High
OH
Catch
Cp
ue
Age/L
ength
Balm
ain B
ug
OPT
(M)
FT (L
) RE
C ()
ALL (
M)
3 Pr
imar
y spe
cies O
TF
OTF
SAP
#6
Inter
media
te OT
F Ca
tch
Cpue
Le
ngth
Beac
hwor
m
EG (L
)RE
C ()
3 Ke
y sec
. spe
cies E
G Lo
w EG
Ca
tch
Cpue
Blue
-eye
OT
L(H)
EG (L
) 2
Prim
ary s
pecie
s OTL
OT
L SAP
#9
Inter
media
te OT
L Ca
tch
Cpue
Le
ngth
Boar
fish
OPT
(L)
FT (L
) 4
Int
erme
diate
OTF
Catch
Cpue
Bonit
o
OT
L(H)
EG (L
) OH
(L)
REC
()
2 Pr
imar
y spe
cies O
TL
Targ
et sp
ecies
OH
OH S
AP #1
5 OT
L SAP
#5
High
OH
Mode
ratel
y-High
OTL
Ca
tch
Cpue
Ag
e/Len
gth
NSW
DPI
- Fi
sh. R
es. A
sses
s. Se
r. 15
83

Spec
ies
Fish
ery
(Valu
e)
Reso
urce
As
sess
men
t FM
S Cl
assif
icatio
n (S
AP: S
tock
EI
S Ri
sk R
atin
g In
dica
tors
Co
mm
ents
Clas
s As
sess
men
t Prio
rity)
Br
eam,
Ye
llowf
in EG
(H)
OH (M
) OT
L (M)
FT
(L)
OPT
(L)
REC
(H)
IFS
(?)
2 Pr
imar
y spe
cies E
G Ta
rget
spec
ies O
H
OH S
AP #9
Pr
imar
y spe
cies O
TL
OTL S
AP #1
1
Inter
media
te EG
Me
dium
OH
Inter
media
te OT
F Int
erme
diate
OTL
Catch
Cp
ue
Age/L
ength
Bulls
eye,
Red
OPT
(VL)
EG
(VL)
OT
L (VL
) FT
(VL)
3 By
prod
uct s
pecie
s EPT
Hi
gh E
PT
Catch
Cp
ue
Two s
pecie
s in E
PT
Catfis
h
EG
(L)
REC
(M)
3 By
prod
uct s
pecie
s EPT
By
prod
uct s
pecie
s LOB
Inter
media
te EG
Hi
gh E
PT
Catch
Cp
ue
Spec
ies co
mplex
inc.
estua
ry ca
tfish
Catfis
h, Fo
rk-tai
led
EG (L
) 4
Bypr
oduc
t spe
cies E
PT
Ca
tch
Cpue
Catfis
h, St
riped
4 By
prod
uct s
pecie
s EPT
Catch
Cp
ue
Catsh
arks
4 By
prod
uct s
pecie
s LOB
Catch
Cp
ue
Cock
le
EG
(M)
REC
() 4
Key s
ec. s
pecie
s EG
Inter
media
te EG
Ca
tch
Cpue
Sp
ecies
comp
lex
Cod,
Bar
OTL (
M)
OPT
(L)
FT (L
)
3 Pr
imar
y spe
cies O
TL
OTL S
AP #1
0 By
prod
uct s
pecie
s LOB
Inter
media
te OT
L Ca
tch
Cpue
Le
ngth
NSW
DPI
- Fi
sh. R
es. A
sses
s. Se
r. 15
84

Spec
ies
Fish
ery
(Valu
e)
Reso
urce
As
sess
men
t FM
S Cl
assif
icatio
n (S
AP: S
tock
EI
S Ri
sk R
atin
g In
dica
tors
Co
mm
ents
Clas
s As
sess
men
t Prio
rity)
Cr
ab, B
lue
Swim
mer
EG (H
) OP
T (M
) EP
T (L
) FT
(L)
OTL (
L)
REC
()
3 Ke
y sec
. spe
cies E
G Ke
y sec
. spe
cies O
TF
Byp
rodu
ct s
peci
es
EPT
Inter
media
te EG
Hi
gh E
PT
Low
OTF
Catch
Cp
ue
Leng
th
Histo
ric ca
tches
mixe
d with
spott
ed an
d san
d cra
bs
Crab
, Her
mit
4
Bypr
oduc
t spe
cies L
OB
Ca
tch
Cpue
Crab
, Mud
EG
(H)
EPT
(L)
OPT
(L)
REC
()
2 Pr
imar
y spe
cies E
G By
prod
uct s
pecie
s EPT
Inter
media
te EG
Hi
gh E
PT
Catch
Cp
ue
Leng
th
Over
flow
of Ql
d stoc
k
Crab
, San
d OP
T (L
) OT
L (L)
FT
(L)
EG (L
)
3 By
prod
uct s
pecie
s EPT
Hi
gh E
PT
Catch
Cp
ue
Leng
th
Nome
nclat
ure i
ssue
with
blue
swim
mer c
rab
Crab
, Spa
nner
OT
L (H)
OP
T (L
) 2
Prim
ary s
pecie
s OTL
OT
L SAP
#4
Inter
media
te OT
L Ca
tch
Cpue
Su
rveys
Le
ngth
Most
of thi
s stoc
k is i
n Que
ensla
nd
Subje
ct to
joint
NSW
/Qld
surve
y pro
gram
Cuttle
fish
OPT
(M)
FT (M
) OT
L (L)
EG
(L)
REC
()
3 Pr
imar
y spe
cies O
TF
OTF
SAP
#10
Bypr
oduc
t spe
cies L
OB
Inter
media
te OT
F Ca
tch
Cpue
Sp
ecies
comp
lex
Dart
OH(L
)EG
(L)
REC
(H)
3 Ta
rget
spec
ies O
H OH
SAP
#12
High
OH
Catch
Ag
e? (Q
ld)
Leng
th (Q
ld)
D Mc
Phee
PhD
(UQ)
Dolph
in fis
h OT
L (L)
RE
C (M
) 3
Key s
ec. s
pecie
s OTL
Mo
dera
tely-H
igh O
TL
Catch
Cp
ue
Dory,
John
FT
(M)
OPT
(L)
3 Ke
y sec
. spe
cies O
TF
Bypr
oduc
t spe
cies E
PT
High
EPT
Int
erme
diate
OTF
Catch
Cp
ue
Leng
th
NSW
DPI
- Fi
sh. R
es. A
sses
s. Se
r. 15
85

Spec
ies
Fish
ery
(Valu
e)
Reso
urce
As
sess
men
t FM
S Cl
assif
icatio
n (S
AP: S
tock
EI
S Ri
sk R
atin
g In
dica
tors
Co
mm
ents
Clas
s As
sess
men
t Prio
rity)
Do
ry, M
irror
FT
(L)
OPT
(L)
3 Ke
y sec
. spe
cies O
TF
Low
OTF
Catch
Cp
ue
Eel, L
ongfi
n Ri
ver
EG (M
) RE
C (L
) 2
Prim
ary s
pecie
s EG
Int
erme
diate
EG
Catch
Cp
ue
Recru
it Ind
ex of
gla
ss ee
ls?
Subje
ct to
FRDC
Pro
ject
YPR
Mode
l Glas
s eel
harve
st
Eel, S
hortf
in Ri
ver
Prim
ary s
pecie
s EG?
Int
erme
diate
EG
Catch
Cp
ue
Recru
it Ind
ex of
gla
ss ee
ls?
Confo
undin
g of la
nding
s with
long
fin ee
l
Flathe
ad, D
usky
EG
(H)
OPT
(L)
FT (L
) RE
C (H
) IF
S (?
)
2 Pr
imar
y spe
cies E
G Int
erme
diate
EG
Low
OTF
Catch
Cp
ue
Age
Leng
th
Subs
tantia
l leng
th/ag
e data
sets
avail
able
Flathe
ad, S
and
FT (M
) OP
T (M
) EG
(L)
OTL (
L)
REC
(M?)
2 Pr
imar
y spe
cies O
TF
OTF
SAP
#5
Inter
media
te OT
F Ca
tch
Cpue
Le
ngth
Flathe
ad, T
iger
FT (M
) OP
T (L
) RE
C ()
2 Pr
imar
y spe
cies O
TF
OTF
SAP
#8
Low
OTF
Catch
Cp
ue
Age
Leng
th
Mostl
y a C
ommo
nwea
lth fis
hery
Floun
der
OPT
(L)
FT (L
) EP
T (L
) EG
(L)
REC
(M)
4 Ke
y sec
. spe
cies O
TF
Bypr
oduc
t spe
cies E
PT
High
EPT
Lo
w OT
F
Catch
Cp
ue
Spec
ies co
mplex
incl.
(EPT
) Sma
ll-too
thed a
nd la
rge-
tooth
floun
der
Garfis
h, Ri
ver
EG (M
) RE
C (M
?)
3 Ke
y sec
. spe
cies E
G Int
erme
diate
EG
Catch
Cp
ue
Age
Leng
th
NSW
DPI
- Fi
sh. R
es. A
sses
s. Se
r. 15
86

Spec
ies
Fish
ery
(Valu
e)
Reso
urce
As
sess
men
t FM
S Cl
assif
icatio
n (S
AP: S
tock
EI
S Ri
sk R
atin
g In
dica
tors
Co
mm
ents
Clas
s As
sess
men
t Prio
rity)
Ga
rfish,
Sea
OH (M
) EG
(L)
REC
(H?)
3 Ta
rget
spec
ies O
H OH
SAP
#2
Extre
me O
H Ca
tch
Cpue
Ag
e Le
ngth
FRDC
proje
ct Su
bject
to a r
ecov
ery p
rogr
amme
Gemf
ish
OTL(
M)FT
(L)
3 Ke
y sec
. spe
cies O
TL
High
OTL
Ca
tch
Cpue
Le
ngth
Mostl
y a C
ommo
nwea
lth fis
hery
Grop
er, B
ass
3
Key s
ec. s
pecie
s OTL
Lo
w OT
L Ca
tch
Cpue
Le
ngth
Hairta
il
EG
(M)
OTL (
L)
FT (L
) EP
T (L
) RE
C ()
3 By
prod
uct s
pecie
s EPT
Hi
gh E
PT
Catch
Cp
ue
Hapu
ku
3
Key s
ec. s
pecie
s OTL
Lo
w OT
L Ca
tch
Cpue
King
fish,
Yello
wtail
OT
L (H)
EG
(L)
OPT
(L)
OH (L
) RE
C (M
?)
2 Pr
imar
y spe
cies O
TL
OTL S
AP #7
Mode
ratel
y-High
OTL
Ca
tch
Cpue
Le
ngth
Latch
et
FT(L
)
OPT
(L)
REC
(M)
3 Ke
y sec
. spe
cies O
TF
Mod H
igh O
TF
Catch
Cp
ue
Gurn
ard (
spec
ies id
entifi
catio
n/lab
elling
) Gr
owth
over
-fishe
d
Leath
erjac
ket
OT
L (M)
FT (L
) EG
(L)
OPT
(L)
REC
(H)
2 Pr
imar
y spe
cies O
TL
Key s
ec. s
pecie
s OTF
By
prod
uct s
pecie
s LOB
OT
L SAP
#3
Inter
media
te EG
Mo
dera
tely-H
igh O
TF
Mode
ratel
y-High
OTL
Catch
Cp
ue
Leng
th
Spec
ies co
mplex
Mo
st lan
dings
wou
ld be
ocea
n lea
therja
cket
NSW
DPI
- Fi
sh. R
es. A
sses
s. Se
r. 15
87

Spec
ies
Fish
ery
(Valu
e)
Reso
urce
As
sess
men
t FM
S Cl
assif
icatio
n (S
AP: S
tock
EI
S Ri
sk R
atin
g In
dica
tors
Co
mm
ents
Clas
s As
sess
men
t Prio
rity)
Lo
bster
, Eas
tern
Rock
LO
B (H
) RE
C ()
1 Pr
imar
y spe
cies L
OB
Cp
ue
Leng
th Re
cruit I
ndex
Clas
s one
asse
ssme
nt is
alrea
dy in
plac
e. Ca
tch se
t the T
AC C
ommi
ttee.
Lude
rick
EG(H
)OH
(L)
REC
(H)
2 Pr
imar
y spe
cies E
G
Targ
et sp
ecies
OH
OH S
AP #1
0
Inter
media
te EG
Me
dium
OH
Cpue
Ca
tch
Ages
Le
ngths
3 Rec
Tru
st fun
ded p
rojec
t und
erwa
y
Mack
erel,
Blue
OH
(H)
OTL (
L)
FT (L
) RE
C (M
?)
3 Ta
rget
spec
ies O
H
OH S
AP #5
High
OH
Catch
Cp
ue
Age
Leng
th
FRDC
Stud
y
Mack
erel,
Jack
OH
(L)
OTL (
L)
FT (L
) RE
C (L
?)
3 Ta
rget
spec
ies O
H OH
SAP
#16
High
OH
Catch
Cp
ue
Mostl
y a C
ommo
nwea
lth fis
hery
Mack
erel,
Na
rrow-
Barre
d Sp
anish
OTL (
L)
3 Ke
y sec
. spe
cies O
TL
Low
OTL
Catch
Cp
ue
Mack
erel,
Sp
otted
OT
L (M)
3
Key s
ec. s
pecie
s OTL
Int
erme
diate
OTL
Catch
Cp
ue
Moon
fish
OPT
(L)
FT (L
) 4
Key s
ec. s
pecie
s OTF
Mo
d. Hi
gh O
TF
Catch
Cp
ue
Two s
pecie
s Re
cord
ed as
opah
Mo
rwon
g, Ja
ckas
s OT
L (M)
FT
(L)
REC
(H?)
3 Ke
y sec
. spe
cies O
TL
Inter
media
te OT
L Ca
tch
Cpue
Le
ngth
Morw
ong,
Rubb
erlip
OT
L (M)
FT
(L)
OPT
(L)
REC
(M?)
3 Pr
imar
y spe
cies O
TL
Key s
ec. s
pecie
s OTF
OT
L SAP
#2
Mod.
High
OTF
Int
erme
diate
OTL
Catch
Cp
ue
Leng
th
Mulle
t, Fan
tail
EG (L
) OH
(L)
REC
(L?)
3
Int
erme
diate
EGCa
tchCp
ue
Also
sand
mull
et
NSW
DPI
- Fi
sh. R
es. A
sses
s. Se
r. 15
88

Spec
ies
Fish
ery
(Valu
e)
Reso
urce
As
sess
men
t FM
S Cl
assif
icatio
n (S
AP: S
tock
EI
S Ri
sk R
atin
g In
dica
tors
Co
mm
ents
Clas
s As
sess
men
t Prio
rity)
Mu
llet, F
lat T
ail
3
Key s
ec. s
pecie
s EG
Inter
media
te EG
Ca
tch
Cpue
Mulle
t, Red
OP
T (M
) FT
(L)
OTL (
L)
EG (L
) RE
C (L
?)
3 Ke
y sec
. spe
cies O
TF
Low
OTF
Catch
Cp
ue
Mulle
t, Sea
EG
(H)
OH (H
) RE
C (H
) IF
S (?
)
2 Pr
imar
y spe
cies E
G
Targ
et sp
ecies
OH
OH
SAP
#1
Inter
media
te EG
Hi
gh O
H
Catch
Cp
ue
Age
Leng
th
Roe f
isher
y in O
H Ex
tensiv
e data
avail
able
in Qu
eens
land
Mullo
way
EG(M
)OT
L (M)
OH
(L)
FT (L
) OP
T (L
) RE
C (M
)
3 Ke
y sec
. spe
cies E
G Ke
y sec
. spe
cies O
TL
Inter
media
te EG
Int
erme
diate
OTL
Catch
Cp
ue
Leng
th
FRDC
stud
y
Octop
us
OPT
(H)
FT (M
) OT
L (L)
EG
(L)
EPT
(L)
REC
()
3 By
prod
uct s
pecie
s EPT
Pr
imar
y spe
cies O
TF
Bypr
oduc
t spe
cies L
OB
OTF
SAP
#9
High
EPT
Lo
w OT
F
Cpue
Ca
tch
Spec
ies co
mplex
Old M
aid
EG (L
) 4
Int
erme
diate
EG
Cpue
Ca
tch
Parro
tfish
OTL(
L)RE
C (M
) 4
Cpue
Catch
Re
c. inc
ludes
tusk
fish
Perch
, Oce
an
FT (L
) OT
L (L)
OP
T (L
)
3 By
prod
uct s
pecie
s LOB
Mo
dera
tely-H
igh O
TF
Catch
Cp
ue
Leng
th
NSW
DPI
- Fi
sh. R
es. A
sses
s. Se
r. 15
89

Spec
ies
Fish
ery
(Valu
e)
Reso
urce
As
sess
men
t FM
S Cl
assif
icatio
n (S
AP: S
tock
EI
S Ri
sk R
atin
g In
dica
tors
Co
mm
ents
Clas
s As
sess
men
t Prio
rity)
Pe
rch, P
earl
OTL (
L)
FT (L
) OP
T (L
) RE
C (M
)
3 Ke
y sec
. spe
cies O
TL
Mode
ratel
y-High
OTL
Ca
tch
Cpue
Le
ngth
Pigfi
sh, B
lack-
spot
OTL (
M)
REC
(M)
3 Ke
y sec
. spe
cies O
TL
Bypr
oduc
t spe
cies L
OB
Mode
ratel
y-High
OTL
Ca
tch
Cpue
Le
ngth
Pike
EG
(L)
REC
(M)
4
High
EPT
Catch
Cpue
Re
c. als
o sno
ok
Pilch
ard
OH
(M)
EP
T (L
) EG
(L)
3 Ta
rget
spec
ies O
H OH
SAP
#6
High
OH
Catch
Cp
ue
Pipis
EG
(H)
REC
() 3
Prim
ary s
pecie
s EG
Inter
media
te EG
Ca
tch
Cpue
Le
ngth
Bio-
toxin
mana
geme
nt pla
ns
Praw
n, Ea
stern
Ki
ng
OPT
(H)
EG (H
) EP
T (M
) RE
C ()
1 Pr
imar
y spe
cies E
G Pr
imar
y spe
cies O
TF
OTF
SAP
#1
Targ
et sp
ecies
EPT
Inter
media
te EG
Hi
gh E
PT
Mode
ratel
y high
OTF
Catch
Cp
ue
Leng
th
Juris
dictio
nal is
sues
with
Qld
Asse
ssme
nt is
curre
ntly s
ubjec
t to an
ARC
Link
age p
rojec
t
Praw
n, Gr
easy
back
EG
(L)
3 Ke
y sec
. spe
cies E
G By
prod
uct s
pecie
s EPT
Inter
media
te EG
Hi
gh E
PT
Catch
Cp
ue
Leng
th
Praw
n, Re
d Ro
yal
OPT
(H)
FT (L
) RE
C ()
3 Pr
imar
y spe
cies O
TF
OTF
SAP
#7
Inter
media
te OT
F Ca
tch
Cpue
Ju
risdic
tiona
l issu
es w
ith C
ommo
nwea
lth
NSW
DPI
- Fi
sh. R
es. A
sses
s. Se
r. 15
90

Spec
ies
Fish
ery
(Valu
e)
Reso
urce
As
sess
men
t FM
S Cl
assif
icatio
n (S
AP: S
tock
EI
S Ri
sk R
atin
g In
dica
tors
Co
mm
ents
Clas
s As
sess
men
t Prio
rity)
Pr
awn,
Scho
ol
EPT
(H)
OPT
(H)
EG (H
) RE
C ()
1 Pr
imar
y spe
cies E
G Pr
imar
y spe
cies O
TF
OTF
SAP
#2
Inter
media
te EG
Hi
gh E
PT
Mode
ratel
y high
OTF
Catch
Cp
ue
Subje
ct to
FRDC
proje
ct Su
bject
to mo
dellin
g with
the A
RC-L
inkag
e Pro
ject
Praw
n, Tig
er
EG (L
) OP
T (L
) FT
(L)
3 By
prod
uct s
pecie
s EPT
Hi
gh E
PT
Catch
Cp
ue
Redfi
sh
FT(L
)OT
L (L)
OP
T (L
) RE
C (H
)
3 Ke
y sec
. spe
cies O
TF
Bypr
oduc
t spe
cies L
OB
Mod.
High
OTF
Ca
tch
Cpue
Gr
owth
over
-fishe
d Mo
stly C
ommo
nwea
lth fis
hery
Scad
, Yell
owtai
l OH
(H)
OTL (
L)
EG (L
) FT
(L)
OPT
(L)
EPT
(L)
REC
()
2 Ta
rget
spec
ies O
H OH
SAP
#3
Bypr
oduc
t spe
cies E
PT
Low
EG
Mediu
m EP
T Hi
gh O
H Lo
w OT
F
Catch
Cp
ue
Leng
th
Also
refer
red t
o as “
yello
wtail
”
Shar
k, An
gel
FT (L
) OP
T (L
) 3
Key s
ec. s
pecie
s OTF
Hi
gh O
TF
Catch
Cp
ue
Leng
th
Shar
k, Do
gfish
En
deav
our
FT (L
) OP
T (L
) OT
L (L)
3 Co
nside
red w
ithin
mixe
d sh
arks
Hi
gh O
TF
Catch
Cp
ue
Surve
ys
Spec
ies id
entifi
catio
n iss
ues
Shar
k, Do
gfish
Gr
eene
ye
FT (L
) OP
T (L
) OT
L (L)
3 Co
nside
red w
ithin
mixe
d sh
arks
Hi
gh O
TF
Catch
Cp
ue
Surve
ys
Spec
ies id
entifi
catio
n iss
ues
Targ
et sp
ecies
EPT
NSW
DPI
- Fi
sh. R
es. A
sses
s. Se
r. 15
91

Spec
ies
Fish
ery
(Valu
e)
Reso
urce
As
sess
men
t FM
S Cl
assif
icatio
n (S
AP: S
tock
EI
S Ri
sk R
atin
g In
dica
tors
Co
mm
ents
Clas
s As
sess
men
t Prio
rity)
Sh
ark,
Fiddle
r FT
(M)
OPT
(L)
OTL (
L)
EG (L
) RE
C (L
?)
2 Pr
imar
y spe
cies O
TF
OTF
SAP
#4
High
OTF
Ca
tch
Cpue
Le
ngth
Mostl
y sho
vel n
osed
ray
Shar
k, Gu
mmy
FT (L
) OP
T (L
) OT
L (L)
EG
(L)
4 Co
nside
red w
ithin
mixe
d sh
arks
(OTF
) Pr
imar
y spe
cies O
TL
OTL S
AP #6
Inter
media
te OT
F Int
erme
diate
OTL
Catch
Cp
ue
Spec
ies id
entifi
catio
n iss
ues
Shar
k, Sa
w FT
(L)
OPT
(L)
3 Ke
y sec
. spe
cies O
TF
High
OTF
Ca
tch
Cpue
Le
ngth
Spec
ies co
mplex
Sp
ecies
iden
tifica
tion i
ssue
s
Shar
k, W
haler
OT
L (M)
OP
T (L
) EG
(L)
4
Cpue
Sp
ecies
iden
tifica
tion i
ssue
s Cp
ue fr
om ga
mefis
hing d
ataba
se
Shar
k, W
obbe
gong
OT
L (M)
OP
T (L
) FT
(L)
EG (L
) RE
C ()
3 Ke
y sec
. spe
cies O
TL
Bypr
oduc
t spe
cies L
OB
Inter
media
te OT
F Hi
gh O
TL
Catch
Cp
ue
Carp
et sh
arks
Sp
ecies
iden
tifica
tion i
ssue
s
Shar
ks, M
ixed
3
Key s
ec. s
pecie
s OTF
Hi
gh O
TF
High
OTL
Catch
Cp
ue
Spec
ies co
mplex
Sp
ecies
iden
tifica
tion i
ssue
s
Shrim
p, Ma
ntis
EPT
(L)
3 By
prod
uct s
pecie
s EPT
Hi
gh E
PT
Catch
Cp
ue
Silve
r Bidd
y EG
(M)
EPT
(L)
FT (L
) OH
(L)
REC
(L)
3 Ke
y sec
. spe
cies E
G By
prod
uct s
pecie
s EPT
Inter
media
te EG
Hi
gh E
PT
Low
OTF
Catch
Cp
ue
Leng
th
NSW
DPI
- Fi
sh. R
es. A
sses
s. Se
r. 15
92

Spec
ies
Fish
ery
(Valu
e)
Reso
urce
As
sess
men
t FM
S Cl
assif
icatio
n (S
AP: S
tock
EI
S Ri
sk R
atin
g In
dica
tors
Co
mm
ents
Clas
s As
sess
men
t Prio
rity)
Sn
appe
r
OT
L(H)
EG (L
) FT
(L)
OPT
(L)
REC
(H)
2 Pr
imar
y spe
cies O
TL
OTL S
AP #1
Mode
ratel
y-High
OTL
Ca
tch
Cpue
Ag
e Le
ngth
Sole,
Blac
k OP
T (L
) 4
Bypr
oduc
t spe
cies E
PT
High
EPT
Ca
tch
Cpue
Sole,
Mixe
d OP
T (L
) FT
(L)
4 Ke
y sec
. spe
cies O
TF
Low
OTF
Cpue
Ca
tch
Spec
ies id
entifi
catio
n iss
ues
South
ern
Calam
ari
FT (H
) OP
T (L
) EG
(L)
OTL (
L)
OH (L
) RE
C ()
3 By
prod
uct s
pecie
s EPT
Pr
imar
y spe
cies O
TF
OTF
SAP
#11
Low
OTF
Catch
Cp
ue
Leng
th
Squid
OP
T(L
)EP
T (L
) EG
(L)
FT (L
) OT
L (L)
RE
C ()
3 Ta
rget
spec
ies E
PT
Key s
ec. s
pecie
s OTF
Inter
media
te EG
Hi
gh E
PT
Inter
media
te OT
F
Catch
Cp
ue
K O’
Donn
ell P
hD (U
Syd
) Sp
ecies
comp
lex in
OTF
EP
T tar
get b
road
squid
and b
ottle
squid
EP
T by
prod
uct a
rrow,
slen
der,
bottle
, bub
ble, c
andy
-strip
ed
Strin
gray
FT(L
)EG
(L)
OTL (
L)
4Int
erme
diate
OTF
Catch
Cpue
Sp
ecies
iden
tifica
tion i
ssue
s Ea
gle ra
ys
Swee
p, Si
lver
OTL (
L)
OH (L
) RE
C (M
)
3 OH
SAP
#4
Targ
et sp
ecies
OH
Key s
ec. s
pecie
s OTL
By
prod
uct s
pecie
s LOB
High
OH
Mode
ratel
y-High
OTL
Cpue
Le
ngth
Catch
NSW
DPI
- Fi
sh. R
es. A
sses
s. Se
r. 15
93

Spec
ies
Fish
ery
(Valu
e)
Reso
urce
As
sess
men
t FM
S Cl
assif
icatio
n (S
AP: S
tock
EI
S Ri
sk R
atin
g In
dica
tors
Co
mm
ents
Clas
s As
sess
men
t Prio
rity)
Ta
ilor
OH
(M)
EG (M
) OT
L (L)
FT
(L)
OPT
(L)
REC
(H)
3Int
erme
diate
EGCa
tchCp
ue
Leng
th
Tarw
hine
EG
(M)
FT
(L)
OTL (
L)
OH (L
) OP
T (L
) RE
C (M
)
3Int
erme
diate
EG Lo
w OT
F
Cpue
Le
ngth
Catch
Tera
glin
OTL(
M)FT
(L)
OPT
(L)
REC
(M)
3 Ke
y sec
. spe
cies O
TL
Inter
media
te OT
L Ca
tch
Cpue
Le
ngth
Trev
ally,
Silve
r OT
L (M)
FT
(M)
EG (L
) OH
(L)
REC
(H)
2 Pr
imar
y spe
cies O
TL
Prim
ary s
pecie
s OTF
Ta
rget
spec
ies O
H OH
SAP
#7
OTF
SAP
#12
OTL S
AP #8
By
prod
uct s
pecie
s LOB
High
EG
High
OH
Mode
ratel
y Hi
gh O
TF
Mode
ratel
y-High
OTL
Catch
Cp
ue
Leng
th
Subje
ct to
reco
very
prog
ram
Trum
peter
, St
riped
EG
(L)
OTL (
L)
FT (L
) RE
C (L
)
4 By
prod
uct s
pecie
s EPT
Hi
gh E
PT
Low
OTF
Catch
Cp
ue
NSW
DPI
- Fi
sh. R
es. A
sses
s. Se
r. 15
94

Spec
ies
Fish
ery
(Valu
e)
Reso
urce
As
sess
men
t FM
S Cl
assif
icatio
n (S
AP: S
tock
EI
S Ri
sk R
atin
g In
dica
tors
Co
mm
ents
Clas
s As
sess
men
t Prio
rity)
Tu
na
OTL(
L)OH
(L)
EG (L
) RE
C (H
)
3Cp
uefro
mga
mefis
hing
Comb
ined S
kipjac
k, Ye
llowf
in, M
acke
rel,
North
ern B
luefin
Co
mmer
cial h
arve
sts of
thes
e spe
cies a
re m
anag
ed by
the
Comm
onwe
alth
Whit
ebait
OH(L
)
EG (L
) 3
Targ
et sp
ecies
OH
OH S
AP #1
3 By
prod
uct s
pecie
s EPT
High
EPT
Hi
gh O
H
Catch
Cp
ue
Or sp
rat
Two s
pecie
s
Whit
ing, S
and
EG (H
) OP
T (M
) OH
(L)
FT (L
) RE
C ()
2 Pr
imar
y spe
cies E
G
Targ
et sp
ecies
OH
OH S
AP #1
1
Inter
media
te EG
Me
dium
OH
Catch
Cp
ue
Age
Leng
th
Whit
ing, S
choo
l OP
T (H
) FT
(H)
EG (L
) RE
C ()
2 Ne
w ge
ar sp
ecifie
d in
FMS
Prim
ary s
pecie
s OTF
OT
F SA
P #3
Inter
media
te OT
F Ca
tch
Cpue
Ag
e (Ct
h)
Leng
th
Spec
ies co
nfusio
n betw
een r
ed sp
ot an
d stou
t
Whit
ing,
Trum
peter
EG
(M)
EPT
(L)
OTL (
L)
REC
()
3 Ke
y sec
. spe
cies E
G By
prod
uct s
pecie
s EPT
Inter
media
te EG
Hi
gh E
PT
Catch
Cp
ue
Age
Leng
th
Histo
ric ca
tch m
ixed w
ith sa
nd w
hiting
Wra
sse
OTL(
L)RE
C (M
) 4
Bypr
oduc
t spe
cies L
OB
Ca
tch
Cpue
OT
L lan
ds M
aori w
rass
e
NSW
DPI
- Fi
sh. R
es. A
sses
s. Se
r. 15
95

96 Resource Assessment Framework
Other titles in this series:
ISSN 1440-057X (NSW Fisheries Resource Assessment Series)
No. 1 An assessment of the NSW abalone fishery in 1996 No. 2 An assessment of the NSW rock lobster resource for 1997/98 No. 3 An assessment of the NSW abalone fishery in 1997 No. 4 An assessment of the NSW rock lobster resource for 1998/99 No. 5 A final assessment of the NSW abalone fishery in 1997 No. 6 An assessment of the NSW abalone fishery in 1998 No. 7 An assessment of the NSW eastern rock lobster resource for 1999/2000 No. 8 Status of the New South Wales Beachworm Fishery 1990/1 – 1995/96 No. 9 Status of the NSW commercial yabby fishery No. 10 An assessment of the NSW eastern rock lobster resource for 2000/01 No. 11 An assessment of the performance indicators of the Abalone Share Management Plan in
2000 No. 12 Review of eastern sea garfish and other commercially significant garfish species in New
South Wales – their fishery and biology No. 13 Review of biological information and stock assessment for the NSW sea mullet resource No. 14 An assessment of the NSW eastern rock lobster resource for 2001/02 ISSN 1449-9940 (NSW Department of Primary Industries - Fisheries Resource Assessment Series)
No. 15 A framework for the assessment of harvested fish resources in NSW
NSW DPI - Fish. Res. Assess. Ser. 15