5:; ' # '9& *#5 & 3 - intechcdn.intechopen.com/pdfs-wm/17531.pdfspectroscopic and...
TRANSCRIPT

3,350+OPEN ACCESS BOOKS
108,000+INTERNATIONAL
AUTHORS AND EDITORS115+ MILLION
DOWNLOADS
BOOKSDELIVERED TO
151 COUNTRIES
AUTHORS AMONG
TOP 1%MOST CITED SCIENTIST
12.2%AUTHORS AND EDITORS
FROM TOP 500 UNIVERSITIES
Selection of our books indexed in theBook Citation Index in Web of Science™
Core Collection (BKCI)
Chapter from the book Advances in Ceramics - Characterization, Raw Materials ,Process ing, Properties , Degradation and HealingDownloaded from: http://www.intechopen.com/books/advances-in-ceramics-characterization-raw-materials-process ing-properties-degradation-and-healing
PUBLISHED BY
World's largest Science,Technology & Medicine
Open Access book publisher
Interested in publishing with IntechOpen?Contact us at [email protected]

2
Spectroscopic and Dielectric Characterization of Plasma Sprayed Titanates
Pavel Ctibor1 and Josef Sedlacek2 1Institute of Plasma Physics, ASCR, v.v.i., Prague,
2Department of Electrotechnology, Faculty of Electrical Engineering, Czech Technical University, Prague
Czech Republic
1. Introduction
Synthetic perovskite CaTiO3 (CT), geikielite MgTiO3 (MT) and their mixture MgTiO3-CaTiO3
(MCT) are materials well known and widely used as dielectrics in a sintered state. CT is high-permittivity linear dielectric material whose structure is not influenced by plasma spraying - neither chemical nor phase composition, as demonstrated earlier [Ctibor, 2003]. MT belongs to the family of low-loss microwave dielectrics and MT-CT solution is known by its temperature stability of permittivity. Namely the composition (Mg0.95Ca0.05)TiO3 is used in connection with this feature. In recent decades plasma spraying has become a well accepted technology as the coating method for metallic and ceramic materials and has been used in a variety of fields including electrical engineering. The coatings have lamellar character of a body formed with porosity aligned with respect to the lamellas. Spraying does not require heating of the substrate to the melting point of the deposited material. Often the research is focused on the microstructure of plasma sprayed coatings and features like porosity, unmelted particles, cracks and residual stress. Above listed characteristics are responsible for the behavior of coatings. However in the case of titanates phenomena taking place on atomic level and single crystal cell level are also important. Raman spectroscopy, infrared spectroscopy and near-field microwave microscopy are suitable techniques for this characterization. Ca and Mg have the same charge but different ionic radii (rCa2+ = 0.134 nm and rMg2+ = 0.103 nm) [Hirata, 1996]. A mixture of CT and MT melts and forms an eutectic liquid at 1462°C, which, under proper solidification conditions, can be used to achieve a highly dense product. During processing presence of intermediate phases of MgTi2O5 and Mg2TiO4 was noted, and they were difficult to eliminate completely from the reaction products [Zhang, 2006; Zheng, 2003; Huang, 2002]. MCT exhibits differences from MT in the metal-oxygen bond lengths which are relevant to the stability of the compounds. While the infrared and Raman spectra of CT and MT have been measured [Jiang, 1998; Cavalcante, 2008], other cations at the A and/or B sites alters the vibrational properties of ABO3 studied by these spectroscopic techniques. This encourages the author to measure the Raman and infrared spectra. In the plasma sprayed MCT we have earlier recognized also MgTi2O5 and Mg2TiO4 phases [Ctibor, 2003].
www.intechopen.com

Advances in Ceramics - Characterization, Raw Materials, Processing, Properties, Degradation and Healing
20
Besides the mentioned dielectric titanate materials we have sprayed also one representative of ferroelectrics - barium titanate. BaTiO3 (BT) is an interesting multifunctional oxide that exhibits complex phase appearance. Between 120°C (393K) and 1457°C (1730K) BaTiO3 has a cubic perovskite structure that consists of corner linked oxygen octahedra containing Ti4+, with Ba2+. Cooling below 120°C results in small displacements in the positions of the cations in the unit cell resulting in polar ferroelectric phase existing in the temperature interval between 5°C (278K) and 120°C [Boutinaud, 2006]. BaTiO3, due to its high dielectric constant, is used frequently as multilayer capacitor components and sensors. However, it has been found that with respect to the electrical properties BaTiO3 in the form of thin-films does not reach the qualities of bulk material. This difference was explained by a combination of the intrinsic dead layer effect, a stress effect, an effect of the microstructure within the thin film, and an effect of the stoichiometry [Zhao, 2008]. In particular, the relative permittivity of films decreases when the film thickness is reduced [Setter, 2000]. The optimal dielectric characteristics are obtained for sintered BaTiO3-based sample with bulk density of about 5300 kg.m-3 [Jin, 2003]. Any deviation from the stoichiometric Ba/Ti ratio leads to suppression of the high relative permittivity of the ferroelectric barium titanate [Mitic, 2001]. To detect the tetragonal BaTiO3 phase by X-ray diffraction, the split of peaks of (002) and (200) reflection is a well-established indication [Waser, 1999; Yu, 2009; Simon-Seveyrat, 2007]. In general there are differences of the behavior of barium titanate in the form of a single-crystal, sintered bulk material and thin film [Boutinaud, 2006; Mitic, 2001]. Plasma spraying enables to create layers with ‘bulk-like’ thickness but adhering on a metallic substrate of various shapes. Free-standing parts of titanate ceramics can be fabricated as well by plasma spraying [Wu, 2009]. BaTiO3 itself was up to now very seldom plasma sprayed and the understanding of its behavior in the form of sprayed coating is not satisfactory. For coatings with the thickness of about 100 µm the values of relative permittivity 50 and loss factor 0.08 were reported [Dent, 2001]. The dielectric properties of the plasma sprayed BaTiO3 were related to the degree of crystallinity [Dent, 2001]. The coatings containing more crystalline material have higher relative permittivity. The relative permittivity was affected also by cracks and splat interfaces within the coating [Dent, 2001]. The reported value of relative permittivity is however surprisingly low, because one and more orders higher values are typical for bulk BaTiO3 [Buchanan, 2004]. In frame of the presented chapter we are focused on selected aspects of the dielectric characteristics of the as-sprayed barium titanate coatings and we provide comparison of them with other plasma sprayed titanates.
2. Experimental
2.1 Feedstock materials All materials were obtained in the form of tablets of industrial purity, produced by the sintering of micropowders. The sintering was carried out by companies Epsilon (Librice, Czech Republic), Ceramic Capacitors (Hradec Kralove, Czech Rep.) and Teceram (Hradec Kralove, Czech Rep.). The synthetic form of perovskite CaTiO3 was produced by reactive sintering of CaO and TiO2. CaTiO3 powder used for experiments was sintered without any additives (like ZnO), normally used for decreasing the sintering temperature. Tablets were crushed and sieved into a powder of the correct size for spraying. MgTiO3 and MCT were sintered using MgO, CaCO3 and TiO2. After sieving the size distribution of the feedstocks was 63–125 microns for all three materials.
www.intechopen.com

Spectroscopic and Dielectric Characterization of Plasma Sprayed Titanates
21
BaTiO3 feedstock powder was obtained by crushing and sieving of sintered coarse agglomerates. Those agglomerates were prepared by a reactive sintering of micrometer-sized powders of BaCO3 and TiO2 used as starting materials. After sieving the size distribution of the BT feedstock for spraying was between 20 and 63 μm with an average at 40 µm, whereas the bulk density measured by helium pycnometry was 5721 kg.m-3.
2.2 Plasma spraying The CT, MT and MCT samples were manufactured using a high throughput Water-Stabilized Plasma (WSP) spray system WSP500® at Institute of Plasma Physics (Prague, Czech Republic) at ambient atmosphere. The WSP system operates at about 160 kW arc power and can process high amounts of material. This system can be used to fabricate deposits similar but not identical to those prepared by means of conventional atmospheric plasma-spray systems based on gas-stabilized torches. As substrates flat carbon steel coupons (Euronorm S355) were used whereas the powder was fed in by compressed air through two injectors. Just before spraying, the steel was grit blasted with Al2O3 with a mean diameter of 650 µm. The deposited thickness was about 1.5 mm for self-supporting deposits. Thick deposits were stripped from the substrate by a releasing agent or by thermal cycling between +200 and -70°C. For manufacturing of BT samples a Gas-Stabilized Plasma gun (GPS) was used to perform Atmospheric Plasma Spraying (APS) process. The conventional d.c. GPS gun F4 consisted of a thoriated tungsten cathode of 10 mm in diameter with a conical tip and a copper anode/nozzle. The plasma gas mixture used was argon/hydrogen with the total flow rate 60 slm. The powder was injected perpendicularly to the plasma jet axis with argon as a carrier gas (at constant flow rate 5 slm at pressure 0.3 MPa for all spray experiments) through an injector located 3 mm downstream (called external injection) of the torch nozzle exit. The system can process 1 to 5 kg/hour of a ceramic powder. Barium titanate was sprayed at arc power around 30 kW. Spray distance was 100 mm and plasma spraying deposition time about five minutes to reach the thickness 0.9 to 1 mm. Substrates, rectangular shaped (120x20 mm²) 3 mm thick, were made of carbon steel (Euronorm S355). Just before spraying, they were grit blasted with Al2O3 with a mean diameter of 400 µm. The substrates were disposed on a rotating sample holder which diameter was 90 mm. This substrate holder was rotated (tangential speed of 1 m/s) with a horizontal axis and simultaneously translated back and forth orthogonally to the plasma jet axis at a velocity of 24 mm/sec, with an excursion of 160 mm, the plasma torch being stationary.
2.3 Characterization techniques X-ray diffraction (XRD) was performed as a phase identification with SIEMENS D5000™
equipment allowed identifying phases present within powders and coatings. For estimation of
the crystallinity of the plasma sprayed BT coating relative peak areas have been used. These
have been calculated from relative ratios of the areas of the three main peaks (101, 111 and
200) from the tetragonal titanate phase.
Raman spectra were collected by the FORAM 685 apparatus which is equipped by a 685 nm laser with output power up to 40 mW. Spectral resolution 8 cm-1 and various integration times from 10 to 60 seconds were used. Raman spectroscopy of BT was performed using a Lambda Solutions P1 apparatus – laser wavelength 785 nm, objective 50 x, integration time 25 s.The surface of the coating was polished before the test.
www.intechopen.com

Advances in Ceramics - Characterization, Raw Materials, Processing, Properties, Degradation and Healing
22
Infrared reflective spectra of CT samples were measured by Bruker IFS 113v Fourier transform spectrometer. Microwave microscope Agilent AFM 5400 was used for simultaneous monitoring of the
surface profile by AFM and dielectric response on external field applied at resonant
frequency (approx. 2.6 MHz). This relatively new technique - near-field scanning microwave
microscopy (SMM) permits characterization of the effects of inhomogeneities and defects in
crystals, films, and compacts on the local dielectric behavior. By moving the tip/cavity
assembly over a surface, one can map the microwave cavity resonant frequency fr and
quality factor Q as a function of position and generate images of the sample. In addition to
qualitative images, the microscope can provide quantitative characterization of local
dielectric properties [Cheng, 2003].
The complex dielectric permittivity of CT was studied in the 440 Hz – 1 MHz frequency
range and 10–270K temperature interval using HP 4192A impedance analyzer with a
Leybold He-flow cryostat (operating range 5–300 K). The impedance of the cylindrical
sample with Au electrodes sputtered on the cylinder ends was recorded on cooling rate of 2
K/min.
All other electric measurements were performed at room temperature. The deposits were
stripped of from the substrates. The surfaces were ground after spraying to eliminate
surface roughness. A thin layer of aluminum as the electrode was sputtered in a reduced
pressure on the ground surface [Ctibor, 2003]. A three-electrode system was used with a
guarded electrode, whereas an unguarded electrode was sputtered on the entire surface of
the sample opposite side. The electric field was applied parallel with the spraying direction
(i.e., perpendicular to the substrate surface). Capacity was measured in the frequency range
from 120 Hz to 1 MHz using the impedance analyzer 4284A (Agilent, CA, USA). Applied
voltage was 1V AC whereas the stabilized electric source was equipped with a micrometric
capacitor type 16451A (Agilent, CA, USA). Relative permittivity εr was calculated from
measured capacities CP and specimen dimensions (Eq. 1)
CP = ε0 x εr x 1/k (1)
where ε0 = 8.854×10⁻¹⁴ F cm-1; 1/k [cm] is defined as the ratio between the guarded surface and the thickness of the sample [Morey, 2003]. This same arrangement and equipment was used for the loss factor measurement at the same frequencies as capacity. Electric resistance was measured with a special resistivity adapter – Keithley model 6105.
The electric field was applied from a regulated high-voltage source and the values read by a
multi-purpose electrometer (617C, Keithley Instruments, USA). The magnitude of the
applied voltage was 100±2V DC. Volume resistivity was calculated from the measured
resistance and specimen dimensions. Typically 4 - 5 specimens were measured and the
average calculated.
3. Results
3.1 Spectroscopic measurements Figure 1 shows the Raman spectra of plasma sprayed CT in comparison with the sintered
sample. SD means stand-off distance, in millimeters, of the as-sprayed samples and “an”
denotes annealed samples. Annealing details are given elsewhere [Ctibor, 2003].
www.intechopen.com

Spectroscopic and Dielectric Characterization of Plasma Sprayed Titanates
23
Fig. 1. Raman spectrum of CaTiO3
Fig. 2. Raman spectrum of MgTiO3
The absolute values of the intensity of the reflection are associated with surface roughness
and could be omitted. From the graph we see that the positions of all peaks are identical for
all samples. Wavenumbers of all three main peaks observed at 471, 495, and 640 cm-1 are in
www.intechopen.com

Advances in Ceramics - Characterization, Raw Materials, Processing, Properties, Degradation and Healing
24
agreement with [Cavalcante, 2008]. The bands at 471 and 495 cm-1 are assigned to Ti–O
torsional (bending or internal vibration of oxygen cage) modes [Hirata, 1996; Zheng, 2003].
The Ti–O stretching mode is centered at 640 cm−1 [Boutinaud, 2006]. Two small peaks at
about 650 cm-1, suggesting the simultaneous presence of [TiO6] and [TiO5] clusters, however
in our case they are even less pronounced compare to [Cavalcante, 2008]. Also in our plasma
sprayed samples incomplete organization of the CaTiO3 lattice can be attributed to the
defects in the covalent bond due to the oxygen vacancies (VO��) between the clusters
[TiO6–TiO5·VO��] as in [Cavalcante, 2008]. This is associated with slightly reducing
atmosphere in the plasma stream based on H and O atoms (water stabilization).
The Raman spectrum of MT is displayed on the Fig. 2 in which the active modes at 478 cm-1
and 501 cm-1 [Hirata, 1996] are observed only on the coating. Next active modes are at 641
and 712 cm-1 [Hirata, 1996] and also were detected only on the coating, whereas in the
sintered sample a shoulder centered at about 530 cm-1 is present.
Fig. 3. Raman spectrum of MCT
The Raman spectrum of plasma sprayed MCT is displayed on the Fig. 3 in comparison with
MT measured at exactly the same conditions. We can see for MCT a red shift of the peak
centered at 712 cm-1 in the case of MT. Other pronounced maximum is at 565 cm-1. The
Raman pattern of MCT is different compare to MT and CT and moreover it is not a simple
combination of both of them. This is because of MgTi2O5 and Mg2TiO4 origin during the
spraying, as confirmed by XRD [Ctibor, 2003]. However only two phases with different
relative permittivity were detected by scanning microwave microscopy, see Fig. 4, similarly
as in [Zhang, 2006]. Permittivities of MgTi2O5, Mg2TiO4 and MT are very similar together
and very different from CT. Figure 4 is a superposition of the AFM contact mode image
(roughness) and scanning microwave microscopy capacitance mode image (colors). The
image is artificially colored – blue and red zones represent different relative permittivity.
www.intechopen.com

Spectroscopic and Dielectric Characterization of Plasma Sprayed Titanates
25
Fig. 4. Scanning microwave microscopy image of MCT as-sprayed surface (artificially colored – blue and red zones represent different relative permittivity)
CT (perovskite) is a high permittivity material εr‘ = 170 [Ferreira, 1997], MgTiO3 (giekielite) has a low εr‘ = 17 [Zeng, 1997] and Mg2TiO4 (qandilite) also has even lower εr‘ = 12 [Haefie, 1992]. However SMM setup is not able to distinguish well the two last phases [Wing, 2006], also in our Fig. 4 the blue lamellas correspond to CT, c.f. Fig. 5, and the red background to all other phases. Raman spectrum of BT coating is displayed on Fig. 6. The spectrum with peaks at 311 and 507 cm-1 corresponds to tetragonal phase of BaTiO3 [Souza, 2006]. At low oxygen pressure which is the condition relevant for plasma spraying, the density of oxygen vacancies is higher, and then the expansion of the lattice volume is greater [Souza, 2006]. This is why the Raman modes shift to lower frequencies: 507 cm-1 in our case instead of 518 cm-1 [26] or 532 cm-1 in [Souza, 2006] for the A1 torsion mode. Raman spectrum of the long-SD coating is practically identical. The modes further split into longitudinal (LO) and transverse (TO) components. The spectrum in Fig. 6 shows the stretching mode of A1(TO1), A1(TO2) and A1(TO3) at around 163, 259 and 507 cm-1, respectively [Mattsson, 2010; Guo, 2005]. The stretching mode of E (TO2) appeared at 311 cm-1, while A1(LO1) stretching modes at 188 cm-1 and A1(LO2) at about 470 cm-1 [Mattsson, 2010], however the last one was not very pronounced in our case. By the Raman spectroscopy presence of TiO2 in anatase form was mentioned - the peak at about 645 cm-1 was observed in TiO2 film [Giolli, 2007] or coating [Buralcov, 2007]. Elsewhere [Ostapchuk, 2005] such a peak was shown without comments. In our case also week peak at 631 cm-1 was detected, which can correspond to anatase-TiO2 individual phase
in the BaTiO3 coating.
www.intechopen.com

Advances in Ceramics - Characterization, Raw Materials, Processing, Properties, Degradation and Healing
26
Fig. 5. SEM-BE image showing the lamellar microstructure
Fig. 6. Raman spectrum of plasma sprayed BaTiO3
www.intechopen.com

Spectroscopic and Dielectric Characterization of Plasma Sprayed Titanates
27
Figure 7 shows the infrared spectra of plasma sprayed CT in comparison with the sintered sample. The infrared-active mode at 575 cm-1, assigned to the Ti–O stretch, and also the mode at 455 cm-1, assigned to the Ti–O3 torsion, are present in both samples with the same intensity. The slightly more pronounced local valley in the case of plasma sprayed sample – localized at about 680 cm-1 is the only subtle distinction.
0
0,1
0,2
0,3
0,4
0,5
0,6
0,7
0,8
0,9
1
10
0
14
8
19
7
24
5
29
3
34
1
39
0
43
8
48
6
53
4
58
2
63
1
67
9
72
7
77
5
82
3
87
2
92
0
96
8
Wavenumber [1/cm]
Inte
ns
ity
[a
.u.]
SD 350 sintered
Fig. 7. Infrared spectrum of CaTiO3
Fig. 8. XRD pattern of plasma sprayed MgTiO3
According X-ray diffraction measurement of CT coating, the phase composition is the same as in the feedstock powder – pure CaTiO3 (PDF2 card No. 00-022-0153). The XRD pattern of MT, Fig. 8, shows that the original metatitanate partly decomposed during the spray process on Mg2TiO4 and MgTi2O5. Al these components are present also in MCT coating, Fig. 9, whereas also CaTiO3 is present as an individual phase.
www.intechopen.com

Advances in Ceramics - Characterization, Raw Materials, Processing, Properties, Degradation and Healing
28
Fig. 9. XRD pattern of plasma sprayed MCT
0
1000
2000
3000
4000
5000
6000
20,0
22,0
23,9
25,9
27,8
29,8
31,7
33,7
35,6
37,6
39,6
41,5
43,5
45,4
47,4
49,3
51,3
53,2
55,2
57,1
59,1
61,1
63,0
65,0
2 theta [°]
Inte
ns
ity
[a
.u.]
Fig. 10. XRD pattern of plasma sprayed BT coating
www.intechopen.com

Spectroscopic and Dielectric Characterization of Plasma Sprayed Titanates
29
The XRD pattern of BT, Fig. 10, corresponds strictly to the tetragonal phase (PDF2 card No.
01-081-2204), which was confirmed to be the constituent of the feedstock powder as well as
of the coatings. Intensity ratio of individual peaks of the feedstock as well as of the coatings
is very similar to patterns reported in the literature [Wang, 2008]. In the coating, certain
quantity of amorphous phase is present, manifested itself by a halo centered on 28° 2θ in the
pattern, and quantified as 10 %.
3.2 Dielectric measurements Dielectric properties of plasma sprayed CaTiO3 between 10 K and room temperature are
displayed on the Figures 11 to 13. The incipient ferroelectricity of CT [Lemanov, 1999;
Sudheendran, 2008] is suppressed in the case of plasma sprayed coatings, see Fig. 11. Rather
relaxor type of behavior takes place. Relaxor features are believed to be connected with a
situation when more than one type of ions occupies equivalent crystallographic position.
One of the most important features of relaxors is their low frequency dispersion at
maximum dielectric permittivity. The other features of this include dependence of phase
transition temperature on the method of its determination. The origin of such properties is
probably connected with a presence of microscopic polar regions (nano-domains) in these
materials [Bak, 2009]. With temperature falling down also the ε" values decrease to
minimum (for a given frequency), cf. Fig. 12.
Fig. 11. Real part of permittivity of plasma sprayed CaTiO3 between 10 K and room temperature
www.intechopen.com

Advances in Ceramics - Characterization, Raw Materials, Processing, Properties, Degradation and Healing
30
Fig. 12. Imaginary part of permittivity of plasma sprayed CaTiO3 between 10 K and room temperature
Fig. 13. Loss tangent of plasma sprayed CaTiO3 between 10 K and room temperature
www.intechopen.com
Spectroscopic and Dielectric Characterization of Plasma Sprayed Titanates
31
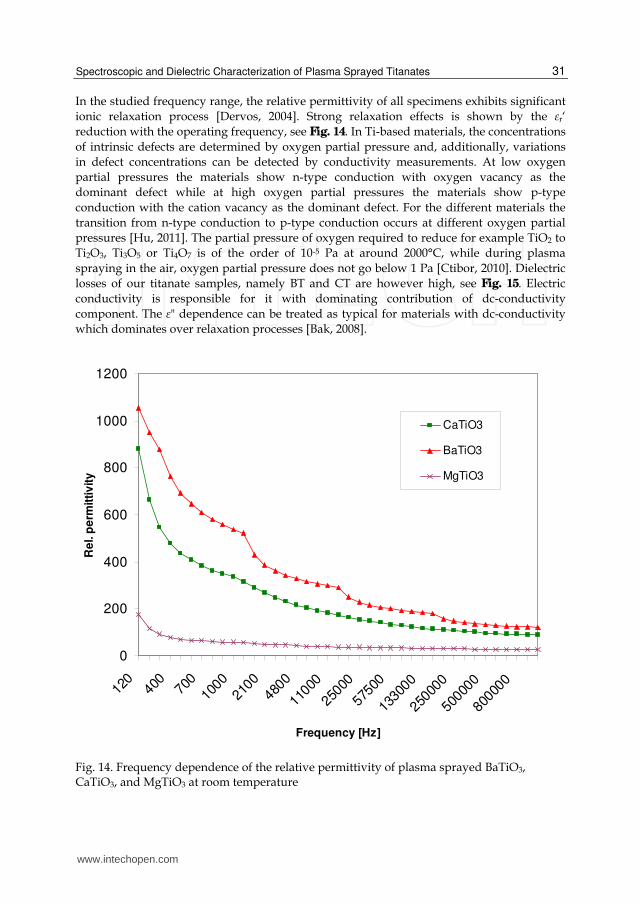
In the studied frequency range, the relative permittivity of all specimens exhibits significant
ionic relaxation process [Dervos, 2004]. Strong relaxation effects is shown by the εr‘ reduction with the operating frequency, see Fig. 14. In Ti-based materials, the concentrations
of intrinsic defects are determined by oxygen partial pressure and, additionally, variations
in defect concentrations can be detected by conductivity measurements. At low oxygen
partial pressures the materials show n-type conduction with oxygen vacancy as the
dominant defect while at high oxygen partial pressures the materials show p-type
conduction with the cation vacancy as the dominant defect. For the different materials the
transition from n-type conduction to p-type conduction occurs at different oxygen partial
pressures [Hu, 2011]. The partial pressure of oxygen required to reduce for example TiO2 to
Ti2O3, Ti3O5 or Ti4O7 is of the order of 10-5 Pa at around 2000°C, while during plasma
spraying in the air, oxygen partial pressure does not go below 1 Pa [Ctibor, 2010]. Dielectric
losses of our titanate samples, namely BT and CT are however high, see Fig. 15. Electric
conductivity is responsible for it with dominating contribution of dc-conductivity
component. The ε" dependence can be treated as typical for materials with dc-conductivity
which dominates over relaxation processes [Bak, 2008].
0
200
400
600
800
1000
1200
120
400
700
1000
2100
4800
1100
0
2500
0
5750
0
1330
00
2500
00
5000
00
8000
00
Frequency [Hz]
Re
l. p
erm
itti
vit
y
CaTiO3
BaTiO3
MgTiO3
Fig. 14. Frequency dependence of the relative permittivity of plasma sprayed BaTiO3, CaTiO3, and MgTiO3 at room temperature
www.intechopen.com

Advances in Ceramics - Characterization, Raw Materials, Processing, Properties, Degradation and Healing
32
Table 1 shows the volume resistivity and Fig. 16 corresponding conductivity of plasma
sprayed and sintered BT, CT, MT and MCT materials. We see the different values with
typically several orders of magnitude lower resistivity values for plasma sprayed specimen
compare to sintered materials.
Sample BT (P) BT (S) CT (P) CT (S) MT (P) MT (S) MCT (P) MCT (S)
ρ [Ωm] 6.08x10⁴ 2.42x10⁹ 7.51x10⁹ 1.41x10¹² 1.15x10⁸ 6.90x10¹¹ 1.17x10⁷ 7.54x10¹¹
Table 1. Volume resistivity of studied materials (P – plasma sprayed, S – sintered)
0
0,1
0,2
0,3
0,4
0,5
0,6
0,7
0,8
0,9
1
120
400
700
1000
2100
4800
1100
0
2500
0
5750
0
1330
00
2500
00
5000
00
8000
00
Frequency [Hz]
Lo
ss
ta
ng
en
t
CaTiO3
BaTiO3
MgTiO3
Fig. 15. Frequency dependence of the loss tangent of plasma sprayed BaTiO3, CaTiO3, and MgTiO3 at room temperature
www.intechopen.com

Spectroscopic and Dielectric Characterization of Plasma Sprayed Titanates
33
1,00E-14
1,00E-13
1,00E-12
1,00E-11
1,00E-10
1,00E-09
1,00E-08
1,00E-07
1,00E-06
1,00E-05
1,00E-04
1,00E-03
GSP sintered SD450 sintered WSP sintered WSP sintered
BaTiO3 BaTiO3 CaTiO3 CaTiO3 MgTiO3 MgTiO3 MCT MCT (slin)
Co
nd
ucti
vit
y [
S/m
]
Fig. 16. Conductivity of plasma sprayed and sintered BT, CT, MT and MCT
Fig. 17. AFM contact mode image of BaTiO3 (in plane orientation). Roughness representation: peaks are lighter and valleys darker (black color represents pores)
www.intechopen.com
Advances in Ceramics - Characterization, Raw Materials, Processing, Properties, Degradation and Healing
34
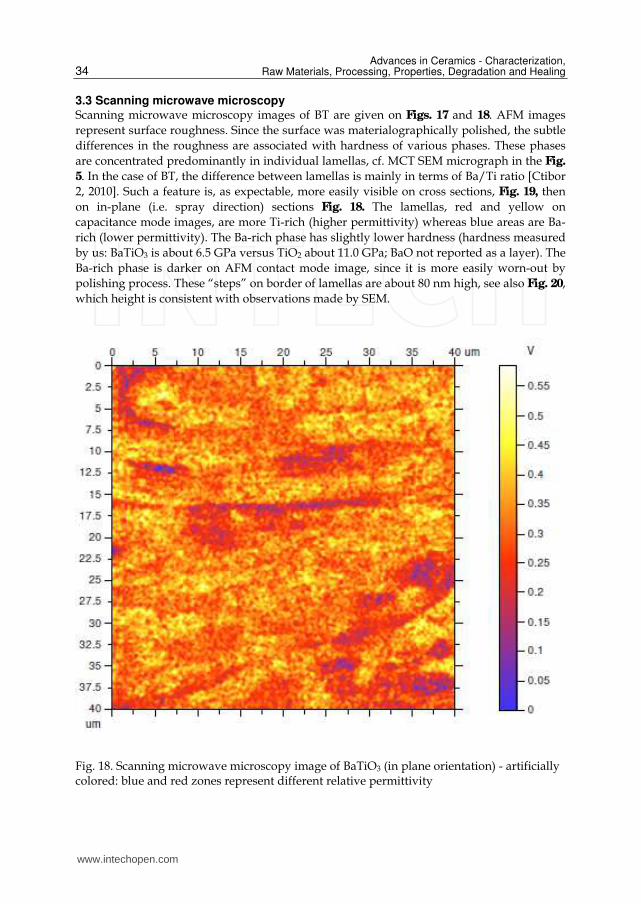
3.3 Scanning microwave microscopy Scanning microwave microscopy images of BT are given on Figs. 17 and 18. AFM images
represent surface roughness. Since the surface was materialographically polished, the subtle
differences in the roughness are associated with hardness of various phases. These phases
are concentrated predominantly in individual lamellas, cf. MCT SEM micrograph in the Fig.
5. In the case of BT, the difference between lamellas is mainly in terms of Ba/Ti ratio [Ctibor
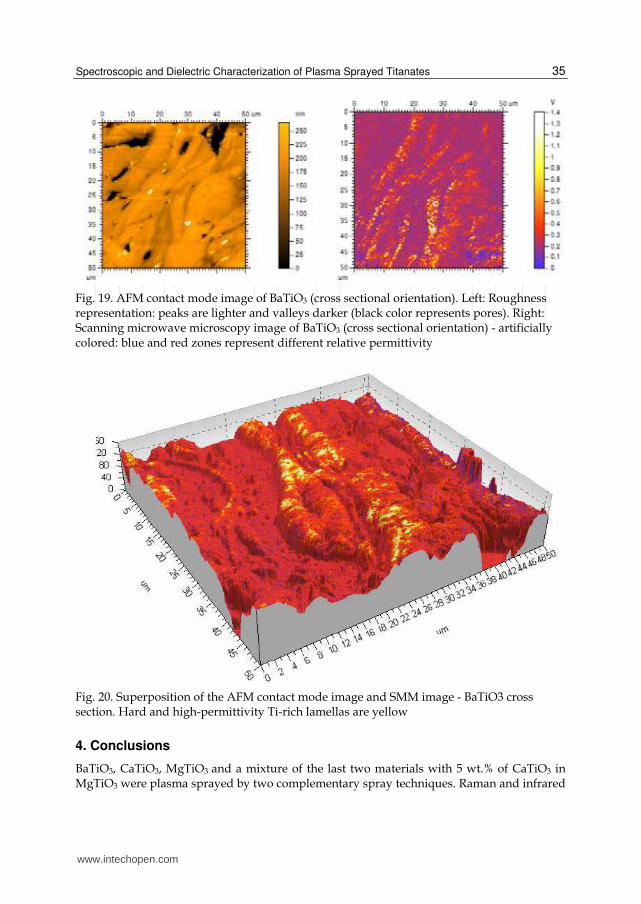
2, 2010]. Such a feature is, as expectable, more easily visible on cross sections, Fig. 19, then
on in-plane (i.e. spray direction) sections Fig. 18. The lamellas, red and yellow on
capacitance mode images, are more Ti-rich (higher permittivity) whereas blue areas are Ba-
rich (lower permittivity). The Ba-rich phase has slightly lower hardness (hardness measured
by us: BaTiO3 is about 6.5 GPa versus TiO2 about 11.0 GPa; BaO not reported as a layer). The
Ba-rich phase is darker on AFM contact mode image, since it is more easily worn-out by
polishing process. These “steps” on border of lamellas are about 80 nm high, see also Fig. 20,
which height is consistent with observations made by SEM.
Fig. 18. Scanning microwave microscopy image of BaTiO3 (in plane orientation) - artificially colored: blue and red zones represent different relative permittivity
www.intechopen.com
Spectroscopic and Dielectric Characterization of Plasma Sprayed Titanates
35
Fig. 19. AFM contact mode image of BaTiO3 (cross sectional orientation). Left: Roughness representation: peaks are lighter and valleys darker (black color represents pores). Right: Scanning microwave microscopy image of BaTiO3 (cross sectional orientation) - artificially colored: blue and red zones represent different relative permittivity
Fig. 20. Superposition of the AFM contact mode image and SMM image - BaTiO3 cross section. Hard and high-permittivity Ti-rich lamellas are yellow
4. Conclusions
BaTiO3, CaTiO3, MgTiO3 and a mixture of the last two materials with 5 wt.% of CaTiO3 in MgTiO3 were plasma sprayed by two complementary spray techniques. Raman and infrared
www.intechopen.com

Advances in Ceramics - Characterization, Raw Materials, Processing, Properties, Degradation and Healing
36
spectroscopic measurements were carried out on plasma sprayed titanates. Coating samples were tested as mono-block capacitors. Volume dc-resistivities of the materials were summarized. Microwave microscopy was used for mapping of the dielectric response of selected samples. CaTiO3 exhibits anomalous dielectric losses because of intrinsic conductivity. Relaxor type of behavior takes place at dielectric measurements, whereas dc-conductivity is responsible for the high dielectric losses. All coatings are slightly oxygen deficient – however under detection limits of XRD materials – the color of all of them is darker compare to sintered samples. Polarization of grain boundaries combined with n-type conduction with oxygen vacancy as the dominant defect contributes to the observed pseudo-relaxor response of BaTiO3 and CaTiO3 to AC electric field. MgTiO3 as a low-loss material has the above mentioned effects slightly suppressed and is more similar to sintered bulk. The existence of irregularities in the crystal lattice was confirmed by spectroscopic measurements. Plasma spraying of applicable ceramic dielectrics able to substitute bulk parts will need further research. In the other hand, plasma spraying, with its possibility to cover wide range of substrate materials with thick coatings having very versatile thicknesses and areas, offers promising way to future development.
5. Acknowledgment
The authors thank to J. Dubsky (IPP ASCR) for XRD measurements, to M. Savinov (Inst. of Physics, ASCR) for the temperature measurement of dielectric properties of CaTiO3 and to V. Zelezny (Inst. of Physics, ASCR) for doing the infrared spectroscopy. Scanning microwave microscopy was done by M. Fenner (Agilent, Germany). The company ELMES, Lt.D. is acknowledged for lending of the Foram device. BaTiO3 was sprayed at University of Limoges, France. This work was supported by IPP ASCR under project AV0Z20430508.
6. References
Bak W.; Starzyk, F.; Kajtoch, C. & Nogas-Cwikiel, E (2008). Elevated temperature induced dispersion phenomena in Ba1-xNaxTi1-xNbxO3. Archives of Materials Science and Engineering, Vol. 29, No. 1, pp. 5-9
Bak W. (2009). Study of the relaxor behaviour in Ba0.68Na0.32Ti0.68Nb0.32O3 ceramic. Journal of Achievements in Materials and Manufacturing Engineering, Vol. 37, pp. 24-27
Boutinaud, P.; Tomasella, E.; Ennajdaoui A. & Mahiou R. (2006), Structural characterization and luminescent properties of CaTiO3:Pr3+ thin films deposited by radio frequency sputtering.Thin Solid Films, Vol. 515, pp. 2316–2321
Buchanan, R.C. (2004). Ceramic materials for electronics (3rd edition), M. Dekker, New York Burlacov, I.; Jirkovsky, J.; Kavan, L.; Ballhorn, R. & Heimann, R.B. (2007). Cold gas dynamic
spraying (CGDS) of TiO2 (anatase) powders onto poly(sulfone) substrates: Microstructural characterisation and photocatalytic efficiency, Journal of Photochemistry and Photobiology A: Chemistry, Vol. 187, pp. 285–292
Cavalcante, L.S. et al. (2008). Synthesis, structural refinement and optical behavior of CaTiO3 powders: A comparative study of processing in different furnaces. Chemical Engineering Journal, Vol. 143, pp. 299–307
www.intechopen.com

Spectroscopic and Dielectric Characterization of Plasma Sprayed Titanates
37
Ctibor, P.; Sedlacek, J.; Neufuss, K. & Chraska, P. (2003). Dielectric relaxation in calcium titanate-containing ceramics prepared by plasma spraying. Ceramics International, Vol. 29, pp. 955-960
Ctibor, P. & Hrabovsky, M. (2010). Plasma sprayed TiO2: The influence of power of an electric supply on particle parameters in the flight and character of sprayed coating. Journal of the European Ceramic Society, Vol. 30, pp. 3131-3136
Ctibor, P.; Ageorges, H.; Sedlacek, J. & Ctvrtlik, R. (2010). Structure and properties of plasma sprayed BaTiO3 coatings, Ceramics International, Vol. 36, pp. 2155-2162
Cheng H.-F. et al. (2003). Study of second-phases in Ba(Mg1/3Ta2/3)O3 materials by microwave near-field microscopy. Journal of the European Ceramic Society, Vol. 23, pp. 2667–2670.
Dent, A.H. et al. (2001). High velocity oxy-fuel and plasma deposition of BaTiO3 and (Ba,Sr)TiO3. Materials Science and Engineering B, Vol. 87, pp. 23-30.
Dervos, C.T.; Thirios, E.; Novacovich, J.; Vassiliou, P. & Skafidas, P. (2004). Permittivity properties of thermally treated TiO2. Materials Letters, Vol. 58, pp. 1502– 1507
Ferreira, V. M.; Azough, F.; Freer R. & Baptista J. L. (1997). The Effect of Cr and La on MgTiO3 and MgTiO3–CaTiO3 Microwave Dielectric Ceramics, Journal of Materials Research, Vol. 12, pp. 3293–3299
Giolli C. et al. (2007). Characterization of TiO2 coatings prepared by a modified electric arc-physical vapour deposition system. Surface & Coatings Technology, Vol. 202, pp. 13–22
Guo H.Z. et al. (2005). Structure dynamics of strongly reduced epitaxial BaTiO3−x studied by Raman scattering. Journal of the European Ceramic Society, Vol. 25, pp. 2347-2352.
Haefie H. et al. (1992). Mg2TiO4 as a novel substrate for high-temperature superconducting thin films, Applied Physics Letters, Vol. 61, pp. 9-19
Hu P. et al. (2011). Influence of thermal treatments on the low frequency conductivity and microwave dielectric loss of CaTiO3 ceramics, Materials Science and Engineering B, Vol. 176, No. 5, pp. 401-405.
Huang, C.-L.; Pan, C.-L. & Shium S.-J. (2002). Liquid phase sintering of MgTiO3-CaTiO3 microwave dielectric ceramics.
Materials Chemistry and Physics, Vol. 78, pp. 111–115 Hirata, T.; Ishioka K. & Kitajima M. (1996). Journal of solid state chemistry, Vol. 124, pp. 353–
359 Jiang, Y.; Guo, R. & Bhalla, A. S. (1998). LHPG grown crystal fibers of MgTiO3-CaTiO3
eutectic system. Journal of Physics and Chemistry of Solids, Vol. 59, pp. 611-615 Jin, H.Z. et al. (2003). An interfacial defect layer observed at (Ba,Sr)TiO3-Pt interface. Thin
Solid Films, Vol. 429, pp. 282-285. Lemanov, V.V.; Sotnikov, A.V.; Smirnova, E.P.; Weihnacht, M. & Kunze, R. (1999).
Perovskite CaTiO3 as an incipient ferroelectric, Solid State Communications, Vol. 110, pp. 611–614
Mattsson A. & Oesterlund L. (2010). Adsorption and photoinduced decomposition of acetone and acetic acid on anatase, brookite, and rutile TiO2 nanoparticles, Journal of Physical Chemistry, Vol. 114 C, pp.14121–14132
Mitic, V.V. & Mitrovic I. (2001). The influence of Nb2O5 on BaTiO3 ceramics dielectric properties, Journal of the European Ceramic Society, Vol. 21, pp. 2693-2696
www.intechopen.com
Advances in Ceramics - Characterization, Raw Materials, Processing, Properties, Degradation and Healing
38
Morey, O.; Goeuriot P.; Juve D. & Treheux D. (2003). Dielectric investigations on 'MgAlON' compounds: Role of nitrogen content. Journal of the European Ceramic Society, Vol. 23 pp. 345-350.
Ostapchuk T. et al. (2005). Soft-mode spectroscopy of BaTiO3 thin films. Journal of the European Ceramic Society, Vol. 25, pp. 3063–3067
Setter, N. & Waser, R. (2000). Electroceramic materials, Acta Materialia, Vol. 48, pp.151-178 Simon-Seveyrat, L.; Hajjaji, A.; Emziane, Y.; Guiffard, B. & Guyomar, D. (2007). Re-
investigation of synthesis of BaTiO3 by conventional solid-state reaction and oxalate coprecipitation route for piezoelectric applications, Ceramics International, Vol. 33, pp. 35-40
Souza I.A. et al. (2006). Theoretical and experimental study of disordered Ba0.4 Sr0.55TiO3 photoluminescence at room temperature, Chemical Physics, Vol. 322, pp. 343–348
Sudheendran, K. & James Raju K.C. (2008). Temperature dependent impedance and dielectric properties of 0.7CaTiO3–0.3NdAlO3 ceramics. Indian journal of engineering & material sciences,Vol. 15, p. 133-136
Waser, R. (1999). Modeling of Electroceramics - Applications and Prospects, Journal of the European Ceramic Society, Vol. 19, pp. 655-664
Wang, X.; Zhang, L.; Liu, H.; Zhai J. & Yao X. (2008). Dielectric nonlinear properties of BaTiO3–CaTiO3–SrTiO3 ceramics near the solubility limit, Materials Chemistry and Physics, Vol. 112, pp. 675-678
Wing, Z. N.; Halloran J. W.; Zhang, Q.; McGinn, P. J. (2006). Variable Dielectrics in the Calcium Magnesium Titanate System Characterized with Scanning Microwave Microscopy, Journal of the American Ceramic Society, Vol. 89, No. 5, pp. 1610–1614
Wu, L. et al. (2009). Dielectric properties of barium titanate ceramics with different materials powder size, Ceramics International, Vol. 35, pp. 957-960
Yu, P.; Cui, B. & Chany, Z. (2009). Preparation and characterization of Ag-doped BaTiO3
based X7R ceramics, Materials Research Bulletin, Vol. 44 , pp. 893-897 Zeng, J.; Wang, H.; Shang, S.; Wang, Z. & C. Lin (1997). Preparation of Textured Mg2TiO4
Thin Films on Si Substrate by Atmospheric Pressure Metallorganic Chemical Vapour Deposition, J. Mater. Sci. Mater. Electron., Vol. 8, pp. 159–162
Zhao, M.H.; Bonnell, D.A. & Vohs, J.M. (2008). Effect of ferroelectric polarization on the adsorption and reaction of ethanol on BaTiO3, Surface Science,Vol. 602, pp. 2849-2855
Zhang Q. & McGinn P. J. (2006). Characterization of Calcium Titanate–Magnesium Titanate Eutectic by Scanning Microwave Microscopy, Journal of the American Ceramic Society, Vol. 89, pp. 3817 – 3823
Zheng,H. et al. (2003). Raman spectroscopy of B-site order-disorder in CaTiO3-based microwave ceramics. Journal of the European Ceramic Society, Vol. 23, pp. 2653–2659
www.intechopen.com

Advances in Ceramics - Characterization, Raw Materials,Processing, Properties, Degradation and HealingEdited by Prof. Costas Sikalidis
ISBN 978-953-307-504-4Hard cover, 370 pagesPublisher InTechPublished online 01, August, 2011Published in print edition August, 2011
InTech EuropeUniversity Campus STeP Ri Slavka Krautzeka 83/A 51000 Rijeka, Croatia Phone: +385 (51) 770 447 Fax: +385 (51) 686 166www.intechopen.com
InTech ChinaUnit 405, Office Block, Hotel Equatorial Shanghai No.65, Yan An Road (West), Shanghai, 200040, China
Phone: +86-21-62489820 Fax: +86-21-62489821
The current book consists of eighteen chapters divided into three sections. Section I includes nine topics incharacterization techniques and evaluation of advanced ceramics dealing with newly developed photothermal,ultrasonic and ion spattering techniques, the neutron irradiation and the properties of ceramics, the existenceof a polytypic multi-structured boron carbide, the oxygen isotope exchange between gases and nanoscaleoxides and the evaluation of perovskite structures ceramics for sensors and ultrasonic applications. Section IIincludes six topics in raw materials, processes and mechanical and other properties of conventional andadvanced ceramic materials, dealing with the evaluation of local raw materials and various types and forms ofwastes for ceramics production, the effect of production parameters on ceramic properties, the evaluation ofdental ceramics through application parameters and the reinforcement of ceramics by fibers. Section III,includes three topics in degradation, aging and healing of ceramic materials, dealing with the effect of granitewaste addition on artificial and natural degradation bricks, the effect of aging, micro-voids, and self-healing onmechanical properties of glass ceramics and the crack-healing ability of structural ceramics.
How to referenceIn order to correctly reference this scholarly work, feel free to copy and paste the following:
Pavel Ctibor and Josef Sedlacek (2011). Spectroscopic and Dielectric Characterization of Plasma SprayedTitanates, Advances in Ceramics - Characterization, Raw Materials, Processing, Properties, Degradation andHealing, Prof. Costas Sikalidis (Ed.), ISBN: 978-953-307-504-4, InTech, Available from:http://www.intechopen.com/books/advances-in-ceramics-characterization-raw-materials-processing-properties-degradation-and-healing/spectroscopic-and-dielectric-characterization-of-plasma-sprayed-titanates