5 2016 york region housing supply
TRANSCRIPT

Clause 5 in Report No. 9 of Committee of the Whole was adopted, by the Council of The Regional Municipality of York at its meeting held on May 25, 2017 with the following additional recommendation:
4. Receipt of the communication from Danielle Chin, Senior Manager, Policy and Government Relations, BILD dated May 24, 2017.
5 2016 York Region Housing Supply
Committee of the Whole recommends:
1. Receipt of the presentation by Valerie Shuttleworth, Chief Planner, Planning and Economic Development.
2. Receipt of the communication from Danielle Chin, Senior Manager, Policy and Government Relations, BILD dated May 17, 2017.
3. Adoption of the following recommendation contained in the report dated May 5, 2017 from the Commissioner of Corporate Services and Chief Planner:
1. The Regional Clerk forward this report to the Ministry of Municipal Affairs, the local municipalities and the Building Industry and Land Development Association for information.
Report dated May 5, 2017 from the Commissioner of Corporate Services and Chief Planner now follows:
1. Recommendation
It is recommended that:
1. The Regional Clerk forward this report to the Ministry of Municipal Affairs, the local municipalities and the Building Industry and Land Development Association for information.
Committee of the Whole 1 Planning and Economic Development May 18, 2017
2016 York Region Housing Supply
2. Purpose
This report provides Council with an assessment of the Region’s designated housing supply to accommodate both short and long-term growth as of mid-year 2016 and comments on the impact of housing supply and other factors influencing the price of housing.
3. Background
Provincial and Regional policies require a minimum housing supply of three years of registered and draft approved units and ten years of designated lands
Monitoring of the Region’s housing supply is needed to assess consistency with Regional Official Plan and Provincial policies related to the provision of housing, to assist in monitoring housing affordability and to evaluate the performance of the Region’s growth management and Centres and Corridors policies and initiatives.
The York Region Official Plan, 2010 (YROP 2010), which was approved by the Province, addresses housing supply in the Region by requiring the following:
• maintaining a 3 to 7 year supply of registered and draft approved plans of subdivision, condominium plans and/or site plans, and
• maintaining a minimum 10-year supply of land designated for housing through intensification and redevelopment and in designated greenfield areas.
The Provincial Policy Statement, 2014 (PPS) has similar policies related to maintaining a supply of housing. PPS policies require at least three years of registered and draft approved plans with servicing capacity as well as a 10 year supply through lands which are designated for residential development.
It should be noted the PPS housing supply policies pertain to the “regional market area” which refers to upper or single tier municipalities; they do not apply at the local municipal level. In addition, the YROP 2010 and PPS policies related to housing supply are to be applied across all dwelling types – there is no requirement to provide a minimum number of years of supply for a particular type of housing. Notwithstanding this policy direction, other policies in the PPS and YROP 2010 require an appropriate range and mix of housing types and densities.
Committee of the Whole 2 Planning and Economic Development May 18, 2017

2016 York Region Housing Supply
Some have identified land supply as a contributing factor to the rapid increase in housing prices
Housing affordability has become an increasing concern in York Region and the Greater Toronto and Hamilton Area (GTHA). In the last year alone, the price of a resale home in York Region has increased by approximately 22% between 2015 and 2016. The issue of housing affordability has been widely discussed in the media and elsewhere, many noting that it is difficult to determine the underlying cause of the increase in housing prices. Some suggest that land use planning regulations and limited land supply are key contributing factors to the growing gap between housing prices and wages/incomes. Others point to more demand-based pressures like low interest rates and the attractiveness of real estate as an investment as being the key drivers of the recent price surge.
Regional staff have conducted a detailed assessment of designated housing supply to contribute to the discussion. The analysis contained in this report assesses the Region’s short and long term housing supply in the context of provincial and regional policies. A brief overview of the many factors that may contribute to increasing housing prices in York Region and elsewhere is also provided.
The housing supply analysis in this report is as of mid-year 2016
In March 2015, a housing supply report was presented to Council as part of the Region’s Municipal Comprehensive Review (MCR) update. The report concluded that the Region’s housing supply exceeded both Regional Official Plan and PPS requirements.
This report provides an updated housing supply analysis as of mid-year 2016, which is the most recent available data. A further update of the Region’s housing supply will be undertaken when the MCR resumes. It is staff’s intent to report annually on the Region’s residential housing supply.
4. Analysis and Implications
The 2016 York Region Housing Supply (Attachment 1) includes detailed tables and maps presenting supply totals by local municipality and planning status. Further analysis has also been conducted for southern and northern York Region. The analysis provides an assessment of the Region’s designated residential units in the following categories:
1. Registered 2. Draft approved 3. Proposed 4. Designated lands but with no application
Committee of the Whole 3 Planning and Economic Development May 18, 2017
2016 York Region Housing Supply
Registered and draft approved units represent a short term supply of units and proposed and designated lands with no application contribute to a longer term supply. In this analysis, designated lands include lands within local official plan residential designations. Designated units are within both the provincially delineated built-up area and designated greenfield area (shown on maps in the appendix in Attachment 1). Attachment 1 provides definitions for the above planning status categories and describes the overall planning hierarchy for residential land use designations. The major findings of the 2016 York Region Housing Supply are highlighted below. York Region has approximately five years of supply in registered and draft approved housing units
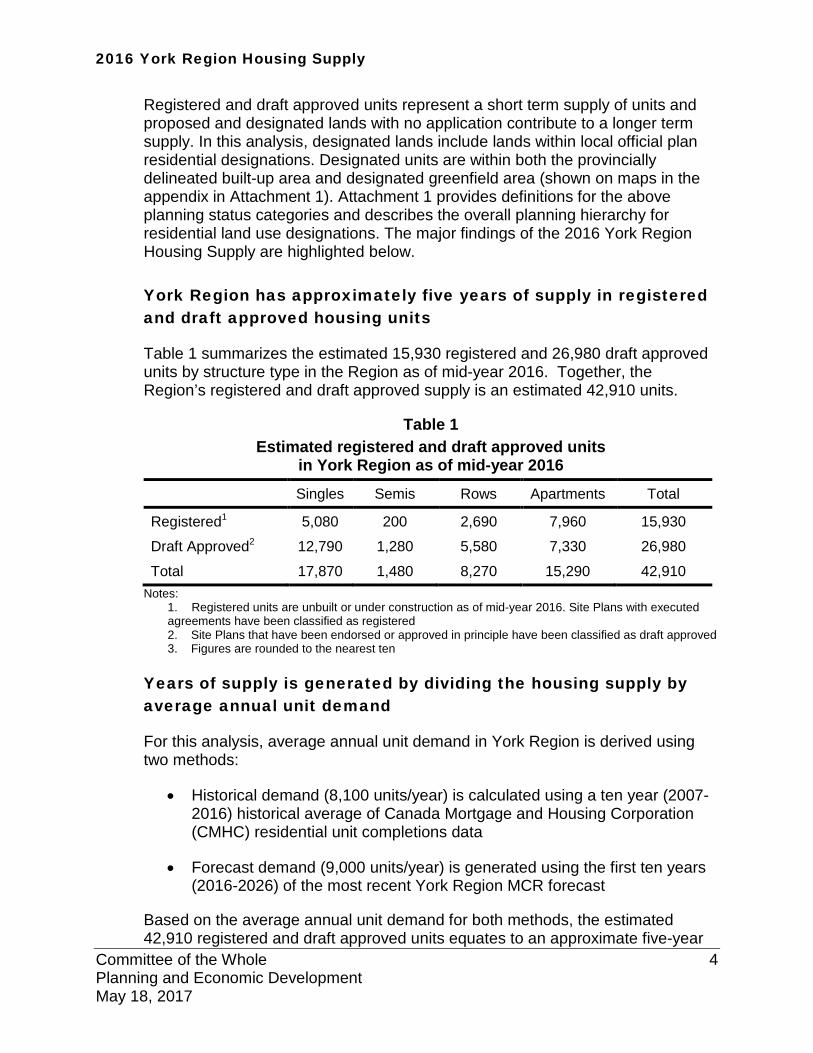
Table 1 summarizes the estimated 15,930 registered and 26,980 draft approved units by structure type in the Region as of mid-year 2016. Together, the Region’s registered and draft approved supply is an estimated 42,910 units.
Table 1 Estimated registered and draft approved units
in York Region as of mid-year 2016
Singles Semis Rows Apartments Total
Registered1 5,080 200 2,690 7,960 15,930
Draft Approved2 12,790 1,280 5,580 7,330 26,980
Total 17,870 1,480 8,270 15,290 42,910 Notes:
1. Registered units are unbuilt or under construction as of mid-year 2016. Site Plans with executed agreements have been classified as registered 2. Site Plans that have been endorsed or approved in principle have been classified as draft approved 3. Figures are rounded to the nearest ten
Years of supply is generated by dividing the housing supply by average annual unit demand
For this analysis, average annual unit demand in York Region is derived using two methods:
• Historical demand (8,100 units/year) is calculated using a ten year (2007-2016) historical average of Canada Mortgage and Housing Corporation (CMHC) residential unit completions data
• Forecast demand (9,000 units/year) is generated using the first ten years (2016-2026) of the most recent York Region MCR forecast
Based on the average annual unit demand for both methods, the estimated 42,910 registered and draft approved units equates to an approximate five-year
Committee of the Whole 4 Planning and Economic Development May 18, 2017
2016 York Region Housing Supply
supply. This falls within the YROP 2010 policy requirement of three to seven years of registered and draft approved housing supply.
The fact that the five years of registered and draft approved supply is as of mid-year 2016 does not mean that a current (May 2017) estimate of the years of supply would be less than five years. It is important to note that applications move through the planning process and although some units that were registered and draft approved as of mid-year 2016 may be built and occupied today, there are also units that have advanced in the planning process (eg. from proposed to draft approved) and would now be reflected in the registered and draft approved category.
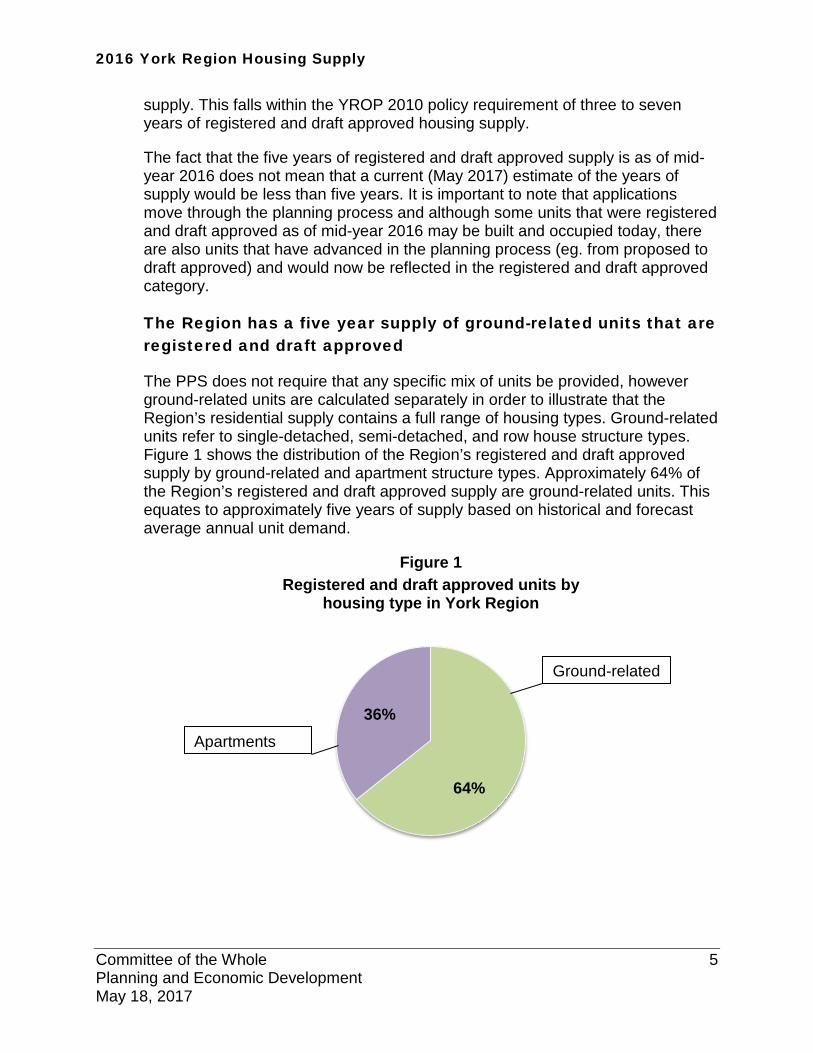
The Region has a five year supply of ground-related units that are registered and draft approved
The PPS does not require that any specific mix of units be provided, however ground-related units are calculated separately in order to illustrate that the Region’s residential supply contains a full range of housing types. Ground-related units refer to single-detached, semi-detached, and row house structure types. Figure 1 shows the distribution of the Region’s registered and draft approved supply by ground-related and apartment structure types. Approximately 64% of the Region’s registered and draft approved supply are ground-related units. This equates to approximately five years of supply based on historical and forecast average annual unit demand.
Figure 1 Registered and draft approved units by
housing type in York Region
64%
36%
Ground-related
Apartments
Committee of the Whole 5 Planning and Economic Development May 18, 2017

2016 York Region Housing Supply
Regional water and wastewater capacity significantly exceeds the number of registered and draft approved units
The Region is responsible for assigning water and wastewater servicing capacity to the local municipalities and for monitoring and updating capacity assignments on a regular basis in order to support growth in the short and medium term. Based on the current assignment, there is capacity in regional water and wastewater infrastructure to accommodate growth of up to 227,700 people or 82,600 units. Given that the Region’s 42,910 units of registered and draft approved supply account for only 52% of this total, there is sufficient servicing capacity at the regional level to accommodate more than the five years of registered and draft approved units growth. This exceeds the PPS requirement to maintain a sufficient supply of land with servicing capacity to provide a minimum three year supply of registered and draft approved units.
Local municipalities have already allocated servicing capacity to approximately 85% of registered and draft approved units
Once capacity assignments are provided by the Region, the local municipalities then, in turn, allocate servicing capacity to specific development applications. Based on the most recent servicing monitoring exercise, approximately 36,400 or 85%, of the registered and draft approved units are within applications that have had servicing capacity allocated by the local municipalities. Breaking this down by structure type, approximately 91% of ground-related units within registered or draft approved applications have been allocated servicing.
As outlined above, regional water and wastewater capacity is available beyond what has currently been allocated by local municipalities to support longer-term residential development. It should be noted that there may be infrastructure constraints at the local municipal level (e.g. local trunks) that would affect the timing of applications moving forward in the planning approvals process.
Investment in transportation and transit is at unprecedented levels
The Region continues to invest in infrastructure to support growth. Approximately $2.3 billion of construction is planned through the 2017 10-Year Roads and Transit Capital Program, of which $1.6 billion are for growth related projects. This reflects Council’s support of growing a Regional transit system, building road and transit system improvements and maintaining transportation assets to provide an efficient transportation network.
Significant investment in capital water and wastewater infrastructure is also being made by the Region. The 2017 10 Year Capital Plan includes $2.4 billion in capital works, of which approximately $1.33 billion is for growth infrastructure in
Committee of the Whole 6 Planning and Economic Development May 18, 2017

2016 York Region Housing Supply
the water and wastewater program. These investments support priority projects that are crucial to providing timely servicing capacity to municipalities.
Designated land supply provides for longer term growth in the Region
Building on the information presented in Table 1 above, Table 2 summarizes the designated housing supply in the Region by planning status. In addition to the registered and draft approved units, the Region’s designated supply includes units within planning applications that are proposed as well as potential development and re-development of lands with a residential designation in local official plans but which currently have no application. Estimates for lands with no application are based on approved secondary plan build-out targets and information provided by local municipal planning staff.
Table 2 York Region designated residential unit supply
by planning status as of mid-year 2016
Singles Semis Rows Apartments All types
Registered1 5,080 200 2,690 7,960 15,930
Draft Approved2 12,790 1,280 5,580 7,330 26,980
Proposed 6,530 700 12,220 33,610 53,060
No Application3 27,700 3,790 20,510 39,490 91,490
Total Designated Supply 52,100 5,970 41,000 88,390 187,460
Notes: 1. Site Plans with executed agreements have been classified as registered 2. Site Plans that have been endorsed or approved in principle have been classified as draft approved 3. No application apartments include estimates for secondary plan areas and the Regional Centres
only and does not reflect the Region’s full infill and intensification potential. 4. Figures are rounded to the nearest ten
Included in the no application figure are estimates for ROPA’s 1, 2, and 3. Based on preliminary estimates, these areas will accommodate a total of approximately 31,000 units. It is anticipated that secondary plans for these areas will be approved within the next one to two years, at which time development applications can be submitted. The timing of unit growth in these areas could be affected if secondary plan approval is appealed to the Ontario Municipal Board (OMB).
ROPAs 1 and 2 are also within areas of the Region in which the delivery of water and wastewater infrastructure may impact the timing and location of long-term designated supply. Key infrastructure projects will impact growth in the following areas:
Committee of the Whole 7 Planning and Economic Development May 18, 2017

2016 York Region Housing Supply
• Capacity increases in Aurora, Newmarket, and East Gwillimbury are contingent on completion of the Upper York Sewage Solutions (UYSS) project which is scheduled for completion in 2024. Unit growth in ROPA 1 cannot occur until this time.
• The Northeast Vaughan Water and Wastewater Servicing Project is required to support the full buildout of northeast Vaughan, including ROPA 2.
York Region has a 21 to 23 year supply of land designated for residential development
As shown in Table 2, the total designated residential unit supply is approximately 187,460 units. Using historical average annual completions (8,100/year), the Region has approximately 23 years of residential unit supply. Based on the forecast method (9,000 units/year), there are approximately 21 years of supply. The designated supply is well beyond the 10 years of designated supply requirement in both the PPS and the YROP 2010. In terms of designated ground-related unit types, the Region has a 16 to 17 year supply.
The Region’s developing Centres and Corridors are contributing to the increase in apartment units in York Region
The analysis above illustrates that there is a large number of apartment units in the Region’s housing supply. Increased levels of apartment development will contribute towards achieving a more diverse housing mix than the Region’s existing housing stock, which is heavily weighted towards ground-related housing (approximately 86%). This will support Regional Official Plan policies which promote the provision of a diverse housing stock with a full range of housing types. YROP 2010 polices related to intensification and meeting the Growth Plan intensification target, together with significant federal, provincial, and regional financial investment in transit, also supports a shift towards higher density forms of development.
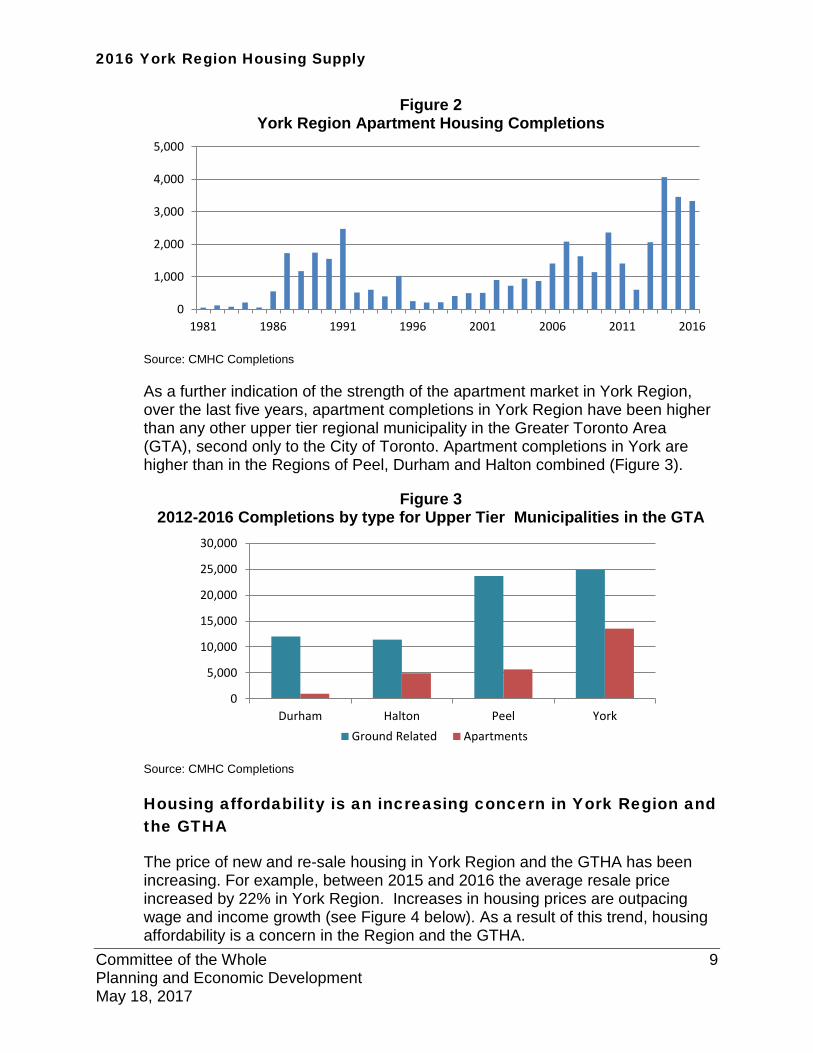
As shown in Figure 2, since the late 1990s, there has been a general upward trend in apartment development in the Region. In the 2013 to 2016 period, an average of 3,200 apartment units were built per year compared to approximately 1,200 apartment units built annually from 2001 to 2012. This upward trend is continuing with approximately 6,300 apartment units under construction in the Region as of March 2017 and an additional 15,300 apartment units that are registered and draft approved, as reported in this analysis.
Committee of the Whole 8 Planning and Economic Development May 18, 2017
2016 York Region Housing Supply
Figure 2 York Region Apartment Housing Completions
0
1,000
2,000
3,000
4,000
5,000
1981 1986 1991 1996 2001 2006 2011 2016
Source: CMHC Completions
As a further indication of the strength of the apartment market in York Region, over the last five years, apartment completions in York Region have been higher than any other upper tier regional municipality in the Greater Toronto Area (GTA), second only to the City of Toronto. Apartment completions in York are higher than in the Regions of Peel, Durham and Halton combined (Figure 3).
Figure 3 2012-2016 Completions by type for Upper Tier Municipalities in the GTA
0
5,000
10,000
15,000
20,000
25,000
30,000
Durham Halton Peel YorkGround Related Apartments
Source: CMHC Completions
Housing affordability is an increasing concern in York Region and the GTHA
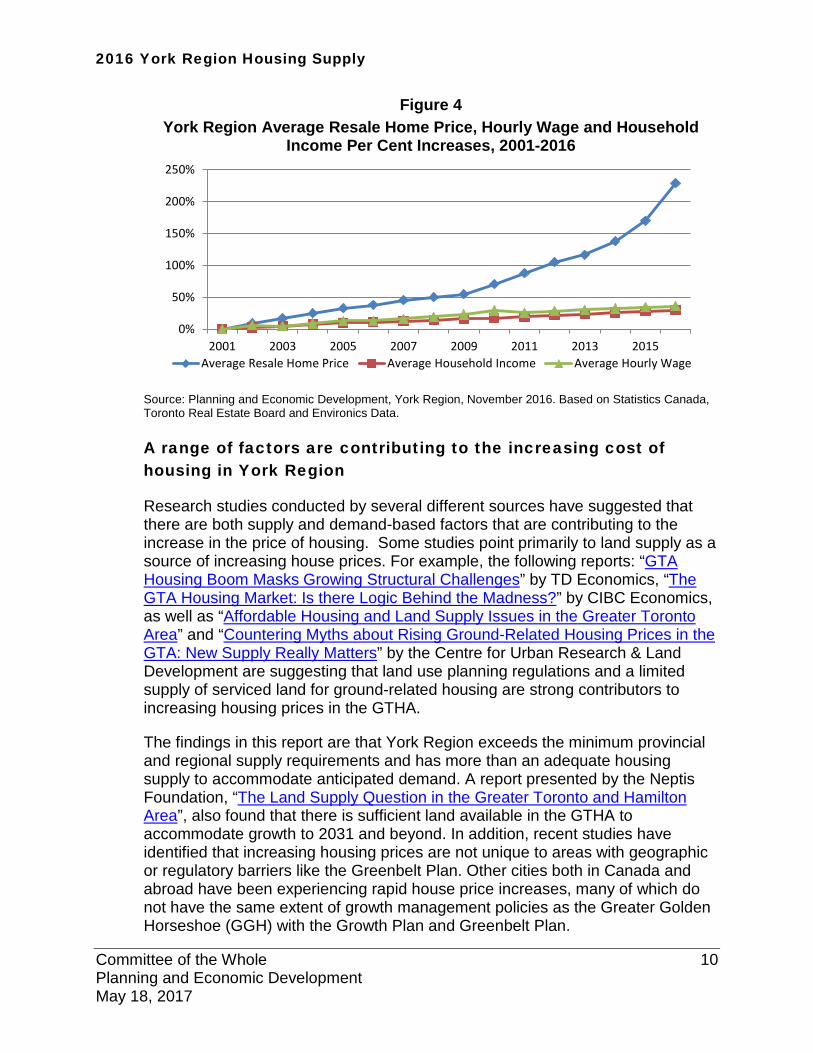
The price of new and re-sale housing in York Region and the GTHA has been increasing. For example, between 2015 and 2016 the average resale price increased by 22% in York Region. Increases in housing prices are outpacing wage and income growth (see Figure 4 below). As a result of this trend, housing affordability is a concern in the Region and the GTHA.
Committee of the Whole 9 Planning and Economic Development May 18, 2017
2016 York Region Housing Supply
Figure 4 York Region Average Resale Home Price, Hourly Wage and Household
Income Per Cent Increases, 2001-2016
0%
50%
100%
150%
200%
250%
2001 2003 2005 2007 2009 2011 2013 2015Average Resale Home Price Average Household Income Average Hourly Wage
Source: Planning and Economic Development, York Region, November 2016. Based on Statistics Canada, Toronto Real Estate Board and Environics Data.
A range of factors are contributing to the increasing cost of housing in York Region
Research studies conducted by several different sources have suggested that there are both supply and demand-based factors that are contributing to the increase in the price of housing. Some studies point primarily to land supply as a source of increasing house prices. For example, the following reports: “GTA Housing Boom Masks Growing Structural Challenges” by TD Economics, “The GTA Housing Market: Is there Logic Behind the Madness?” by CIBC Economics, as well as “Affordable Housing and Land Supply Issues in the Greater Toronto Area” and “Countering Myths about Rising Ground-Related Housing Prices in the GTA: New Supply Really Matters” by the Centre for Urban Research & Land Development are suggesting that land use planning regulations and a limited supply of serviced land for ground-related housing are strong contributors to increasing housing prices in the GTHA.
The findings in this report are that York Region exceeds the minimum provincial and regional supply requirements and has more than an adequate housing supply to accommodate anticipated demand. A report presented by the Neptis Foundation, “The Land Supply Question in the Greater Toronto and Hamilton Area”, also found that there is sufficient land available in the GTHA to accommodate growth to 2031 and beyond. In addition, recent studies have identified that increasing housing prices are not unique to areas with geographic or regulatory barriers like the Greenbelt Plan. Other cities both in Canada and abroad have been experiencing rapid house price increases, many of which do not have the same extent of growth management policies as the Greater Golden Horseshoe (GGH) with the Growth Plan and Greenbelt Plan.
Committee of the Whole 10 Planning and Economic Development May 18, 2017
2016 York Region Housing Supply
In addition to supply-related factors, other studies have indicated that there are a number of demand-based factors that are contributing to increasing housing prices. There is no one cause on its own that is responsible for the recent price surge. For example, “Priced Out: Understanding the factors affecting home prices in the GTA” by the Pembina Institute and RBC proposes the following five factors as being the main drivers of increased housing prices:
• Demographics, including strong population growth, • the cost and accessibility of mortgages (eg. low interest rates), • construction and development costs, • land availability and regulations, and • geographic location (proximity to urban centres, amenities, and transit)
and type of dwelling.
A recent report “In High Demand: Addressing the demand factors behind Toronto’s housing affordability problem” published by Ryerson’s City Building Institute highlights powerful demand side pressures such as low interest rates and the attractiveness of real estate as an investment as key drivers of house price increases in the GTHA. The report suggests that foreign investment and speculative activity may also be having an impact.
The Province has introduced measures to help address housing affordability
To help address the rapidly increasing housing prices and rents in the GTHA, the Province introduced Ontario’s Fair Housing Plan on April 20th, 2017 which aims to help more people find affordable homes, increase supply, protect buyers and renters and bring stability to the real estate market. The Plan includes 16 different measures in four areas:
• actions to address demand for housing including introducing legislation that, if passed, would implement a 15-per-cent non-resident speculation tax on the price of homes in the GGH,
• actions to protect renters including expanding rent control to all private rental units in Ontario,
• actions to increase housing supply including establishing a program to leverage the value of surplus provincial land assets,
• actions to protect homebuyers and increase information sharing including establishing a housing advisory group comprised of a range of stakeholders
Staff will be providing more detail on Ontario’s Fair Housing Plan in a report to Committee in June.
Committee of the Whole 11 Planning and Economic Development May 18, 2017

2016 York Region Housing Supply
The Ontario Municipal Board appeal process can delay the supply of housing reaching the market
Notwithstanding the 21-23 years of designated supply and over 16 years of designated ground-related supply in York Region, increasing the supply of greenfield land for development would not have an immediate impact on increasing housing prices. The multiple steps involved in the planning and development approvals process means that it would take eight to twelve years to bring new urban lands to the market, a process that could be further extended by appeals to the OMB at many stages of the planning process. To conform with new policies in the 2006 Growth Plan, the Region and local municipalities have undertaken full updates of their official plans, a process that experienced lengthy delays as a result of the Regional Official Plan and numerous local official plans being appealed to the OMB (Attachment 2). For example, the three New Community Areas that were brought into the urban boundary (ROPA’s 1, 2, and 3) in 2010 through the Regional Official Plan update are not yet available for development seven years later. These areas are still undergoing the secondary plan and Master Environmental Servicing Plan process. This is partially attributed to delays earlier in the process when these areas were appealed at the regional and local municipal level. The Province proposes to create a multi-ministry working group which aims to work with the development industry and municipalities to identify opportunities to streamline the development approvals process. Analysis forms part of the ongoing monitoring of the Region’s housing supply
The analysis in this report examines the current state of the Region’s housing supply. Regional staff will continue to monitor housing supply on a regular basis. In addition, when the Municipal Comprehensive Review resumes following the release of the final Provincial Plans, an update to the housing supply analysis will be undertaken as part of updating the Region’s forecasts to 2041 and meeting regional and provincial policy requirements.
Monitoring the Region’s housing supply supports the housing related goals of the Regional Official Plan, the 2015 to 2019 Strategic Plan, Vision 2051, and the 10 year Housing Plan
Monitoring the Region’s housing supply provides an assessment of compliance with Regional Official Plan policies related to the provision of housing supply and forms part of the monitoring framework for the Regional Official Plan. It also supports a number of the 2015 to 2019 Strategic Plan priority areas including: Increasing the range of available and affordable housing choices and encouraging growth in Regional Centres and Corridors. Vision 2051’s goal of
Committee of the Whole 12 Planning and Economic Development May 18, 2017
2016 York Region Housing Supply
creating Liveable Cities and Complete Communities is also supported through monitoring the Region’s housing supply and the continued transition to a more diverse housing stock.
5. Financial Considerations
Monitoring the Region’s housing supply is important for both financial and infrastructure planning. The type, amount and rate of annual residential development has a direct impact on annual development charge revenue and the Region’s overall financial position. The timing, location and amount of residential growth also has impacts on the timing of delivery of regional infrastructure and services and the associated costs.
6. Local Municipal Impact
Local municipalities were consulted in the gathering of the background data for the estimate of housing supply by planning status. Regional staff will continue to work with local municipal staff in future updates of the Regional housing supply as part of the Regional MCR process.
7. Conclusion
The Region currently has approximately five years of housing supply in registered and draft approved units, exceeding the YROP 2010 minimum requirement of three years. There is sufficient regional water and wastewater capacity available to accommodate the five years of registered and draft approved supply, and beyond, surpassing the PPS requirement of three years. In addition, the Region has 21 to 23 years of designated housing supply, which surpasses the Regional and Provincial policy requirements of 10 years.
York Region and other areas in the GTHA and beyond are experiencing increases in housing prices that are outpacing increases in income. Both demand and supply factors have an impact on the fluctuation in housing prices. Based on the analysis in this report, the Region has an adequate supply of both registered and draft approved and designated units to support anticipated demand.
For more information on this report, please contact Paul Bottomley, Manager, Policy Research and Forecasting at 1-877-464-9675 ext. 71530.
Committee of the Whole 13 Planning and Economic Development May 18, 2017
2016 York Region Housing Supply
The Senior Management Group has reviewed this report.
May 5, 2017
Attachments (2)
#7587911
Accessible formats or communication supports are available upon request
Committee of the Whole 14 Planning and Economic Development May 18, 2017

Attachment 1
2016 York Region Housing Supply
1
May 2017
2016 York Region Housing Supply

2 2016 | York Region Housing Supply
Table of Contents
Background 3
Regional and Provincial Policy Housing Supply Requirements 4
Housing Demand Methods for Estimating Years of Housing Supply 6
Planning Hierarchy in York Region 7
Registered and Draft Approved Housing Supply 8
York Region has Approximately Five Years Supply of Registered and Draft Approved Units 10
Regional Water and Wastewater Capacity Significantly Exceeds the Number of Registered and Draft Approved Units 11
There is a 21 to 23 Year Supply of Land Designated for Residential Development in York Region 13
The Region’s Developing Centres and Corridors are Contributing to the Increase in Apartment Units in York Region 17
Summary of Findings 19
Appendix: Local Municipal Housing Supply Maps 21
2016 | York Region Housing Supply 3
Summary of Findings• York Region has approximately 5 years supply of registered and draft approved units
• There is Regional servicing capacity for significantly more housing growth than the Region’s registered and draft approved units.
• York Region has 21 to 23 years supply of designated residential lands.
• The Region’s housing supply exceeds the requirements of both the York Region Official Plan, 2010 and the Provincial Policy Statement, 2014.
This report provides an assessment of York Region’s designated
housing supply with respect to Regional and Provincial Policy
requirements. It forms part of the Region’s ongoing monitoring of
the Regional housing supply and will assist in monitoring the
performance of the Region’s growth management policies and
initiatives. Data in this report is as of mid-year 2016 unless
otherwise noted.
Background
4 2016 | York Region Housing Supply
ProvincialPolicyStatement20
14
Under the Planning Act
BLEED
Ontario.ca/PPS
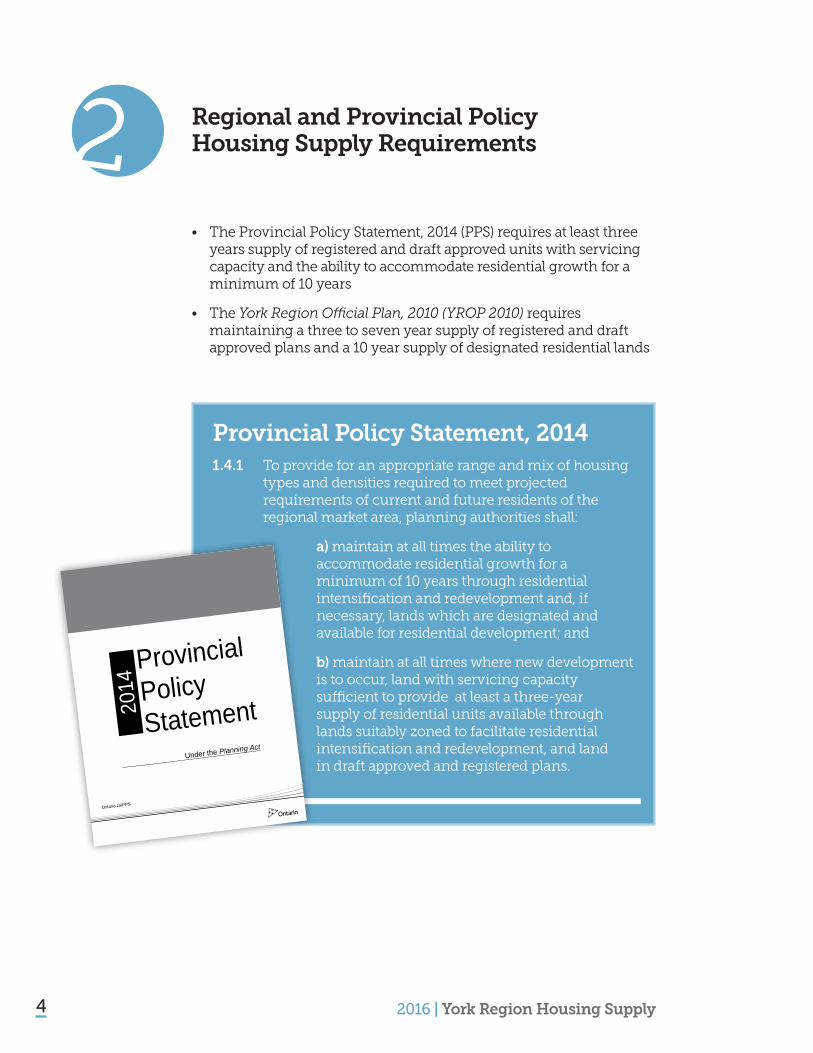
Provincial Policy Statement, 2014 1.4.1 To provide for an appropriate range and mix of housing types and densities required to meet projected requirements of current and future residents of the regional market area, planning authorities shall:
a) maintain at all times the ability to accommodate residential growth for a minimum of 10 years through residential intensification and redevelopment and, if necessary, lands which are designated and available for residential development; and
b) maintain at all times where new development is to occur, land with servicing capacity sufficient to provide at least a three-year supply of residential units available through lands suitably zoned to facilitate residential intensification and redevelopment, and land in draft approved and registered plans.
• The Provincial Policy Statement, 2014 (PPS) requires at least three years supply of registered and draft approved units with servicing capacity and the ability to accommodate residential growth for a minimum of 10 years
• The York Region Official Plan, 2010 (YROP 2010) requires maintaining a three to seven year supply of registered and draft approved plans and a 10 year supply of designated residential lands
Regional and Provincial Policy Housing Supply Requirements

2016 | York Region Housing Supply 5
York Region Official Plan 2010It is the policy of Council:
3.5.3 To ensure an adequate region-wide supply of housing by:
a. maintaining a minimum 10-year supply of land designated for housing through intensification and redevelopment and in designated greenfield areas; and,
b. maintaining a 3 to 7 year supply of registered and draft approved plans of subdivision, condominium plans and/or site plans.
5.1.3 That a minimum Region-wide 10-year supply of lands for housing be designated in this Plan and that the York Region 10-Year Capital Plan ensures timely servicing.
5.1.5 To maintain a housing supply of 3 to 7 years in registered and draft approved plans of subdivision, condominium plans and/or site plans.

6 2016 | York Region Housing Supply
0
1,500
3,000
4,500
6,000
7,500
9,000
Southern YorkHistorical Forecast Historical Forecast
Apartment Units
Ground-Related Units
Historical Forecast
Northern York York Region
Southern York Region: Markham,Richmond Hill and Vaughan
Northern York Region: Aurora,East Gwillimbury, Georgina, King, Newmarket and Whitchurch-Stou�ville
• Years of housing supply is calculated by dividing the supply of housing units by the projected annual demand in housing.
• Demand is calculated using two methods:
1. The historical average Canada Mortgage and Housing Corporation (CMHC) housing unit completions from 2007 to 2016; and
2. Forecast housing demand for the 2016 to 2026 period using the Region’s most recent forecast prepared for the Regional Municipal Comprehensive Review (MCR).
• Separate demand estimates are generated for southern and northern York Region to assess the housing supply within York Region for information purposes only, as the PPS and YROP 2010 policy requirements are to be applied at the Regional level only.
• The average annual housing demand in York Region ranges from approximately 8,100 units per year based on historical data to 9,000 units per year based on the forecast method. The breakdowns for demand estimates for southern and northern York Region as well as for ground-related (single, semi-detached and row units) and apartment units are shown in Figure 1.
Figure 1: Annual Average York Region Housing Demand
Housing Demand Methods for Estimating Years of Housing Supply
2016 | York Region Housing Supply 7
York Region O�cial PlanUrban Area Designation
Secondary PlansDetailed Residential Designation
Development ApplicationsPlans of Subdivision and Site Plans
1.Proposed2. Draft Approved
3. Registered Unbuilt
Local Municipal O�cial PlanResidential Designation
• Includes lands with No Application
Provincial PolicyStatement (PPS)10-Year Supply
Provincial PolicyStatement (PPS)
3-Year Supply
Planning Hierarchy in York Region
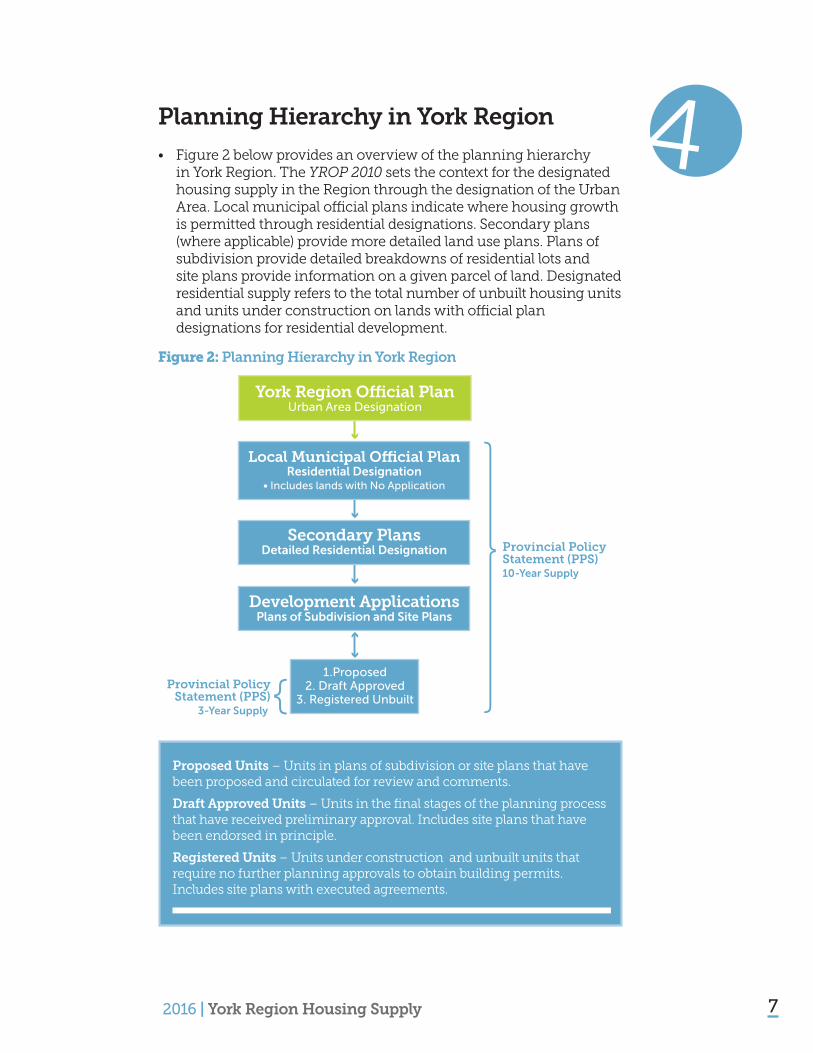
• Figure 2 below provides an overview of the planning hierarchy in York Region. The YROP 2010 sets the context for the designated housing supply in the Region through the designation of the Urban Area. Local municipal official plans indicate where housing growth is permitted through residential designations. Secondary plans (where applicable) provide more detailed land use plans. Plans of subdivision provide detailed breakdowns of residential lots and site plans provide information on a given parcel of land. Designated residential supply refers to the total number of unbuilt housing units and units under construction on lands with official plan designations for residential development.
Figure 2: Planning Hierarchy in York Region
Proposed Units – Units in plans of subdivision or site plans that have been proposed and circulated for review and comments.
Draft Approved Units – Units in the final stages of the planning process that have received preliminary approval. Includes site plans that have been endorsed in principle.
Registered Units – Units under construction and unbuilt units that require no further planning approvals to obtain building permits. Includes site plans with executed agreements.
8 2016 | York Region Housing Supply
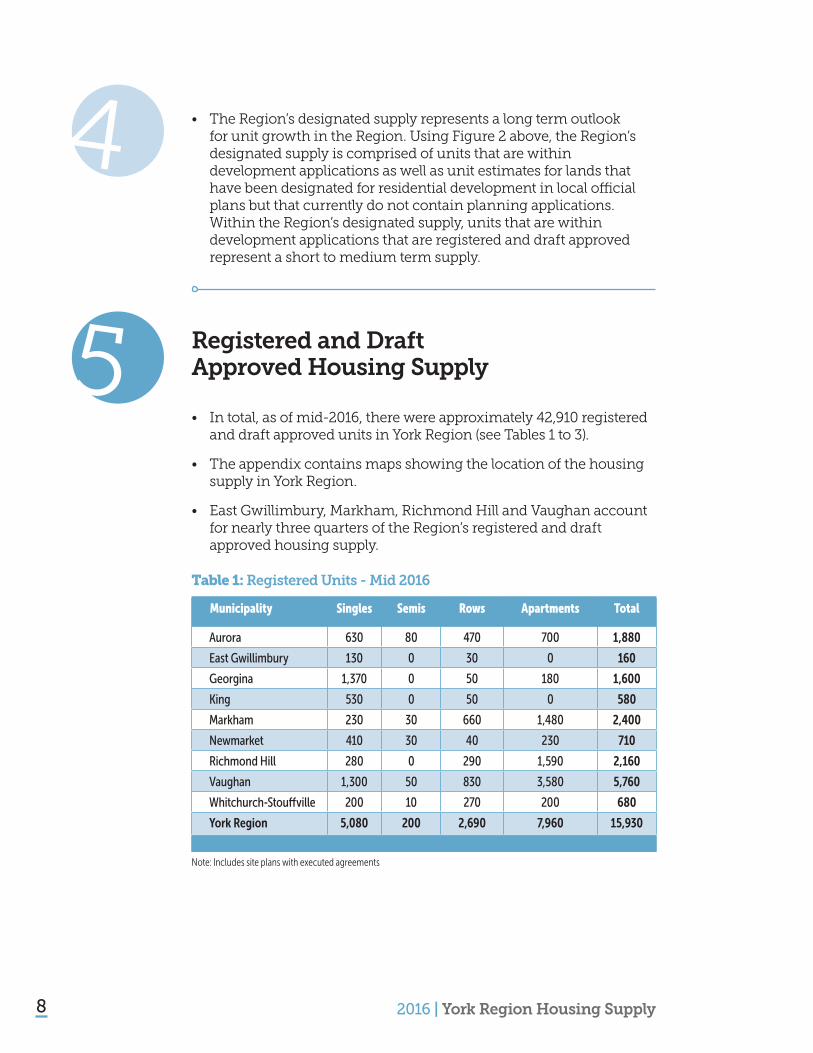
• The Region’s designated supply represents a long term outlook for unit growth in the Region. Using Figure 2 above, the Region’s designated supply is comprised of units that are within development applications as well as unit estimates for lands that have been designated for residential development in local official plans but that currently do not contain planning applications. Within the Region’s designated supply, units that are within development applications that are registered and draft approved represent a short to medium term supply.
Registered and Draft Approved Housing Supply
• In total, as of mid-2016, there were approximately 42,910 registered and draft approved units in York Region (see Tables 1 to 3).
• The appendix contains maps showing the location of the housing supply in York Region.
• East Gwillimbury, Markham, Richmond Hill and Vaughan account for nearly three quarters of the Region’s registered and draft approved housing supply.
Table 1: Registered Units - Mid 2016
Municipality Singles Semis Rows Apartments Total
Aurora 630 80 470 700 1,880
East Gwillimbury 130 0 30 0 160
Georgina 1,370 0 50 180 1,600
King 530 0 50 0 580
Markham 230 30 660 1,480 2,400
Newmarket 410 30 40 230 710
Richmond Hill 280 0 290 1,590 2,160
Vaughan 1,300 50 830 3,580 5,760
Whitchurch-Stouffville 200 10 270 200 680
York Region 5,080 200 2,690 7,960 15,930
Note: Includes site plans with executed agreements
2016 | York Region Housing Supply 9
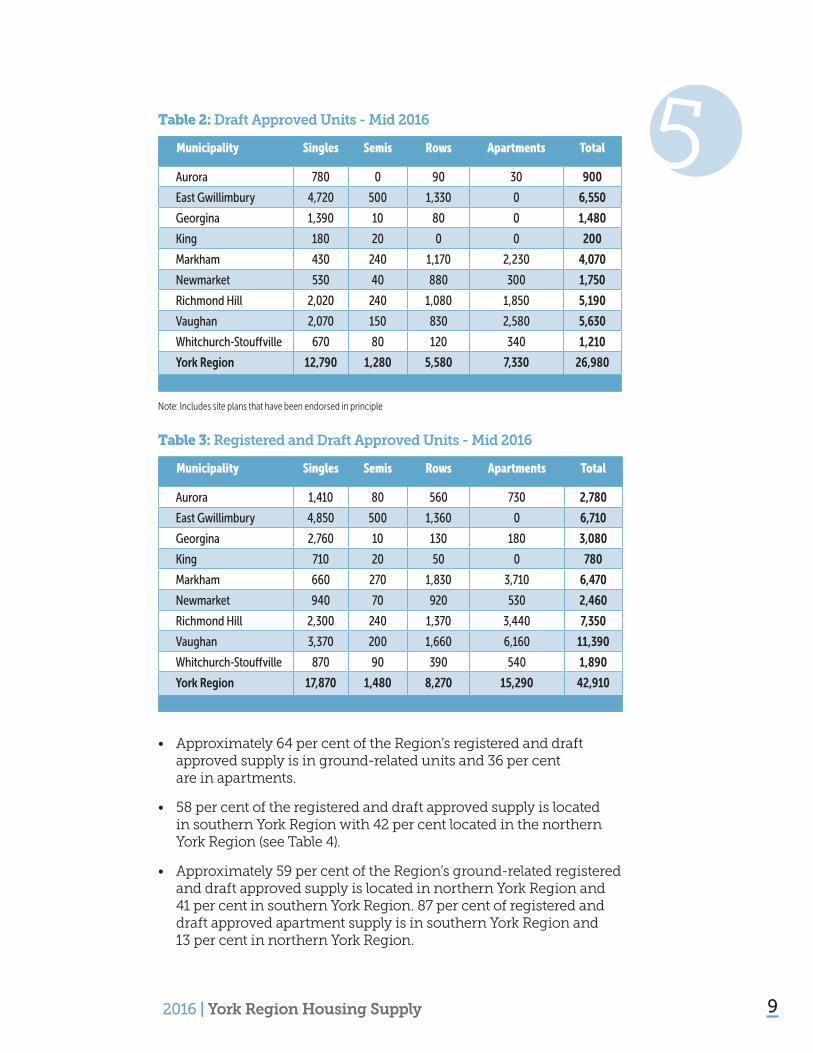
Table 2: Draft Approved Units - Mid 2016
Municipality Singles Semis Rows Apartments Total
Aurora 780 0 90 30 900
East Gwillimbury 4,720 500 1,330 0 6,550
Georgina 1,390 10 80 0 1,480
King 180 20 0 0 200
Markham 430 240 1,170 2,230 4,070
Newmarket 530 40 880 300 1,750
Richmond Hill 2,020 240 1,080 1,850 5,190
Vaughan 2,070 150 830 2,580 5,630
Whitchurch-Stouffville 670 80 120 340 1,210
York Region 12,790 1,280 5,580 7,330 26,980
Note: Includes site plans that have been endorsed in principle
Table 3: Registered and Draft Approved Units - Mid 2016
Municipality Singles Semis Rows Apartments Total
Aurora 1,410 80 560 730 2,780
East Gwillimbury 4,850 500 1,360 0 6,710
Georgina 2,760 10 130 180 3,080
King 710 20 50 0 780
Markham 660 270 1,830 3,710 6,470
Newmarket 940 70 920 530 2,460
Richmond Hill 2,300 240 1,370 3,440 7,350
Vaughan 3,370 200 1,660 6,160 11,390
Whitchurch-Stouffville 870 90 390 540 1,890
York Region 17,870 1,480 8,270 15,290 42,910
• Approximately 64 per cent of the Region’s registered and draft approved supply is in ground-related units and 36 per cent are in apartments.
• 58 per cent of the registered and draft approved supply is located in southern York Region with 42 per cent located in the northern York Region (see Table 4).
• Approximately 59 per cent of the Region’s ground-related registered and draft approved supply is located in northern York Region and 41 per cent in southern York Region. 87 per cent of registered and draft approved apartment supply is in southern York Region and 13 per cent in northern York Region.
10 2016 | York Region Housing Supply
0
4,000
8,000
12,000
16,000
20,000
24,000
28,000
Ground-Related ApartmentsSouthern YorkNorthern YorkSouthern YorkNorthern York
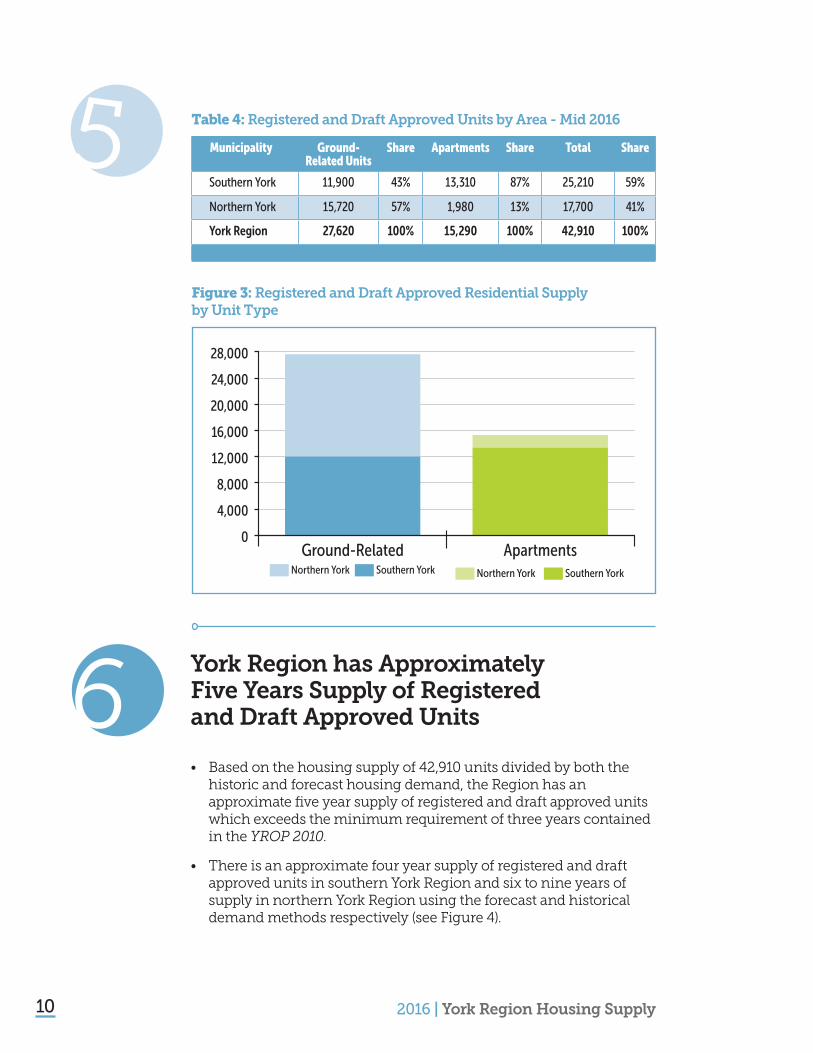
Table 4: Registered and Draft Approved Units by Area - Mid 2016
Municipality Ground- Related Units
Share Apartments Share Total Share
Southern York 11,900 43% 13,310 87% 25,210 59%
Northern York 15,720 57% 1,980 13% 17,700 41%
York Region 27,620 100% 15,290 100% 42,910 100%
Figure 3: Registered and Draft Approved Residential Supply by Unit Type
York Region has Approximately Five Years Supply of Registered and Draft Approved Units
• Based on the housing supply of 42,910 units divided by both the historic and forecast housing demand, the Region has an approximate five year supply of registered and draft approved units which exceeds the minimum requirement of three years contained in the YROP 2010.
• There is an approximate four year supply of registered and draft approved units in southern York Region and six to nine years of supply in northern York Region using the forecast and historical demand methods respectively (see Figure 4).
2016 | York Region Housing Supply 11
Years of Supply0
NorthernYork Region
SouthernYork Region
York Region
1 2 3 4 5 6 7 8 9 10
Historical Demand
Forecast Demand
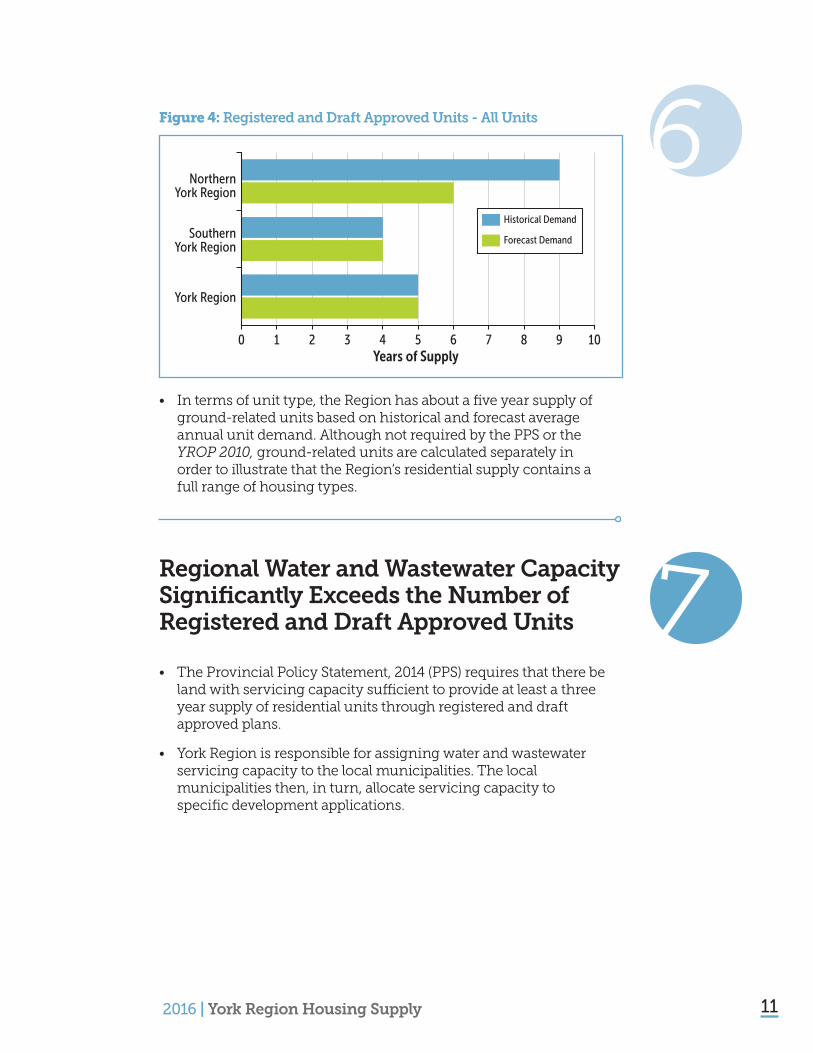
Figure 4: Registered and Draft Approved Units - All Units
• In terms of unit type, the Region has about a five year supply of ground-related units based on historical and forecast average annual unit demand. Although not required by the PPS or the YROP 2010, ground-related units are calculated separately in order to illustrate that the Region’s residential supply contains a full range of housing types.
Regional Water and Wastewater Capacity Significantly Exceeds the Number of Registered and Draft Approved Units
• The Provincial Policy Statement, 2014 (PPS) requires that there be land with servicing capacity sufficient to provide at least a three year supply of residential units through registered and draft approved plans.
• York Region is responsible for assigning water and wastewater servicing capacity to the local municipalities. The local municipalities then, in turn, allocate servicing capacity to specific development applications.
12 2016 | York Region Housing Supply
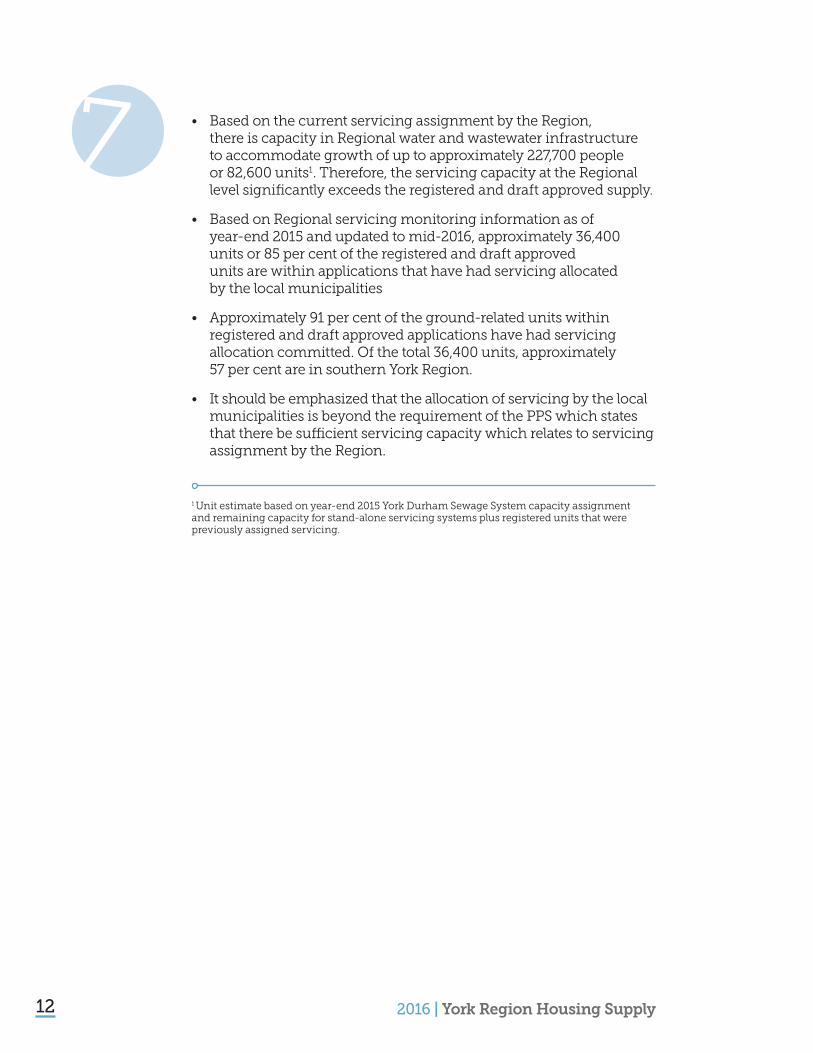
• Based on the current servicing assignment by the Region, there is capacity in Regional water and wastewater infrastructure to accommodate growth of up to approximately 227,700 people or 82,600 units1. Therefore, the servicing capacity at the Regional level significantly exceeds the registered and draft approved supply.
• Based on Regional servicing monitoring information as of year-end 2015 and updated to mid-2016, approximately 36,400 units or 85 per cent of the registered and draft approved units are within applications that have had servicing allocated by the local municipalities
• Approximately 91 per cent of the ground-related units within registered and draft approved applications have had servicing allocation committed. Of the total 36,400 units, approximately 57 per cent are in southern York Region.
• It should be emphasized that the allocation of servicing by the local municipalities is beyond the requirement of the PPS which states that there be sufficient servicing capacity which relates to servicing assignment by the Region.
1 Unit estimate based on year-end 2015 York Durham Sewage System capacity assignment and remaining capacity for stand-alone servicing systems plus registered units that were previously assigned servicing.
2016 | York Region Housing Supply 13
There is a 21 to 23 Year Supply of Land Designated for Residential Development in York Region
• Designated residential land refers to lands with official plan designations for residential development. It includes the Region’s three New Community Areas in East Gwillimbury, Markham and Vaughan (ROPA’s 1, 2 and 3) and other vacant lands in the Region with residential land use designations. Lands with and without secondary plans are part of the estimate of designated residential supply.
Designated Housing Supply • Registered units • Draft approved units • Proposed units • “No application” units on designated residential lands
- Housing supply includes both subdivisions and site plans
- Includes supply for both the Designated Greenfield Area (DGA) and the Built-up Area (BUA) as defined through the Provincial Growth Plan
• Housing unit estimates for “No Application” areas are based on approved secondary plan build-out targets, estimates for vacant residential lands based on observed densities in nearby developments and information provided by local municipal planning staff.
• The “No Application” estimate for apartment units consists only of estimates for greenfield secondary plan areas and the four Regional Centres2. It does not reflect the full infill and intensification potential for areas such as regional corridors, Key Development Areas, as well as local centres and corridors and infill development. These areas may or may not be subject to a secondary plan.
• The “No Application” estimate includes units within large greenfield areas such as Queensville, and ROPA’s 1, 2 and 3. It is anticipated that the secondary plans for ROPA’s 1, 2 and 3 will be finalized within the next one to two years at which time development applications are anticipated.
2For the Newmarket Regional Centre, the Urban Growth Centre portion is used.
14 2016 | York Region Housing Supply
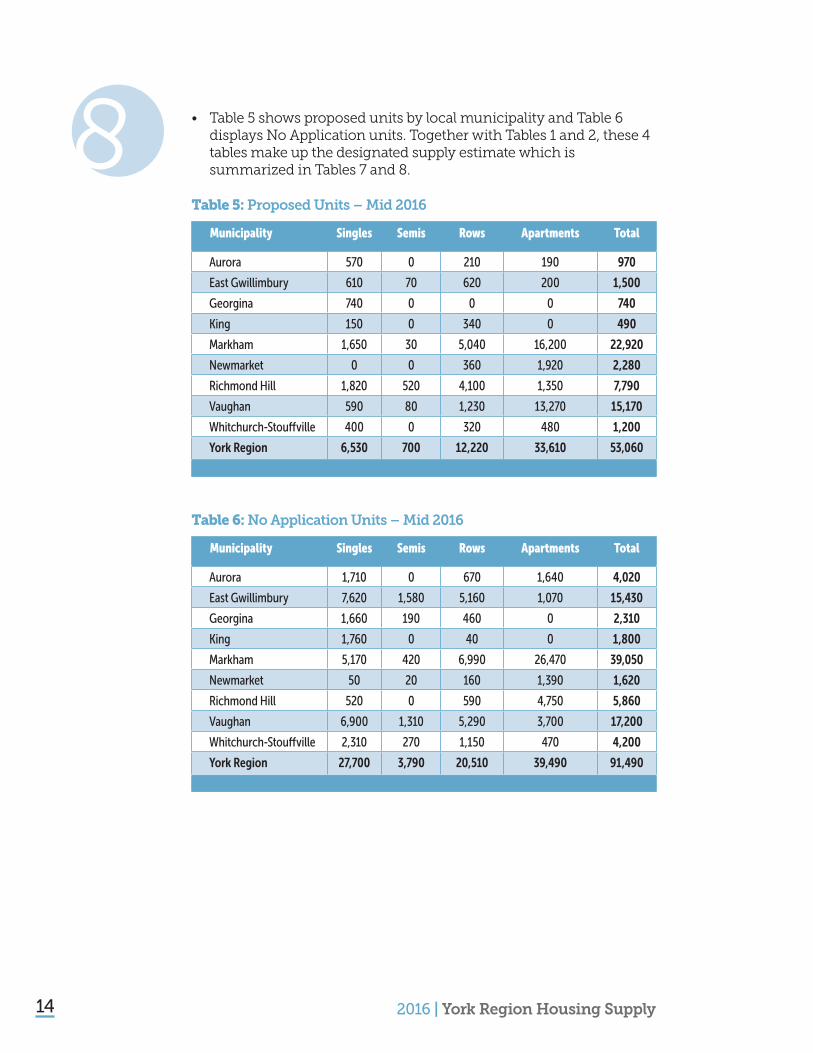
• Table 5 shows proposed units by local municipality and Table 6 displays No Application units. Together with Tables 1 and 2, these 4 tables make up the designated supply estimate which is summarized in Tables 7 and 8.
Table 5: Proposed Units – Mid 2016
Municipality Singles Semis Rows Apartments Total
Aurora 570 0 210 190 970
East Gwillimbury 610 70 620 200 1,500
Georgina 740 0 0 0 740
King 150 0 340 0 490
Markham 1,650 30 5,040 16,200 22,920
Newmarket 0 0 360 1,920 2,280
Richmond Hill 1,820 520 4,100 1,350 7,790
Vaughan 590 80 1,230 13,270 15,170
Whitchurch-Stouffville 400 0 320 480 1,200
York Region 6,530 700 12,220 33,610 53,060
Table 6: No Application Units – Mid 2016
Municipality Singles Semis Rows Apartments Total
Aurora 1,710 0 670 1,640 4,020
East Gwillimbury 7,620 1,580 5,160 1,070 15,430
Georgina 1,660 190 460 0 2,310
King 1,760 0 40 0 1,800
Markham 5,170 420 6,990 26,470 39,050
Newmarket 50 20 160 1,390 1,620
Richmond Hill 520 0 590 4,750 5,860
Vaughan 6,900 1,310 5,290 3,700 17,200
Whitchurch-Stouffville 2,310 270 1,150 470 4,200
York Region 27,700 3,790 20,510 39,490 91,490
2016 | York Region Housing Supply 15
Registered Draft Approved
Proposed No Application
8%
14%
28%49%
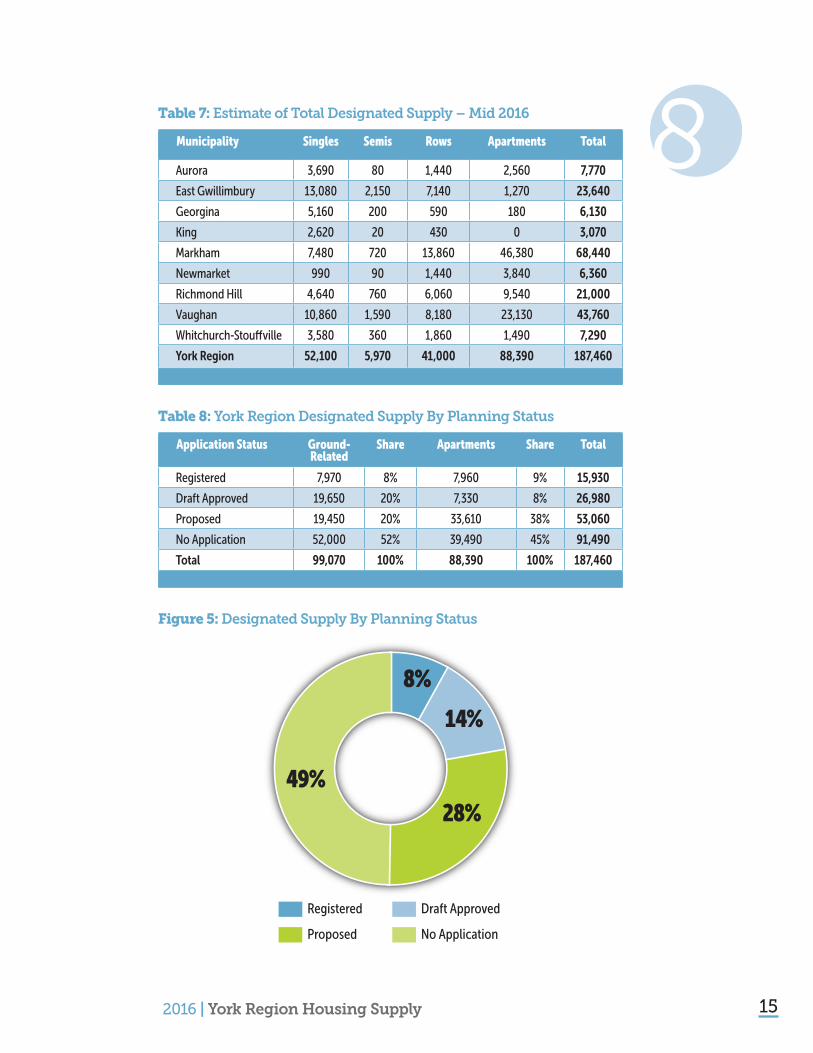
Table 7: Estimate of Total Designated Supply – Mid 2016
Municipality Singles Semis Rows Apartments Total
Aurora 3,690 80 1,440 2,560 7,770
East Gwillimbury 13,080 2,150 7,140 1,270 23,640
Georgina 5,160 200 590 180 6,130
King 2,620 20 430 0 3,070
Markham 7,480 720 13,860 46,380 68,440
Newmarket 990 90 1,440 3,840 6,360
Richmond Hill 4,640 760 6,060 9,540 21,000
Vaughan 10,860 1,590 8,180 23,130 43,760
Whitchurch-Stouffville 3,580 360 1,860 1,490 7,290
York Region 52,100 5,970 41,000 88,390 187,460
Table 8: York Region Designated Supply By Planning Status
Application Status Ground- Related
Share Apartments Share Total
Registered 7,970 8% 7,960 9% 15,930
Draft Approved 19,650 20% 7,330 8% 26,980
Proposed 19,450 20% 33,610 38% 53,060
No Application 52,000 52% 39,490 45% 91,490
Total 99,070 100% 88,390 100% 187,460
Figure 5: Designated Supply By Planning Status
16 2016 | York Region Housing Supply
Years of Supply
NorthernYork Region
SouthernYork Region
York Region
Historical
Forecast
0 5 10 15 20 25 30
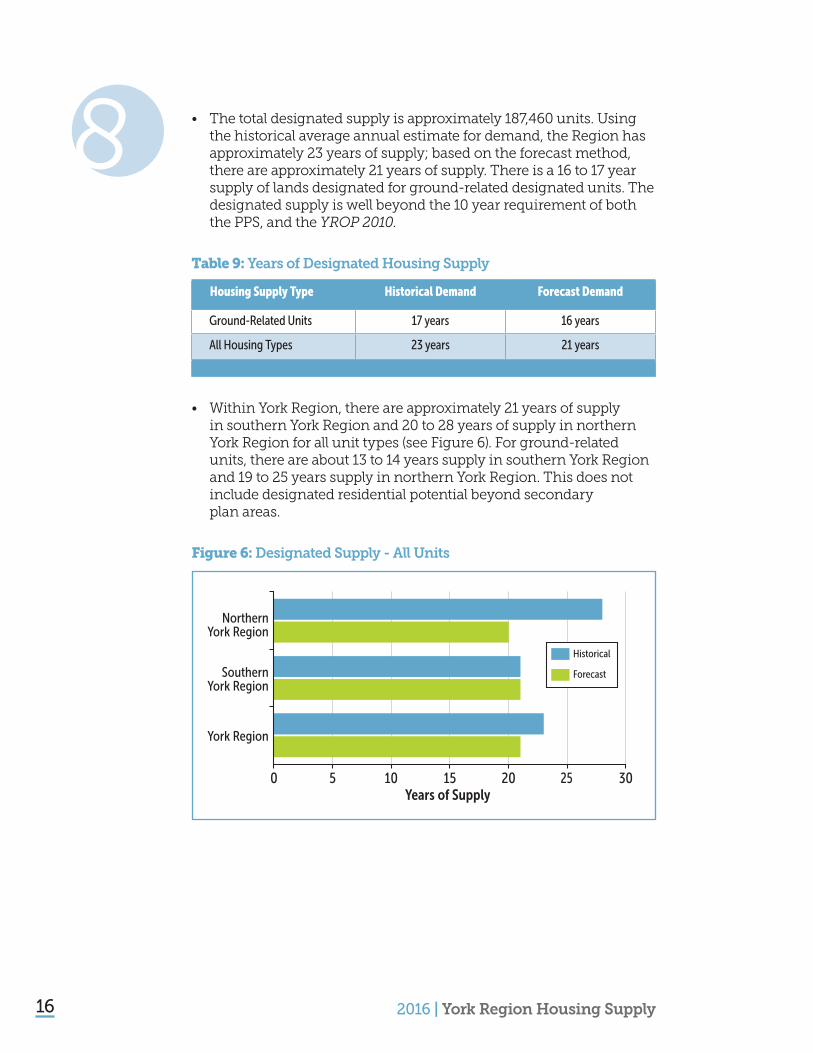
• The total designated supply is approximately 187,460 units. Using the historical average annual estimate for demand, the Region has approximately 23 years of supply; based on the forecast method, there are approximately 21 years of supply. There is a 16 to 17 year supply of lands designated for ground-related designated units. The designated supply is well beyond the 10 year requirement of both the PPS, and the YROP 2010.
Table 9: Years of Designated Housing Supply
Housing Supply Type Historical Demand Forecast Demand
Ground-Related Units 17 years 16 years
All Housing Types 23 years 21 years
• Within York Region, there are approximately 21 years of supply in southern York Region and 20 to 28 years of supply in northern York Region for all unit types (see Figure 6). For ground-related units, there are about 13 to 14 years supply in southern York Region and 19 to 25 years supply in northern York Region. This does not include designated residential potential beyond secondary plan areas.
Figure 6: Designated Supply - All Units
2016 | York Region Housing Supply 17
• There are some critical water and wastewater projects that are required to support full build-out of the long-term supply of specific areas in the Region.
- Capacity increases in Aurora, Newmarket and East Gwillimbury are contingent on completing the Upper York Sewage Solutions (UYSS) project which is expected to be completed in 2024.
- The Northeast Vaughan Water and Wastewater servicing project is required to support the full build-out of northeast Vaughan, including ROPA 2 (scheduled for completion in 2028).
The Region’s Developing Centres and Corridors are Contributing to the Increase in Apartment Units in York Region
• York Region’s existing housing stock is heavily weighted towards ground-related units at approximately 86 per cent of the housing base. YROP 2010 promotes provision of a diverse housing stock with a full range of housing types. Increased levels of apartment development and other forms of medium and high density housing will contribute towards achieving a more diverse housing base and support transit investment and the development of the Region’s Centres and Corridors.
• Since the late 1990s, there has been a general upward trend in apartment development in York Region (see Figure 7):
- 2013 to 2016 – average of 3,200 apartment completions per year
- 2001 to 2012 – average of 1,200 apartment completions per year
• 6,345 apartment units were under construction in the Region as of March 2017.
• Over the last five years, York Region has had the second highest number of apartment completions in the GTA, second only to the City of Toronto and higher than apartment completions in the Regions of Durham, Halton and Peel combined (see Figure 8).

18 2016 | York Region Housing Supply
201620112006200119961991198619810
600
1200
1800
2400
3000
3600
4200
Durham Region Halton Region Peel Region York Region0
5,000
10,000
15,000
20,000
25,000
Apartment Units
Ground-Related Units
Figure 7: York Region Apartment Housing Completions
Source: CMHC Housing Completions
Figure 8: Completions By Type for Upper Tier Municipalities in the GTA from 2012 to 2016
Source: CMHC Housing Completions

2016 | York Region Housing Supply 19
Summary of Findings
• The Region has approximately five years supply of registered and draft approved housing supply, exceeding the YROP 2010 requirement of three years.
• There is sufficient Regional water and wastewater servicing capacity to accommodate the five years of registered and draft approved supply and beyond to more than meet the minimum three year requirement in the PPS.
• The Region has 21 to 23 years of total designated residential supply which surpasses the Regional and Provincial policy requirement of 10 years.

20 2016 | York Region Housing Supply
2016 | York Region Housing Supply 21
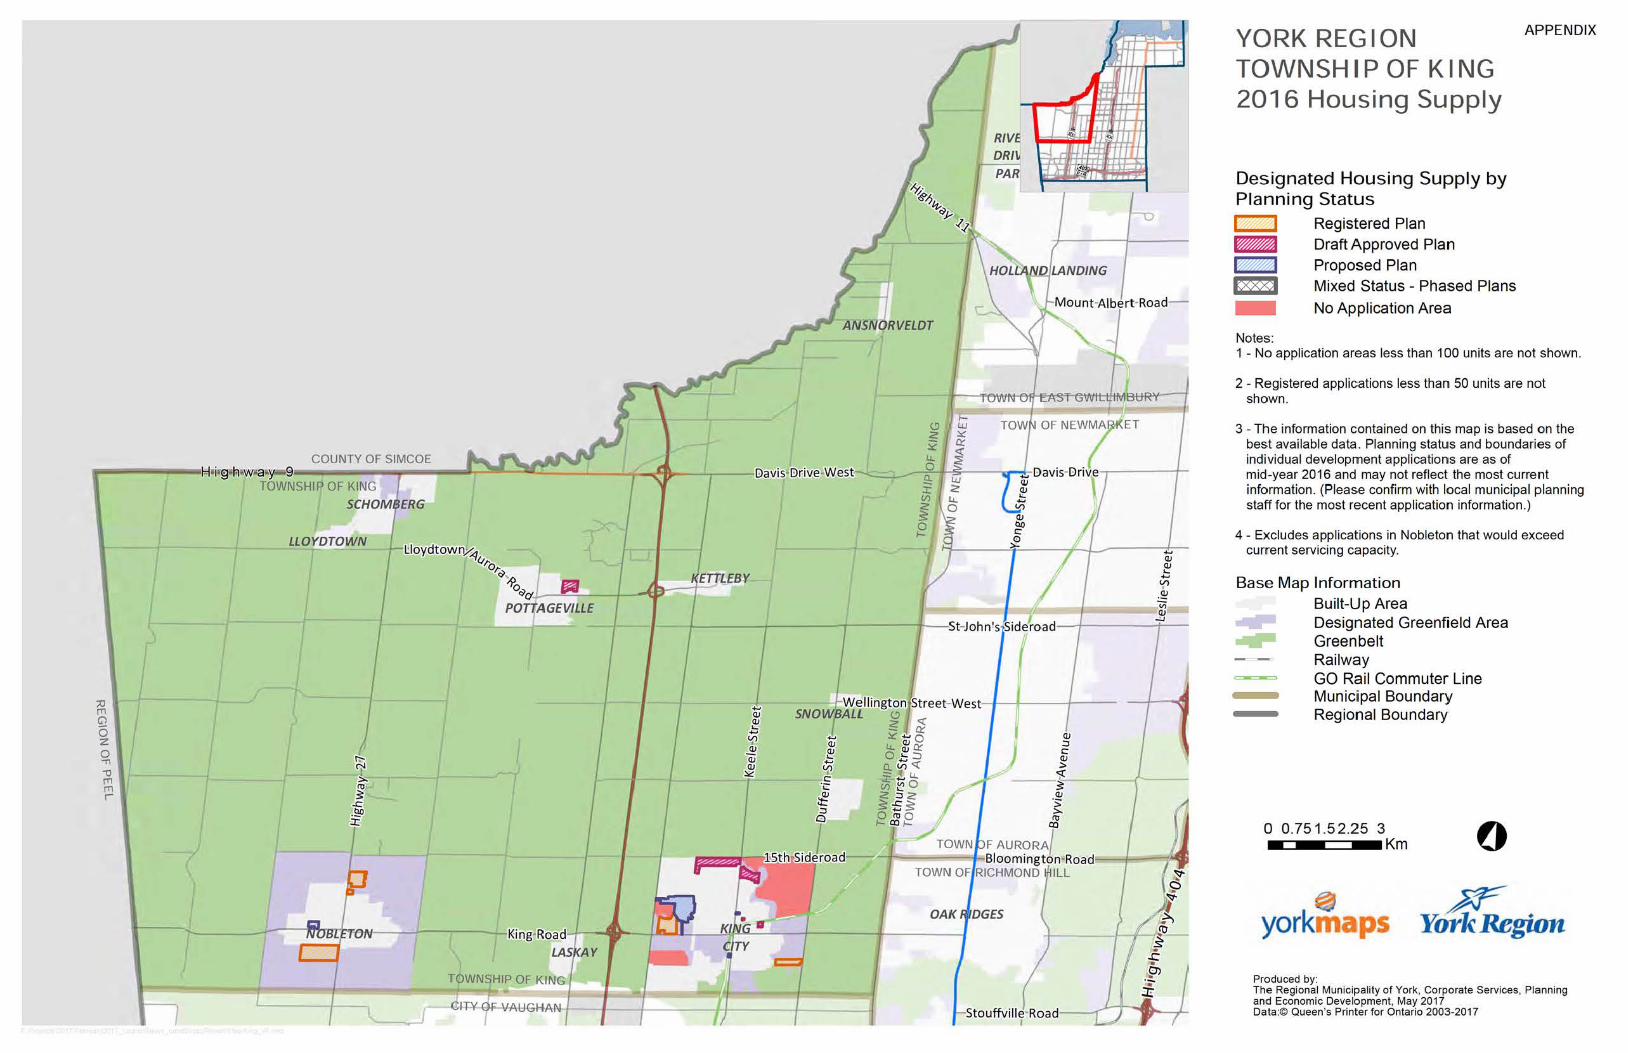
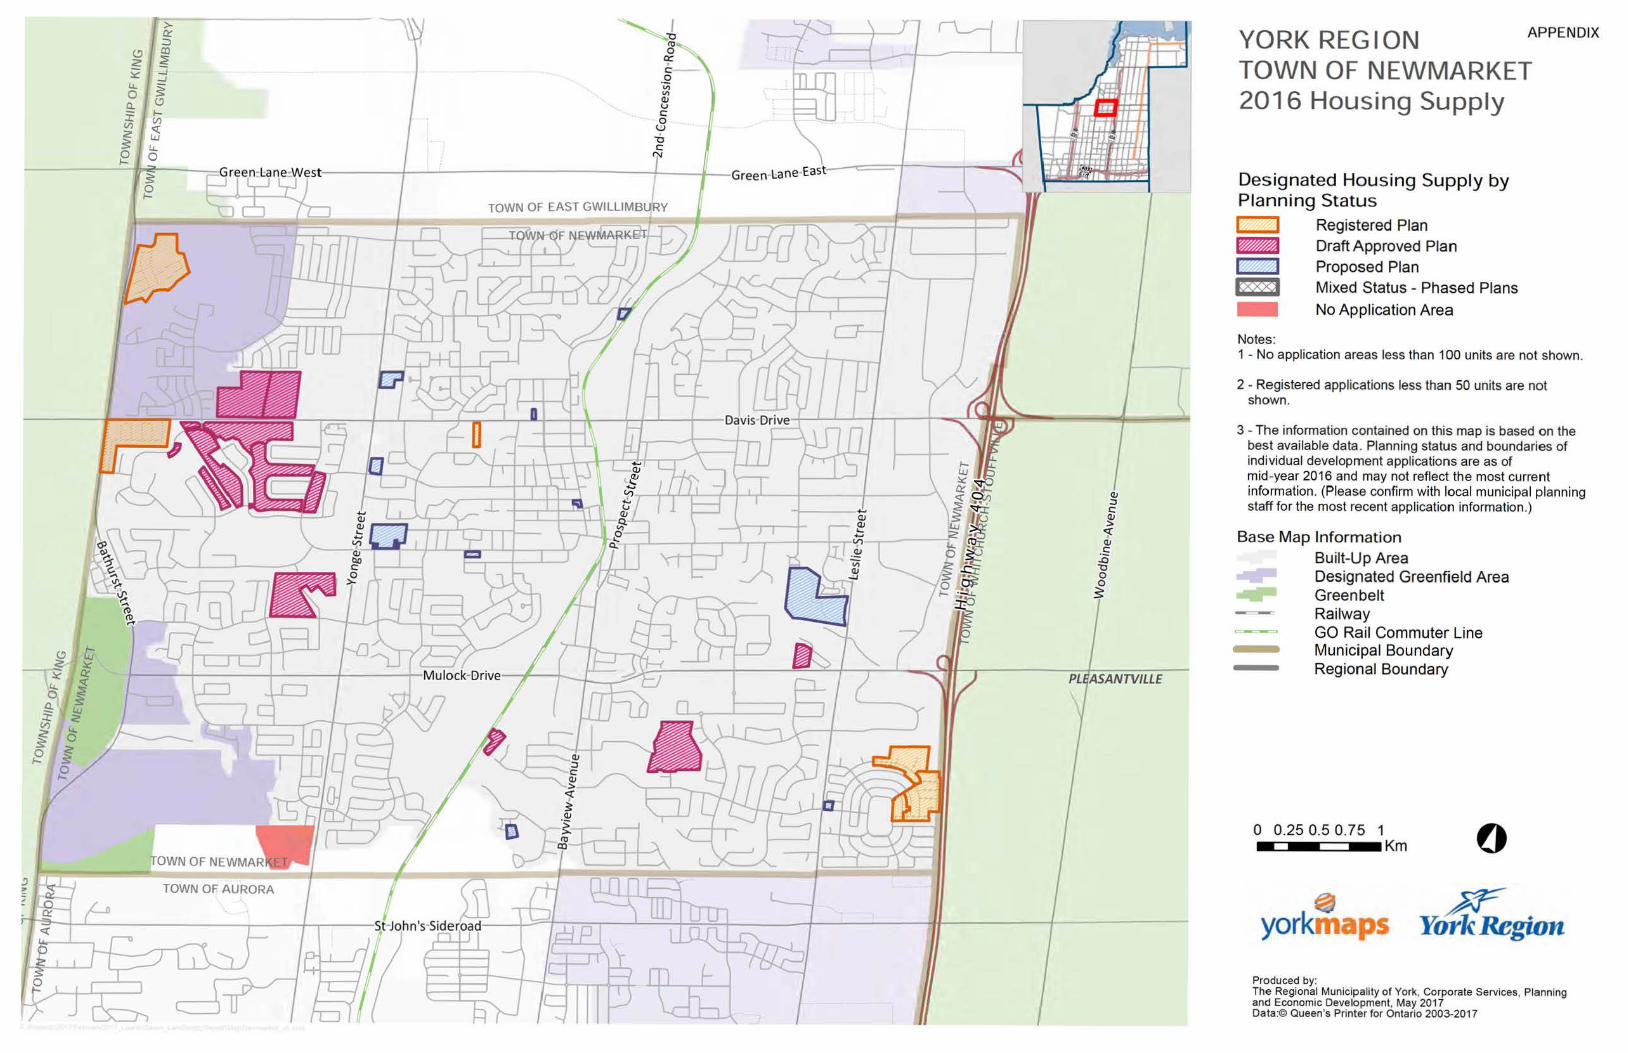
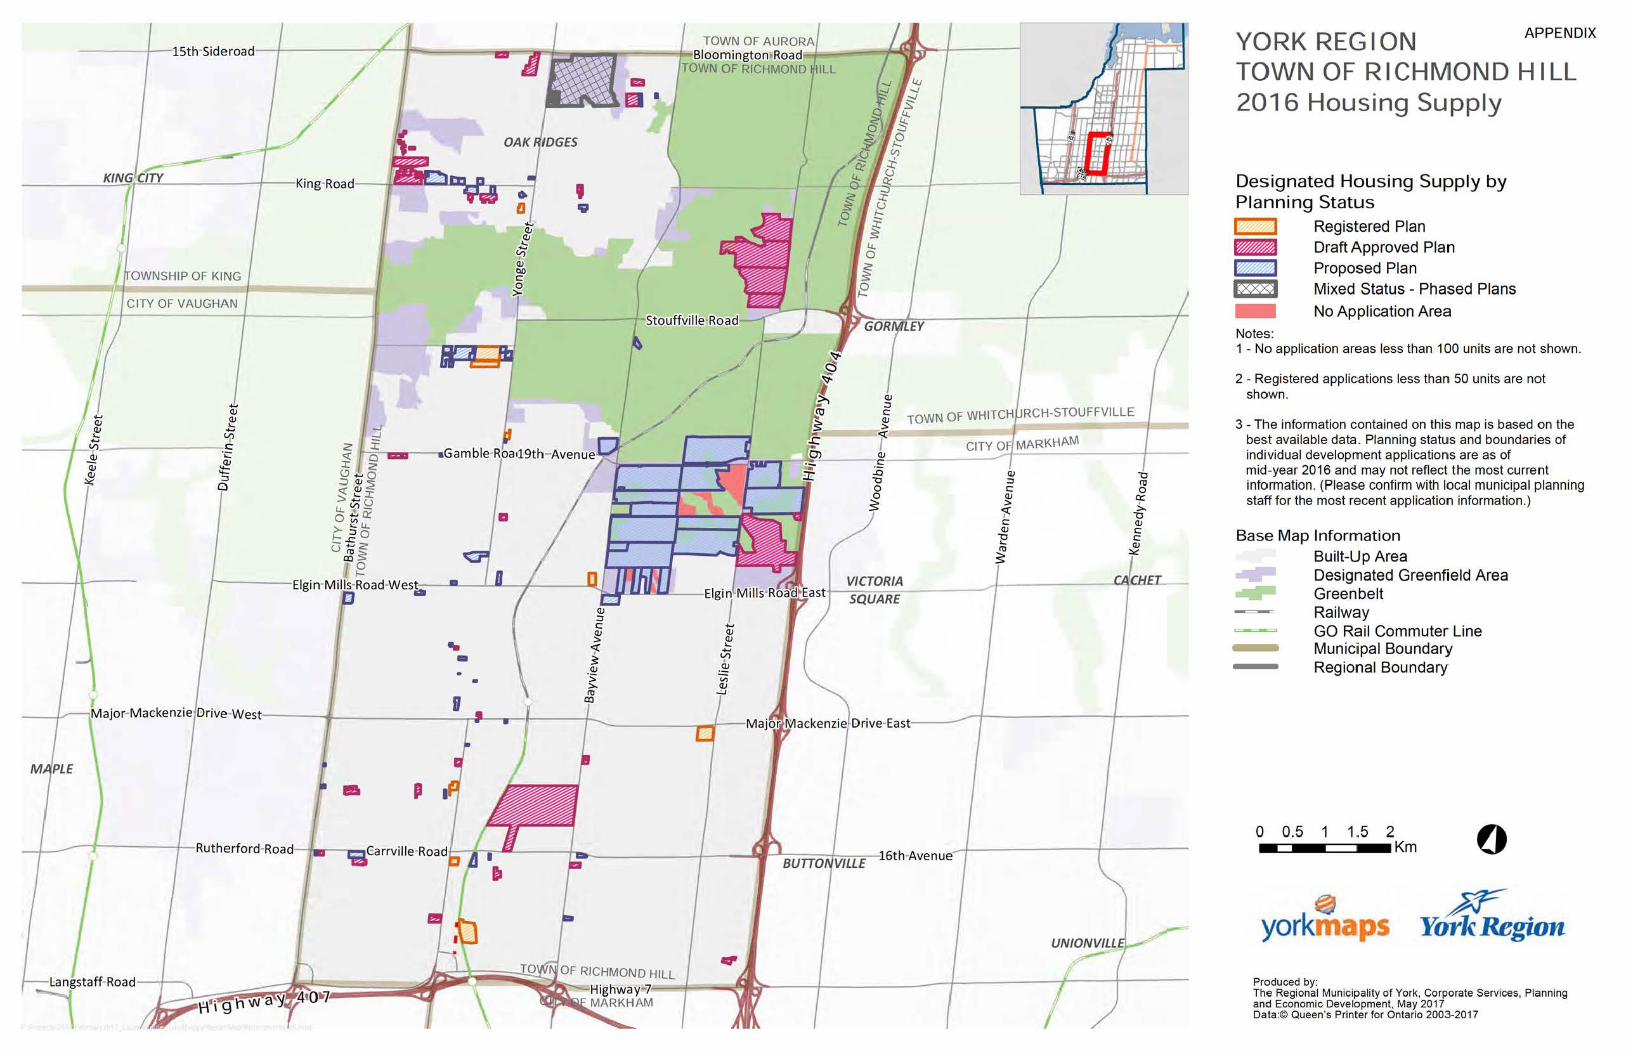
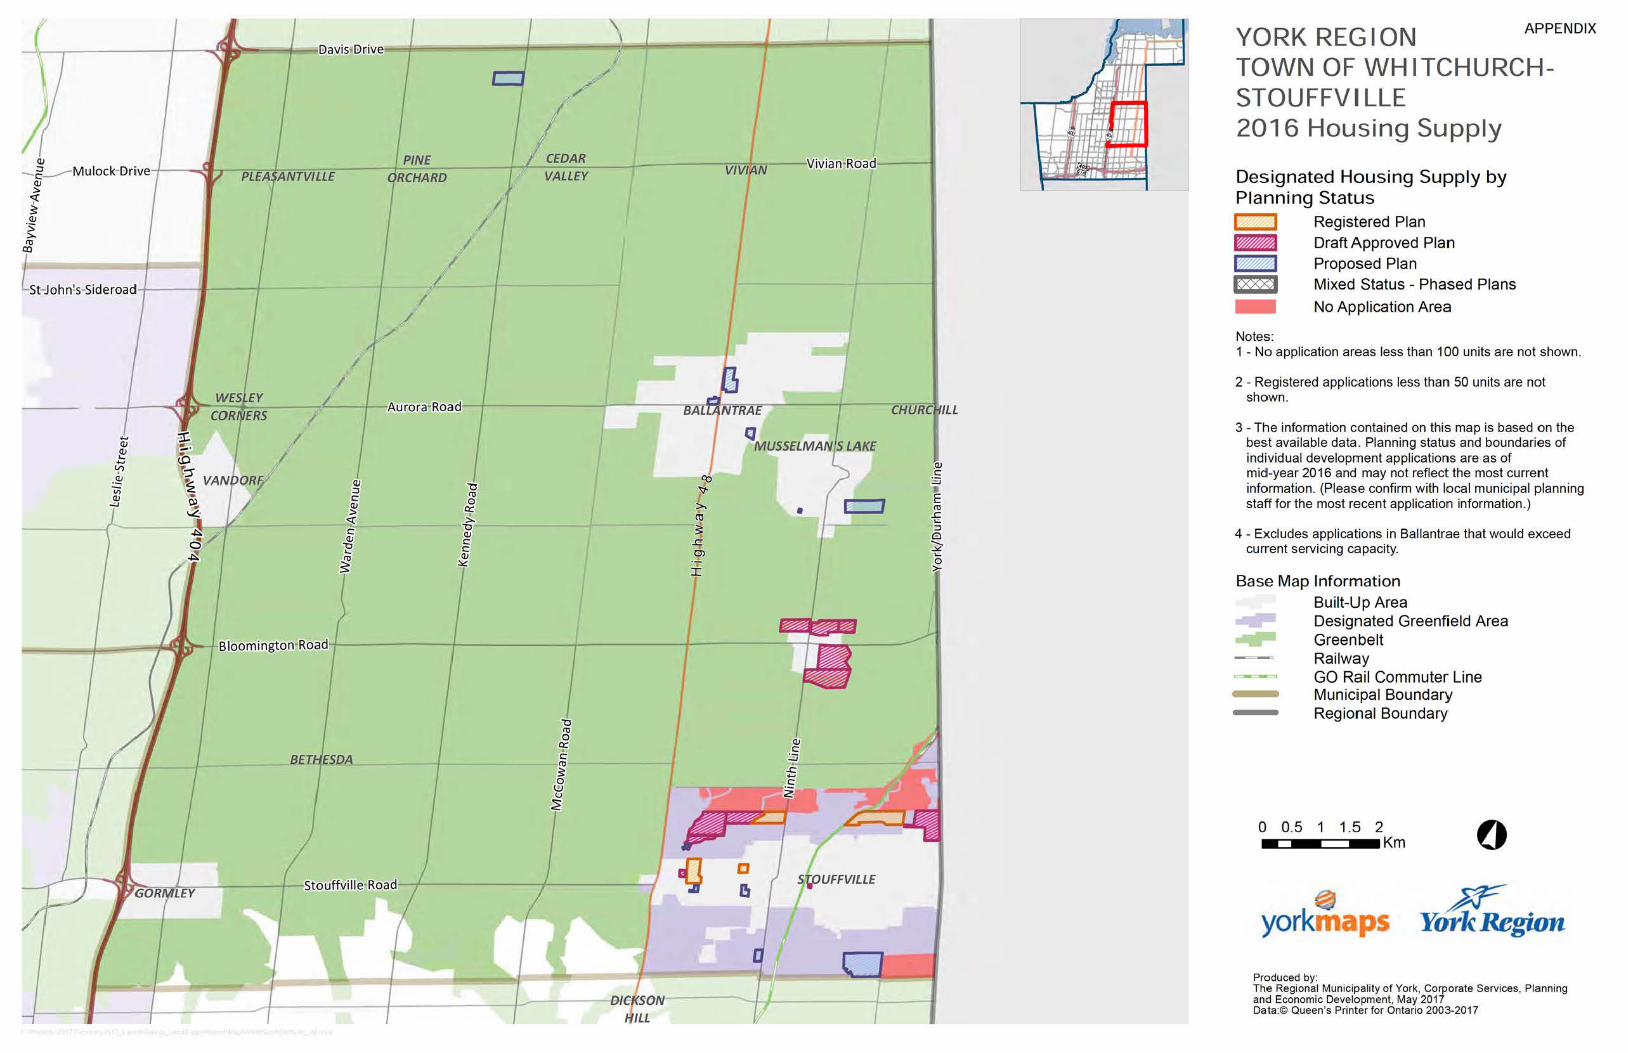
Appendix: Local Municipal Housing Supply Maps

22 2016 | York Region Housing Supply

TOWN OF NEWMARKET
TOWN OF AU
ndorf Sideroad
TO OF AI,IRORA
TbWN'OF RICH~ONo HlllL
YORK REGION TOWN OF AURORA 2016 Housing Supply
Designated Housing Supply by Planning Status I :t fW$1 I « tl IZXXj -Notes:
Registered Plan Draft Approved Plan Proposed Plan Mixed Status- Phased Plans
No Application Area
APPENDIX
1 - No application areas less than 100 units are not shown.
2 - Registered applications less than 50 units are not shown.
3 - The information contained on this map is based on the best available data. Planning status and boundaries of individual development applications are as of mid-year 2016 and may not reflect the most current information. (Please confirm with local municipal planning staff for the most recent application information.)
Base Map Information Built-Up Area Designated Greenfield Area Greenbelt Railway GO Rail Commuter Line Municipal Boundary Regional Boundary
0 0.25 0.5 0.75 1 -==--===-• Km
~ yorkmaps
Produced by:
0
The Regional Municipality of York, Corporate Services Planning and Economic Deve lopment, May 2017 ' D.ata:© Queen's Printer for Ontar io 2003-2017

TOWN OF GEORGINA Ravensh0e~R0ad
OF EAST GWILLIMBURY
~ TOWN OF NEW~RKET ....,
TOWN OF EAST GWILLIMBURY +;;.--------;;;:-r-_,.-------!i::---r------+-""""""~~~~=-+- 0aviSll!>rive
TOWN OF WHITCH RCH-STOUFFVILLE
1 "t:l
"' 0 0:: >.
"t:l (1J c c ~ r
i ,J H
1
//J ~'t 1
I
1- r' !IF I .
H A-t -,
.1.
I ~ --
I 'P
~ £
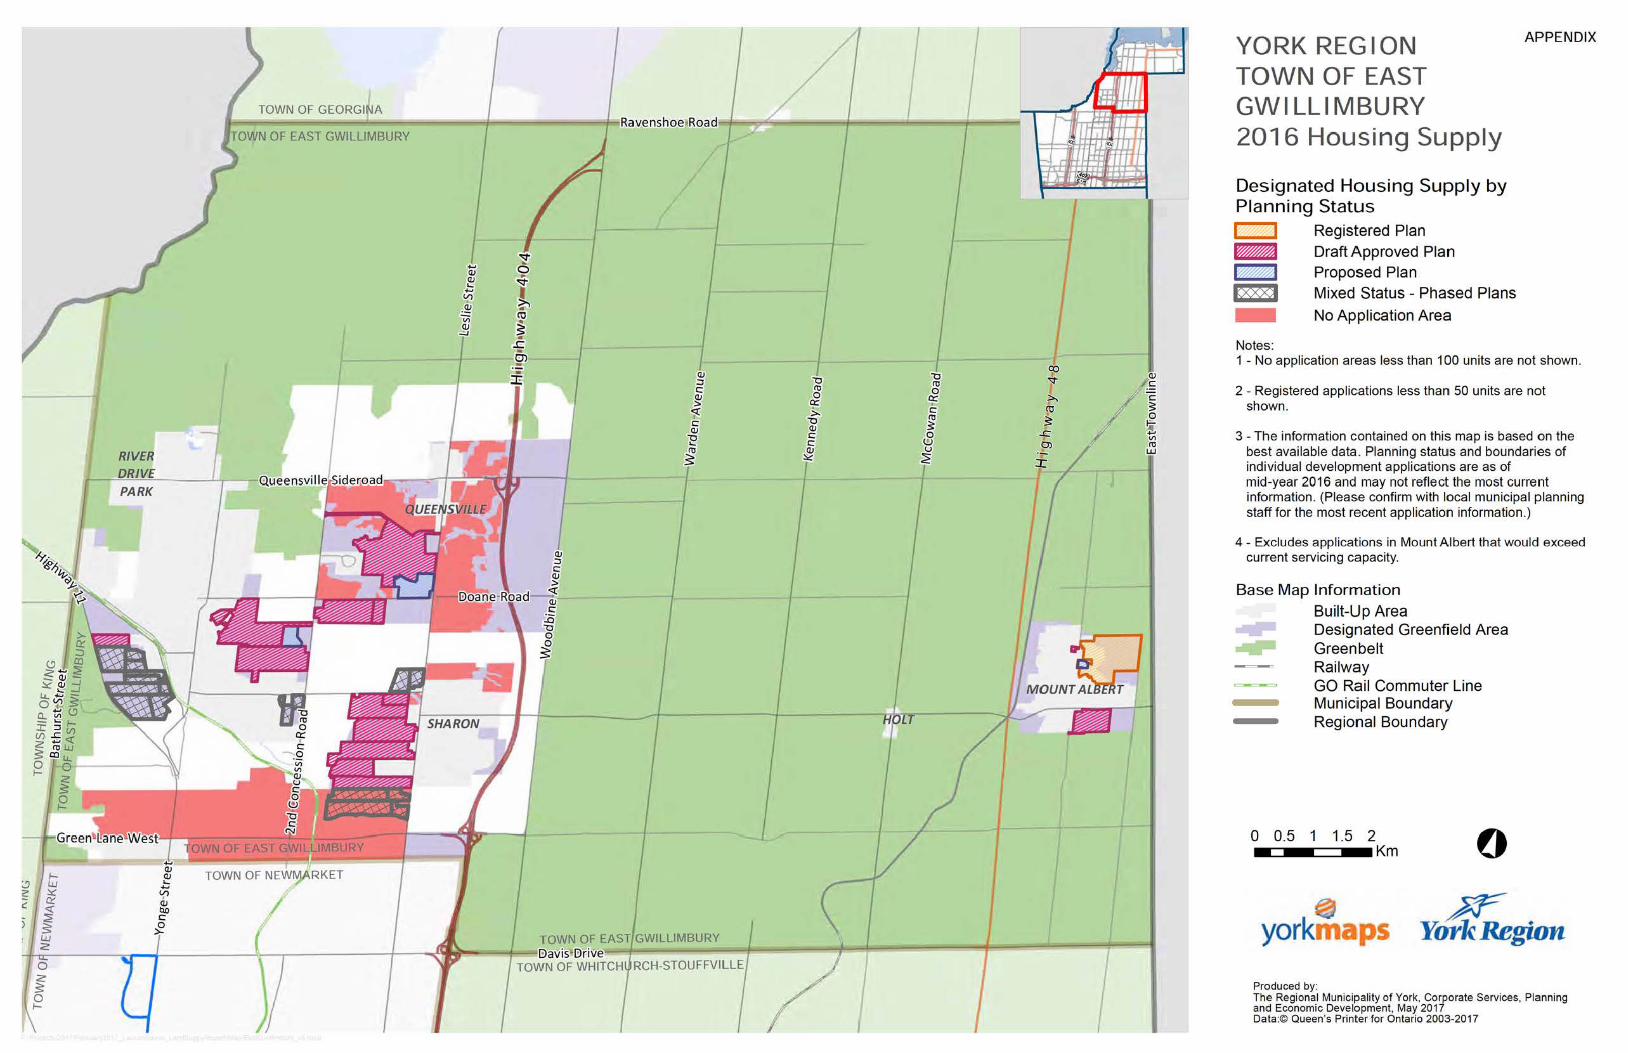
I L-YORK REGION TOWN OF EAST GWILLIMBURY 2016 Housing Supply
Designated Housing Supply by Planning Status
-Notes:
Registered Plan Draft Approved Plan Proposed Plan Mixed Status - Phased Plans
No Application Area
APPENDIX
1 - No application areas less than 100 units are not shown.
2 - Registered applications less than 50 units are not shown.
3 - The information contained on this map is based on the best available data. Planning status and boundaries of individual development applications are as of mid-year 2016 and may not reflect the most current information. (Please confirm with local municipal planning staff for the most recent application information.)
4 - Excludes applications in Mount A lbert that would exceed current servicing capacity.
Base Map Information
Built-Up Area Designated Greenfield Area Greenbelt Railway GO Rail Commuter Line Municipal Boundary Regional Boundary
0 0.5 1 1.5 2 -==--=:::::::~- Km
~ yorkmaps
Produced by:
0
The Regional Municipality of York, Corporate Services, Planning and Economic Development, May 2017 Data:© Queen's Printer for Ontario 2003-201 7

•
I
"0 "' 0
0:: ;.. "0 ., c c
WILLOW BEACH
MOUNT PLEASANT
"0
"' 0 0:: r:. ~ 0 t!l
~ I
-- - 0 1dfHomesteadiRoad,....., VACHELL
BALDWIN EGYPT
CEDAR BRAE
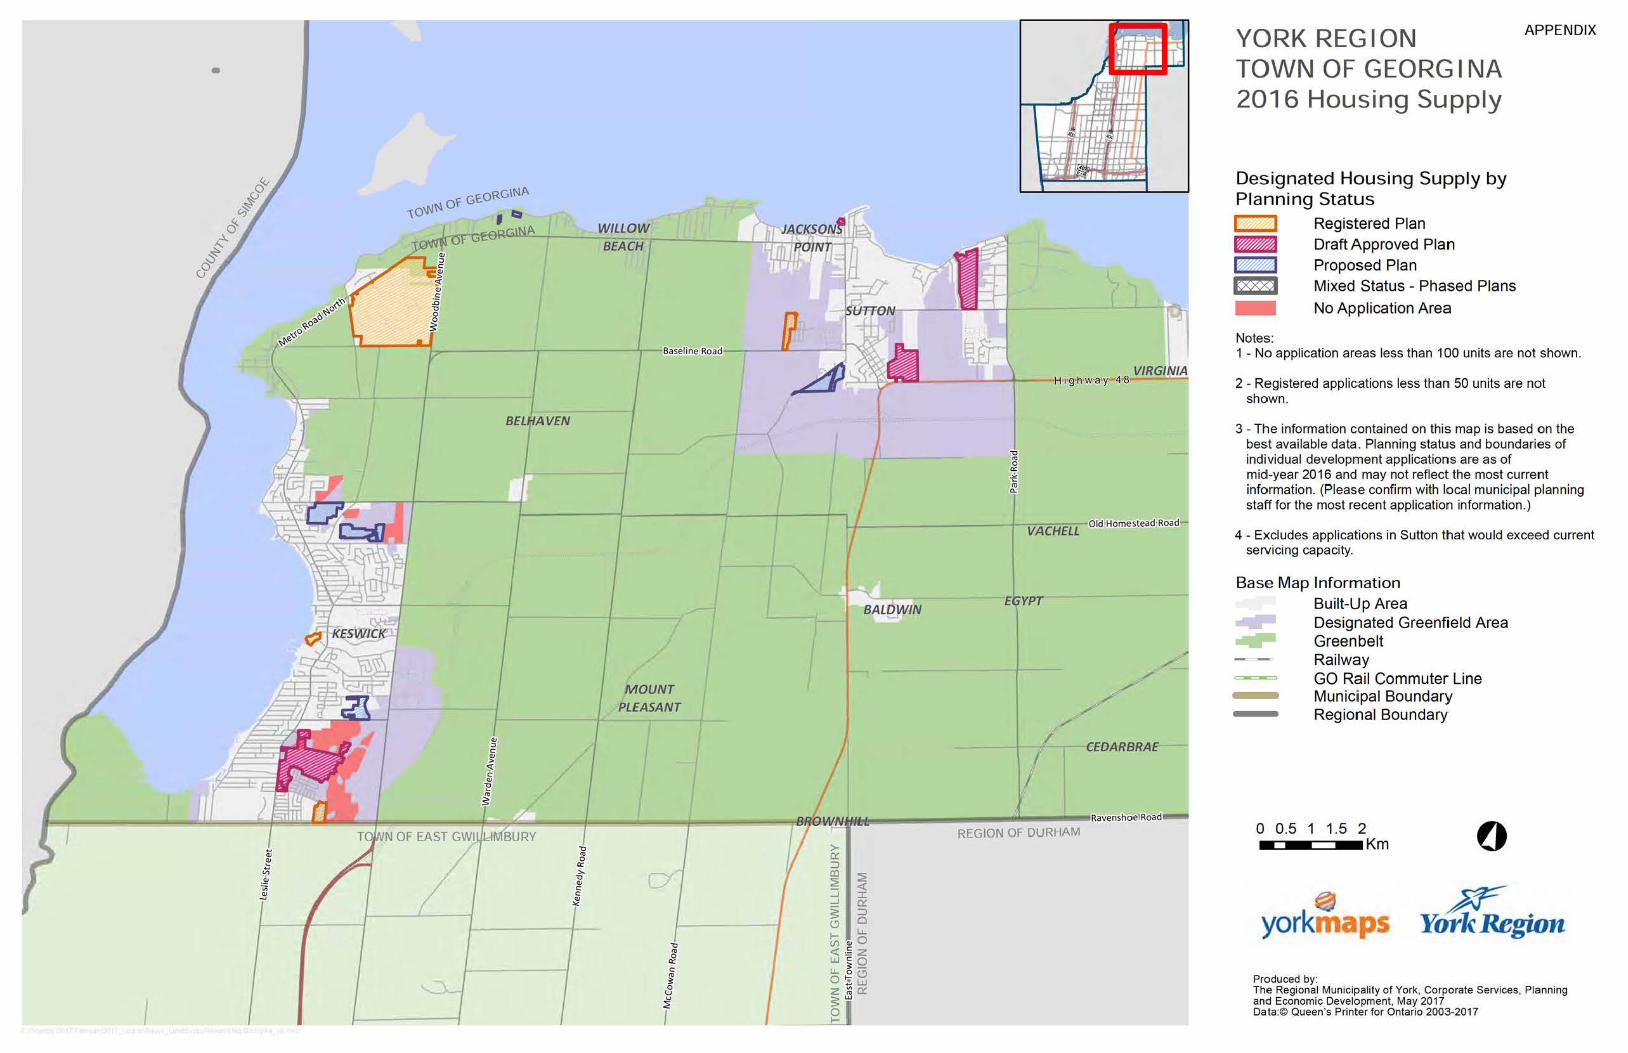
YORK REGION TOWN OF GEORG INA 2016 Housing Supply
Designated Housing Supply by Planning Status €2-4) '*A IJf I 1§§§?1 -Notes:
Registered Plan Draft Approved Plan Proposed Plan Mixed Status - Phased Plans
No Application Area
APPENDIX
1 - No application areas less than 100 units are not shown.
2 - Registered applications less than 50 units are not shown.
3 - The information contained on this map is based on the best available data. Planning status and boundaries of individual development applications are as of mid-year 2016 and may not reflect the most current information. (Please confirm with local municipal planning staff for the most recent application information.)
4 - Excludes applications in Sutton that would exceed current servicing capacity.
Base Map Information Built-Up Area Designated Greenfield Area Greenbelt Railway GO Rail Commuter Line Municipal Boundary Regional Boundary
0 0.5 1 1.5 2 -=-c:::::J-Km
~ yorkmaps
Produced by:
0
The Regional Municipality of York, Corporate Services, Planning and Economic Development, May 2017 Data:© Queen's Printer for Ontario 2003-2017

...-==;;;;;o;;=-==-l?l•ir@•I;J•w•a..y 91-====----...,...---=~~~...;;~;;~..oi:i.-_.....i._--l-4--:~-.....l,.--TOWNSHIP OF KING
LLOYDTOWN l!loydtown~
<lr0t:
~~ o~q. Jil
POrTAGEVILLE
TOWNSHIP OF KING
GITY 4'F-VM:JGHA
ANSNORVELDT
<1.1 ::J c: <1.1 > ~ ::
<1.1 ·s; >-111 co
F AURORA/ Bl00m i ngt0 nHRoad~-=11::::'=-~•
TOWN OF RICHMOND ILL
YORK REGION TOWNSHIP OF KING 2016 Housing Supply
Designated Housing Supply by Planning Status €2-4) '*A IJf I 1§§§?1 -Notes:
Registered Plan Draft Approved Plan Proposed Plan Mixed Status - Phased Plans
No Application Area
APPENDIX
1 - No application areas less than 100 units are not shown.
2 - Registered applications less than 50 units are not shown.
3 - The information contained on this map is based on the best available data. Planning status and boundaries of individual development applications are as of mid-year 2016 and may not reflect the most current information. (Please confirm with local municipal planning staff for the most recent application information.)
4 - Excludes applications in Nobleton that would exceed currrent servicing capacity.
Base Map Information Built-Up Area Designated Greenfield Area Greenbelt Railway GO Rail Commuter Line Municipal Boundary Regional Boundary
0 0.75 1.5 2.25 3 -==--==-•Km
~ yorkmaps
Produced by:
0
The Regional Munic ipality of York, Corporate Services, Planning and Economic Development, May 2017 Data:© Queen's Printer for Ontario 2003-201 7


--~ing-Roa
li.. 0 2 ~ 0 1-
-------~----------~----------~
RING ODD
cp 1 :;-. tp ~
..t 0)
£ J "0 DICKSON HILL "' 0
a:: ._ c
I aJ c ~
.!(:: +" c 2 r
MONGOLIA
GROVE
ITY OF MARKHAM
li.. 0 z 5 0 1-
:2 <( ::r: a: ;::) 0 li.. 0 2 0 <.::> UJ a:
YORK REGION CITY OF MARKHAM 2016 Housing Supply
Designated Housing Supply by P lanning Status
f%:£4 Registered Plan
IW64I Draft Approved Plan lee a Proposed Plan 1§<8&1 Mixed Status - Phased Plans - No Application Area
Notes:
APPENDIX
1 - No application areas less than 100 units are not shown.
2 - Registered applications less than 50 units are not shown.
3 - The information contained on this map is based on the best available data. Planning statUJs and boundaries of individual development applications are as of mid-year 201 6 and may not reflect the most current information. (Please confirm with local municipal planning staff for the most recent application information.)
Base Map Information Built-Up Area Designated Greenfield Area Greenbelt Railway GO Rail Commuter Line Municipal Boundary Regional Boundary
0 0.5 1 1.5 2 -=~-==-• Km
~ yorkmaps
Produced by:
0
The Regional Municipality of York, Corporate Services, Planning and Economic Development, May 2017 Data:© Queen's Printer for Ontario 2003-2017

est:------1--------- -------+----M--- Green-lane·
TOWN OF EAST GWILLIMBURY
--l"OW,N-~F NE~ARK.£4; "'
YORK REGION APPENDIX
TOWN OF NEWMARKET 2016 Housing Supply
Designated Hous ing Supply by Planning Status
Notes:
Registered Plan Draft Approved Plan Proposed Plan Mixed Status - Phased Plans
No Application Area
1 - No application areas less than 100 units are not shown.
2 - Registered applications less than 50 units are not shown.
3 - The information contained on this map is based on the best available data. Planning status and boundaries of individual development applications are as of mid-year 2016 and may not reflect the most current information. (Please confirm with local municipal planning staff for the most recent application information.)
Base Map Information Built-Up Area Designated Greenfield Area Greenbelt Railway GO Rail Commuter Line Municipal Boundary Regional Boundary
0 0.25 0.5 0 .75 1 -==--==-• Km
~ yorkmaps
Produced by:
0
The Regional Municipality of York, Corporate Services, Planning and Economic Development, May 2017 Data:© Queen's Printer for Ontario 2003-2017

SHIP OF KING
v,> ------ c ·c
~
~-stouffville•Roa
VICTORIA
SQUARE
CH-STOUFFVILLE
YORK REGION APPENDIX
TOWN OF RICHMOND HILL 2016 Housing Supply
Designated Housing Supply by Planning Status
-Notes:
Registered Plan Draft A pproved Plan Proposed Plan Mixed Status - Phased Plans
No Application Area
1 - No application areas less than 100 units are not shown.
2 - Registered applications less than 50 units are not shown.
3 - The information contained on this map is based on the best available data. Planning status and boundaries of individual development applications are as of mid-year 2016 and may not reflect the most current information. (Please confirm with local municipal planning staff for the most recent application information.)
Base Map Information Built-Up Area Designated Greenfield Area Greenbelt Railway GO Rail Commuter Line Municipal Boundary Regional Boundary
0 0.5 1 1.5 2 ~=--===-• Km
~ yorkmaps
Produced by:
0
The Regional Municipality of York, Corporate Services, Planning and Economic Development , May 2017 Data:© Queen's Printer for Ontario 2003-201 7


\ I TOW~SHIP OF KING
CITY OF VAUGHAN -----,~~~-----~--~
CITY OF TORONTO
YORK REGION CITY OF VAUGHAN 2016 Housing Supply
Designated Housing Supply by Planning Status
-Notes:
Registered Plan Draft Approved Plan Proposed Plan Mixed Status - Phased Plans
No Application Area
APPENDIX
1 - No application areas less than 100 units are not shown.
2 - Registered applications less than 50 units are not shown.
3 - The information contained on this map is based on the best available data. Planning status and boundaries of individual development applications are as of mid-year 2016 and may not reflect the most current information. (Please confirm with local municipal planning staff for the most recent application information.)
Base Map Information
Built-Up Area Designated Greenfield Area Greenbelt Railway GO Rail Commuter Line Municipal Boundary Regional Boundary
0 0.5 1 1.5 2 Km
0 yorkmaps
Produced by:
0
The Regional Municipality of York, Corporate Services, Planning and Economic Development, May 2017 Data:© Queen's Printer for Ontario 2003-2017

QJ
-~_..-Mulock-8rive+---~..-- -;=.....-.!:-:::-;";":;; QJ ::>
';t: ~
·£ ;:... Cll
CXl
t t-Jehn's-SideFoad-1----:.-----t-
Bloomington•Road7
PINE
RCHARD
-St0uffvi lle~Road
-1-
VIVI~ - VivianrR0adf t:1
1
CHURC ILL
Sf,OUFFV/l.LE
I
~ h IJI ,,
r I 1
~-') 'ill/
r: u. I J .hi ·-
I I ... I I I
YORK REGION APPENDIX
TOWN OF WHITCHURCHSTOUFFVI LLE 2016 Housing Supply
Designated Housing Supply by Planning Status
-Notes:
Registered Plan Draft Approved Plan Proposed Plan Mixed Status - Phased Plans
No Application Area
1 - No application areas less than 100 units are not shown.
2 - Registered applications less than 50 units are not shown.
3 -The information contained on this map is based on the best available data. Planning status and boundaries of individual development applications are as of mid-year 2016 and may not reflect the most current information. (Please confirm with local municipal planning staff for the most recent application information.)
4 - Excludes applications in Ballantrae that would exceed current servicing capacity.
Base Map Information Built-Up Area Designated Greenfield Area Greenbelt Railway GO Rail Commuter Line Municipal Boundary Regional Boundary
0 0.5 1 1.5 2 -==--==-• Km
yorkmaps
Produced by:
0
The Regional Municipality of York, Corporate Services, Planning and Economic Development, May 2017 Data:© Queen's Printer for Ontario 2003-2017


2016 | York Region Housing Supply 41

May 2017
2016 York Region Housing Supply
1702
9_04
1820
17
2016 York Region Housing Supply
For more information on housing supply in York Region please contact:
The Regional Municipality of York Corporate Services Department,
Planning and Economic Development Branch17250 Yonge Street
Newmarket, ON L3Y 6Z1
york.ca1-877-464-9675

Atta
ch
me
nt 2
Status of Regional and Local Municipal Official Plan Growth Plan Conformity Work
Municipality Local/ Regional Council Adoption
Endorsement or Approval
First OMB Appeal OMB Decision Status
Aurora September 28, 2010 June 28, 2012 June 25, 2012 (Non Decision)
April, 2014
In force
East Gwillimbury June 28, 2010 October 20, 2011 June 1, 2011 (Non Decision)
March 27, 2013 Partially Approved by OMB
Ongoing outstanding issues
Georgina November 23, 2016 October 20, 2016 November 17, 2016 (Non Decision)
No decision Ongoing outstanding issues OMB Prehearing May 10, 2017
Markham December 10, 2013 June 12, 2014 June 26, 2014 (Non Decision)
October 30, 2015 and May 26, 2016 Partially Approved by OMB
Mediation ongoing
Newmarket October 10, 2006 May 28, 2008 May 13, 2008 (Non Decision)
Unavailable In force
Richmond Hill July 12, 2010 May 19, 2011 February 10, 2011 (Non Decision)
October 13, 2015 Partially Approved by OMB
Ongoing outstanding issues
Vaughan September 7, 2010 June 28, 2012 October 3, 2011 (Non Decision)
December 18, 2012 Partially Approved by OMB
Ongoing outstanding issues
Whitchurch-Stouffville
September 5,2000 March 20, 2001 Unavailable June 23, 2004 Partially Approved by OMB
Ongoing outstanding issues
York Region December 16, 2009 September, 2010 MMAH approval
September, 2010 (following MMAH approval)
July 11, 2012 Partially Approved by OMB
Majority in effect One remaining Region-wide appeal (Arbor Memorial’s appeal of policy 6.4.8) 13 site-specific appeals
1
2016 York Region Housing Supply Presentation to Committee of the Whole
Valerie Shuttleworth May 18, 2017
2
Presentation Outline
• Context
• Highlights
• Registered and draft approved supply
• Designated residential supply
• Factors affecting increasing house prices in York Region and beyond
Context
• Gap between house prices and income is widening
• No one factor is responsible
• Supply and demand-based factors are likely contributing to increasing house prices
3
Highlights • Region’s housing supply exceeds the
requirements of the PPS and the YROP
• 5 year supply of registered and draft approved units as of mid-year 2016
• Regional servicing capacity for registered and draft approved units and beyond
• 21-23 year supply of designated residential units in the Region
4
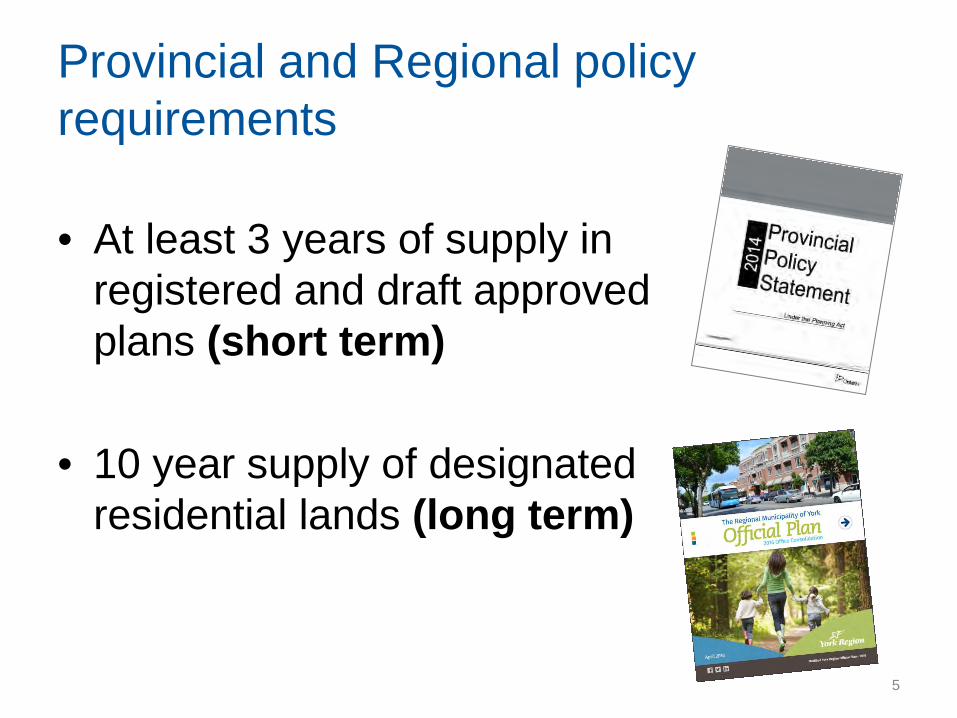
Provincial and Regional policy requirements
• At least 3 years of supply in registered and draft approved plans (short term)
• 10 year supply of designated residential lands (long term)
5

Housing supply is derived through the planning process
Long Term Supply Development applications that are registered, draft approved and proposed as well as estimates for lands with no application
6
Short Term Supply Development applications that are registered and draft approved

Annual Unit Demand is derived using two methods • Historic average using CMHC completions • Forecast average
7
0
2,000
4,000
6,000
8,000
10,000
Historical ForecastGround-related Apartments
8,100 9,000

York Region has a 5 year supply of registered and draft approved units
17,870
1,480
8,270
15,290
0
3,000
6,000
9,000
12,000
15,000
18,000
21,000
Singles Semis Rows Apts
• 64% of registered and draft approved units are ground-related
Estimated short term supply of 42,910 units 8
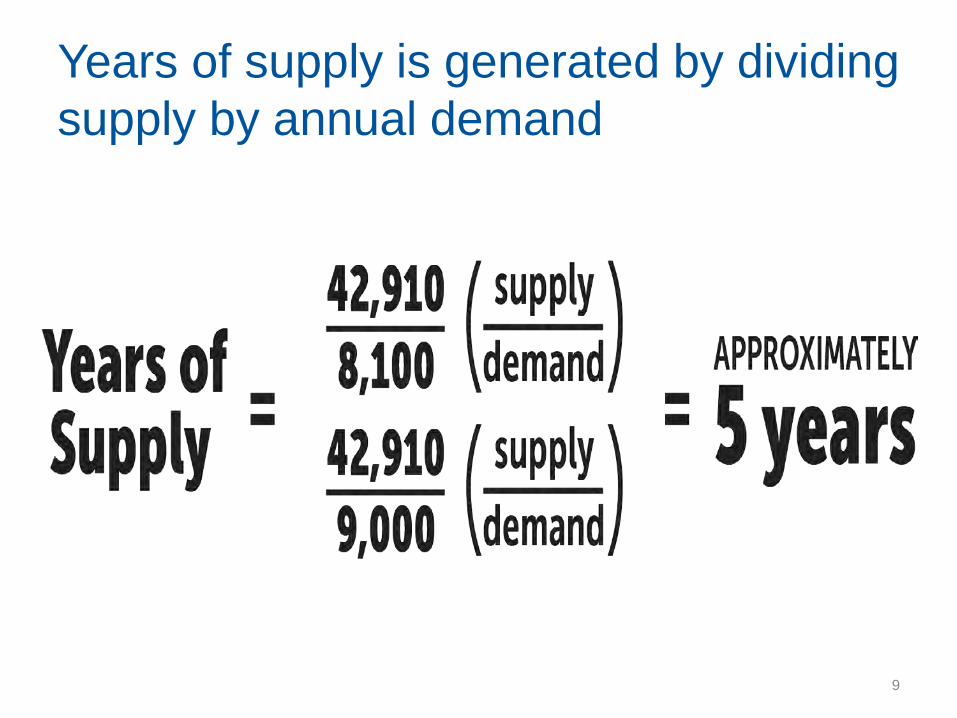
Years of supply is generated by dividing supply by annual demand
9
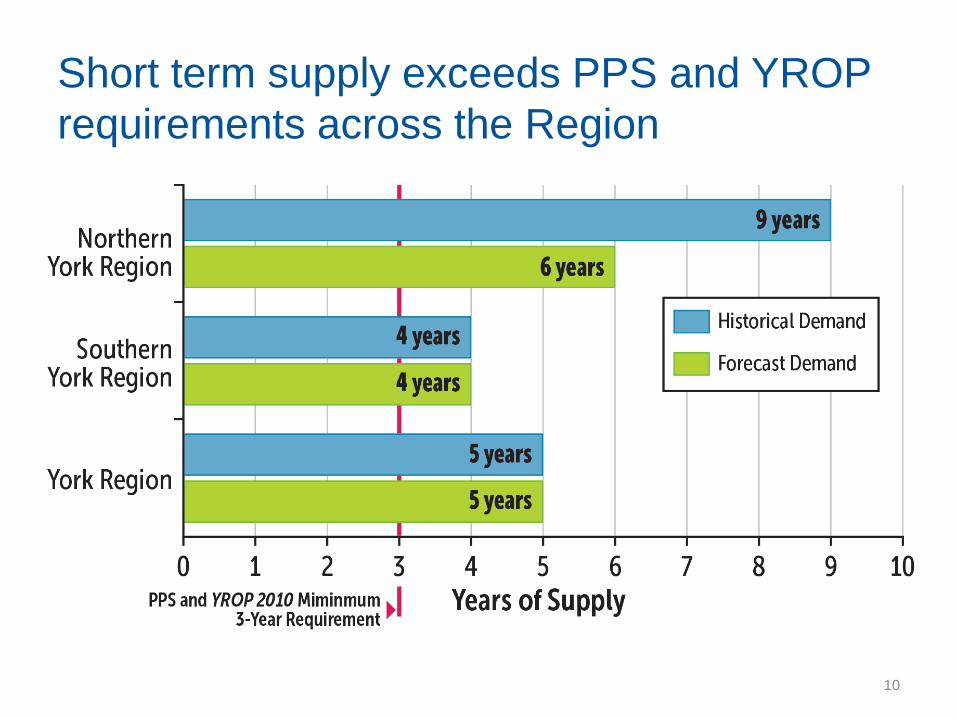
Short term supply exceeds PPS and YROP requirements across the Region
10
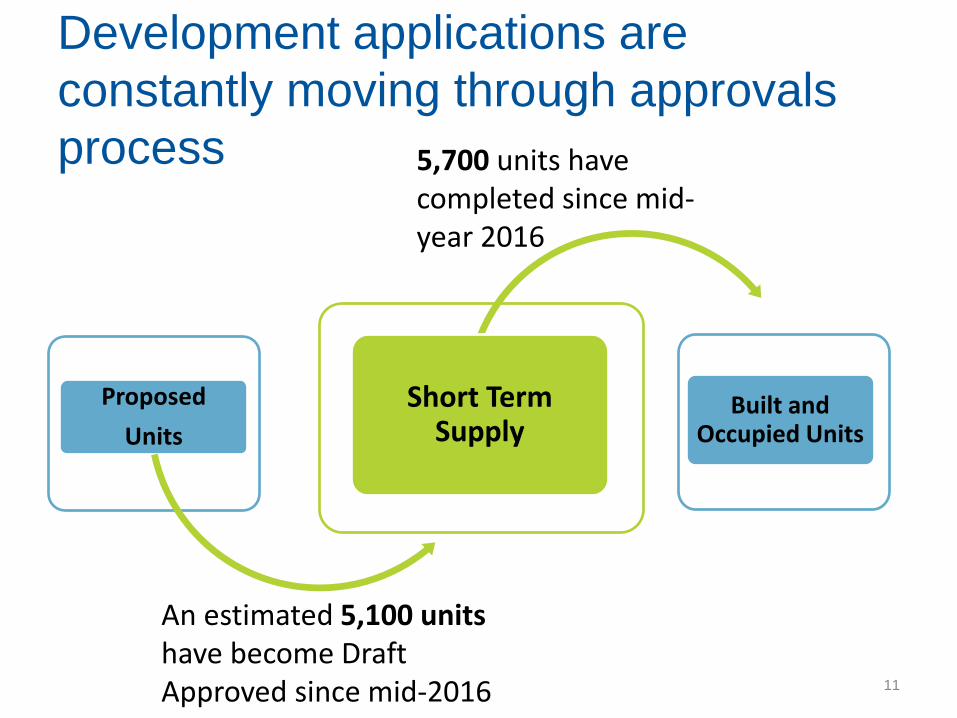
Development applications are constantly moving through approvals process
11
Proposed Units
Short Term Supply
Built and Occupied Units
5,700 units have completed since mid-year 2016
An estimated 5,100 units have become Draft Approved since mid-2016

Servicing capacity exceeds short term supply of 42,910 units
• PPS requires land with servicing capacity sufficient to provide at least a three year supply of registered and draft approved units
82,600 unit servicing capacity
42,910 units Short Term Supply
12

Majority of short term supply has servicing allocated by local municipalities
13
85% of total short term supply
91% of ground-related short term supply
Allocated Allocated
not allocated not allocated

York Region has 21-23 years of designated supply
52,100
5,970
41,000
88,390
0
15,000
30,000
45,000
60,000
75,000
90,000
105,000
Singles Semis Rows Apts
14
Long term supply of 187,460 designated units

Long term supply exceeds PPS and YROP requirements across the Region
15

16
York Region housing supply varies by local municipality

Mix of York Region housing completions is shifting
17

Over the last 5 years, York Region constructed more apartments than Halton, Durham, and Peel combined
York apartment completions were second only to Toronto 18
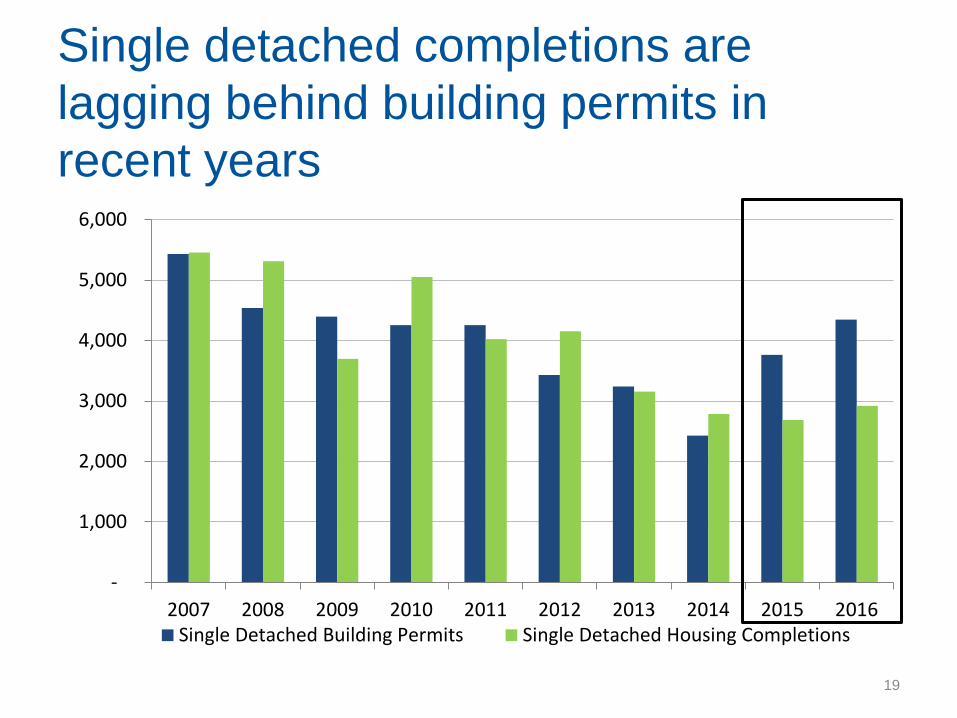
Single detached completions are lagging behind building permits in recent years
-
1,000
2,000
3,000
4,000
5,000
6,000
2007 2008 2009 2010 2011 2012 2013 2014 2015 2016Single Detached Building Permits Single Detached Housing Completions
19

Supply and Demand factors affect increasing housing prices Supply Based • Land use regulations • Supply of serviced land Demand Based • Demographics (e.g. strong population growth) • Cost and accessibility of mortgages • Construction and development costs • Land availability and regulations • Geographic location • Speculation / Investment
20

Ontario’s Fair Housing Plan introduced to help address housing affordability 16 measures including:
• 15% non-resident speculation tax on the price of homes in the GGH
• expanding rent control
• leveraging surplus provincial land assets
• establishing a housing advisory group
21
Planning for new residential lands takes time • 8-12 years between urban area designation in
the YROP and units on the ground
• ROPA’s 1,2, and 3 part of 2006 Growth Plan Conformity – still do not have secondary plans approved
• Ontario Municipal Board appeals at various stages causes further delay
22
The Region continues to invest in infrastructure to support growth
• 10-Year Roads and Transit Capital Program – $1.6B in 2017 to support growth projects
• Environmental Services 10 - Year Capital Plan - $1.33B in 2017 for water and wastewater growth infrastructure
23

Conclusions • 42,910 units - 5 years of short term supply
• Water and wastewater capacity for growth of
approximately 82,600 units –exceeding the short term supply
• 187,460 units - 21-23 years of long term supply
24
Recommendation
Forward the report to the Ministry of Municipal Affairs, the local municipalities, the Building Industry and Land Development Association for information
25

Thank you
CC: Michael Pozzebon, BILD York Chapter Chair BILD York Chapter Members
May 17, 2017
Chair Emmerson and York Regional Council 17250 Yonge Street Newmarket, Ontario L3Y 6Z1 Chair Emmerson and Members of York Regional Council,
RE: 2016 York Region Housing Supply – Report
On behalf of the York Chapter members of the Building Industry and Land Development Association (BILD), we appreciate that York Region Staff have provided a public report on the state of York Region’s Housing Supply. BILD recognizes that a number of municipal governments have reported, with this type of information, to the Province that they are meeting the Provincial Policy Statement (PPS) requirement to “maintain at all times where new development is to occur, land with servicing capacity sufficient to provide at least a three-year supply of residential units available through lands suitably zoned to facilitate residential intensification and redevelopment, and land in draft approved and registered plans.” [Section 1.4.1 (b) – PPS].
Notwithstanding the assertion made by multiple provincial and municipal sources that the PPS threshold is being satisfied, our members have generally advised of a different “on-the-ground reality” in which they are continuing to experience infrastructure approval delays or other delays to bring new housing supply (“permit-ready projects”) to the market. This is why builder inventories; particularly ground-related housing units have been sitting at historic lows for a number of months: as of the end of March 2017 there were fewer than 1,000 low-rise units in the entire GTA. With respect to this report, BILD has heard from its members that the Region is over counting its housing supply with development product that is either sold or completed by using mid-2016 data. BILD has also heard that many of the counted units could be approved from a planning perspective, but not near approval from a building permit perspective. Collectively we need to determine what is truly available for sale, and what the remaining units in these developments are.
We have shared this report with BILD York Chapter members at-large and asked that they review the reporting for any errors or omissions associated to their land holdings, as we believe that it is imperative that we are collectively working with the most up-to-date and accurate information. This data is an important part of the housing supply discussions that are happening with the Province, all municipalities and all stakeholders. Especially, as this data informs the planning framework upon which major decisions are made in our Province.
As you know, on April 20th the Provincial government announced Ontario's Fair Housing Plan which introduced a comprehensive package of measures to increase housing supply, protect buyers and renters and bring stability to the real estate market across the Greater Golden Horseshoe. We also acknowledge that a Residential Land Development Facilitation Team is being formulated to continue this dialogue. We anticipate that housing supply data will be an on-going discussion through these initiatives.
We thank York Region Staff and Council for the transparency of your reporting and for the opportunity to submit these comments. Should you have any further questions or concerns, please contact the undersigned.
Sincerely, Danielle Chin, MCIP, RPP Senior Manager, Policy & Government Relations, BILD