4q`19 earnings release - lg.com 4q_earning release of lge.pdf · all information regarding...
TRANSCRIPT

4Q`19 Earnings Release
LG Electronics
January 30, 2020

All information regarding management performance and financial results of LG Electronics (the “Company”) during the 4th quarter of 2019
as contained herein has been prepared on a consolidated basis in accordance with International Financial Reporting Standards (“IFRS”).
The information regarding results of 4th quarter of 2019 has been prepared in advance, prior to being audited by external auditors,
solely for the convenience of investors of the Company, and is subject to change in the process of final audit by external auditors.
The information contained herein includes forward-looking statements in respect to future plans, prospects, and performances of the Company
as well as the Company’s projected sales plan for year of 2020.
These forward-looking statements also refer to the Company’s performance on consolidated base, as indicated.
The aforementioned forward-looking statements are influenced by changes in the management environment and relative events, and by their nature,
these statements refer to uncertain circumstances. Consequently, due to these uncertainties, the Company’s actual future results may differ
materially from those expressed or implied by such statements.
Please note that as the forward-looking statements contained herein are based on the current market situation and the Company’s management
direction, they are subject to change according to the changes in future market environment and business strategy.
The information contained herein should not be utilized for any legal purposes in regards to investors’ investment results. The Company hereby
expressly disclaims any and all liability for any loss or damage resulting from the investors’ reliance on the information contained herein.
Table of Contents
Consolidated Earnings and OutlookⅠ
Performance and Outlook by DivisionⅡ

Ⅰ Consolidated Earnings and Outlook

1
Consolidated Earnings and Outlook Sales / Profits
Performance by Division
(Unit : KRW billion)
3Q`19 QoQ 4Q`19 YoY 4Q`18
Sales 15,700.7 +2.3% 16,061.2 +1.8% 15,772.3
Consolidated *1) O.I 781.4 -679.6 101.8 +26.1 75.7
(%) 5.0% -4.4%p 0.6% +0.1%p 0.5%
H&A*2)
Home Appliance
& Air Solution
Sales 5,330.7 -13.4% 4,616.1 +6.7% 4,327.9
O.I 428.9 -306.7 122.2 +9.6 112.6
(%) 8.0% -5.4%p 2.6% +0.0%p 2.6%
HE *3)
Home Entertainment
Sales 3,866.2 +18.7% 4,590.5 +0.0% 4,590.0
O.I 318.0 -208.0 110.0 -95.6 205.6
(%) 8.2% -5.8%p 2.4% -2.1%p 4.5%
MC *3)
Mobile Communications
Sales 1,522.3 -13.2% 1,320.8 -21.2% 1,675.4
O.I -161.2 -171.0 -332.2 -13.7 -318.5
(%) -10.6% -14.6%p -25.2% -6.2%p -19.0%
VS
Vehicle component
Solutions
Sales 1,340.1 +1.1% 1,355.2 -3.1% 1,398.8
O.I -60.1 -3.6 -63.7 -36.3 -27.4
(%) -4.5% -0.2%p -4.7% -2.7%p -2.0%
BS
Business Solutions
Sales 698.7 -3.7% 672.8 +12.5% 597.8
O.I 66.8 -0.4 66.4 +51.5 14.9
(%) 9.6% +0.3%p 9.9% +7.4%p 2.5%
*1) LG Innotek is included.
*2) From 1Q`19, robot business has been restated to ‘others' from 'H&A division‘.
*3) From 1Q`19, companion device business has been restated to 'HE division' from 'MC division‘.
Operating
Income
(%)
Sales
3Q`19
15.70 16.06 15.77
4Q`19 4Q`18
QoQ
2.3% ↑YoY
1.8% ↑
5.0%
0.6% 0.5%
Sales / Profits
(Unit : KRW trillion)

2
Income Trend / Cash FlowConsolidated Earnings and Outlook
3Q`19 4Q`19
Cash at the beginning of period 3,944.2 4,798.9
• Cash flow from operating activities 1,343.1 1,143.0
Net income/loss 345.7 -849.8
Depreciation 644.1 634.1
Gain/Loss on equity method investment 150.9 671.3
• Cash flow from investing activities -278.0 -654.9
Increase/Decrease in tangible assets -458.4 -421.9
Increase/Decrease in intangible assets -97.6 -107.2
• Cash flow from financing activities -231.9 -423.7
Repayment of lease obligation and others -127.6 -66.5
Increase/Decrease in debt -104.3 -357.2
• Effects of exchange rate changes
on cash and cash equivalents21.5 -85.9
Net changes in cash 854.7 -21.5
Cash at the end of period 4,798.9 4,777.4
EBITDA
3Q`19 QoQ 4Q`19 YoY 4Q`18
Operating
Income781.4 -679.6 101.8 +26.1 75.7
Net financial
income/expense-56.1 -18.0 -74.1 +0.1 -74.2
Gain/Loss on
equity method-150.9 -520.4 -671.3 -722.6 51.3
Other non-operating
income/expense-140.4 -102.9 -243.3 -66.2 -177.1
Income
Before Tax434.0 -1,320.9 -886.9 -762.6 -124.3
Corporate
income tax88.3 -125.4 -37.1 +6.5 -43.6
Net
Income345.7 -1,195.5 -849.8 -769.1 -80.7
735.9 625.21,425.5 Net C/F 1,086.6 402.2
Cash Flow
(Unit : KRW billion)
Income Trend
(Unit : KRW billion)

3
Leverage Ratio / Financial PositionConsolidated Earnings and Outlook
67 6669
41
3940
172 171173
4Q`194Q`18 3Q`19
*1) Lease Liability is included.
*2) Net Debt = Debt + Lease Liability – Cash and Cash equivalents.
Liabilities
to Equity
Debt to
Equity
Net Debt to
Equity
*1)
4Q`18 3Q`19 4Q`19
Assets 44.33 47.20 44.86
Current Assets 19.36 21.84 19.75
Cash and
Cash equivalents4.27 4.80 4.78
Inventory 6.02 6.89 5.86
Non-Current Assets 24.97 25.36 25.11
Liabilities 28.02 29.75 28.43
Current Liabilities 17.13 18.30 17.66
Non-Current Liabilities 10.89 11.45 10.77
Equity 16.31 17.45 16.43
Debt 10.90 10.80 10.49
Net Debt *2) 6.63 6.73 6.48
Financial Position
(Unit : KRW trillion)
Leverage Ratio
(Unit : %)

4
Outlook for Y2020Consolidated Earnings and Outlook
Key
Strategies
Consistently pursue premium and profitable growth strategies
Accelerate digital transformation for sustainable growth
Business
Environment
Increasing business uncertainty due to stagnant global market demand and unstable
international situation
Expansion of new business areas by integrating cutting-edge technologies such as AI, IoT, and
Big Data into existing devices
Sales & Profits
Outlook
Profit-based revenue growth in 2020
Increase sales QoQ and maintain stable profitability in 1Q`20

Ⅱ Performance and Outlook by Division

4Q`19 Performance
Y2020 Outlook
Sales :
Profit :
LGE :
Market :
Performance and Outlook by Division
5
Achieved 4.6 Trillion Won, up 7% YoY, due to the growth in overseas markets
Despite an unfavorable factor of increased marketing expenses,
operating profit slightly improved YoY due to sales growth, raw material price
cuts, and ongoing cost reduction activities
Uncertainty in market volatility and environment, such as intensifying competition
and unstable international conditions, is expected to increase
Strengthen business portfolio by increasing the sales of premium and new growth
products, and focus our capabilities on creating stable profitability YoY
by efficient resource input and continuous cost saving activities
Key Products
TWINWashInstaView DID LG Styler
Op. Income
Sales
2.6%
13.3%11.8%
8.0%
2.6%
4.33
5.47 6.10
5.33 4.62
4Q`194Q`18 1Q`19 2Q`19 3Q`19
*1) From 1Q`19, robot business has been restated to ‘others' from 'H&A division'
H&A (Home Appliance & Air Solution)
(Unit : %, KRW trillion)Performance*1)

6
Performance and Outlook by Division HE (Home Entertainment)
(Unit : %, KRW trillion)
Key Products
Performance*1)
Sales
4Q`194Q`18 1Q`19 2Q`19 3Q`19
4.5%
8.6%
5.6%8.2%
2.4%
4.59 4.02
3.67 3.87
4.59
*1) From 1Q`19, companion device business has been restated to 'HE division' from 'MC division'
Op. Income
LG NanoCellLG SIGNATURE OLED 8K
4Q`19 Performance
Y2020 Outlook
Sales :
Profit :
LGE :
Market :
Entering the year-end peak season, company achieved significant sales growth
QoQ in North America, Europe, CIS regions and recorded flat YoY by increasing
premium product sales
Profit decreased YoY increased marketing expense and sales price decline from
intensified competition
Expect intensifying competition due to stagnation of overall TV demand
However, demand in premium TV market such as OLED TV and Ultra HD TV is
expected to maintain the growth
Revenue growth is expected led by premium TVs such as OLED TVs, Large UHD
TVs, and NanoCell TVs

7
Performance and Outlook by Division MC (Mobile Communications)
Key Products
Sales
Δ19.0%Δ13.5%
Δ19.4%Δ10.6%
Δ25.2%
4Q`194Q`18 1Q`19 2Q`19 3Q`19
*1) From 1Q`19, companion device business has been restated to 'HE division' from 'MC division'
Op. Income
1.68 1.51 1.61 1.52
1.32
V50ThinQV50S / G8XThinQ Q70
Performance*1) 4Q`19 Performance
Y2020 Outlook
Sales :
Profit :
LGE :
Market :
Down QoQ/YoY due to sluggish sales in overseas market with sales
decrease of mass-tier products in North America
Profitability declined due to increased marketing costs from new model launches
and year-end channel inventory clearance
Premium product demand in developed market is expected to grow driven by the
actual ramp up of 5G market and the launch of new form factor smartphones
However, market competition is expected to intensify in mass-tier segment due to the
aggressive pricing strategy among each set makers
Preoccupy 5G market demand by launching of mass-premium and mass-tier
5G products
For mid to low-end products, secure competitive edge by adopting key specification
of the products based on consumer perspective and proactively utilize ODM to
expand sales in order to improve cost competitiveness
(Unit : %, KRW trillion)

8
Performance and Outlook by Division VS (Vehicle Component Solutions)
• AV/AVN
• Telematics
• CID
Key Products
• Traction Motor
• Inverter
• Battery Pack
• ADAS Camera
• LCD Cluster
• Automotive Lamp
Infotainment e-PowertrainSafety & Convenience
Devices
Performance
Sales
Δ2.0%Δ1.1%
Δ3.9%Δ4.5% Δ4.7%
1.40 1.35 1.42 1.34 1.36
4Q`194Q`18 1Q`19 2Q`19 3Q`19
Op. Income
4Q`19 Performance
Y2020 Outlook
Sales :
Profit :
Market :
Down 3% YoY due to temporary sales decrease of auto OEMs
Despite the sluggish demand of auto components in infotainment business,
revenue was up QoQ driven by the EV component sales increase
Operating loss continued due to the depressed cost structure mainly from
stabilizing the new project mass production.
Overall auto market is expected to stagnate from the impact of low market demand
in main areas such as North America and Europe
In terms of EV components market, volatility of the demand is expected to grow
even more due to the existence of both positive and negative factors such as strong
environment regulation reinforced in Europe and the subsidy phase out for
eco-friendly vehicles in China
Finalize the ongoing adjustment of the long term business portfolio and
internalize the core components, enhance software capability to strengthen
product competitiveness
(Unit : %, KRW trillion)
LGE :

9
Performance and Outlook by Division BS (Business Solutions)
Performance
Key Products
Solar ModuleInformation Display
Sales
0.60 0.63 0.68 0.70 0.67
2.5%
8.9% 8.6% 9.6% 9.9%
4Q`194Q`18 1Q`19 2Q`19 3Q`19
Op. Income
4Q`19 Performance
Y2020 Outlook
Sales :
Profit :
Market :
Overall sales grew YoY driven by continuous growth in premium products such as
LED signage from information display business and sales expansion of solar module
business driven by the high power premium products for household market
Increased profitability YoY driven by the strategic products in the information
display business and sales expansion of solar module products with enhanced
power performance and productivity
Information display market is expected to grow continuously driven by the growth
mainly from indoor LED display and premium products.
For solar module, we expect the market to grow continuously thanks to the
expansion of stable installation and increase in household demand from developed
countries based on favorable energy support policies. However, competition in terms
of power performance and price is expected to be intensified.
(Unit : %, KRW trillion)
LGE : Secure growth in sales and profitability with premium products in
information displays
Strengthen the business fundamentals by targeting high efficiency products for
solar module

http://www.lg.com/global
Appendix Summarized Financial Statements (Consolidated)
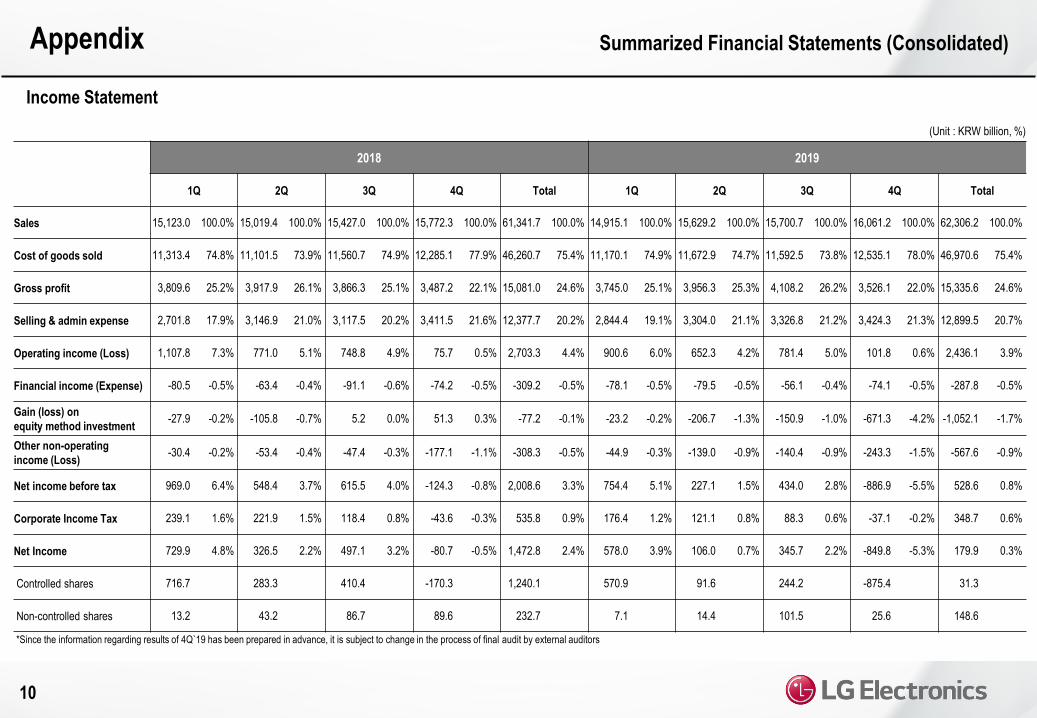
Income Statement
10
(Unit : KRW billion, %)
2018 2019
1Q 2Q 3Q 4Q Total 1Q 2Q 3Q 4Q Total
Sales 15,123.0 100.0% 15,019.4 100.0% 15,427.0 100.0% 15,772.3 100.0% 61,341.7 100.0% 14,915.1 100.0% 15,629.2 100.0% 15,700.7 100.0% 16,061.2 100.0% 62,306.2 100.0%
Cost of goods sold 11,313.4 74.8% 11,101.5 73.9% 11,560.7 74.9% 12,285.1 77.9% 46,260.7 75.4% 11,170.1 74.9% 11,672.9 74.7% 11,592.5 73.8% 12,535.1 78.0% 46,970.6 75.4%
Gross profit 3,809.6 25.2% 3,917.9 26.1% 3,866.3 25.1% 3,487.2 22.1% 15,081.0 24.6% 3,745.0 25.1% 3,956.3 25.3% 4,108.2 26.2% 3,526.1 22.0% 15,335.6 24.6%
Selling & admin expense 2,701.8 17.9% 3,146.9 21.0% 3,117.5 20.2% 3,411.5 21.6% 12,377.7 20.2% 2,844.4 19.1% 3,304.0 21.1% 3,326.8 21.2% 3,424.3 21.3% 12,899.5 20.7%
Operating income (Loss) 1,107.8 7.3% 771.0 5.1% 748.8 4.9% 75.7 0.5% 2,703.3 4.4% 900.6 6.0% 652.3 4.2% 781.4 5.0% 101.8 0.6% 2,436.1 3.9%
Financial income (Expense) -80.5 -0.5% -63.4 -0.4% -91.1 -0.6% -74.2 -0.5% -309.2 -0.5% -78.1 -0.5% -79.5 -0.5% -56.1 -0.4% -74.1 -0.5% -287.8 -0.5%
Gain (loss) on
equity method investment-27.9 -0.2% -105.8 -0.7% 5.2 0.0% 51.3 0.3% -77.2 -0.1% -23.2 -0.2% -206.7 -1.3% -150.9 -1.0% -671.3 -4.2% -1,052.1 -1.7%
Other non-operating
income (Loss)-30.4 -0.2% -53.4 -0.4% -47.4 -0.3% -177.1 -1.1% -308.3 -0.5% -44.9 -0.3% -139.0 -0.9% -140.4 -0.9% -243.3 -1.5% -567.6 -0.9%
Net income before tax 969.0 6.4% 548.4 3.7% 615.5 4.0% -124.3 -0.8% 2,008.6 3.3% 754.4 5.1% 227.1 1.5% 434.0 2.8% -886.9 -5.5% 528.6 0.8%
Corporate Income Tax 239.1 1.6% 221.9 1.5% 118.4 0.8% -43.6 -0.3% 535.8 0.9% 176.4 1.2% 121.1 0.8% 88.3 0.6% -37.1 -0.2% 348.7 0.6%
Net Income 729.9 4.8% 326.5 2.2% 497.1 3.2% -80.7 -0.5% 1,472.8 2.4% 578.0 3.9% 106.0 0.7% 345.7 2.2% -849.8 -5.3% 179.9 0.3%
Controlled shares 716.7 283.3 410.4 -170.3 1,240.1 570.9 91.6 244.2 -875.4 31.3
Non-controlled shares 13.2 43.2 86.7 89.6 232.7 7.1 14.4 101.5 25.6 148.6
*Since the information regarding results of 4Q`19 has been prepared in advance, it is subject to change in the process of final audit by external auditors

Appendix Summarized Financial Statements (Consolidated)
Statements of Financial Position
11
2018 2019
1Q 2Q 3Q 4Q 1Q 2Q 3Q 4Q
Assets 41,222.0 42,924.8 45,068.3 44,328.4 45,936.7 45,867.3 47,204.6 44,859.9
Current Assets 19,072.9 20,540.2 20,695.2 19,362.9 20,176.1 20,134.6 21,840.8 19,753.5
Cash and cash equivalents 3,753.1 4,659.6 4,538.3 4,270.4 4,093.6 3,944.2 4,798.9 4,777.4
Accounts receivable 7,144.8 7,701.6 7,068.7 6,371.6 7,244.2 7,386.8 7,032.1 6,360.3
Inventory 5,872.7 5,975.5 6,561.6 6,021.4 6,141.7 6,179.5 6,894.7 5,863.4
Others 2,302.3 2,203.5 2,526.6 2,699.5 2,696.6 2,624.1 3,115.1 2,752.4
Non-current Assets 22,149.1 22,384.6 24,373.1 24,965.5 25,760.6 25,732.7 25,363.8 25,106.4
Investment 5,571.0 5,465.4 5,487.7 5,537.6 5,575.6 5,377.2 5,216.8 4,544.5
PP&E 12,000.1 12,337.4 13,162.8 13,334.0 14,094.5 14,241.6 14,191.5 14,505.4
Intangible assets 1,920.7 1,997.6 2,925.7 3,001.1 3,002.0 2,964.8 2,787.5 2,692.0
Others 2,657.3 2,584.2 2,796.9 3,092.8 3,088.5 3,149.1 3,168.0 3,364.5
Liabilities 25,766.0 27,165.4 28,622.3 28,021.5 28,997.0 28,772.3 29,753.7 28,434.8
Accounts payable 7,243.0 7,533.6 7,926.2 7,216.7 7,798.5 7,402.5 8,200.1 6,820.6
Debt 9,622.2 10,690.6 11,503.9 10,901.2 11,055.2 10,858.1 10,795.7 10,487.4
Lease liability - - - - 684.5 700.2 730.1 771.4
Other liabilities 8,900.8 8,941.2 9,192.2 9,903.6 9,458.8 9,811.5 10,027.8 10,355.4
Equity 15,456.0 15,759.4 16,446.0 16,306.9 16,939.7 17,095.0 17,450.9 16,425.1
(Unit : KRW billion)
*Since the information regarding results of 4Q`19 has been prepared in advance, it is subject to change in the process of final audit by external auditors

Appendix Sales / Profits by Division (Consolidated)
12
1Q`18 2Q`18 3Q`18 4Q`18 `18 Total 1Q`19 2Q`19 3Q`19 4Q`19 `19 TotalQoQ YoY
H&A Sales 4,923.9 5,258.1 4,850.9 4,327.9 19,360.8 5,465.9 6,102.8 5,330.7 4,616.1 -13.4% 6.7% 21,515.5
Op. Income 557.6 461.8 413.0 112.6 1,545.0 727.6 717.5 428.9 122.2 1,996.2
(%) 11.3% 8.8% 8.5% 2.6% 8.0% 13.3% 11.8% 8.0% 2.6% 9.3%
HE Sales 4,141.9 3,845.5 3,734.8 4,590.0 16,312.2 4,023.7 3,671.2 3,866.2 4,590.5 18.7% 0.0% 16,151.6
Op. Income 573.0 405.2 322.9 205.6 1,506.7 346.5 205.6 318.0 110.0 980.1
(%) 13.8% 10.5% 8.6% 4.5% 9.2% 8.6% 5.6% 8.2% 2.4% 6.1%
MC Sales 2,134.4 2,049.1 2,017.3 1,675.4 7,876.2 1,510.4 1,613.3 1,522.3 1,320.8 -13.2% -21.2% 5,966.8
Op. Income -131.8 -183.7 -144.2 -318.5 -778.2 -203.5 -313.0 -161.2 -332.2 -1,009.9
(%) -6.2% -9.0% -7.1% -19.0% -9.9% -13.5% -19.4% -10.6% -25.2% -16.9%
VS Sales 840.0 872.8 1,176.0 1,398.8 4,287.6 1,347.0 1,423.1 1,340.1 1,355.2 1.1% -3.1% 5,465.4
Op. Income -17.0 -32.5 -42.9 -27.4 -119.8 -15.3 -55.8 -60.1 -63.7 -194.9
(%) -2.0% -3.7% -3.6% -2.0% -2.8% -1.1% -3.9% -4.5% -4.7% -3.6%
BS Sales 642.7 588.5 576.7 597.8 2,405.7 625.6 675.5 698.7 672.8 -3.7% 12.5% 2,672.6
Op. Income 78.8 39.0 35.1 14.9 167.8 55.5 58.1 66.8 66.4 246.8
(%) 12.3% 6.6% 6.1% 2.5% 7.0% 8.9% 8.6% 9.6% 9.9% 9.2%
Others Sales 979.5 1,200.2 1,011.7 961.8 4,153.2 755.6 842.6 666.8 686.0 2.9% -28.7% 2,951.0
Op. Income 38.9 80.9 47.8 -17.7 149.9 -0.2 28.8 5.0 -12.5 21.1
LGE Consolidated
Excluding
LG Innotek (①)
Sales 13,662.4 13,814.2 13,367.4 13,551.7 54,395.7 13,728.2 14,328.5 13,424.8 13,241.4 -1.4% -2.3% 54,722.9
Op. Income 1,099.5 770.7 631.7 -30.5 2,471.4 910.6 641.2 597.4 -109.8 2,039.4
(%) 8.0% 5.6% 4.7% -0.2% 4.5% 6.6% 4.5% 4.4% -0.8% 3.7%
LG Innotek (②)Sales 1,720.5 1,517.9 2,313.2 2,430.5 7,982.1 1,368.6 1,522.3 2,446.0 2,965.2 21.2% 22.0% 8,302.1
Op. Income 16.8 13.4 129.7 103.6 263.5 -11.4 18.8 186.5 209.2 403.1
LGE-LG Innotek
Inter-company Transaction (③)
Sales 259.9 312.7 253.6 209.9 1,036.1 181.7 221.6 170.1 145.4 -14.5% -30.7% 718.8
Op. Income 8.5 13.1 12.6 -2.6 31.6 -1.4 7.7 2.5 -2.4 6.4
LGE Consolidated (①+②-③)
Sales 15,123.0 15,019.4 15,427.0 15,772.3 61,341.7 14,915.1 15,629.2 15,700.7 16,061.2 2.3% 1.8% 62,306.2
Op. Income 1,107.8 771.0 748.8 75.7 2,703.3 900.6 652.3 781.4 101.8 2,436.1
(%) 7.3% 5.1% 4.9% 0.5% 4.4% 6.0% 4.2% 5.0% 0.6% 3.9%
* From 1Q`19, robot business has been restated to 'Others' from 'H&A division'
* From 1Q`19, companion device business has been restated to 'HE division' from 'MC division'
*Since the information regarding results of 4Q`19 has been prepared in advance, it is subject to change in the process of final audit by external auditors
(Unit : KRW billion)

Appendix Dividends
13
* (Consolidated) net income includes the profit attributable to owners of the parent
*2019 figures were prepared in advance of the completion of external auditor's audit process for the convenience of investors, some of which may be changed during the final audit process.
2012
(11th)
2013
(12th)
2014
(13th)
2015
(14th)
2016
(15th)
2017
(16th)
2018
(17th)
2019
(18th)
Face value per share
(KRW)Common 5,000 5,000 5,000 5,000 5,000 5,000 5,000 5,000
Preferred 5,000 5,000 5,000 5,000 5,000 5,000 5,000 5,000
Cash dividend per share
(KRW)Common 200 200 400 400 400 400 750 750
Preferred 250 250 450 450 450 450 800 800
(Consolidated) Net Income
(KRW billion)66.8 176.8 399.4 124.4 76.9 1,725.8 1,240.1 31.3
Total Cash Dividends
(KRW billion)36.9 36.9 72.9 72.9 72.9 72.9 135.9 135.9
(Consolidated) Cash dividends
payout ratio (%)55.2 20.9 18.3 58.6 94.8 4.2 11.0 434.4
Cash dividend yield (%)Common 0.3 0.3 0.7 0.8 0.8 0.4 1.2 1.0
Preferred 1.2 1.0 1.6 1.6 1.9 1.0 3.1 2.8
The company determine the dividends considering the profit level, cash flow of the current year, strategic investments in the
future and raising shareholder value in the market to increase shareholder value and shareholder return.
Dividends for fiscal year 2019 is to be approved by the Board of Directors and be confirmed after approval at the 18th
General Shareholders' Meeting.
※ Dividend per share in 2019: Common stock 750 Korean Won, Preferred stock 800 Korean Won