(4q15) australia australian banks€¦ · please refer to page 12 for important disclosures and...
TRANSCRIPT
Please refer to page 12 for important disclosures and analyst certification, or on our website
www.macquarie.com/research/disclosures.
AUSTRALIA
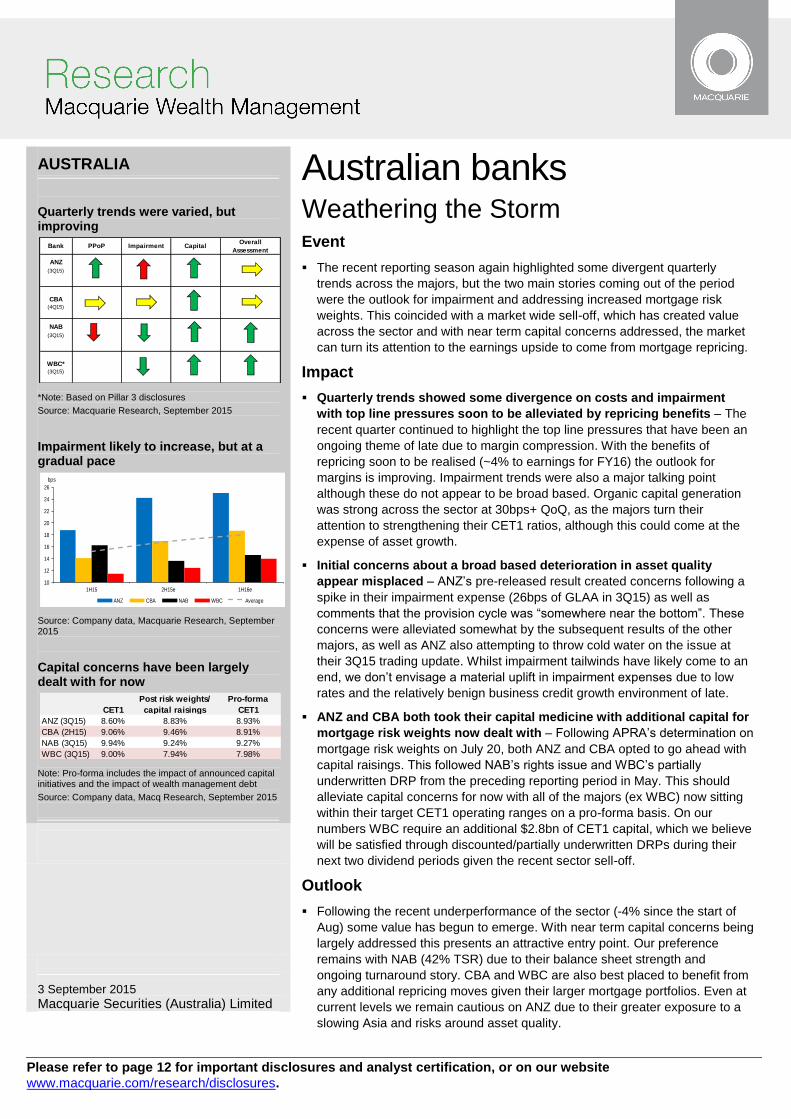
Quarterly trends were varied, but improving
*Note: Based on Pillar 3 disclosures
Source: Macquarie Research, September 2015
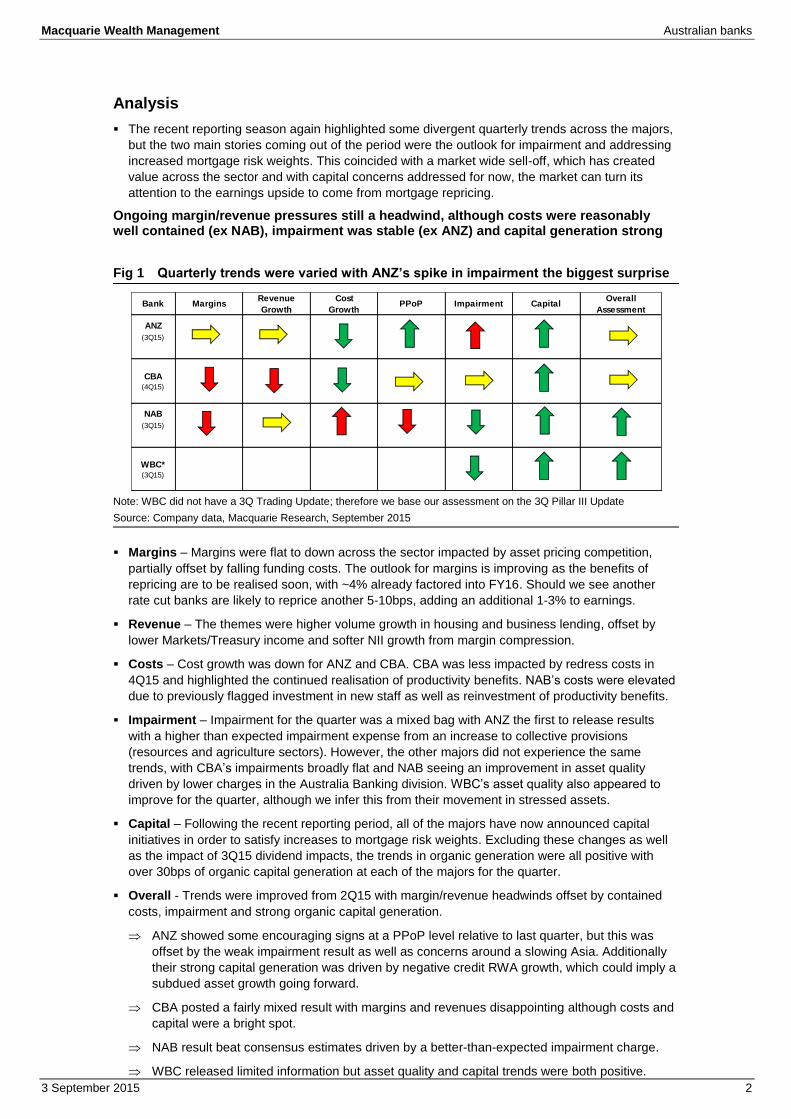
Impairment likely to increase, but at a gradual pace
Source: Company data, Macquarie Research, September 2015
Capital concerns have been largely dealt with for now
Note: Pro-forma includes the impact of announced capital initiatives and the impact of wealth management debt
Source: Company data, Macq Research, September 2015
3 September 2015 Macquarie Securities (Australia) Limited
Australian banks Weathering the Storm Event
The recent reporting season again highlighted some divergent quarterly
trends across the majors, but the two main stories coming out of the period
were the outlook for impairment and addressing increased mortgage risk
weights. This coincided with a market wide sell-off, which has created value
across the sector and with near term capital concerns addressed, the market
can turn its attention to the earnings upside to come from mortgage repricing.
Impact
Quarterly trends showed some divergence on costs and impairment
with top line pressures soon to be alleviated by repricing benefits – The
recent quarter continued to highlight the top line pressures that have been an
ongoing theme of late due to margin compression. With the benefits of
repricing soon to be realised (~4% to earnings for FY16) the outlook for
margins is improving. Impairment trends were also a major talking point
although these do not appear to be broad based. Organic capital generation
was strong across the sector at 30bps+ QoQ, as the majors turn their
attention to strengthening their CET1 ratios, although this could come at the
expense of asset growth.
Initial concerns about a broad based deterioration in asset quality
appear misplaced – ANZ’s pre-released result created concerns following a
spike in their impairment expense (26bps of GLAA in 3Q15) as well as
comments that the provision cycle was “somewhere near the bottom”. These
concerns were alleviated somewhat by the subsequent results of the other
majors, as well as ANZ also attempting to throw cold water on the issue at
their 3Q15 trading update. Whilst impairment tailwinds have likely come to an
end, we don’t envisage a material uplift in impairment expenses due to low
rates and the relatively benign business credit growth environment of late.
ANZ and CBA both took their capital medicine with additional capital for
mortgage risk weights now dealt with – Following APRA’s determination on
mortgage risk weights on July 20, both ANZ and CBA opted to go ahead with
capital raisings. This followed NAB’s rights issue and WBC’s partially
underwritten DRP from the preceding reporting period in May. This should
alleviate capital concerns for now with all of the majors (ex WBC) now sitting
within their target CET1 operating ranges on a pro-forma basis. On our
numbers WBC require an additional $2.8bn of CET1 capital, which we believe
will be satisfied through discounted/partially underwritten DRPs during their
next two dividend periods given the recent sector sell-off.
Outlook
Following the recent underperformance of the sector (-4% since the start of
Aug) some value has begun to emerge. With near term capital concerns being
largely addressed this presents an attractive entry point. Our preference
remains with NAB (42% TSR) due to their balance sheet strength and
ongoing turnaround story. CBA and WBC are also best placed to benefit from
any additional repricing moves given their larger mortgage portfolios. Even at
current levels we remain cautious on ANZ due to their greater exposure to a
slowing Asia and risks around asset quality.
Bank PPoP Impairment CapitalOverall
Assessment
ANZ
(3Q15)
CBA(4Q15)
NAB
(3Q15)
WBC*(3Q15)
10
12
14
16
18
20
22
24
26
1H15 2H15e 1H16e
bps
ANZ CBA NAB WBC Average
CET1
Post risk weights/
capital raisings
Pro-forma
CET1
ANZ (3Q15) 8.60% 8.83% 8.93%
CBA (2H15) 9.06% 9.46% 8.91%
NAB (3Q15) 9.94% 9.24% 9.27%
WBC (3Q15) 9.00% 7.94% 7.98%
Macquarie Wealth Management Australian banks
3 September 2015 2
Analysis
The recent reporting season again highlighted some divergent quarterly trends across the majors,
but the two main stories coming out of the period were the outlook for impairment and addressing
increased mortgage risk weights. This coincided with a market wide sell-off, which has created
value across the sector and with capital concerns addressed for now, the market can turn its
attention to the earnings upside to come from mortgage repricing.
Ongoing margin/revenue pressures still a headwind, although costs were reasonably well contained (ex NAB), impairment was stable (ex ANZ) and capital generation strong
Fig 1 Quarterly trends were varied with ANZ’s spike in impairment the biggest surprise
Note: WBC did not have a 3Q Trading Update; therefore we base our assessment on the 3Q Pillar III Update
Source: Company data, Macquarie Research, September 2015
Margins – Margins were flat to down across the sector impacted by asset pricing competition,
partially offset by falling funding costs. The outlook for margins is improving as the benefits of
repricing are to be realised soon, with ~4% already factored into FY16. Should we see another
rate cut banks are likely to reprice another 5-10bps, adding an additional 1-3% to earnings.
Revenue – The themes were higher volume growth in housing and business lending, offset by
lower Markets/Treasury income and softer NII growth from margin compression.
Costs – Cost growth was down for ANZ and CBA. CBA was less impacted by redress costs in
4Q15 and highlighted the continued realisation of productivity benefits. NAB’s costs were elevated
due to previously flagged investment in new staff as well as reinvestment of productivity benefits.
Impairment – Impairment for the quarter was a mixed bag with ANZ the first to release results
with a higher than expected impairment expense from an increase to collective provisions
(resources and agriculture sectors). However, the other majors did not experience the same
trends, with CBA’s impairments broadly flat and NAB seeing an improvement in asset quality
driven by lower charges in the Australia Banking division. WBC’s asset quality also appeared to
improve for the quarter, although we infer this from their movement in stressed assets.
Capital – Following the recent reporting period, all of the majors have now announced capital
initiatives in order to satisfy increases to mortgage risk weights. Excluding these changes as well
as the impact of 3Q15 dividend impacts, the trends in organic generation were all positive with
over 30bps of organic capital generation at each of the majors for the quarter.
Overall - Trends were improved from 2Q15 with margin/revenue headwinds offset by contained
costs, impairment and strong organic capital generation.
ANZ showed some encouraging signs at a PPoP level relative to last quarter, but this was
offset by the weak impairment result as well as concerns around a slowing Asia. Additionally
their strong capital generation was driven by negative credit RWA growth, which could imply a
subdued asset growth going forward.
CBA posted a fairly mixed result with margins and revenues disappointing although costs and
capital were a bright spot.
NAB result beat consensus estimates driven by a better-than-expected impairment charge.
WBC released limited information but asset quality and capital trends were both positive.
Bank MarginsRevenue
Growth
Cost
GrowthPPoP Impairment Capital
Overall
Assessment
ANZ
(3Q15)
CBA(4Q15)
NAB
(3Q15)
WBC*(3Q15)
Macquarie Wealth Management Australian banks
3 September 2015 3
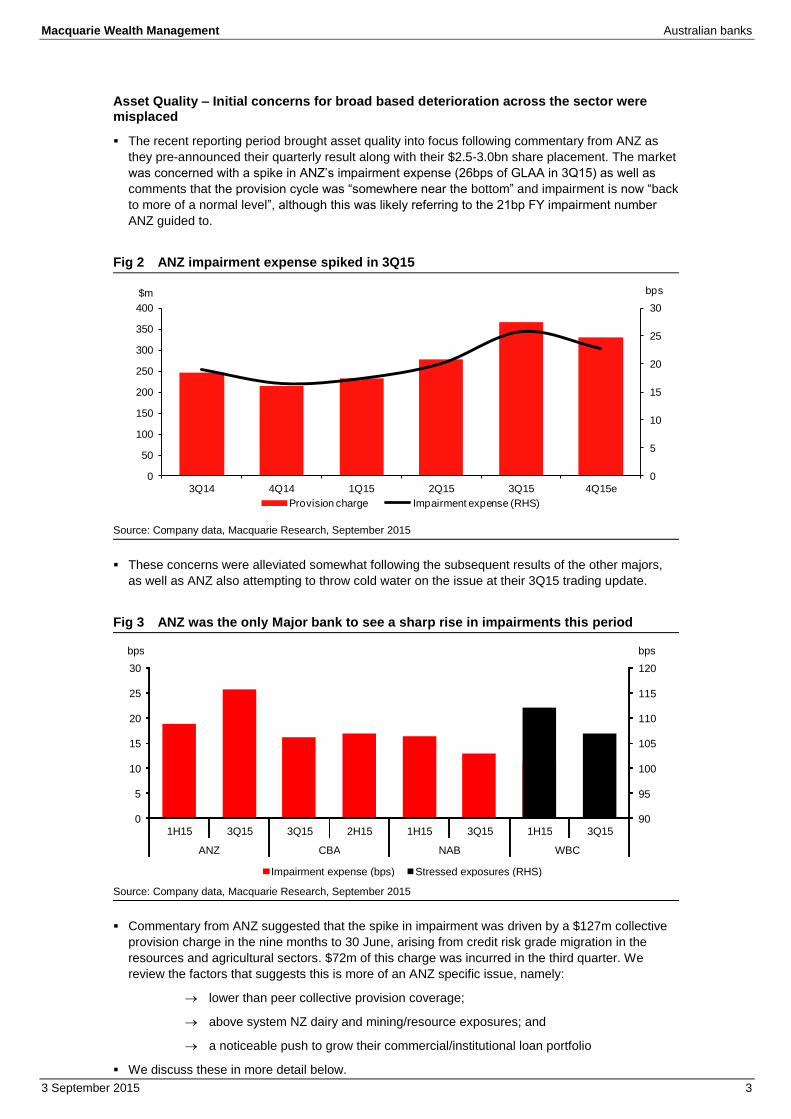
Asset Quality – Initial concerns for broad based deterioration across the sector were misplaced
The recent reporting period brought asset quality into focus following commentary from ANZ as
they pre-announced their quarterly result along with their $2.5-3.0bn share placement. The market
was concerned with a spike in ANZ’s impairment expense (26bps of GLAA in 3Q15) as well as
comments that the provision cycle was “somewhere near the bottom” and impairment is now “back
to more of a normal level”, although this was likely referring to the 21bp FY impairment number
ANZ guided to.
Fig 2 ANZ impairment expense spiked in 3Q15
Source: Company data, Macquarie Research, September 2015
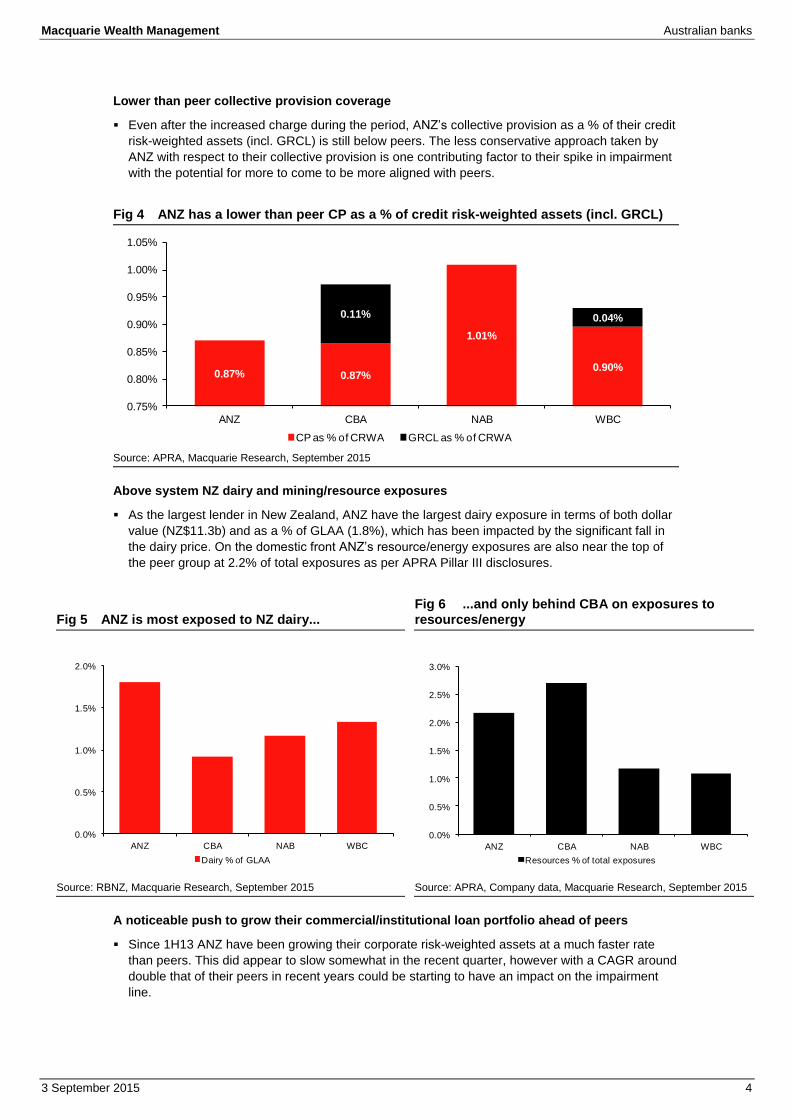
These concerns were alleviated somewhat following the subsequent results of the other majors,
as well as ANZ also attempting to throw cold water on the issue at their 3Q15 trading update.
Fig 3 ANZ was the only Major bank to see a sharp rise in impairments this period
Source: Company data, Macquarie Research, September 2015
Commentary from ANZ suggested that the spike in impairment was driven by a $127m collective
provision charge in the nine months to 30 June, arising from credit risk grade migration in the
resources and agricultural sectors. $72m of this charge was incurred in the third quarter. We
review the factors that suggests this is more of an ANZ specific issue, namely:
lower than peer collective provision coverage;
above system NZ dairy and mining/resource exposures; and
a noticeable push to grow their commercial/institutional loan portfolio
We discuss these in more detail below.
0
5
10
15
20
25
30
0
50
100
150
200
250
300
350
400
3Q14 4Q14 1Q15 2Q15 3Q15 4Q15e
bps$m
Provision charge Impairment expense (RHS)
90
95
100
105
110
115
120
0
5
10
15
20
25
30
1H15 3Q15 3Q15 2H15 1H15 3Q15 1H15 3Q15
ANZ CBA NAB WBC
bps bps
Impairment expense (bps) Stressed exposures (RHS)
Macquarie Wealth Management Australian banks
3 September 2015 4
Lower than peer collective provision coverage
Even after the increased charge during the period, ANZ’s collective provision as a % of their credit
risk-weighted assets (incl. GRCL) is still below peers. The less conservative approach taken by
ANZ with respect to their collective provision is one contributing factor to their spike in impairment
with the potential for more to come to be more aligned with peers.
Fig 4 ANZ has a lower than peer CP as a % of credit risk-weighted assets (incl. GRCL)
Source: APRA, Macquarie Research, September 2015
Above system NZ dairy and mining/resource exposures
As the largest lender in New Zealand, ANZ have the largest dairy exposure in terms of both dollar
value (NZ$11.3b) and as a % of GLAA (1.8%), which has been impacted by the significant fall in
the dairy price. On the domestic front ANZ’s resource/energy exposures are also near the top of
the peer group at 2.2% of total exposures as per APRA Pillar III disclosures.
Fig 5 ANZ is most exposed to NZ dairy...
Fig 6 ...and only behind CBA on exposures to resources/energy
Source: RBNZ, Macquarie Research, September 2015 Source: APRA, Company data, Macquarie Research, September 2015
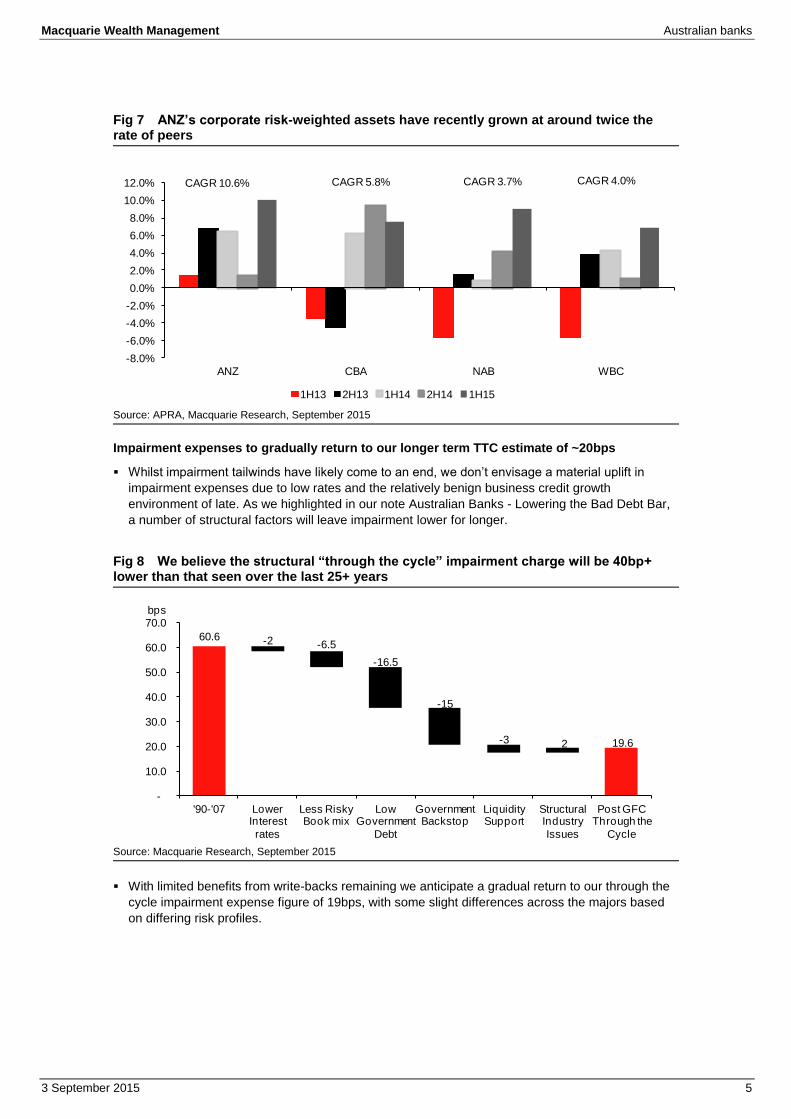
A noticeable push to grow their commercial/institutional loan portfolio ahead of peers
Since 1H13 ANZ have been growing their corporate risk-weighted assets at a much faster rate
than peers. This did appear to slow somewhat in the recent quarter, however with a CAGR around
double that of their peers in recent years could be starting to have an impact on the impairment
line.
0.87% 0.87%
1.01%
0.90%
0.11% 0.04%
0.75%
0.80%
0.85%
0.90%
0.95%
1.00%
1.05%
ANZ CBA NAB WBC
CP as % of CRWA GRCL as % of CRWA
0.0%
0.5%
1.0%
1.5%
2.0%
ANZ CBA NAB WBC
Dairy % of GLAA
0.0%
0.5%
1.0%
1.5%
2.0%
2.5%
3.0%
ANZ CBA NAB WBC
Resources % of total exposures
Macquarie Wealth Management Australian banks
3 September 2015 5
Fig 7 ANZ’s corporate risk-weighted assets have recently grown at around twice the rate of peers
Source: APRA, Macquarie Research, September 2015
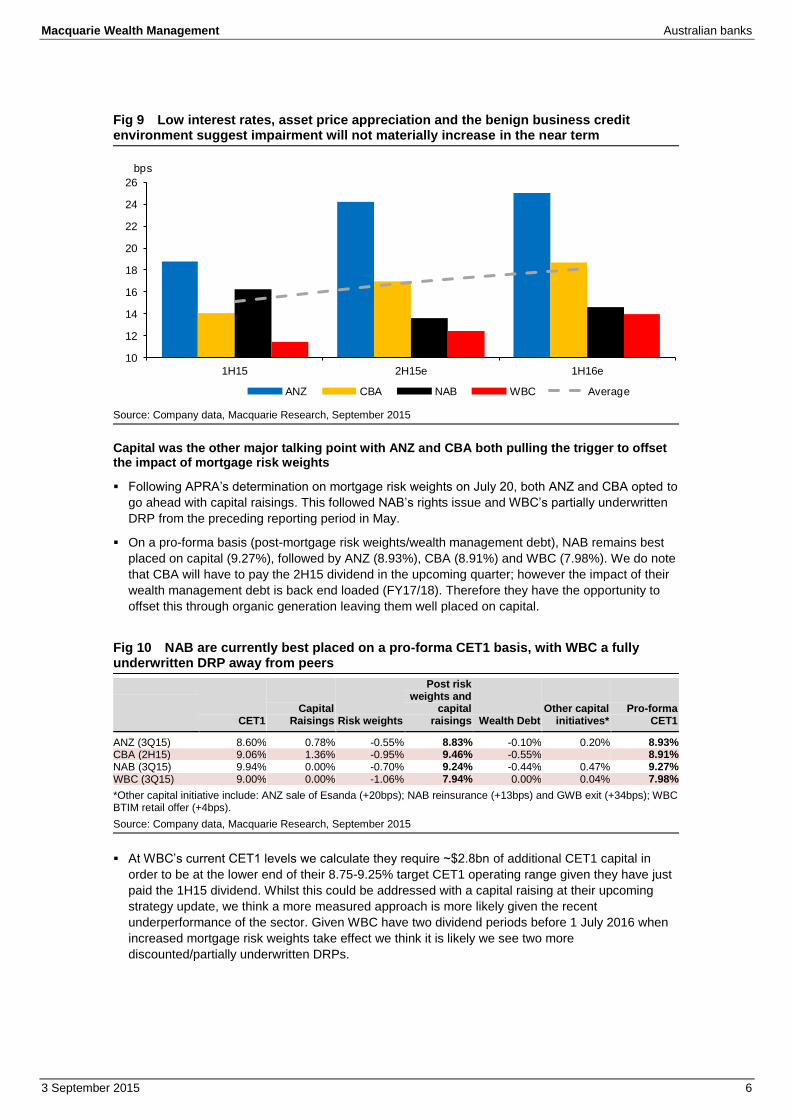
Impairment expenses to gradually return to our longer term TTC estimate of ~20bps
Whilst impairment tailwinds have likely come to an end, we don’t envisage a material uplift in
impairment expenses due to low rates and the relatively benign business credit growth
environment of late. As we highlighted in our note Australian Banks - Lowering the Bad Debt Bar,
a number of structural factors will leave impairment lower for longer.
Fig 8 We believe the structural “through the cycle” impairment charge will be 40bp+ lower than that seen over the last 25+ years
Source: Macquarie Research, September 2015
With limited benefits from write-backs remaining we anticipate a gradual return to our through the
cycle impairment expense figure of 19bps, with some slight differences across the majors based
on differing risk profiles.
CAGR 10.6% CAGR 5.8% CAGR 3.7% CAGR 4.0%
-8.0%
-6.0%
-4.0%
-2.0%
0.0%
2.0%
4.0%
6.0%
8.0%
10.0%
12.0%
ANZ CBA NAB WBC
1H13 2H13 1H14 2H14 1H15
60.6
2 19.6
-2 -6.5
-16.5
-15
-3
-
10.0
20.0
30.0
40.0
50.0
60.0
70.0
'90-'07 Lower Interest
rates
Less Risky Book mix
Low Government
Debt
Government Backstop
Liquidity Support
Structural Industry
Issues
Post GFC Through the
Cycle
bps
Macquarie Wealth Management Australian banks
3 September 2015 6
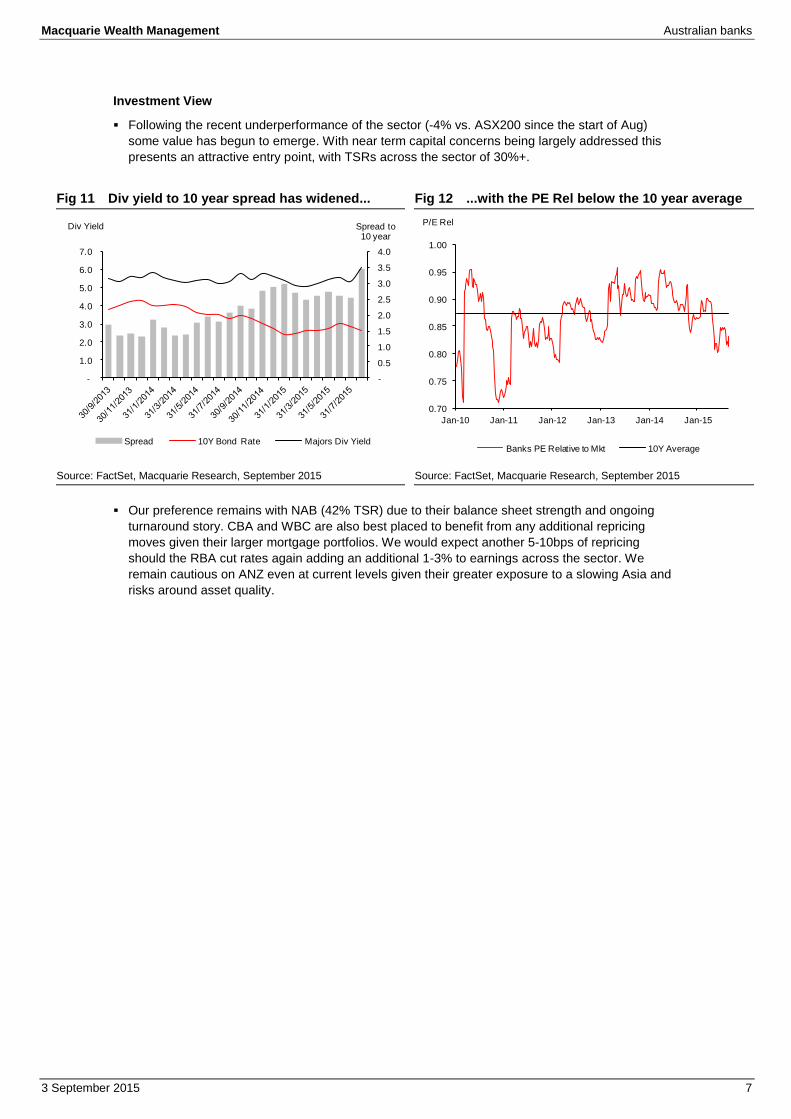
Fig 9 Low interest rates, asset price appreciation and the benign business credit environment suggest impairment will not materially increase in the near term
Source: Company data, Macquarie Research, September 2015
Capital was the other major talking point with ANZ and CBA both pulling the trigger to offset the impact of mortgage risk weights
Following APRA’s determination on mortgage risk weights on July 20, both ANZ and CBA opted to
go ahead with capital raisings. This followed NAB’s rights issue and WBC’s partially underwritten
DRP from the preceding reporting period in May.
On a pro-forma basis (post-mortgage risk weights/wealth management debt), NAB remains best
placed on capital (9.27%), followed by ANZ (8.93%), CBA (8.91%) and WBC (7.98%). We do note
that CBA will have to pay the 2H15 dividend in the upcoming quarter; however the impact of their
wealth management debt is back end loaded (FY17/18). Therefore they have the opportunity to
offset this through organic generation leaving them well placed on capital.
Fig 10 NAB are currently best placed on a pro-forma CET1 basis, with WBC a fully underwritten DRP away from peers
CET1 Capital
Raisings Risk weights
Post risk weights and
capital raisings Wealth Debt
Other capital initiatives*
Pro-forma CET1
ANZ (3Q15) 8.60% 0.78% -0.55% 8.83% -0.10% 0.20% 8.93% CBA (2H15) 9.06% 1.36% -0.95% 9.46% -0.55% 8.91% NAB (3Q15) 9.94% 0.00% -0.70% 9.24% -0.44% 0.47% 9.27% WBC (3Q15) 9.00% 0.00% -1.06% 7.94% 0.00% 0.04% 7.98%
*Other capital initiative include: ANZ sale of Esanda (+20bps); NAB reinsurance (+13bps) and GWB exit (+34bps); WBC BTIM retail offer (+4bps).
Source: Company data, Macquarie Research, September 2015
At WBC’s current CET1 levels we calculate they require ~$2.8bn of additional CET1 capital in
order to be at the lower end of their 8.75-9.25% target CET1 operating range given they have just
paid the 1H15 dividend. Whilst this could be addressed with a capital raising at their upcoming
strategy update, we think a more measured approach is more likely given the recent
underperformance of the sector. Given WBC have two dividend periods before 1 July 2016 when
increased mortgage risk weights take effect we think it is likely we see two more
discounted/partially underwritten DRPs.
10
12
14
16
18
20
22
24
26
1H15 2H15e 1H16e
bps
ANZ CBA NAB WBC Average
Macquarie Wealth Management Australian banks
3 September 2015 7
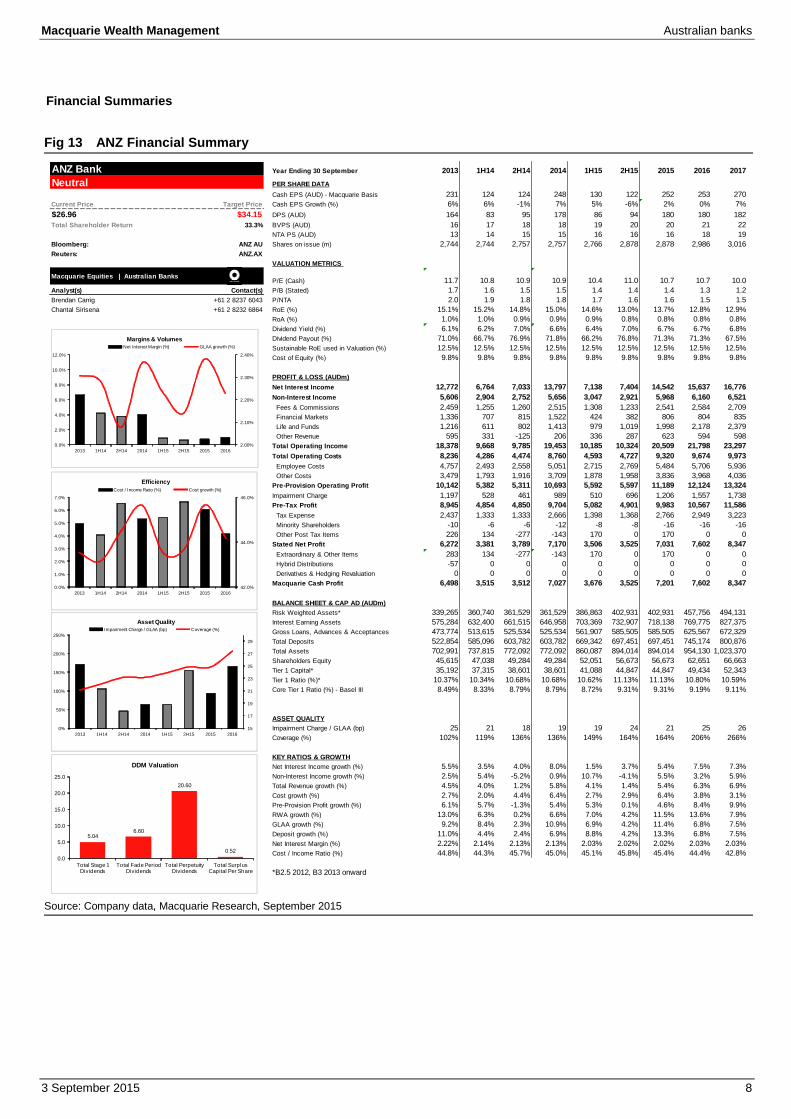
Investment View
Following the recent underperformance of the sector (-4% vs. ASX200 since the start of Aug)
some value has begun to emerge. With near term capital concerns being largely addressed this
presents an attractive entry point, with TSRs across the sector of 30%+.
Fig 11 Div yield to 10 year spread has widened... Fig 12 ...with the PE Rel below the 10 year average
Source: FactSet, Macquarie Research, September 2015 Source: FactSet, Macquarie Research, September 2015
Our preference remains with NAB (42% TSR) due to their balance sheet strength and ongoing
turnaround story. CBA and WBC are also best placed to benefit from any additional repricing
moves given their larger mortgage portfolios. We would expect another 5-10bps of repricing
should the RBA cut rates again adding an additional 1-3% to earnings across the sector. We
remain cautious on ANZ even at current levels given their greater exposure to a slowing Asia and
risks around asset quality.
-
0.5
1.0
1.5
2.0
2.5
3.0
3.5
4.0
-
1.0
2.0
3.0
4.0
5.0
6.0
7.0
Spread to10 year
Div Yield
Spread 10Y Bond Rate Majors Div Yield
0.70
0.75
0.80
0.85
0.90
0.95
1.00
Jan-10 Jan-11 Jan-12 Jan-13 Jan-14 Jan-15
P/E Rel
Banks PE Relative to Mkt 10Y Average
Macquarie Wealth Management Australian banks
3 September 2015 8
Financial Summaries
Fig 13 ANZ Financial Summary
Source: Company data, Macquarie Research, September 2015
ANZ Bank Year Ending 30 September 2013 1H14 2H14 2014 1H15 2H15 2015 2016 2017
Neutral PER SHARE DATA
Cash EPS (AUD) - Macquarie Basis 231 124 124 248 130 122 252 253 270
Current Price Target Price Cash EPS Growth (%) 6% 6% -1% 7% 5% -6% 2% 0% 7%
$26.96 $34.15 DPS (AUD) 164 83 95 178 86 94 180 180 182
Total Shareholder Return 33.3% BVPS (AUD) 16 17 18 18 19 20 20 21 22
NTA PS (AUD) 13 14 15 15 16 16 16 18 19
Bloomberg: ANZ AU Shares on issue (m) 2,744 2,744 2,757 2,757 2,766 2,878 2,878 2,986 3,016
Reuters: ANZ.AX
VALUATION METRICS
Macquarie Equities | Australian BanksP/E (Cash) 11.7 10.8 10.9 10.9 10.4 11.0 10.7 10.7 10.0
Analyst(s) Contact(s) P/B (Stated) 1.7 1.6 1.5 1.5 1.4 1.4 1.4 1.3 1.2
Brendan Carrig +61 2 8237 6043 P/NTA 2.0 1.9 1.8 1.8 1.7 1.6 1.6 1.5 1.5
Chantal Sirisena +61 2 8232 6864 RoE (%) 15.1% 15.2% 14.8% 15.0% 14.6% 13.0% 13.7% 12.8% 12.9%
RoA (%) 1.0% 1.0% 0.9% 0.9% 0.9% 0.8% 0.8% 0.8% 0.8%
Dividend Yield (%) 6.1% 6.2% 7.0% 6.6% 6.4% 7.0% 6.7% 6.7% 6.8%
Dividend Payout (%) 71.0% 66.7% 76.9% 71.8% 66.2% 76.8% 71.3% 71.3% 67.5%
Sustainable RoE used in Valuation (%) 12.5% 12.5% 12.5% 12.5% 12.5% 12.5% 12.5% 12.5% 12.5%
Cost of Equity (%) 9.8% 9.8% 9.8% 9.8% 9.8% 9.8% 9.8% 9.8% 9.8%
PROFIT & LOSS (AUDm)
Net Interest Income 12,772 6,764 7,033 13,797 7,138 7,404 14,542 15,637 16,776
Non-Interest Income 5,606 2,904 2,752 5,656 3,047 2,921 5,968 6,160 6,521
Fees & Commissions 2,459 1,255 1,260 2,515 1,308 1,233 2,541 2,584 2,709
Financial Markets 1,336 707 815 1,522 424 382 806 804 835
Life and Funds 1,216 611 802 1,413 979 1,019 1,998 2,178 2,379
Other Revenue 595 331 -125 206 336 287 623 594 598
Total Operating Income 18,378 9,668 9,785 19,453 10,185 10,324 20,509 21,798 23,297
Total Operating Costs 8,236 4,286 4,474 8,760 4,593 4,727 9,320 9,674 9,973
Employee Costs 4,757 2,493 2,558 5,051 2,715 2,769 5,484 5,706 5,936
Other Costs 3,479 1,793 1,916 3,709 1,878 1,958 3,836 3,968 4,036
Pre-Provision Operating Profit 10,142 5,382 5,311 10,693 5,592 5,597 11,189 12,124 13,324
Impairment Charge 1,197 528 461 989 510 696 1,206 1,557 1,738
Pre-Tax Profit 8,945 4,854 4,850 9,704 5,082 4,901 9,983 10,567 11,586
Tax Expense 2,437 1,333 1,333 2,666 1,398 1,368 2,766 2,949 3,223
Minority Shareholders -10 -6 -6 -12 -8 -8 -16 -16 -16
Other Post Tax Items 226 134 -277 -143 170 0 170 0 0
Stated Net Profit 6,272 3,381 3,789 7,170 3,506 3,525 7,031 7,602 8,347
Extraordinary & Other Items 283 134 -277 -143 170 0 170 0 0
Hybrid Distributions -57 0 0 0 0 0 0 0 0
Derivatives & Hedging Revaluation 0 0 0 0 0 0 0 0 0
Macquarie Cash Profit 6,498 3,515 3,512 7,027 3,676 3,525 7,201 7,602 8,347
BALANCE SHEET & CAP AD (AUDm)
Risk Weighted Assets* 339,265 360,740 361,529 361,529 386,863 402,931 402,931 457,756 494,131
Interest Earning Assets 575,284 632,400 661,515 646,958 703,369 732,907 718,138 769,775 827,375
Gross Loans, Advances & Acceptances 473,774 513,615 525,534 525,534 561,907 585,505 585,505 625,567 672,329
Total Deposits 522,854 585,096 603,782 603,782 669,342 697,451 697,451 745,174 800,876
Total Assets 702,991 737,815 772,092 772,092 860,087 894,014 894,014 954,130 1,023,370
Shareholders Equity 45,615 47,038 49,284 49,284 52,051 56,673 56,673 62,651 66,663
Tier 1 Capital* 35,192 37,315 38,601 38,601 41,088 44,847 44,847 49,434 52,343
Tier 1 Ratio (%)* 10.37% 10.34% 10.68% 10.68% 10.62% 11.13% 11.13% 10.80% 10.59%
Core Tier 1 Ratio (%) - Basel III 8.49% 8.33% 8.79% 8.79% 8.72% 9.31% 9.31% 9.19% 9.11%
ASSET QUALITY
Impairment Charge / GLAA (bp) 25 21 18 19 19 24 21 25 26
Coverage (%) 102% 119% 136% 136% 149% 164% 164% 206% 266%
KEY RATIOS & GROWTH
Net Interest Income growth (%) 5.5% 3.5% 4.0% 8.0% 1.5% 3.7% 5.4% 7.5% 7.3%
Non-Interest Income growth (%) 2.5% 5.4% -5.2% 0.9% 10.7% -4.1% 5.5% 3.2% 5.9%
Total Revenue growth (%) 4.5% 4.0% 1.2% 5.8% 4.1% 1.4% 5.4% 6.3% 6.9%
Cost growth (%) 2.7% 2.0% 4.4% 6.4% 2.7% 2.9% 6.4% 3.8% 3.1%
Pre-Provision Profit growth (%) 6.1% 5.7% -1.3% 5.4% 5.3% 0.1% 4.6% 8.4% 9.9%
RWA growth (%) 13.0% 6.3% 0.2% 6.6% 7.0% 4.2% 11.5% 13.6% 7.9%
GLAA growth (%) 9.2% 8.4% 2.3% 10.9% 6.9% 4.2% 11.4% 6.8% 7.5%
Deposit growth (%) 11.0% 4.4% 2.4% 6.9% 8.8% 4.2% 13.3% 6.8% 7.5%
Net Interest Margin (%) 2.22% 2.14% 2.13% 2.13% 2.03% 2.02% 2.02% 2.03% 2.03%
Cost / Income Ratio (%) 44.8% 44.3% 45.7% 45.0% 45.1% 45.8% 45.4% 44.4% 42.8%
*B2.5 2012, B3 2013 onward
2.00%
2.10%
2.20%
2.30%
2.40%
0.0%
2.0%
4.0%
6.0%
8.0%
10.0%
12.0%
2013 1H14 2H14 2014 1H15 2H15 2015 2016
Margins & VolumesNet Interest Margin (%) GLAA growth (%)
42.0%
44.0%
46.0%
0.0%
1.0%
2.0%
3.0%
4.0%
5.0%
6.0%
7.0%
2013 1H14 2H14 2014 1H15 2H15 2015 2016
Efficiency
Cost / Income Ratio (%) Cost growth (%)
15
17
19
21
23
25
27
29
0%
50%
100%
150%
200%
250%
2013 1H14 2H14 2014 1H15 2H15 2015 2016
Asset QualityImpairment Charge / GLAA (bp) Coverage (%)
5.046.60
20.60
0.52
0.0
5.0
10.0
15.0
20.0
25.0
Total Stage 1 Dividends
Total Fade Period Dividends
Total Perpetuity Dividends
Total Surplus Capital Per Share
DDM Valuation
Macquarie Wealth Management Australian banks
3 September 2015 9
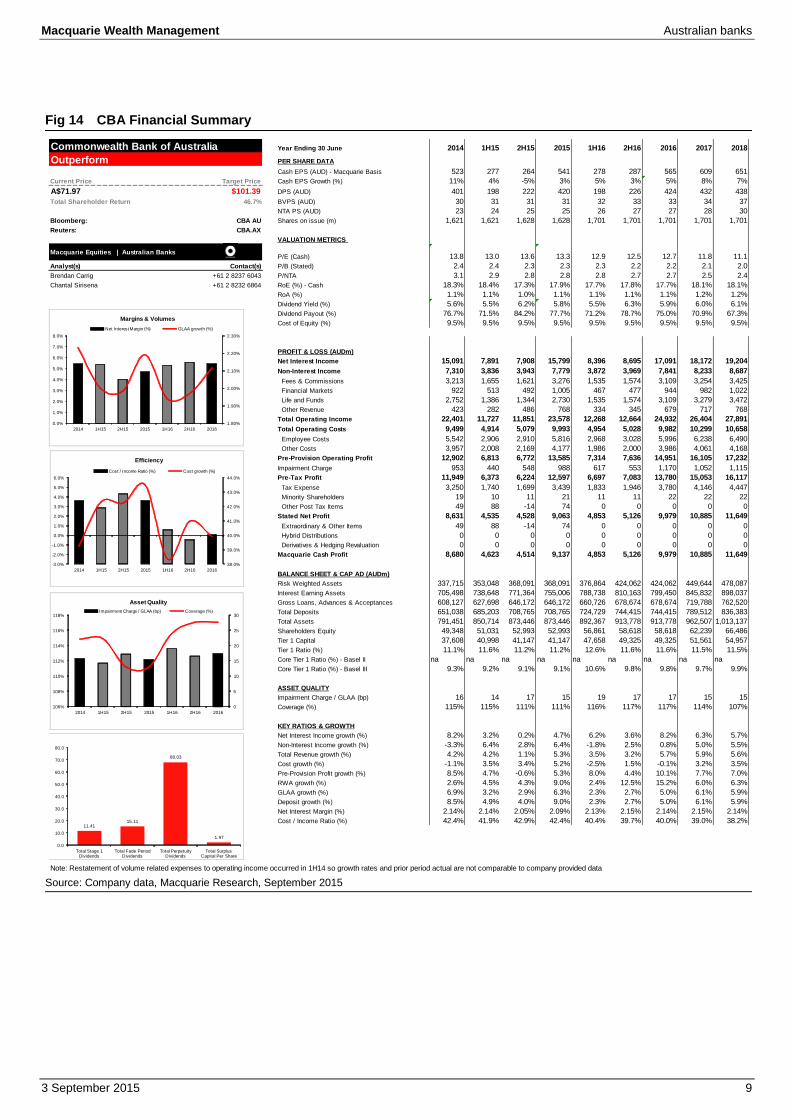
Fig 14 CBA Financial Summary
Source: Company data, Macquarie Research, September 2015
Commonwealth Bank of Australia Year Ending 30 June 2014 1H15 2H15 2015 1H16 2H16 2016 2017 2018
Outperform PER SHARE DATA
Cash EPS (AUD) - Macquarie Basis 523 277 264 541 278 287 565 609 651
Current Price Target Price Cash EPS Growth (%) 11% 4% -5% 3% 5% 3% 5% 8% 7%
A$71.97 $101.39 DPS (AUD) 401 198 222 420 198 226 424 432 438
Total Shareholder Return 46.7% BVPS (AUD) 30 31 31 31 32 33 33 34 37
NTA PS (AUD) 23 24 25 25 26 27 27 28 30
Bloomberg: CBA AU Shares on issue (m) 1,621 1,621 1,628 1,628 1,701 1,701 1,701 1,701 1,701
Reuters: CBA.AX
VALUATION METRICS
Macquarie Equities | Australian BanksP/E (Cash) 13.8 13.0 13.6 13.3 12.9 12.5 12.7 11.8 11.1
Analyst(s) Contact(s) P/B (Stated) 2.4 2.4 2.3 2.3 2.3 2.2 2.2 2.1 2.0
Brendan Carrig +61 2 8237 6043 P/NTA 3.1 2.9 2.8 2.8 2.8 2.7 2.7 2.5 2.4
Chantal Sirisena +61 2 8232 6864 RoE (%) - Cash 18.3% 18.4% 17.3% 17.9% 17.7% 17.8% 17.7% 18.1% 18.1%
RoA (%) 1.1% 1.1% 1.0% 1.1% 1.1% 1.1% 1.1% 1.2% 1.2%
Dividend Yield (%) 5.6% 5.5% 6.2% 5.8% 5.5% 6.3% 5.9% 6.0% 6.1%
Dividend Payout (%) 76.7% 71.5% 84.2% 77.7% 71.2% 78.7% 75.0% 70.9% 67.3%
Cost of Equity (%) 9.5% 9.5% 9.5% 9.5% 9.5% 9.5% 9.5% 9.5% 9.5%
PROFIT & LOSS (AUDm)
Net Interest Income 15,091 7,891 7,908 15,799 8,396 8,695 17,091 18,172 19,204
Non-Interest Income 7,310 3,836 3,943 7,779 3,872 3,969 7,841 8,233 8,687
Fees & Commissions 3,213 1,655 1,621 3,276 1,535 1,574 3,109 3,254 3,425
Financial Markets 922 513 492 1,005 467 477 944 982 1,022
Life and Funds 2,752 1,386 1,344 2,730 1,535 1,574 3,109 3,279 3,472
Other Revenue 423 282 486 768 334 345 679 717 768
Total Operating Income 22,401 11,727 11,851 23,578 12,268 12,664 24,932 26,404 27,891
Total Operating Costs 9,499 4,914 5,079 9,993 4,954 5,028 9,982 10,299 10,658
Employee Costs 5,542 2,906 2,910 5,816 2,968 3,028 5,996 6,238 6,490
Other Costs 3,957 2,008 2,169 4,177 1,986 2,000 3,986 4,061 4,168
Pre-Provision Operating Profit 12,902 6,813 6,772 13,585 7,314 7,636 14,951 16,105 17,232
Impairment Charge 953 440 548 988 617 553 1,170 1,052 1,115
Pre-Tax Profit 11,949 6,373 6,224 12,597 6,697 7,083 13,780 15,053 16,117
Tax Expense 3,250 1,740 1,699 3,439 1,833 1,946 3,780 4,146 4,447
Minority Shareholders 19 10 11 21 11 11 22 22 22
Other Post Tax Items 49 88 -14 74 0 0 0 0 0
Stated Net Profit 8,631 4,535 4,528 9,063 4,853 5,126 9,979 10,885 11,649
Extraordinary & Other Items 49 88 -14 74 0 0 0 0 0
Hybrid Distributions 0 0 0 0 0 0 0 0 0
Derivatives & Hedging Revaluation 0 0 0 0 0 0 0 0 0
Macquarie Cash Profit 8,680 4,623 4,514 9,137 4,853 5,126 9,979 10,885 11,649
BALANCE SHEET & CAP AD (AUDm)
Risk Weighted Assets 337,715 353,048 368,091 368,091 376,864 424,062 424,062 449,644 478,087
Interest Earning Assets 705,498 738,648 771,364 755,006 788,738 810,163 799,450 845,832 898,037
Gross Loans, Advances & Acceptances 608,127 627,698 646,172 646,172 660,726 678,674 678,674 719,788 762,520
Total Deposits 651,038 685,203 708,765 708,765 724,729 744,415 744,415 789,512 836,383
Total Assets 791,451 850,714 873,446 873,446 892,367 913,778 913,778 962,507 1,013,137
Shareholders Equity 49,348 51,031 52,993 52,993 56,861 58,618 58,618 62,239 66,486
Tier 1 Capital 37,608 40,998 41,147 41,147 47,658 49,325 49,325 51,561 54,957
Tier 1 Ratio (%) 11.1% 11.6% 11.2% 11.2% 12.6% 11.6% 11.6% 11.5% 11.5%
Core Tier 1 Ratio (%) - Basel II na na na na na na na na na
Core Tier 1 Ratio (%) - Basel III 9.3% 9.2% 9.1% 9.1% 10.6% 9.8% 9.8% 9.7% 9.9%
ASSET QUALITY
Impairment Charge / GLAA (bp) 16 14 17 15 19 17 17 15 15
Coverage (%) 115% 115% 111% 111% 116% 117% 117% 114% 107%
KEY RATIOS & GROWTH
Net Interest Income growth (%) 8.2% 3.2% 0.2% 4.7% 6.2% 3.6% 8.2% 6.3% 5.7%
Non-Interest Income growth (%) -3.3% 6.4% 2.8% 6.4% -1.8% 2.5% 0.8% 5.0% 5.5%
Total Revenue growth (%) 4.2% 4.2% 1.1% 5.3% 3.5% 3.2% 5.7% 5.9% 5.6%
Cost growth (%) -1.1% 3.5% 3.4% 5.2% -2.5% 1.5% -0.1% 3.2% 3.5%
Pre-Provision Profit growth (%) 8.5% 4.7% -0.6% 5.3% 8.0% 4.4% 10.1% 7.7% 7.0%
RWA growth (%) 2.6% 4.5% 4.3% 9.0% 2.4% 12.5% 15.2% 6.0% 6.3%
GLAA growth (%) 6.9% 3.2% 2.9% 6.3% 2.3% 2.7% 5.0% 6.1% 5.9%
Deposit growth (%) 8.5% 4.9% 4.0% 9.0% 2.3% 2.7% 5.0% 6.1% 5.9%
Net Interest Margin (%) 2.14% 2.14% 2.05% 2.09% 2.13% 2.15% 2.14% 2.15% 2.14%
Cost / Income Ratio (%) 42.4% 41.9% 42.9% 42.4% 40.4% 39.7% 40.0% 39.0% 38.2%
Note: Restatement of volume related expenses to operating income occurred in 1H14 so growth rates and prior period actual are not comparable to company provided data
1.80%
1.90%
2.00%
2.10%
2.20%
2.30%
0.0%
1.0%
2.0%
3.0%
4.0%
5.0%
6.0%
7.0%
8.0%
2014 1H15 2H15 2015 1H16 2H16 2016
Margins & Volumes
Net Interest Margin (%) GLAA growth (%)
38.0%
39.0%
40.0%
41.0%
42.0%
43.0%
44.0%
-3.0%
-2.0%
-1.0%
0.0%
1.0%
2.0%
3.0%
4.0%
5.0%
6.0%
2014 1H15 2H15 2015 1H16 2H16 2016
Efficiency
Cost / Income Ratio (%) Cost growth (%)
0
5
10
15
20
25
30
106%
108%
110%
112%
114%
116%
118%
2014 1H15 2H15 2015 1H16 2H16 2016
Asset Quality
Impairment Charge / GLAA (bp) Coverage (%)
11.4115.11
68.03
1.97
0.0
10.0
20.0
30.0
40.0
50.0
60.0
70.0
80.0
Total Stage 1 Dividends
Total Fade Period Dividends
Total Perpetuity Dividends
Total Surplus Capital Per Share

Macquarie Wealth Management Australian banks
3 September 2015 10
Fig 15 NAB Financial Summary
Source: Company data, Macquarie Research, September 2015
National Australia Bank Year Ending 30 September 2013 1H14 2H14 2014 1H15 2H15 2015 2016 2017
Outperform PER SHARE DATA
Cash EPS (AUD) - Macquarie Basis 251 131 85 216 136 135 271 283 307
Current Price Target Price Cash EPS Growth (%) 5% 3% -35% -14% 60% -1% 25% 5% 8%
A$29.93 $40.50 DPS (AUD) 190 99 99 198 99 99 198 201 207
Total Shareholder Return 41.9% BVPS (AUD) 17.89 18.21 18.41 18.41 18.97 19.01 19.01 20.06 21.26
NTA PS (AUD) 14.64 14.88 15.15 15.15 15.65 16.16 16.16 17.00 17.98
Bloomberg: NAB AU Shares on issue (m) 2,349 2,354 2,366 2,366 2,421 2,624 2,624 2,646 2,666
Reuters: NAB.AX
VALUATION METRICS
Macquarie Equities | Australian BanksP/E (Cash) 11.9 11.4 17.6 13.8 11.0 11.1 11.0 10.6 9.8
Analyst(s) Contact(s) P/B (Stated) 1.7 1.6 1.6 1.6 1.6 1.6 1.6 1.5 1.4
Brendan Carrig +61 2 8237 6043 P/NTA 2.0 2.0 2.0 2.0 1.9 1.9 1.9 1.8 1.7
Chantal Sirisena +61 2 8237 6864 RoE (%) 12.2% 13.6% 8.6% 11.1% 13.7% 13.1% 13.4% 13.2% 13.6%
RoA (%) 0.7% 0.7% 0.5% 0.6% 0.7% 0.7% 0.7% 0.8% 0.8%
Dividend Yield (%) 6.3% 3.3% 3.3% 6.6% 3.3% 3.3% 6.6% 6.7% 6.9%
Dividend Payout (%) 75.8% 75.4% 116.3% 91.5% 72.7% 73.4% 73.1% 70.9% 67.5%
Sustainable RoE used in Valuation (%) 12.8% 12.8% 12.8% 12.8% 12.8% 12.8% 12.8% 12.8% 12.8%
Cost of Equity (%) 9.6% 9.6% 9.6% 9.6% 9.6% 9.6% 9.6% 9.6% 9.6%
PROFIT & LOSS (AUDm)
Net Interest Income 13,407 6,843 6,932 13,775 7,121 7,251 14,372 15,786 16,729
Non-Interest Income 5,173 2,644 2,494 5,138 2,663 2,675 5,338 5,538 5,718
Fees & Commissions 3,561 1,804 1,848 3,652 1,221 1,261 2,482 2,616 2,673
Financial Markets 769 249 750 999 456 470 926 968 1,007
Life and Funds 1,335 723 717 1,440 781 801 1,582 1,651 1,717
Other Revenue -492 -132 -821 -953 205 143 348 303 321
Total Operating Income 18,580 9,487 9,426 18,913 9,784 9,926 19,710 21,324 22,447
Total Operating Costs 8,174 4,456 5,724 10,180 4,460 5,428 9,888 9,427 9,467
Employee Costs 4,362 2,292 2,240 4,532 2,329 2,376 4,705 4,319 4,493
Other Costs 3,812 2,164 3,484 5,648 2,131 3,052 5,183 5,109 4,974
Pre-Provision Operating Profit 10,406 5,031 3,702 8,733 5,324 4,499 9,823 11,897 12,980
Impairment Charge 1,934 528 349 877 455 394 849 929 1,028
Pre-Tax Profit 8,472 4,503 3,353 7,856 4,869 4,105 8,974 10,967 11,952
Tax Expense 2,337 1,263 1,229 2,492 1,424 1,173 2,597 3,159 3,444
Minority Shareholders -8 -3 0 -3 -20 0 -20 0 0
Other Post Tax Items 675 381 -315 66 -15 0 -15 0 0
Stated Net Profit 5,452 2,856 2,439 5,295 3,440 2,932 6,372 7,809 8,508
Extraordinary & Other Items 675 384 -315 69 -11 633 622 0 0
Hybrid Distributions -188 -90 -90 -180 -109 -109 -218 -218 -218
IoRE/Non Controlling Interest -3 0 0 0 0 0 0 0 0
Derivatives & Hedging Revaluation 0 0 0 0 0 0 0 0 0
Macquarie Cash Profit 5,936 3,150 2,034 5,184 3,320 3,456 6,776 7,591 8,290
BALANCE SHEET & CAP AD (AUDm)
Risk Weighted Assets * 362,078 367,224 367,652 367,652 393,238 389,109 389,109 445,901 471,239
Interest Earning Assets 662,028 707,170 715,993 711,582 745,411 757,524 751,468 792,694 840,042
Gross Loans, Advances & Acceptances 521,757 534,172 545,361 545,361 573,490 582,809 582,809 619,565 654,876
Total Deposits 559,238 582,739 599,059 599,059 634,650 644,341 644,341 684,977 724,016
Total Assets 808,427 846,014 883,301 883,301 958,587 969,376 969,376 1,019,303 1,067,866
Shareholders Equity 46,620 47,478 47,908 47,908 49,868 55,810 55,810 59,192 63,081
Tier 1 Capital 37,480 39,774 39,758 39,758 43,752 47,580 47,580 50,049 53,065
Tier 1 Ratio (%) * 10.4% 10.8% 10.8% 10.8% 11.1% 12.2% 12.2% 11.2% 11.3%
Core Tier 1 Ratio (%) - Basel III 8.4% 8.6% 8.63% 8.6% 8.9% 10.0% 10.0% 9.2% 9.4%
ASSET QUALITY
Impairment Charge / GLAA (bp) 37 20 13 16 16 14 15 15 16
Coverage (%) 63% 68% 76% 76% 146% 140% 140% 132% 125%
KEY RATIOS & GROWTH
Net Interest Income growth (%) 0.8% 0.6% 1.3% 2.7% 2.7% 1.8% 4.3% 9.8% 6.0%
Non-Interest Income growth (%) 5.0% 4.5% -5.7% -0.7% 6.8% 0.5% 3.9% 3.7% 3.2%
Total Revenue growth (%) 2.0% 1.7% -0.6% 1.8% 3.8% 1.5% 4.2% 8.2% 5.3%
Cost growth (%) 4.4% 6.1% 28.5% 24.5% -22.1% 21.7% -2.9% -4.7% 0.4%
Pre-Provision Profit growth (%) 0.1% -2.0% -26.4% -16.1% 43.8% -15.5% 12.5% 21.1% 9.1%
RWA growth (%) 9.3% 1.4% 0.1% 1.5% 7.0% -1.1% 5.8% 14.6% 5.7%
GLAA growth (%) 4.2% 2.4% 2.1% 4.5% 5.2% 1.6% 6.9% 6.3% 5.7%
Deposit growth (%) 4.9% 2.8% 4.1% 7.1% 3.8% 1.6% 5.4% 6.3% 5.7%
Net Interest Margin (%) 2.03% 1.94% 1.94% 1.94% 1.91% 1.91% 1.91% 1.99% 1.99%
Cost / Income Ratio (%) 44.0% 47.0% 60.7% 53.8% 45.6% 54.7% 50.2% 44.2% 42.2%
*B2.5 2012, B3 2013 onward
0.0%
0.5%
1.0%
1.5%
2.0%
0.0%
1.0%
2.0%
3.0%
4.0%
5.0%
6.0%
7.0%
8.0%
2013 1H14 2H14 2014 1H15 2H15 2015 2016
Margins & Volumes
Net Interest Margin (%) GLAA growth (%)
-10.0%
0.0%
10.0%
20.0%
30.0%
40.0%
50.0%
-30.0%
-20.0%
-10.0%
0.0%
10.0%
20.0%
30.0%
40.0%
2013 1H14 2H14 2014 1H15 2H15 2015 2016
Efficiency
Cost / Income Ratio (%) Cost growth (%)
10
15
20
25
30
35
40
60%
70%
80%
90%
100%
110%
120%
130%
140%
150%
160%
2013 1H14 2H14 2014 1H15 2H15 2015 2016
Asset Quality
Impairment Charge / GLAA (bp) Coverage (%)
5.647.42
24.58
1.14
0.0
5.0
10.0
15.0
20.0
25.0
30.0
Total Stage 1 Dividends
Total Fade Period Dividends
Total Perpetuity Dividends
Total Surplus Capital Per Share
DDM Valuation
Macquarie Wealth Management Australian banks
3 September 2015 11
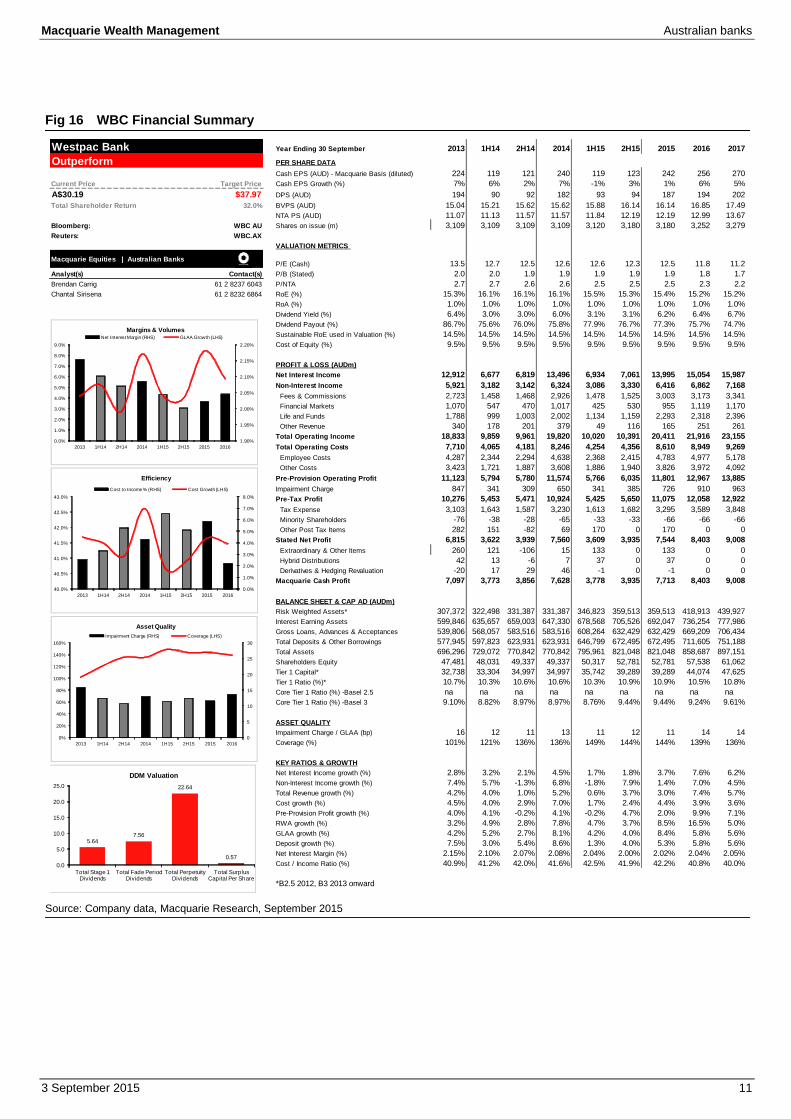
Fig 16 WBC Financial Summary
Source: Company data, Macquarie Research, September 2015
Westpac Bank Year Ending 30 September 2013 1H14 2H14 2014 1H15 2H15 2015 2016 2017
Outperform PER SHARE DATA
Cash EPS (AUD) - Macquarie Basis (diluted) 224 119 121 240 119 123 242 256 270
Current Price Target Price Cash EPS Growth (%) 7% 6% 2% 7% -1% 3% 1% 6% 5%
A$30.19 $37.97 DPS (AUD) 194 90 92 182 93 94 187 194 202
Total Shareholder Return 32.0% BVPS (AUD) 15.04 15.21 15.62 15.62 15.88 16.14 16.14 16.85 17.49
NTA PS (AUD) 11.07 11.13 11.57 11.57 11.84 12.19 12.19 12.99 13.67
Bloomberg: WBC AU Shares on issue (m) 3,109 3,109 3,109 3,109 3,120 3,180 3,180 3,252 3,279
Reuters: WBC.AX
VALUATION METRICS
Macquarie Equities | Australian BanksP/E (Cash) 13.5 12.7 12.5 12.6 12.6 12.3 12.5 11.8 11.2
Analyst(s) Contact(s) P/B (Stated) 2.0 2.0 1.9 1.9 1.9 1.9 1.9 1.8 1.7
Brendan Carrig +61 2 8237 6043 P/NTA 2.7 2.7 2.6 2.6 2.5 2.5 2.5 2.3 2.2
Chantal Sirisena +61 2 8232 6864 RoE (%) 15.3% 16.1% 16.1% 16.1% 15.5% 15.3% 15.4% 15.2% 15.2%
RoA (%) 1.0% 1.0% 1.0% 1.0% 1.0% 1.0% 1.0% 1.0% 1.0%
Dividend Yield (%) 6.4% 3.0% 3.0% 6.0% 3.1% 3.1% 6.2% 6.4% 6.7%
Dividend Payout (%) 86.7% 75.6% 76.0% 75.8% 77.9% 76.7% 77.3% 75.7% 74.7%
Sustainable RoE used in Valuation (%) 14.5% 14.5% 14.5% 14.5% 14.5% 14.5% 14.5% 14.5% 14.5%
Cost of Equity (%) 9.5% 9.5% 9.5% 9.5% 9.5% 9.5% 9.5% 9.5% 9.5%
PROFIT & LOSS (AUDm)
Net Interest Income 12,912 6,677 6,819 13,496 6,934 7,061 13,995 15,054 15,987
Non-Interest Income 5,921 3,182 3,142 6,324 3,086 3,330 6,416 6,862 7,168
Fees & Commissions 2,723 1,458 1,468 2,926 1,478 1,525 3,003 3,173 3,341
Financial Markets 1,070 547 470 1,017 425 530 955 1,119 1,170
Life and Funds 1,788 999 1,003 2,002 1,134 1,159 2,293 2,318 2,396
Other Revenue 340 178 201 379 49 116 165 251 261
Total Operating Income 18,833 9,859 9,961 19,820 10,020 10,391 20,411 21,916 23,155
Total Operating Costs 7,710 4,065 4,181 8,246 4,254 4,356 8,610 8,949 9,269
Employee Costs 4,287 2,344 2,294 4,638 2,368 2,415 4,783 4,977 5,178
Other Costs 3,423 1,721 1,887 3,608 1,886 1,940 3,826 3,972 4,092
Pre-Provision Operating Profit 11,123 5,794 5,780 11,574 5,766 6,035 11,801 12,967 13,885
Impairment Charge 847 341 309 650 341 385 726 910 963
Pre-Tax Profit 10,276 5,453 5,471 10,924 5,425 5,650 11,075 12,058 12,922
Tax Expense 3,103 1,643 1,587 3,230 1,613 1,682 3,295 3,589 3,848
Minority Shareholders -76 -38 -28 -65 -33 -33 -66 -66 -66
Other Post Tax Items 282 151 -82 69 170 0 170 0 0
Stated Net Profit 6,815 3,622 3,939 7,560 3,609 3,935 7,544 8,403 9,008
Extraordinary & Other Items 260 121 -106 15 133 0 133 0 0
Hybrid Distributions 42 13 -6 7 37 0 37 0 0
Derivatives & Hedging Revaluation -20 17 29 46 -1 0 -1 0 0
Macquarie Cash Profit 7,097 3,773 3,856 7,628 3,778 3,935 7,713 8,403 9,008
BALANCE SHEET & CAP AD (AUDm)
Risk Weighted Assets* 307,372 322,498 331,387 331,387 346,823 359,513 359,513 418,913 439,927
Interest Earning Assets 599,846 635,657 659,003 647,330 678,568 705,526 692,047 736,254 777,986
Gross Loans, Advances & Acceptances 539,806 568,057 583,516 583,516 608,264 632,429 632,429 669,209 706,434
Total Deposits & Other Borrowings 577,945 597,823 623,931 623,931 646,799 672,495 672,495 711,605 751,188
Total Assets 696,296 729,072 770,842 770,842 795,961 821,048 821,048 858,687 897,151
Shareholders Equity 47,481 48,031 49,337 49,337 50,317 52,781 52,781 57,538 61,062
Tier 1 Capital* 32,738 33,304 34,997 34,997 35,742 39,289 39,289 44,074 47,625
Tier 1 Ratio (%)* 10.7% 10.3% 10.6% 10.6% 10.3% 10.9% 10.9% 10.5% 10.8%
Core Tier 1 Ratio (%) -Basel 2.5 na na na na na na na na na
Core Tier 1 Ratio (%) -Basel 3 9.10% 8.82% 8.97% 8.97% 8.76% 9.44% 9.44% 9.24% 9.61%
ASSET QUALITY
Impairment Charge / GLAA (bp) 16 12 11 13 11 12 11 14 14
Coverage (%) 101% 121% 136% 136% 149% 144% 144% 139% 136%
KEY RATIOS & GROWTH
Net Interest Income growth (%) 2.8% 3.2% 2.1% 4.5% 1.7% 1.8% 3.7% 7.6% 6.2%
Non-Interest Income growth (%) 7.4% 5.7% -1.3% 6.8% -1.8% 7.9% 1.4% 7.0% 4.5%
Total Revenue growth (%) 4.2% 4.0% 1.0% 5.2% 0.6% 3.7% 3.0% 7.4% 5.7%
Cost growth (%) 4.5% 4.0% 2.9% 7.0% 1.7% 2.4% 4.4% 3.9% 3.6%
Pre-Provision Profit growth (%) 4.0% 4.1% -0.2% 4.1% -0.2% 4.7% 2.0% 9.9% 7.1%
RWA growth (%) 3.2% 4.9% 2.8% 7.8% 4.7% 3.7% 8.5% 16.5% 5.0%
GLAA growth (%) 4.2% 5.2% 2.7% 8.1% 4.2% 4.0% 8.4% 5.8% 5.6%
Deposit growth (%) 7.5% 3.0% 5.4% 8.6% 1.3% 4.0% 5.3% 5.8% 5.6%
Net Interest Margin (%) 2.15% 2.10% 2.07% 2.08% 2.04% 2.00% 2.02% 2.04% 2.05%
Cost / Income Ratio (%) 40.9% 41.2% 42.0% 41.6% 42.5% 41.9% 42.2% 40.8% 40.0%
*B2.5 2012, B3 2013 onward
1.90%
1.95%
2.00%
2.05%
2.10%
2.15%
2.20%
0.0%
1.0%
2.0%
3.0%
4.0%
5.0%
6.0%
7.0%
8.0%
9.0%
2013 1H14 2H14 2014 1H15 2H15 2015 2016
Margins & VolumesNet Interest Margin (RHS) GLAA Growth (LHS)
0.0%
1.0%
2.0%
3.0%
4.0%
5.0%
6.0%
7.0%
8.0%
40.0%
40.5%
41.0%
41.5%
42.0%
42.5%
43.0%
2013 1H14 2H14 2014 1H15 2H15 2015 2016
Efficiency
Cost to Income % (RHS) Cost Growth (LHS)
0
5
10
15
20
25
30
0%
20%
40%
60%
80%
100%
120%
140%
160%
2013 1H14 2H14 2014 1H15 2H15 2015 2016
Asset Quality
Impairment Charge (RHS) Coverage (LHS)
5.647.56
22.64
0.57
0.0
5.0
10.0
15.0
20.0
25.0
Total Stage 1 Dividends
Total Fade Period Dividends
Total Perpetuity Dividends
Total Surplus Capital Per Share
DDM Valuation
Macquarie Wealth Management Australian banks
3 September 2015 12
Important disclosures:
Recommendation definitions
Macquarie - Australia/New Zealand Outperform – return >3% in excess of benchmark return Neutral – return within 3% of benchmark return Underperform – return >3% below benchmark return Benchmark return is determined by long term nominal GDP growth plus 12 month forward market dividend yield
Macquarie – Asia/Europe Outperform – expected return >+10% Neutral – expected return from -10% to +10% Underperform – expected return <-10%
Macquarie First South - South Africa Outperform – expected return >+10% Neutral – expected return from -10% to +10% Underperform – expected return <-10%
Macquarie - Canada
Outperform – return >5% in excess of benchmark return Neutral – return within 5% of benchmark return Underperform – return >5% below benchmark return
Macquarie - USA Outperform (Buy) – return >5% in excess of Russell 3000 index return Neutral (Hold) – return within 5% of Russell 3000 index return Underperform (Sell)– return >5% below Russell 3000 index return
Volatility index definition*
This is calculated from the volatility of historical price movements. Very high–highest risk – Stock should be
expected to move up or down 60–100% in a year – investors should be aware this stock is highly speculative. High – stock should be expected to move up or down at least 40–60% in a year – investors should be aware this stock could be speculative. Medium – stock should be expected to move up or down at least 30–40% in a year. Low–medium – stock should be expected to move up or down at least 25–30% in a year. Low – stock should be expected to move up or down at least 15–25% in a year. * Applicable to Asia/Australian/NZ/Canada stocks only
Recommendations – 12 months Note: Quant recommendations may differ from Fundamental Analyst recommendations
Financial definitions
All "Adjusted" data items have had the following adjustments made: Added back: goodwill amortisation, provision for catastrophe reserves, IFRS derivatives & hedging, IFRS impairments & IFRS interest expense Excluded: non recurring items, asset revals, property revals, appraisal value uplift, preference dividends & minority interests EPS = adjusted net profit / efpowa* ROA = adjusted ebit / average total assets ROA Banks/Insurance = adjusted net profit /average total assets ROE = adjusted net profit / average shareholders funds Gross cashflow = adjusted net profit + depreciation *equivalent fully paid ordinary weighted average number of shares All Reported numbers for Australian/NZ listed stocks are modelled under IFRS (International Financial Reporting Standards).
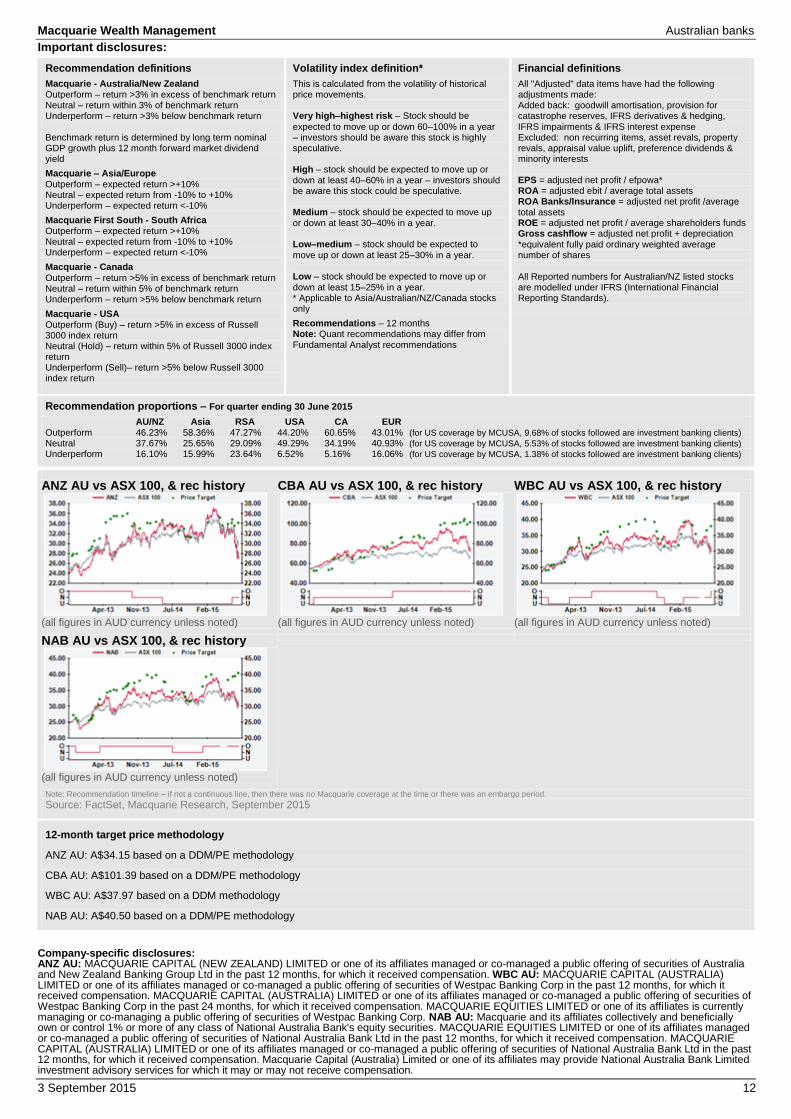
Recommendation proportions – For quarter ending 30 June 2015
AU/NZ Asia RSA USA CA EUR Outperform 46.23% 58.36% 47.27% 44.20% 60.65% 43.01% (for US coverage by MCUSA, 9.68% of stocks followed are investment banking clients)
Neutral 37.67% 25.65% 29.09% 49.29% 34.19% 40.93% (for US coverage by MCUSA, 5.53% of stocks followed are investment banking clients)
Underperform 16.10% 15.99% 23.64% 6.52% 5.16% 16.06% (for US coverage by MCUSA, 1.38% of stocks followed are investment banking clients)
ANZ AU vs ASX 100, & rec history
(all figures in AUD currency unless noted)
CBA AU vs ASX 100, & rec history
(all figures in AUD currency unless noted)
WBC AU vs ASX 100, & rec history
(all figures in AUD currency unless noted)
NAB AU vs ASX 100, & rec history
(all figures in AUD currency unless noted)
Note: Recommendation timeline – if not a continuous line, then there was no Macquarie coverage at the time or there was an embargo period.
Source: FactSet, Macquarie Research, September 2015
12-month target price methodology
ANZ AU: A$34.15 based on a DDM/PE methodology
CBA AU: A$101.39 based on a DDM/PE methodology
WBC AU: A$37.97 based on a DDM methodology
NAB AU: A$40.50 based on a DDM/PE methodology
Company-specific disclosures: ANZ AU: MACQUARIE CAPITAL (NEW ZEALAND) LIMITED or one of its affiliates managed or co-managed a public offering of securities of Australia and New Zealand Banking Group Ltd in the past 12 months, for which it received compensation. WBC AU: MACQUARIE CAPITAL (AUSTRALIA) LIMITED or one of its affiliates managed or co-managed a public offering of securities of Westpac Banking Corp in the past 12 months, for which it received compensation. MACQUARIE CAPITAL (AUSTRALIA) LIMITED or one of its affiliates managed or co-managed a public offering of securities of Westpac Banking Corp in the past 24 months, for which it received compensation. MACQUARIE EQUITIES LIMITED or one of its affiliates is currently managing or co-managing a public offering of securities of Westpac Banking Corp. NAB AU: Macquarie and its affiliates collectively and beneficially own or control 1% or more of any class of National Australia Bank's equity securities. MACQUARIE EQUITIES LIMITED or one of its affiliates managed or co-managed a public offering of securities of National Australia Bank Ltd in the past 12 months, for which it received compensation. MACQUARIE CAPITAL (AUSTRALIA) LIMITED or one of its affiliates managed or co-managed a public offering of securities of National Australia Bank Ltd in the past 12 months, for which it received compensation. Macquarie Capital (Australia) Limited or one of its affiliates may provide National Australia Bank Limited investment advisory services for which it may or may not receive compensation.
Macquarie Wealth Management Australian banks
3 September 2015 13
Important disclosure information regarding the subject companies covered in this report is available at www.macquarie.com/disclosures.
Target price risk disclosures: ANZ AU: Any inability to compete successfully in their markets may harm the business. This could be a result of many factors which may include geographic mix and introduction of improved products or service offerings by competitors. The results of operations may be materially affected by global economic conditions generally, including conditions in financial markets. The company is exposed to market risks, such as changes in interest rates, foreign exchange rates and input prices. From time to time, the company will enter into transactions, including transactions in derivative instruments, to manage certain of these exposures. CBA AU: Any inability to compete successfully in their markets may harm the business. This could be a result of many factors which may include geographic mix and introduction of improved products or service offerings by competitors. The results of operations may be materially affected by global economic conditions generally, including conditions in financial markets. The company is exposed to market risks, such as changes in interest rates, foreign exchange rates and input prices. From time to time, the company will enter into transactions, including transactions in derivative instruments, to manage certain of these exposures. WBC AU: Any inability to compete successfully in their markets may harm the business. This could be a result of many factors which may include geographic mix and introduction of improved products or service offerings by competitors. The results of operations may be materially affected by global economic conditions generally, including conditions in financial markets. The company is exposed to market risks, such as changes in interest rates, foreign exchange rates and input prices. From time to time, the company will enter into transactions, including transactions in derivative instruments, to manage certain of these exposures. NAB AU: Any inability to compete successfully in their markets may harm the business. This could be a result of many factors which may include geographic mix and introduction of improved products or service offerings by competitors. The results of operations may be materially affected by global economic conditions generally, including conditions in financial markets. The company is exposed to market risks, such as changes in interest rates, foreign exchange rates and input prices. From time to time, the company will enter into transactions, including transactions in derivative instruments, to manage certain of these exposures.
Analyst certification: The views expressed in this research reflect the personal views of the analyst(s) about the subject securities or issuers and no part of the compensation of the analyst(s) was, is, or will be directly or indirectly related to the inclusion of specific recommendations or views in this research. The analyst principally responsible for the preparation of this research receives compensation based on overall revenues of Macquarie Group Ltd (ABN 94 122 169 279, AFSL No. 318062) (“MGL”) and its related entities (the “Macquarie Group”) and has taken reasonable care to achieve and maintain independence and objectivity in making any recommendations. General disclosure: This research has been issued by Macquarie Securities (Australia) Limited (ABN 58 002 832 126, AFSL No. 238947) a Participant of the Australian Securities Exchange (ASX) and Chi-X Australia Pty Limited. This research is distributed in Australia by Macquarie Equities Limited (ABN 41 002 574 923, AFSL No. 237504) ("MEL"), a Participant of the ASX, and in New Zealand by Macquarie Equities New Zealand Limited (“MENZ”) an NZX Firm. Macquarie Private Wealth’s services in New Zealand are provided by MENZ. Macquarie Bank Limited (ABN 46 008 583 542, AFSL No. 237502) (“MBL”) is a company incorporated in Australia and authorised under the Banking Act 1959 (Australia) to conduct banking business in Australia. None of MBL, MGL or MENZ is registered as a bank in New Zealand by the Reserve Bank of New Zealand under the Reserve Bank of New Zealand Act 1989. Any MGL subsidiary noted in this research, apart from MBL, is not an authorised deposit-taking institution for the purposes of the Banking Act 1959 (Australia) and that subsidiary’s obligations do not represent deposits or other liabilities of MBL. MBL does not guarantee or otherwise provide assurance in respect of the obligations of that subsidiary, unless noted otherwise. This research is general advice and does not take account of your objectives, financial situation or needs. Before acting on this general advice, you should consider the appropriateness of the advice having regard to your situation. We recommend you obtain financial, legal and taxation advice before making any financial investment decision. This research has been prepared for the use of the clients of the Macquarie Group and must not be copied, either in whole or in part, or distributed to any other person. If you are not the intended recipient, you must not use or disclose this research in any way. If you received it in error, please tell us immediately by return e-mail and delete the document. We do not guarantee the integrity of any e-mails or attached files and are not responsible for any changes made to them by any other person. Nothing in this research shall be construed as a solicitation to buy or sell any security or product, or to engage in or refrain from engaging in any transaction. This research is based on information obtained from sources believed to be reliable, but the Macquarie Group does not make any representation or warranty that it is accurate, complete or up to date. We accept no obligation to correct or update the information or opinions in it. Opinions expressed are subject to change without notice. The Macquarie Group accepts no liability whatsoever for any direct, indirect, consequential or other loss arising from any use of this research and/or further communication in relation to this research. The Macquarie Group produces a variety of research products, recommendations contained in one type of research product may differ from recommendations contained in other types of research. The Macquarie Group has established and implemented a conflicts policy at group level, which may be revised and updated from time to time, pursuant to regulatory requirements; which sets out how we must seek to identify and manage all material conflicts of interest. The Macquarie Group, its officers and employees may have conflicting roles in the financial products referred to in this research and, as such, may effect transactions which are not consistent with the recommendations (if any) in this research. The Macquarie Group may receive fees, brokerage or commissions for acting in those capacities and the reader should assume that this is the case. The Macquarie Group‘s employees or officers may provide oral or written opinions to its clients which are contrary to the opinions expressed in this research. Important disclosure information regarding the subject companies covered in this report is available at www.macquarie.com/disclosures.