4q 2017 earnings call l 23 jan 2018 - digi.com...
TRANSCRIPT

1
Digi.Com Berhad (425190-X)
4Q 2017 Earnings Call l 23 Jan 2018

2
Key Highlights
Operational & Performance Review
2018 Outlook
Q&A

3
FY 2017 SOLID FOUNDATIONS IN 2017 to enable future growth opportunities
Key Highlights
GROWTH
EFFICIENCY
DIGITAL TRANSFORMATION
+16.5% Internet Revenue
(+571K Internet Subscribers)
+0.7pp EBITDA 1 margin
to 46%
RM748m Capex
(12.6% of service revenue)
40% call reduction to
Contact Center (vs 2015 baseline)
+12.1% Postpaid Revenue
-2.8% Opex 1
(-RM57m)
100% MSA adoption
Digital solutions
iFleet|Vcash| CS Chatbot
2.5 million MyDigi users
(63.1m upsell transaction)
1 Exclude settlement costs and exit fee of RM6 million

4
4Q 2017 STRONGER SEQUENTIAL PERFORMANCE supported by robust internet growth and monetisation
Key Highlights
FINANCIAL HIGHLIGHTS
+2.5% Q-Q Service Revenue
+4.1% Q-Q Postpaid Revenue
+0.6% Q-Q EBITDA 1
to RM731m
+1.5% Q-Q Prepaid Revenue
OPERATIONAL HIGHLIGHTS
4G Plus Network 87% 4G-LTE 55% LTE-A
72.7% Smartphone Users
+121K Internet Subscribers
to 8.7m
6,187K 4G Subscribers
1 Exclude settlement costs and exit fee of RM6 million

5
4Q 2017 NETWORK OPTIMISATION AND NATIONWIDE 4G UPGRADES to deliver consistent internet experience
Key Highlights
4,100 sites with LTE upgrades
in 4Q 2017
MASSIVE 4G UPGRADES
>91% of the time on 4G for subs with LTE enabled devices
E2E NETWORK OPTIMIZATION SERVING A HIGHLY ACTIVE INTERNET SUBSCRIBER BASE
CONSISTENT INTERNET EXPERIENCE
Consistent LTE speed ~10Mbps, 80%
of the time
16.2% Q-Q AND 149.8% Y-Y DATA TRAFFIC GROWTH
HIGHER DATA TRAFFIC
43% 48%
53% 58%
63%
30%
40%
50%
60%
70%
80%
90%
300
20,300
40,300
60,300
80,300
100,300
120,300
140,300
160,300
180,300
200,300
4Q16 1Q17 2Q17 3Q17 4Q17
TB % LTE traffic

6
4Q 2017 ROBUST GROWTH ON INTERNET REVENUE on the back of increasing active internet subscribers and usage
Key Highlights
74% 4G subscribers among
smartphone users
2.5 million Monthly active MyDigi users
GROWING 4G SUBSCRIBERS
616 621 637 690
747
65% 68% 69%
71% 73%
50%
55%
60%
65%
70%
75%
80%
85%
90%
300
350
400
450
500
550
600
650
700
750
800
4Q16 1Q17 2Q17 3Q17 4Q17
Internet Rev SmartPh %
8.3% Q-Q AND 21.3% Y-Y INTERNET REVENUE GROWTH
STRONGER MONETISATION HIGHLY ENGAGED USERS
HIGHER AVERAGE DATA PER USER (GB)
73.7% of 11.7 million subscribers
INCREASING ACTIVE INTERNET USERS
3.0 3.7 5.0 6.0 6.8 -
1.0
2.0
3.0
4.0
5.0
6.0
7.0
8.0
4Q16 1Q17 2Q17 3Q17 4Q17
20.7 million Upsell transactions
in 4Q17

7
4Q 2017 DRIVING STRONGER INTERNET SUBSCRIPTIONS across prepaid and postpaid
Operational Review
Prepaid • Streamlined prepaid internet portfolio with stronger
monetisation and recurring internet revenue - Super Tererrr RM38 or RM58 Internet + Call
monthly plans - BiGBonus Internet plans and one time internet
passes for daily, weekly and monthly • Higher prepaid internet subscriptions
Postpaid • Solid demand for innovative Digi Family Postpaid and
Infinite plans value propositions • Continued acquisition momentum with sharper internet
focus and easy 4G entry plans • Leveraged on higher demand for new device launches for
postpaid device bundles re-contracting and acquisitions Others • Tactical online campaigns to capitalize on 11.11 and 12.12
Cybersales and exclusive deals

8
• Sequential service revenue climbed 2.5% while Y-Y decline narrowed to 2.7%
- Solid postpaid revenue growth coupled with stronger sequential prepaid revenue
- Robust internet revenue growth of 8.3% Q-Q and 21.3% Y-Y to RM747 million
• Active internet subscribers climbed to 8.7 million or
73.7% while smartphone users surged to 72.7% - 4G subscribers rose another 453K to 6.2 million - Increasing active subscriber base and seasonally
higher usage led to stronger ARPU of RM43 and stronger Q-Q service revenue
• FY2017 service revenue summed up to RM5.91 billion, a
decline of 5.0% mainly due to - Lower revenues from prepaid legacy services
while strategically gained momentum on stronger internet revenue growth and improved margins
• Internet revenue for year surged 16.5% to RM2.70 billion or 45.6% of service revenue
12,299 11,776 12,030 11,852 11,747
8,088 8,056 8,311 8,538 8,659
4Q16 1Q17 2Q17 3Q17 4Q17
1,555 1,472 1,453 1,476 1,513
Subscribers (‘000)
Service revenue (RM m)
42 40 41 41 43 ARPU (RM)
Internet
Non-Internet
4Q 2017 2.5% HIGHER Q-Q SERVICE REVENUE backed by continued postpaid growth and stronger prepaid revenue
Performance Review
BLENDED

9
• Stronger network capabilities now enhanced with LTE 900Mhz continued to fuel solid postpaid acquisitions, internet usage and subscriptions
• Net adds of 85K to almost 2.5 million postpaid subscribers - Postpaid internet subscribers surged 4.6% Q-Q and
23.4% Y-Y to 2.2 million or 90.6%
• Postpaid revenue rose 4.1% Q-Q and 13.5% Y-Y to a record high of RM580 million with continued solid demand for Digi’s affordable internet plans
- Postpaid internet revenue increased 7.1% Q-Q and 29.7% Y-Y to RM349 million
• Postpaid ARPU stood resilient at RM78 over a larger
postpaid subscriber base with continued solid demand for Digi’s postpaid plans
• Solid postpaid revenue growth of 12.1% in FY2017 to RM2.19 billion with overall postpaid internet revenue increased 31.0% to 57.6% of postpaid revenue
2,099 2,189 2,292 2,395 2,480
1,821 1,923 2,038 2,149 2,248
4Q16 1Q17 2Q17 3Q17 4Q17
511 520 536 557 580
81 79 78 77 78
Subscribers (‘000)
Service revenue (RM m)
ARPU (RM)
Internet
Non-Internet
4Q 2017 SOLID POSTPAID GROWTH Q-Q AND Y-Y led by stronger postpaid subscribers
Performance Review
POSTPAID

10
• Stronger demand for Digi’s prepaid internet passes among the growing active prepaid internet subscribers of 6.4 million or 69.2%
- Prepaid internet revenue surged 9.3% Q-Q and 14.7% Y-Y growth to RM398 million or 42.7% of prepaid revenue
• Consequentially, prepaid revenue rose 1.5% Q-Q despite
continued moderation of legacy prepaid voice, IDD and messaging revenue Q-Q and Y-Y
• Prepaid ARPU improved RM34 mainly boosted by seasonally higher demand as well as stronger internet monetization from higher active subscriber base, albeit overall contraction of prepaid subscribers
• FY2017 prepaid revenue trimmed 12.9% to RM3.72 billion mainly due to significant decline in prepaid legacy revenues but compensated with 6.1% stronger prepaid internet revenue and improved prepaid profitability
10,200 9,587 9,738 9,457 9,267
6,267 6,133 6,273 6,389 6,411
4Q16 1Q17 2Q17 3Q17 4Q17
1,044 952 917 919 933
34 32 32 32
34
Subscribers (‘000)
Service revenue (RM m)
ARPU (RM)
Internet
Non-Internet
4Q 2017 1.5% Q-Q PREPAID REVENUE GROWTH anchored on solid prepaid internet revenue growth
Performance Review
PREPAID

11
33.2% 33.3% 31.7% 33.3% 33.0% 33.3% 33.6% 31.9% 33.5% 33.3%
412 373 375 352 415
519 494 464 494 5041
931 867 839 846 9191
4Q16 1Q17 2Q17 3Q17 4Q17
• Cost of goods sold (COGS) increased 17.9% Q-Q mainly due to higher year end device bundled sales as well as higher demand for new device launches
• On the back of stronger sequential service revenue and well-managed COGS, gross profit improved 1.0% Q-Q to RM1.23 billion
• COGS for the year improved 7.7% mainly due to - 18.9% lower traffic costs from reduction in volumes
and costs from legacy prepaid services
• Opex1 to service revenue improved slightly to 33.3% for the quarter
• FY2017 Opex1 improved 2.8% or RM57 million, reflecting solid cost management and operational efficiency in delivering robust 4G Plus network expansion and supporting aggressive data traffic growth
2 Net opex = Opex + Forex/FV changes + Other income
Net opex2
Opex
Performance Review
Total cost (RM m) Opex COGS
TOTAL COST (RM m)
OPEX - % OF SERVICE REVENUE
10.0% 9.9% 10.2% 8.9% 8.8% 3.6% 4.1% 4.3% 4.4% 3.9% 8.0% 8.6% 8.8% 9.1% 9.1%
7.1% 6.6% 4.1% 6.8% 6.7% 4.6% 4.4% 4.5% 4.3% 4.8%
4Q16 1Q17 2Q17 3Q17 4Q17
Others
USO
O&M
Staff
S.Mktg
4Q 2017 CONTINUED EFFICIENT COST MANAGEMENT with 2.9% Y-Y OPEX1 reduction
1 Exclude settlement costs and exit fee of RM6 million

12
741 711 717 727 7311
44% 45% 46% 46% 44%
0%20%40%60%80%100%
-
200
400
600
800
4Q16 1Q17 2Q17 3Q17 4Q17
• EBITDA strengthened 0.6% Q-Q to RM731 million with margin of 44%, supported by stronger service revenue and efficient cost management
• FY2017 EBITDA margin strengthened to 46% margin while absolute EBITDA remained resilient at RM2.89 billion
• Profit before tax declined 6.1% Q-Q to RM480 million and profit after tax fell 6.5% Q-Q to RM360 million despite sequentially stronger EBITDA mainly due to
– Higher Q-Q finance cost from FV loss on IRS of RM12 million (3Q17: FV gain of RM14 million)
– One off restructuring cost of RM6 million
• PAT for the year leveled to RM1.48 billion after accounting for RM135 million higher depreciation cost from robust network and digital capabilities investments in addition to spectrum assets
375 373 359 385 360
22% 24% 23% 25% 22%
-10%10%30%50%70%90%
- 100 200 300 400 500
4Q16 1Q17 2Q17 3Q17 4Q17
Performance Review 4Q 2017 STEADY Q-Q EBITDA WITH HEALTHY MARGIN on the back of higher demand for device bundles
EBITDA AND MARGIN (RM m and %)
PAT AND MARGIN (RM m and %)
1 Exclude settlement costs and exit fee of RM6 million

13
240 197
229
152 170
15% 13% 16% 10% 11%
0%
10%
20%
30%
- 50
100 150 200 250 300
4Q16 1Q17 2Q17 3Q17 4Q17
• Ops cashflow1 remained healthy at RM561m or 34% margin, as a flow through from resilient EBITDA and supported by acceleration of network deployment in 1H 2017
• FY2017 Ops cashflow1 sustained at RM2.14 billion or 34% margin (FY2016: RM2.18 billion or 34% margin)
• Digi invested RM170 million Capex in the final quarter of the year, as planned, with full year cumulative Capex at RM748 million or 12.6% of service revenue
• 4G LTE and LTE-A network coverage reached 87% and 55% of population backed by robust Fiber network nationwide
– Continued deployment of LTE 900Mhz sites to strengthen indoor 4G network
– Delivered capabilities to support growing data demand and Y-Y data traffic growth of 146%.
• Expansion of Fiber network to 8,000KM from 7,600KM, a
year ago
501 514 488 575 5611
30% 33% 31% 37% 34%
0%
10%
20%
30%
40%
50%
(100)
100
300
500
700
4Q16 1Q17 2Q17 3Q17 4Q17
Performance Review 4Q 2017 HEALTHY OPS CASH FLOW backed by efficient capex management
OPS CASH FLOW AND MARGIN (RM m and %)
CAPEX (EX-SPECTRUM) AND MARGIN (RM m and % of service revenue)
1 Exclude settlement costs and exit fee of RM6 million
14
4.8 4.7 4.6 4.9 4.6
4.8 4.8 4.6 5.0 4.6
100% 98% 100% 99% 99%
0%
20%
40%
60%
80%
100%
120%
-
5.0
10.0
4Q16 1Q17 2Q17 3Q17 4Q17DPS EPS
4Q16 1Q17 2Q17 3Q17 4Q17 Total Assets 5,498 5,729 5,996 5,869 5,834
Total Equity 519 519 513 540 519
Interest-bearing debts 2,282 2,558 1,810 1,802 1,313
Islamic debts 0 0 899 899 1,391
Cash & cash equivalents 377 479 628 661 575
Payout Ratio
Performance Review
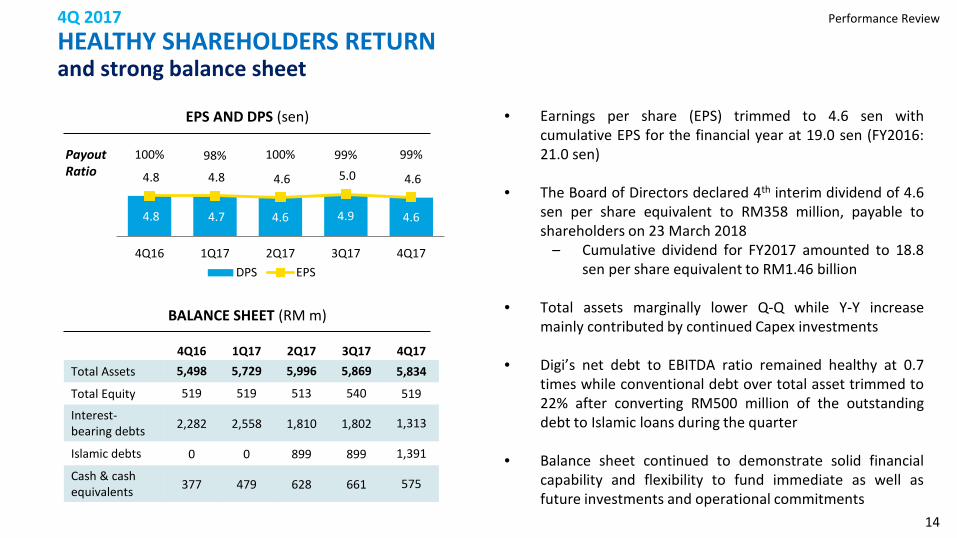
• Earnings per share (EPS) trimmed to 4.6 sen with cumulative EPS for the financial year at 19.0 sen (FY2016: 21.0 sen)
• The Board of Directors declared 4th interim dividend of 4.6 sen per share equivalent to RM358 million, payable to shareholders on 23 March 2018
– Cumulative dividend for FY2017 amounted to 18.8 sen per share equivalent to RM1.46 billion
• Total assets marginally lower Q-Q while Y-Y increase
mainly contributed by continued Capex investments
• Digi’s net debt to EBITDA ratio remained healthy at 0.7 times while conventional debt over total asset trimmed to 22% after converting RM500 million of the outstanding debt to Islamic loans during the quarter
• Balance sheet continued to demonstrate solid financial capability and flexibility to fund immediate as well as future investments and operational commitments
4Q 2017 HEALTHY SHAREHOLDERS RETURN and strong balance sheet
EPS AND DPS (sen)
BALANCE SHEET (RM m)

15
Other Updates 4Q 2017 SOLID DEBT PROFILE with conventional debt trimmed 22% of total assets
DEBT RATIOS
Conventional 48%
Islamic 52%
DEBT1 PROFILE (RM m)
1 Exclude finance lease
41% 44% 30% 30%
22%
0.6 0.7 0.7 0.7 0.7
0%
5%
10%
15%
20%
25%
30%
35%
40%
45%
50%
(0.9)
(0.7)
(0.5)
(0.3)
(0.1)
0.1
0.3
0.5
0.7
4Q16 1Q17 2Q17 3Q17 4Q17
4Q16 and 1Q17 Drawdown of existing loan facility for 900Mhz and 1800Mhz spectrum fees 2Q17 Establishment of RM5 billion Islamic bond facilities (Sukuk) to enhance funding flexibility to support the business and growth opportunities (Issued: RM900 million; Available Funds: RM4.1 billion) 4Q17 Conversion of RM500 million of existing conventional debt to Islamic facilities
Net debt/ EBITDA (x) Conventional debt1/ Total Assets
16
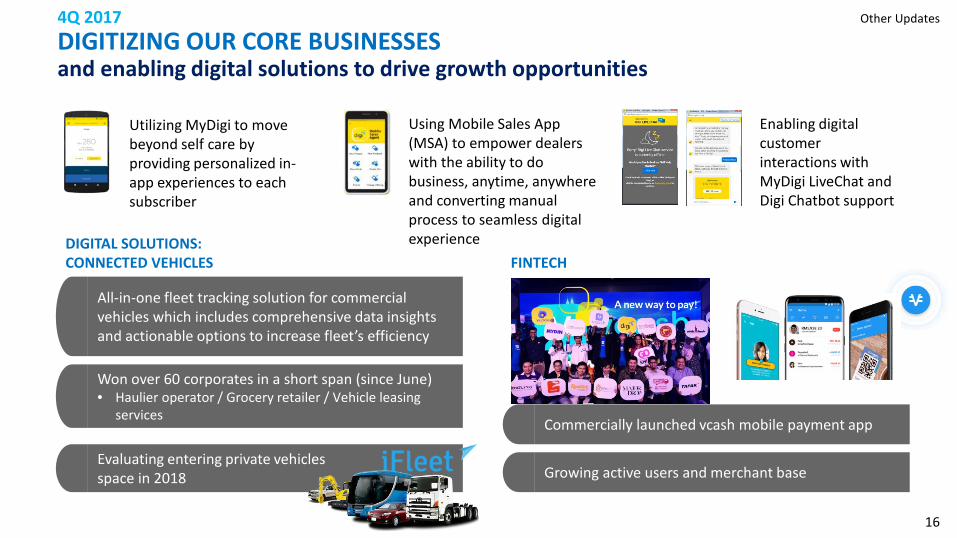
Other Updates 4Q 2017 DIGITIZING OUR CORE BUSINESSES and enabling digital solutions to drive growth opportunities
Won over 60 corporates in a short span (since June) • Haulier operator / Grocery retailer / Vehicle leasing
services
Evaluating entering private vehicles space in 2018 Growing active users and merchant base
Commercially launched vcash mobile payment app
All-in-one fleet tracking solution for commercial vehicles which includes comprehensive data insights and actionable options to increase fleet’s efficiency
Enabling digital customer interactions with MyDigi LiveChat and Digi Chatbot support
Using Mobile Sales App (MSA) to empower dealers with the ability to do business, anytime, anywhere and converting manual process to seamless digital experience
Utilizing MyDigi to move beyond self care by providing personalized in-app experiences to each subscriber
DIGITAL SOLUTIONS: CONNECTED VEHICLES FINTECH

17
Other Updates 4Q 2017 UPDATES ON MFRS 15 AND NEW MTR application from 1 Jan 2018 onwards
CHANGES TO MOBILE TERMINATION RATES (MTR)
Sen 2017 (current)
2018 2019 2020
Local 3.65 2.92 1.96 0.99
National 3.88 2.92 1.96 0.99
Sub-marine
15.73 2.92 1.96 0.99
• Effective 1 Jan 2018
• Comparisons for 2017 will not be restated and all communication relating to the development will be based on old accounting principles
• Financial statements for 2018 will be based on both old and new accounting principles
• On 20 Dec 2017, MCMC issued Determination 1, 2017 of Mandatory Standard on Access Pricing
• New MTR effective from 1 Jan 2018 onwards
• Application of single rate across local/national/submarine termination traffic
MFRS 15: REVENUE FROM CONTRACTS WITH CUSTOMERS
…Sale of device bundles with discounts will affect the timing of revenue recognition, depending on the amount of discount, length of contract and whether the deferred payment is seen as an instalment plan or not …Capitalisation of subscribers’ acquisition cost (commission)

18
2017 Actual vs Guidance
2017 Guidance FY2017
Service revenue growth
Low - mid single digit decline
-5.0%
EBITDA margin Around 2016 level (45%)
46%
Capex to service revenue ratio
11% - 13% 12.6%
4Q 2017 DELIVERED 2017 GUIDANCE with improved EBITDA margin and strong foundations into 2018
• Strategic shift and transition away from legacy IDD services to more sustainable internet revenue usage and monetisation
• Solid postpaid and internet revenue growth of 12.1% and 16.5%, respectively
• Gross profit stood relatively resilient at RM4.83 billion, at a lower decline of 2.6% compared to service revenue development
• 2.8% Opex improvement alongside with stronger EBITDA margin at 46%
• Capex to service revenue at 12.6% as planned and guided

19
2018 Outlook & Priorities 4Q 2017 SHARPER FOCUS INTO 2018 anchored on connecting our customers to what matters most
Position Digi as an exemplary corporate citizen Continue strengthening integrity,
governance and compliance Proactively influence business
environment to secure positive outcomes
Reduce inequalities through our presence and services
Focus on cash flow improvement and drive lowest production cost Open, agile and intelligent network
and IT ecosystems New network and IT operating models
focused on common/shared platforms Improve spectrum utilization and cost
efficiency
Build future-ready talents and culture that inspires Everyday Innovation Attract, engage and retain Digital
Front-Runners Accelerate existing platforms to
inspire, equip and enable Digizens to embrace Innovation360 culture
Deliver profitable growth Defend core telco revenue streams Digitize the core Grow new digital
businesses and revenue streams

20
2018 Outlook & Priorities 4Q 2017
DELIVERING SUSTAINABLE GROWTH OPPORTUNITIES with efficient operations and digital transformation
2018 Guidance1
Service revenue growth
Flat - low single digit decline
EBITDA Around 2017 level
Capex to service revenue ratio
10% - 12%
Key Growth Focus
Accelerate Consumer Postpaid and Enterprise revenue growth
1
Grow Malaysian subscriber base across Prepaid and Postpaid
2
Grow data adoption and usage among Migrant segment
3
Monetize data and grow Mobile Internet revenue
4
2018 PRIORITIES & GUIDANCE
• Drive sustainable growth from core telco revenue streams and performance resilience
• Continue to deliver on cost agenda with sustainable and efficient cost structure
• Continue the transformation journey to digitize core business
• Build and grow new digital revenue stream
1 FY 2018 Guidance based on old accounting principles

21
Q&A
22
Disclaimer
This presentation and the following discussion may contain forward looking statements by Digi.Com Berhad (Digi) related to financial trends for future periods. Some of the statements contained in this presentation or arising from this discussion which are not of historical facts are statements of future expectations with respect to financial conditions, results of operations and businesses, and related plans and objectives. Such forward looking statements are based on Digi’s current views and assumptions including, but not limited to, prevailing economic and market conditions and currently available information. These statements involve known and unknown risks and uncertainties that could cause actual results, performance or achievements to differ materially from those in the forward looking statements. Such statements are not and, should not be construed, as a representation as to future performance or achievements of Digi. In particular, such statements should not be regarded as a forecast or projection of future performance of Digi. It should be noted that the actual performance or achievements of Digi may vary significantly from such statements.


24
Appendix

25
NO. OF DEVICES SOLD
4Q 2017
21.3% Y-Y INTERNET REVENUE GROWTH backed by stronger active internet users and monetisation
73
108
150
120
157
4Q16 1Q17 2Q17 3Q17 4Q17
65.8% 68.4% 69.1% 72.0% 73.7%
64.7% 68.0% 68.6% 71.1% 71.7%
Appendix
616 621 637 690 747
100 94 91 88
86 38 36 36
36 39 754 751 764
814 872
4Q16 1Q17 2Q17 3Q17 4Q17
Data Rev (RM m) VAS Messaging Internet
% of internet subscribers % smartphone subscribers
DATA REVENUE AND PENETRATION
26
4Q 2017
REPORTED KEY PERFORMANCE INDICATORS
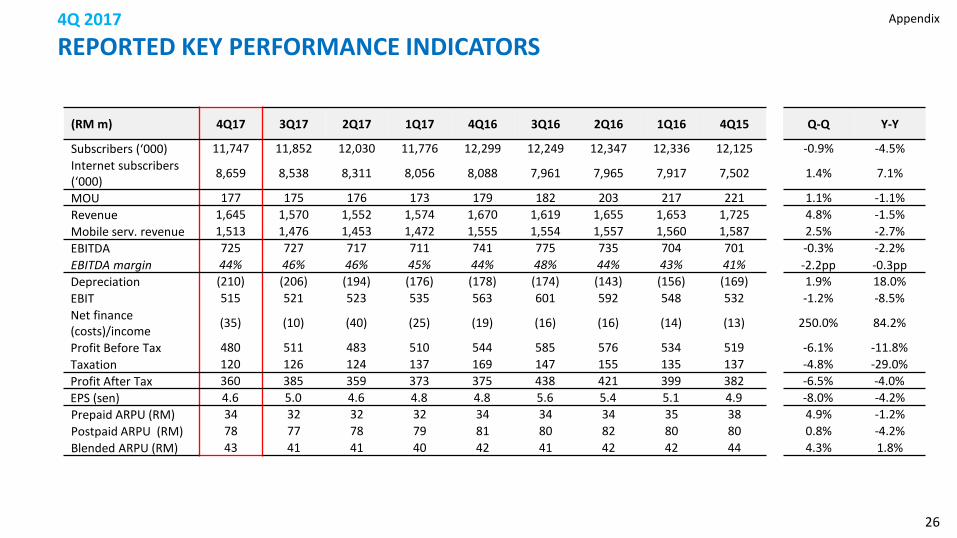
(RM m) 4Q17 3Q17 2Q17 1Q17 4Q16 3Q16 2Q16 1Q16 4Q15 Q-Q Y-Y
Subscribers (‘000) 11,747 11,852 12,030 11,776 12,299 12,249 12,347 12,336 12,125 -0.9% -4.5% Internet subscribers (‘000) 8,659 8,538 8,311 8,056 8,088 7,961 7,965 7,917 7,502 1.4% 7.1%
MOU 177 175 176 173 179 182 203 217 221 1.1% -1.1% Revenue 1,645 1,570 1,552 1,574 1,670 1,619 1,655 1,653 1,725 4.8% -1.5% Mobile serv. revenue 1,513 1,476 1,453 1,472 1,555 1,554 1,557 1,560 1,587 2.5% -2.7% EBITDA 725 727 717 711 741 775 735 704 701 -0.3% -2.2% EBITDA margin 44% 46% 46% 45% 44% 48% 44% 43% 41% -2.2pp -0.3pp Depreciation (210) (206) (194) (176) (178) (174) (143) (156) (169) 1.9% 18.0% EBIT 515 521 523 535 563 601 592 548 532 -1.2% -8.5% Net finance (costs)/income (35) (10) (40) (25) (19) (16) (16) (14) (13) 250.0% 84.2%
Profit Before Tax 480 511 483 510 544 585 576 534 519 -6.1% -11.8% Taxation 120 126 124 137 169 147 155 135 137 -4.8% -29.0% Profit After Tax 360 385 359 373 375 438 421 399 382 -6.5% -4.0% EPS (sen) 4.6 5.0 4.6 4.8 4.8 5.6 5.4 5.1 4.9 -8.0% -4.2% Prepaid ARPU (RM) 34 32 32 32 34 34 34 35 38 4.9% -1.2% Postpaid ARPU (RM) 78 77 78 79 81 80 82 80 80 0.8% -4.2% Blended ARPU (RM) 43 41 41 40 42 41 42 42 44 4.3% 1.8%
Appendix

27
4Q 2017
REVENUE COMPOSITION
(RM m) 4Q17 3Q17 2Q17 1Q17 4Q16 3Q16 2Q16 1Q16 4Q15 Q-Q Y-Y
REVENUE 1,645 1,570 1,552 1,574 1,670 1,619 1,655 1,653 1,725 4.8% -1.5%
Mobile serv. revenue 1,513 1,476 1,453 1,472 1,555 1,554 1,557 1,560 1,587 2.5% -2.7%
Voice revenue 641 662 689 721 801 819 849 866 891 -3.2% -20.0%
Data revenue 872 814 764 751 754 735 708 694 696 7.1% 15.6%
Internet 747 690 637 621 616 597 562 539 535 8.3% 21.3%
Messaging 86 88 91 94 100 104 110 117 119 -2.3% -14.0%
VAS 39 36 36 36 38 34 36 38 42 8.3% 2.6% Device and other revenue 132 94 99 102 115 65 98 93 138 40.4% 14.8%
Prepaid Revenue 933 919 917 952 1,044 1,065 1,065 1,096 1,137 1.6% -10.6%
Voice revenue 464 485 511 541 613 631 655 680 708 -4.3% -24.3%
Data revenue 470 434 406 411 431 434 410 416 429 8.3% 9.0%
Postpaid Revenue 580 557 536 520 511 489 492 464 450 4.1% 13.5%
Voice revenue 177 177 178 180 188 188 194 186 183 0.0% -5.9%
Data revenue 403 380 358 340 323 301 298 278 267 6.1% 24.8%
Appendix

28
4Q 2017
COGS AND OPEX
(RM m) 4Q17 3Q17 2Q17 1Q17 4Q16 3Q16 2Q16 1Q16 4Q15 Q-Q Y-Y
COGS 415 352 375 373 412 345 403 481 537 17.9% 0.7%
Cost of materials 155 100 120 116 113 72 91 103 156 55.0% 37.2%
Traffic charges 260 252 255 257 299 273 312 378 381 3.2% -13.0%
OPEX 504 494 464 494 519 503 509 482 490 2.0% -2.9%
Sales & marketing 133 131 149 145 156 137 134 144 157 1.5% -14.7%
Staff costs 58 65 63 61 56 64 72 64 63 -10.8% 3.6%
Operations & maintenance 138 134 128 127 125 122 124 96 96 3.0% 10.4%
Other expenses 175 164 124 161 182 180 179 178 174 6.7% -3.8%
USP fund and license fees 102 101 59 97 111 120 116 116 112 1.0% -8.1%
Credit loss allowances 16 10 9 10 12 12 13 14 14 60.0% 33.3%
Others 57 53 56 54 59 48 50 48 48 7.5% -3.4%
TOTAL 919 846 839 867 931 848 912 963 1,027 8.6% -1.3%
Appendix

29
(RM m) 4Q17 3Q17 2Q17 1Q17 4Q16 3Q16 2Q16 1Q16 4Q15 Q-Q Y-Y
Cash at start 661 628 479 377 331 366 503 234 306 5.3% 99.7%
Cash flow from operations 522 625 664 518 524 738 728 546 535
Changes in working capital (67) 514 (73) (127) (634) (190) (103) (77) 72
Cash flow used in investing activities (163) (743) (224) (190) (232) (199) (162) (168) (280)
Cash flow used in financing activities (378) (363) (218) (98) 387 (384) (599) (31) (396)
Net change in cash (86) 33 149 103 45 (35) (136) 270 (69)
Effect of exchange rate changes on cash and cash equivalents
- - - (1) 1 0 (1) (1) (3)
Cash at end 575 661 628 479 377 331 366 503 234 -13.0% 52.5%
Capex (ex-spectrum) 170 152 229 197 240 202 167 171 288 11.8% -29.2% Ops cash flow (EBITDA – Capex) 561 575 488 514 501 573 568 533 413 -1.9% 12.6%
Ops cash flow margin 34% 37% 31% 33% 30% 35% 34% 32% 24% -2.5pp 4.1pp
4Q 2017
CASH FLOW STATEMENT Appendix

30
4Q 2017
EBITDA RECONCILIATION
(RM m) 1Q17 2Q17 3Q17 4Q17 FY2016 FY2017
EBITDA (Local definition) 711 717 727 725 2,955 2,880
Exclude:
Forex (gain)/loss 2 0 2 0 7 4
Settlement costs and exit fee 0 0 0 6 0 6
EBITDA (Telenor definition) 713 717 729 731 2,962 2,890
Appendix