coomet.em-s8 (469/ru-a/09) international …€¦ · international supplementary comparison of...
TRANSCRIPT
COOMET.EM-S8 (469/RU-a/09)
INTERNATIONAL SUPPLEMENTARY COMPARISON OF INDUCTANCE STANDARDS AT FREQUENCIES UP TO 10 MHz
Eduard Abrosimov
Federal state unitary enterprise «Siberian State Scientific Research Institute of Metrology» FSUE “SNIIM”, Russia, Novosibirsk, [email protected]
This report contains: a list of the Participants (NMI) and their contact details; information about organization of the comparison – scheme of the implementation, description of the comparison principle and travelling standards; description of the measuring methods and information about uncertainty budgets of all participants; measurement results, algorithm and results of data processing.
1. Introduction This international comparison of inductance standards is carried out with purpose to determine
equivalence of the results of measurement of the standards on equipment of the Participants and to confirm of the uncertainties of the measurement results declared by NMIs in the CMC database on the BIPM website.
2
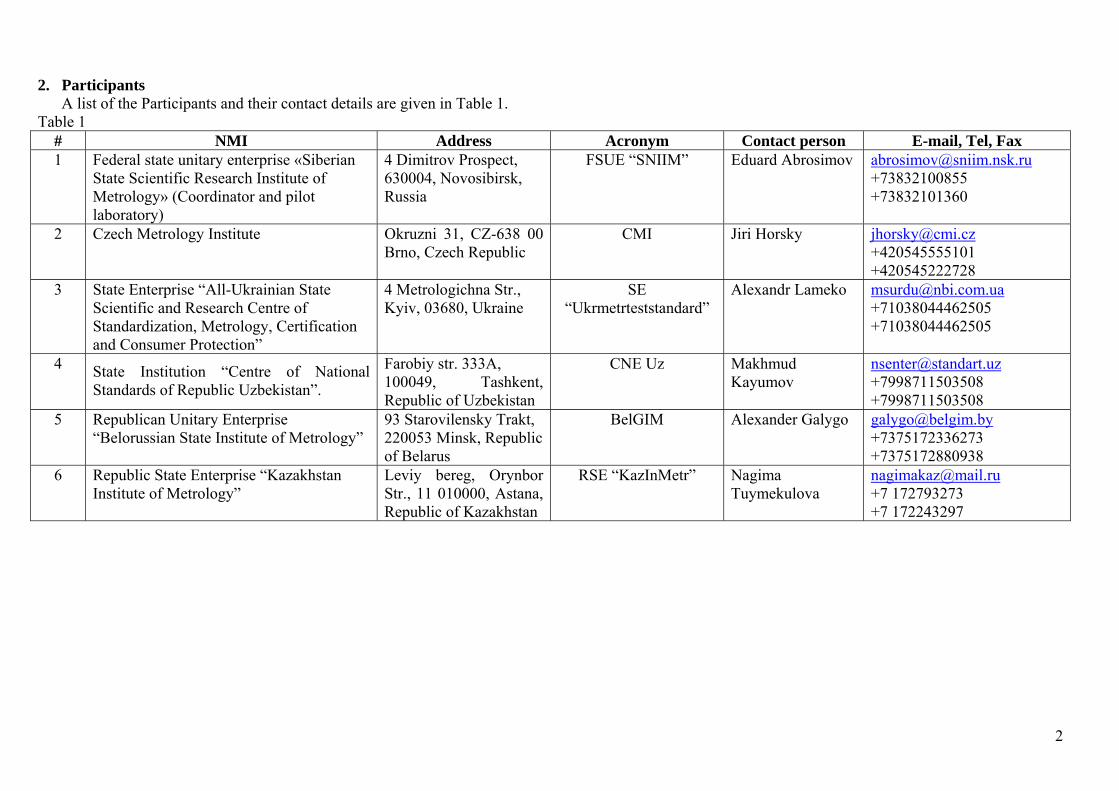
2. Participants A list of the Participants and their contact details are given in Table 1.
Table 1 # NMI Address Acronym Contact person E-mail, Tel, Fax 1 Federal state unitary enterprise «Siberian
State Scientific Research Institute of Metrology» (Coordinator and pilot laboratory)
4 Dimitrov Prospect, 630004, Novosibirsk, Russia
FSUE “SNIIM” Eduard Abrosimov [email protected] +73832100855 +73832101360
2 Czech Metrology Institute Okruzni 31, CZ-638 00 Brno, Czech Republic
CMI Jiri Horsky [email protected] +420545555101 +420545222728
3 State Enterprise “All-Ukrainian State Scientific and Research Centre of Standardization, Metrology, Certification and Consumer Protection”
4 Metrologichna Str., Kyiv, 03680, Ukraine
SE “Ukrmetrteststandard”
Alexandr Lameko [email protected] +71038044462505 +71038044462505
4 State Institution “Centre of National Standards of Republic Uzbekistan”.
Farobiy str. 333A, 100049, Tashkent, Republic of Uzbekistan
CNE Uz Makhmud Kayumov
[email protected] +7998711503508 +7998711503508
5 Republican Unitary Enterprise “Belorussian State Institute of Metrology”
93 Starovilensky Trakt, 220053 Minsk, Republic of Belarus
BelGIM Alexander Galygo [email protected] +7375172336273 +7375172880938
6 Republic State Enterprise “Kazakhstan Institute of Metrology”
Leviy bereg, Orynbor Str., 11 010000, Astana, Republic of Kazakhstan
RSE “KazInMetr” Nagima Tuymekulova
[email protected] +7 172793273 +7 172243297

3
3. Organization of the comparison 3.1 Circulation scheme
The circulation scheme of this comparison was a star type.
3.2 Description of the principle of the comparison 3.2.1 The principle of the comparison consists in measurement of inductance of the traveling
standards (hereinafter referred to as “standards”) on the highest accuracy equipment of all NMIs participating in the comparison. In case of need, the matching of connecting devices of the standards and equipment of the participants is provided by the corresponding adapters. The Note: Standards and necessary adapters are provided by the Pilot laboratory (FSUE”SNIIM”, Russia).
3.2.2 Because the equipment of the Participants has two different types of connecting devices, two sets of the standards with identical metrological characteristics participated in the comparison. The Sets are calibrated at the FSUE “SNIIM” according to the GOST 8.029-80 with the Primary state special standard of unit of electric capacity (GET 107-77).
One set (E1-15 type) includes standards with the bipolar coaxial system of connection accepted by FSUE “SNIIM”. The E1-15 set of standards jointly with the special adapter developed by FSUE “SNIIM” is used in the comparison with the CMI and the SE “Ukrmetrteststandard”, and also in the comparison with the CNE Uz which has the equipment with the adapter for connection of E1-15.
Other set (L-0170-2 type) includes standards with bipolar pin connector system of connection which is also accepted by the FSUE “SNIIM” and confirmed with connection system of the equipment of the BELGIM and the RSE “KazInMetr”. This circumstance provides possibility of carrying out comparison without use of adapters. As a result, there is increase of accuracy and reliability of outcomes of the comparison.
3.3 The dates of measurements of standards by the Participants of the Comparison The dates of measurements are given in Table 2.
Table 2 Type of standard Participant, country Dates of measurements
E1-15
FSUE “SNIIM”, Russia CMI, Czech Republic SE “Ukrmetrteststandard”, Ukraine CNE Uz, Republic of Uzbekistan
July ÷ August 2008 September 2008 ÷ April 2009 June ÷ September 2009 February ÷ May 2010
L-0170-2
FSUE “SNIIM”, Russia BelGIM, Republic of Belarus RSE “KazInMetr”, Republic of Kazakhstan
April 2011 July 2011 October 2011
3.4 Standards 3.4.1 The main information about standards is given in Table 3. The standards E1-15 are shown in
Figure 1. The standards L-0170-2 are shown in Figure 2.

4
Table 3 Type Serial number Dimension, mm Weight, Kg
Diameter Height
E1-15
210 81 155 0,94 213 81 155 0,94 216 81 155 0,94 219 81 155 0,94
L-0170-2
7701-E 81 141 0,62 7704-E 81 141 0,62 7707-E 81 141 0,62 7710-E 81 141 0,62
Fig. 1. Pictorial view of the standards E1-15.

5
Fig. 2. Pictorial view of the standards L-0170-2.
3.4.2 Description of packing of the standards Transport packaging standards is a wooden box. Mechanical and climatic protection of contents is provided by a filling of the box and the cover a
shock-absorbing material.
3.4.3 Accessories necessary for operation of the standards For operation of the E1-15 standards it is necessary: 1)Adapter which provides harmonization between coaxial connecting devices of the standards and
equipments of the Participants (consisting of four bipolar BNC connectors). 2) Shielding device and shorting plug of the adapter, which provide initial settings of the equipment
of the Participants and the adapter. 3) Facilities for connection of the standards - contacts, screw nuts and so forth. For operation of the L-0170-2 standards it is necessary facilities for connection: contacts, ring
plates and so forth. Note: The facilities necessary for operation of standards are located in the transport box together
with the standards. The packing list and characteristics of packing items are given in Table 4.
Table 4 Type of
standards Packing list Characteristics of packing items
Dimension, mm Weight, Kg length width height
E1-15 Standard 210 482 262 225 9,7

6
213 216 219 Adapter; Shielding device of the adapter; shorting plug of the adapter; Facilities for connection of the standards; Technical documentation
L-0170-2
Standard 7701-E 7704-E 7707-E 7710-E Facilities for connection of the standards; Technical documentation
482 262 225 7,7
3.5 Unpacking of the standards 3.5.1 The unpacking of the standards should be carried out indoors at a temperature not below 20°C
and humidity no more than 80%. 3.5.2 When the standards arrive at the participating laboratory, the shipping box and its contents
should be checked for damage and missing items. 3.5.3 Operability of the standards and the adapter (for E1-15) should be checked after unpacking.
Namely, it is checked: 1) The absence of external mechanical damages. 2) The operability of the connecting devices by trial connection to measuring equipment. 3) The electrical operability by the check of absence of short circuit. 3.5.4 The pilot laboratory should be informed about any damages and defects as soon as possible by
email.
3.6 Packing of the standards 3.6.1 Operability of the standards should be checked before packing. (pp. 3.5.3; 3.5.4)) 3.6.2 The packing of standards should be carried out indoors at a temperature not below 20°C and
humidity no more than 80%. 3.6.3 The standards should be packed in original shipping box as provided by requirements to
packing of the protocol.

7
4. Measurement conditions and methods 4.1 Measurement conditions
4.1.1 The measurements should be performed under the following conditions: Temperature of the environment: 23°C ±0,5°C for E1-15,
20°C ±1°C for L-0170-2, Relative humidity, no more than: 60% for E1-15,
80% for L-0170-2. 4.1.2 Setup of the standard Before making a measurement, the standards and the adapter should be placed in ambient
temperature at least 24 hours to allow temperature stability. Contacts and current-carrying surfaces of the standards and the adapter should be cleared by the
ethyl rectified alcohol and sustained in the open air before full drying.
4.2 Data on instability of standards 4.2.1 Annual instability of standards E1-15 and L-0170-2 is 0,1% for 0,1 µH; 0,05% for 1 µH;
0,02% for 10 µH; 0,02% for 100 µH with a frequency of 1 MHz. 4.2.2 Change of value of inductance at change of temperature of air for 1°C no more than 0,004%. 4.2.3 Standards have no dependence on humidity as they are sealed. 4.2.4 The standards used in the comparison passed state quality test including stability parameters
test during transportation and then their stability was studied in FSUE “SNIIM” for more than ten years since 2000. The transfer uncertainty of the standards (due to transportation of the standards) was obtained from the results of the investigation. Standard type Nominal value, µH Transfer uncertainty ut L-0170-2 0,1 0,03% L-0170-2 1 0,015% L-0170-2 10 0,006% L-0170-2 100 0,006% E1-15 0,1 0,03% E1-15 1 0,015% E1-15 10 0,006% E1-15 100 0,006%
These values have been used for computation of combined uncertainty of the results of the comparison.
4.3 Description of the measuring methods and equipments 4.3.1 Measuring method and equipments at FSUE “SNIIM”, Russia According to GOST R 8.732-2011, inductance of the standards is measured by an indirect method
with use of:1) Reference standards of the unit of electric capacity of 1 category, which were calibrated by the
Primary special standard of unit of electric capacity (GET 107-77, FSUE “SNIIM”, Russia). 2) Reference device for measurement of components of admittance, type MCR-1372, which was
used for comparison of susceptance of measured standards of inductance and reference standards of capacity.
The MCR-1372 device includes three measuring blocks, each of which is executed as the double T-bridge.
The results of measurements on MCR-1372 device are calculated in the computer program: through the calibrated values of capacities of used reference standards; through parameters of the used measuring block of the MCR-1372 device which are determined
by its design, including the linear sizes of the block, correction coefficients, capacities of adjustable capacitors and so forth.
4.3.2 Measuring method and equipments at CMI, Czech Republic

8
The inductance of the standards was measured on the WK6530A Precision Component Analyzer (further - the Analyzer), which is calibrated in the range of frequencies up to 10 MHz with using external standards:
high frequency capacitors with calculating frequency dependence; high frequency resistors with calculating frequency dependence; high frequency inductance with calculating frequency dependence. The high frequency capacitors and inductance are calibrated on low frequency with using a
Standard Air Capacitor Set Agilent16380A, which is traceable to the Czech National Standard of unit of electric capacity (ECM 250-1/04-029 Státní etalon elektrické kapacity) according to the approved calibration procedure (CMI 611-MP-C030 Kalibrace etalonů kapacity).
The high frequency resistors are calibrated on DC with using active resistance standards, type Agilent 4230A, which is traceable to the Czech National Standard of DC Electrical resistance ( ECM 230-1/08-043 Státní etalon ss elektrického odporu na bázi KHJ) according to the approved calibration procedure (CMI 611-MP-C040 Kalibrace etalonů střídavého el. odporu).
Inductance measurements by the calibrated analyzer with four-pair system of connection are executed by means of the adapter (Table 4) according to the following procedure:
1) Initial settings of the analyzer with the connected adapter: in an idling mode – with an open coaxial connector of the adapter; in a mode of short circuit - with the short-circuited coaxial connector of the adapter. Measuring setup of the analyzer with the standard connected to the adapter. The inductance Lx of the standard is obtained from relationship:
Lx = Lxizm + ∆Lx Where:
Lxizm − Result of Measurement of standards by the analyzer; ∆Lx − error correction of the analyzer determined by the results of its calibrations.
4.3.3 Measuring method and equipments at SE “Ukrmetrteststandard”, Ukraine The inductance of the standards was measured on the autocompensation bridge MNS-1100-1
(further – the bridge) which uses internal standards with nominal values of 100 Ω and 1 Ω as basic elements of balancing of the bridge.
The subrange from 10 Ω to 100 Ω of the bridge with internal standards with nominal values of 100 Ω is calibrated in the range of frequencies up to 1 MHz using active resistance standards (type MAC-2 of 100 Ω No. 10) which is in turn calibrated with using:
a) State primary standard units of electrical resistance DETU 08-02-98 (National Scientific Centre "Institute of metrology", Ukraine)
b) frequency corrections to range of frequencies up to 100 kHz (FGUP " D.I.Mendeleyev VNIIM", Russia, Certificate No. 2202-2-4-00856).
Results of calibration of the bridge are extended to the range of its working frequencies to 10 MHz. Bridge calibration in the subranges from 0 Ω to 1 Ω and from 1 Ω to 10 Ω with an internal standard
of 1 Ω is carried out by measurement on the specified subranges of the active resistance of 10 Ω which value is measured on the calibrated subrange from 10 Ω to 100 Ω.
Inductance measurements by the calibrated bridge with four-pair system of connection are executed by means of the adapter (Table 4) according to the following procedure:
1) Initial settings of the bridge with the connected adapter: in an idling mode – with the special capacitors from completeness of the bridge connected to the
adapter; in a mode of short circuit - with the special inductances from completeness of the bridge
connected to the adapter. 2) Measuring balancing of the bridge with the standard connected to the adapter. Initial and measuring balancing of the bridge is carried out in an automatic mode. The end result of
measurement of inductance of the standard is displayed on an indicator board of the bridge.
4.3.4 Measuring method and equipments at CNE Uz, Republic of Uzbekistan

9
The inductance of the standards was measured by method of comparison occurring at different times with the National standards of inductance of the Republic of Uzbekistan by means of the comparator of inductance, type E1-12 (further – the E1-12 comparator).
The operating principle of the E1-12 comparator is based on transformation of the measured inductance to the frequency of an electric signal measured by a frequency meter.
The inductance Lx of the standard is obtained from relationship: Lx = Lst(fst/fx)
2 [1-2K(fx - fst)/fst] Where:
Lst – inductance of National standard; f st, fx – frequencies to which will be transformed inductance Lst, Lx; K – correction coefficient which reflects frequency properties of transformation system of
inductance to frequency. Values of correction coefficients for measured standards and their working frequencies are given in operational documentation on the E1-12 comparator.
The connection of the standards with bipolar coaxial system of connection to the E1-12 comparator is executed with use of the special adapter from completeness of the comparator.
4.3.5 Measuring method and equipments at BelGIM, Republic of Belarus The inductance of the standards was determined by method of direct measurements on the E7-19
immitance meter, which is calibrated with using the National standards of inductance of Republic of Belarus, which are in turn calibrated on frequencies up to 1 MHz by FGUP " D.I.Mendeleyev VNIIM" (Russia) with using State primary standard of inductance (GET 15-79).
The results of calibration of the E7-19 immitance meter are extended to the range of its working frequencies up to 10 MHz.
The inductance Lx of the standard is obtained from relationship: Lx = Lizm +∆L + ∆Lint
Where: Lizm – indication of the E7-19 immitance meter; ∆L – correction coefficient, which is determined by results of its calibration with frequencies up to
1 MHz; ∆Lint – correction coefficient of the extending of calibration results of the E7-19 immitance meter
on the range of its working frequencies up to 10 MHz. The connection of L-0170-2 standards to E7-19 immitance meter doesn’t require the use of special
adapter.
4.3.6. Measuring method and equipments at RSE “KazInMetr”, Republic of Kazakhstan The inductance of the standards was measured by method of comparison occurring at different
times with National standards of inductance of the Republic of Kazakhstan by means of the computer-aided plant of the highest accuracy for transfer of the size of the unit of inductance, type ML-4209 (further – the ML-4209 plant).
The operating principle of the ML-4209 plant is based on measurement by a frequency meter of frequencies, which correspond to inductance of compared standards, and in further computer processing of the information with display on the screen of the monitor of the result of measurement of the inductance of the standards.
The connection of L-0170-2 standards to ML-4209 plant doesn’t require the use of special adapter.

10
5. Measurement results from NMIs 5.1 Measurements results of standards
5.1.1 Measurement results of the standards (types E1-15 and L-0170-2) are given in Table5 and Table 6 respectively.
The following designations are accepted in tables: Lnom – Nominal value of inductance of standards; f – Working frequencies; Lizm – Measured value of inductance of standards; uc – Combined standard uncertainties of measurement results.
Table 5 – Measurement results of inductance of E1-15 standards Standards Participating institutes and measurement results
Lnom,
µH f,
MHz
FSUE “SNIIM” CMI SE
“Ukrmetrteststandard” CNE Uz Lizm, µH uc, % Lizm, µH uc, % Lizm, µH uc, % Lizm, µH uc, %
0,1 1 0,10046 0,076 0,10048 0,10 0,10165 0,34 0,10072 0,15 3 0,09895 0,075 0,09920 0,25 - - 0,09900 0,15 10 0,09852 0,075 0,09858 0,25 - - 0,09864 0,15
1 1 1,0024 0,050 1,0024 0,10 1,0051 0,35 1,0041 0,090 3 0,9992 0,050 0,9993 0,15 - - 0,9999 0,090 10 1,0309 0,050 1,0310 0,15 - - 1,0317 0,090
10 1 9,999 0,025 9,999 0,025 9,993 0,17 10,002 0,050 3 10,270 0,025 10,271 0,050 - - 10,278 0,050
100 1 99,92 0,015 99,95 0,025 99,82 0,17 99,93 0,030
Table 6 – Measurement results of inductance of L-0170-2 standards Standards Participating institutes and measurement results
Lnom, µH
f, MHz
FSUE “SNIIM” BelGIM RSE “KazInMetr” Lizm, µH uc, % Lizm, µH uc, % Lizm, µH uc, %
0,1 1 0,09043 0,10 - - 0,09038 0,18 3 0,08963 0,10 - - 0,08973 0,18 10 0,08970 0,10 - - 0,08954 0,18
1 1 0,9512 0,069 0,945 0,35 0,9516 0,13 3 0,9479 0,070 0,946 0,34 0,9477 0,13 10 0,9692 0,066 0,946 1,3 0,9692 0,13
10 0,1 9,812 0,035 9,62 1,1 - - 1 9,699 0,035 9,637 0,35 9,700 0,063
100 0,1 99,24 0,020 99,0 0,34 99,23 0,034 1 103,52 0,020 101,8 0,85 103,54 0,034
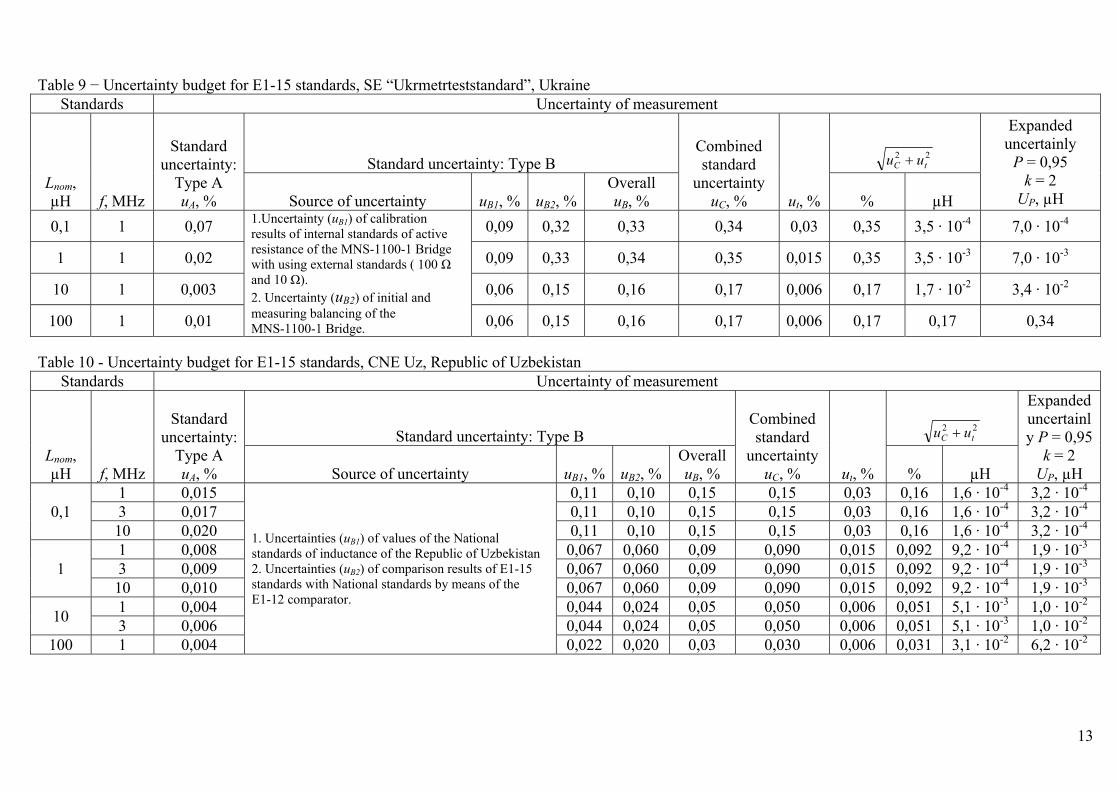
5.2 Uncertainty budgets from all comparison participants Detailed uncertainty budgets are given in Tables 7−13.

11
6. Overall results 6.1 Procedure of data evaluation
According to the Guidelines COOMET R/GM/14:2006 (Guidelines for data evaluation of COOMET key comparison), procedure of data evaluation of the measurement results includes:
1) the determination of the reference value of inductance, Lref , as weighted mean of results of measurements of all participants
N
tci
N
tciizmi
ref
u
uL
L
12
12
1
1
Where: N – a number of participants; Lizm– measured value of inductance and associated combined standard uncertainty for i-th NMI, μH.
22tcitci uuu
ciu – standard uncertainty for i-th NMI, μH
tu – transfer uncertainty, μH (see 4.2.4) 2) the determination of standard uncertainty, u(Lref), μH, of reference value of inductance, Lref , as:
N
tci
ref
u
Lu
12
1
1 =
3) the determination of the degree of equivalence di ,μH, in relative form for i-th NMI as:
refizmii LLd =
with the associated standard uncertainty idu , μH: 22)()( tcirefi uLudu
It should be mentioned that the values of Lref, u(Lref), di, idu were determined for each type of
standards (E1-15 and L-0170-2), nominal value and frequency separately.
6.2 Results of data evaluation The results of data evaluation from Tables 5 and 6 according to the accepted procedure are given in
Tables 14 and 15, respectively. Also the results are presented in Figures 3 to 21.
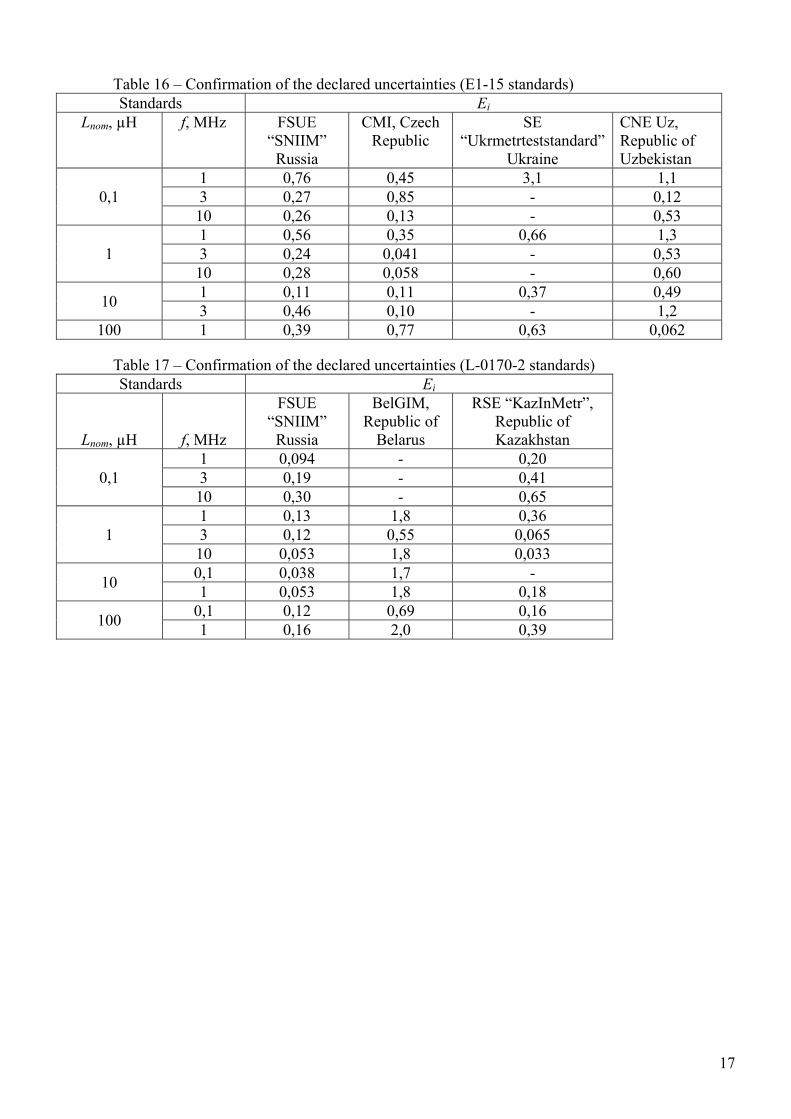
6.3 Confirmation of the declared uncertainties The declared uncertainties are judged as confirmed if the following equation is satisfied (according
to COOMET recommendation R/GM/14:2006): 2iE
The performance indicator Ei is calculated as:
)( =
i
ii du
dЕ
where the values of di and u(di), are given in Tables 14 and 15. The Ei values calculated according to Tables 14 and 15 are given in Tables 16 and 17, respectively. The information in the Tables 16 and 17 indicate that the consistence criterion isn't satisfied only
for one result of the comparison received by SE “Ukrmetrteststandard” for the E1-15 standard (Lnom=0,1µH, f = 1 MHz).
All other results of the comparison for standards of E1-15 and L-0170-2 agree well with the comparison reference value, that completely confirms the uncertainty declared by the participants in the CMC database on the BIPM website.

12
Table 7 − Uncertainty budget for E1-15 standards, FSUE “SNIIM”, Russia Standards Uncertainty of measurement
Lnom, µH
f, MHz
Standard uncertainty:
Type A uA, %
Standard uncertainty: Type B Combined standard
uncertainty uC, % ut, %
22tC uu
Expanded uncertainly
P = 0,95 k = 2
UP, µH Source of uncertainty uB1, % uB2, %OveralluB, % % µH
0,1 1 0,045 1.Uncertainty (uB1) of calibration results of
reference standards of the unit of electric capacity of 1 category with using the Primary special standard of unit of electric capacity (GET 107-77). 2. Uncertainty (uB2) of corrections on influence of parameters of the MCR-1372 device (the linear sizes, capacities of adjustable condensers and so forth). The cumulative assessment of the Uncertainty (uB2) is calculated in the computer program.
0,020 0,057 0,060 0,076 0,03 0,081 8,1 · 10-5 1,6 · 10-4 3 0,042 0,033 0,052 0,062 0,075 0,03 0,081 8,1 · 10-5 1,6 · 10-4 10 0,033 0,050 0,045 0,067 0,075 0,03 0,081 8,1 · 10-5 1,6 · 10-4
1 1 0,030 0,017 0,035 0,039 0,050 0,015 0,052 5,2 · 10-4 1,1 · 10-3 3 0,020 0,030 0,034 0,045 0,050 0,015 0,052 5,2 · 10-4 1,1 · 10-3 10 0,011 0,035 0,034 0,049 0,050 0,015 0,053 5,3 · 10-4 1,1 · 10-3
10 1 0,010 0,014 0,018 0,023 0,025 0,006 0,026 2,6 · 10-3 5,2 · 10-3 3 0,009 0,017 0,015 0,023 0,025 0,006 0,026 2,6 · 10-3 5,2 · 10-3
100 1 0,007 0,008 0,010 0,013 0,015 0,006 0,016 1,6 · 10-2 3,2 · 10-2
Table 8 − Uncertainty budget for E1-15 standards, CMI, Czech Republic Standards Uncertainty of measurement
Lnom, µH f, MHz
Standard uncertainty:
Type A uA, %
Standard uncertainty: Type B Combined standard
uncertainty uC, % ut, %
22tC uu
Expanded uncertainly
P = 0,95 k = 2
UP, µH Source of uncertainty uB1, % uB2, % uB3, % Overall uB, % % µH
0,1 1 0,02 1.Uncertainty (uB1) of
calibration results of the WK6530A Analyzer with using external standards. 2. Uncertainty (uB2) of initial and measuring settings of the WK6530A Analyzer. 3. Uncertainty (uB3) because of nonlinearity of the WK6530A Analyzer.
0,022 0,092 0,02 0,097 0,10 0,03 0,11 1,1 · 10-4 2,2 · 10-4 3 0,06 0,12 0,20 0,05 0,24 0,25 0,03 0,25 2,5 · 10-4 5,0 · 10-4 10 0,07 0,12 0,20 0,05 0,24 0,25 0,03 0,25 2,5 · 10-4 5,0 · 10-4
1 1 0,01 0,05 0,081 0,03 0,10 0,10 0,015 0,10 1,0 · 10-3 2,0 · 10-3 3 0,03 0,10 0,10 0,03 0,15 0,15 0,015 0,15 1,5 · 10-3 3,0 · 10-3 10 0,03 0,10 0,10 0,03 0,15 0,15 0,015 0,15 1,5 · 10-3 3,0 · 10-3
10 1 0,012 0,012 0,010 0,015 0,022 0,025 0,006 0,026 2,6 · 10-3 5,2 · 10-3 3 0,015 0,040 0,014 0,020 0,047 0,050 0,006 0,051 5,1 · 10-3 1,0 · 10-2
100 1 0,012 0,012 0,010 0,015 0,022 0,025 0,006 0,026 2,6 · 10-2 5,2 · 10-2
13
Table 9 − Uncertainty budget for E1-15 standards, SE “Ukrmetrteststandard”, Ukraine Standards Uncertainty of measurement
Lnom, µH f, MHz
Standard uncertainty:
Type A uA, %
Standard uncertainty: Type B Combined standard
uncertainty uC, % ut, %
22tC uu
Expanded uncertainly
P = 0,95 k = 2
UP, µH Source of uncertainty uB1, % uB2, %Overall uB, % % µH
0,1 1 0,07 1.Uncertainty (uB1) of calibration results of internal standards of active resistance of the MNS-1100-1 Bridge with using external standards ( 100 Ω and 10 Ω). 2. Uncertainty (uB2) of initial and measuring balancing of the MNS-1100-1 Bridge.
0,09 0,32 0,33 0,34 0,03 0,35 3,5 · 10-4 7,0 · 10-4
1 1 0,02 0,09 0,33 0,34 0,35 0,015 0,35 3,5 · 10-3 7,0 · 10-3
10 1 0,003 0,06 0,15 0,16 0,17 0,006 0,17 1,7 · 10-2 3,4 · 10-2
100 1 0,01 0,06 0,15 0,16 0,17 0,006 0,17 0,17 0,34
Table 10 - Uncertainty budget for E1-15 standards, CNE Uz, Republic of Uzbekistan Standards Uncertainty of measurement
Lnom, µH f, MHz
Standard uncertainty:
Type A uA, %
Standard uncertainty: Type B Combined standard
uncertainty uC, % ut, %
22tC uu
Expanded uncertainly P = 0,95
k = 2 UP, µH Source of uncertainty uB1, % uB2, %
Overall uB, % % µH
0,1 1 0,015
1. Uncertainties (uB1) of values of the National standards of inductance of the Republic of Uzbekistan 2. Uncertainties (uB2) of comparison results of E1-15 standards with National standards by means of the E1-12 comparator.
0,11 0,10 0,15 0,15 0,03 0,16 1,6 · 10-4 3,2 · 10-4 3 0,017 0,11 0,10 0,15 0,15 0,03 0,16 1,6 · 10-4 3,2 · 10-4 10 0,020 0,11 0,10 0,15 0,15 0,03 0,16 1,6 · 10-4 3,2 · 10-4
1 1 0,008 0,067 0,060 0,09 0,090 0,015 0,092 9,2 · 10-4 1,9 · 10-3 3 0,009 0,067 0,060 0,09 0,090 0,015 0,092 9,2 · 10-4 1,9 · 10-3 10 0,010 0,067 0,060 0,09 0,090 0,015 0,092 9,2 · 10-4 1,9 · 10-3
10 1 0,004 0,044 0,024 0,05 0,050 0,006 0,051 5,1 · 10-3 1,0 · 10-2 3 0,006 0,044 0,024 0,05 0,050 0,006 0,051 5,1 · 10-3 1,0 · 10-2
100 1 0,004 0,022 0,020 0,03 0,030 0,006 0,031 3,1 · 10-2 6,2 · 10-2

14
Table 11 – Uncertainty budget for L-0170-2 standards, FSUE “SNIIM”, Russia Standards Uncertainty of measurement
Lnom, µH f,
MHz
Standard uncertainty:
Type A uA, %
Standard uncertainty: Type B Combined standard
uncertainty uC, % ut, %
22tC uu
Expanded uncertainly
P = 0,95 k = 2
UP, µH Source of uncertainty uB1, % uB2, % Overall uB, % % µH
0,1 1 0,060
1.Uncertainty (uB1) of calibration results of reference standards of the unit of electric capacity of 1 category with using the Primary special standard of unit of electric capacity (GET 107-77). 2. Uncertainty (uB2) of amendments on influence of parameters of the MCR-1372 device (the linear sizes, capacities of adjustable condensers and so forth).
0,020 0,077 0,080 0,10 0,03 0,11 9,5 · 10-5 1,9 · 10-4 3 0,058 0,033 0,074 0,081 0,10 0,03 0,11 9,4 · 10-5 1,9 · 10-4 10 0,056 0,050 0,065 0,082 0,10 0,03 0,11 9,3 · 10-5 1,9 · 10-4
1 1 0,045 0,017 0,049 0,052 0,069 0,015 0,071 6,7 · 10-4 1,4 · 10-3 3 0,041 0,030 0,048 0,057 0,070 0,015 0,072 6,8 · 10-4 1,4 · 10-3 10 0,046 0,035 0,030 0,046 0,066 0,015 0,067 6,5 · 10-4 1,3 · 10-3
10 0,1 0,018 0,020 0,021 0,029 0,035 0,006 0,035 3,4 · 10-3 7,0 · 10-3 1 0,019 0,014 0,024 0,028 0,034 0,006 0,034 3,3 · 10-3 7,0 · 10-3
100 0,1 0,012 0,009 0,015 0,018 0,022 0,006 0,022 2,2 · 10-2 4,4 · 10-2 1 0,011 0,008 0,014 0,016 0,020 0,006 0,021 2,1 · 10-2 4,2 · 10-2
Table 12 – Uncertainty budget for L-0170-2 standards, BelGIM, Republic of Belarus Standards Uncertainty of measurement
Lnom, µH
f, MHz
Standard uncertainty:
Type A uA, %
Standard uncertainty: Type B Combined standard
uncertainty uC, % ut, %
22tC uu
Expanded uncertainly
P = 0,95 k = 2
UP, µH Source of uncertainty uB1, % uB2, % uB3, %OveralluB, % % µH
1
1 0,043 1. Uncertainty (uB1) of values of the National standards of inductance of Republic of Belarus on frequencies up to 1 MHz. 2. Uncertainty (uB2) of calibration results of the E7-19 immitance meter on frequencies up to 1 MHz on the National standards of inductance of Republic of Belarus. 3. Uncertainty (uB3) of a distribution of results of calibration of the E7-19 immitance meter on the range of its working frequencies up to 10 MHz.
0,15 0,32 - 0,35 0,35 0,015 0,35 3,3 · 10-3 6,6 · 10-3
3 0,043 - 0,32 0,10 0,34 0,34 0,015 0,34 3,2 · 10-3 6,4 · 10-3
10 0,043 - 0,32 1,2 1,2 1,3 0,015 1,3 1,3 · 10-2 2,6 · 10-2
10 0,1 0,035 - 0,32 1,0 1,0 1,1 0,006 1,1 0,11 0,22
1 0,12 0,10 0,31 - 0,33 0,35 0,006 0,35 3,4 · 10-2 6,8 · 10-2
100 0,1 0,082 0,10 0,31 - 0,33 0,34 0,006 0,34 0,34 0,68
1 0,080 - 0,31 0,78 0,84 0,85 0,006 0,85 0,87 1,8

15
Table 13 – Uncertainty budget for L-0170-2 standards, RSE “KazInMetr”, Republic of Kazakhstan Standards Uncertainty of measurement
Lnom, µH f,
MHz
Standard uncertainty: Type A uA,
%
Standard uncertainty: Type B Combined standard
uncertainty uC, % ut, %
22tC uu Expanded
uncertainly P = 0,95
k = 2 UP, % Source of uncertainty uB1, % uB2, %
Overall uB, % % µH
0,1 1 1·10-3
1. Uncertainties (uB1 ) of values of the National standards of inductance of the Republic of Kazakhstan. 2. Uncertainties ( uB2 ) of comparison results of L-0170-2 standards with National standards by means of the ML-4209 plant.
0,17 0,029 0,17 0,18 0,03 0,19 1,7 · 10-4 3,4 · 10-4 3 6·10-4 0,17 0,029 0,17 0,18 0,03 0,19 1,7 · 10-4 3,4 · 10-4 10 8·10-4 0,17 0,029 0,17 0,18 0,03 0,19 1,7 · 10-4 3,4 · 10-4
1 1 1·10-3 0,12 0,023 0,12 0,13 0,015 0,13 1,3 · 10-3 2,6 · 10-3 3 8·10-4 0,12 0,023 0,12 0,13 0,015 0,13 1,3 · 10-3 2,6 · 10-3 10 6·10-4 0,12 0,023 0,12 0,13 0,015 0,13 1,3 · 10-3 2,6 · 10-3
10 0,1 - - - - - - - - - 1 2·10-4 0,058 0,023 0,062 0,063 0,006 0,064 6,2 · 10-3 1,3 · 10-2
100 0,1 2·10-5 0,029 0,017 0,034 0,034 0,006 0,035 3,5 · 10-2 7,0 · 10-2 1 2,4·10-4 0,029 0,017 0,034 0,034 0,006 0,035 3,6 · 10-2 7,2 · 10-2

16
Table 14 – Results of the data evaluation for E1-15 standards Standards Results, µH
Lnom, µH f,
MHz Lref u(Lref) FSUE “SNIIM” CMI SE “Ukrmetrteststandard” CNE Uz
d ud d ud d ud d ud
0,1 1 0,100536 6,0 · 10-5 7,6 · 10-5 1,0 · 10-4 5,6 · 10-5 1,3 · 10-4 1,1 · 10-3 3,6 · 10-4 1,8 · 10-4 1,7 · 10-4 3 0,098979 7,0 · 10-5 2,9 · 10-5 1,1 · 10-4 2,2 · 10-4 2,6 · 10-4 - - 2,1 · 10-5 1,8 · 10-4 10 0,098547 7,0 · 10-5 2,7 · 10-5 1,1 · 10-4 3,3 · 10-5 2,6 · 10-4 - - 9,3 · 10-5 1,8 · 10-4
1 1 1,00277 4,1 · 10-4 3,7 · 10-4 6,6 · 10-4 3,8 · 10-4 1,1 · 10-3 2,3 · 10-3 3,6 · 10-3 1,3 · 10-3 1,0 · 10-3 3 0,99936 4,4 · 10-4 1,6 · 10-4 6,8 · 10-4 6,4 · 10-5 1,6 · 10-3 - - 5,4 · 10-4 1,1 · 10-3 10 1,03109 4,4 · 10-4 1,9 · 10-4 6,9 · 10-4 9,1 · 10-5 1,6 · 10-3 - - 6,1 · 10-4 1,1 · 10-3
10 1 9,9993 1,8 · 10-3 3,4 · 10-4 3,1 · 10-3 3,5 · 10-4 3,1 · 10-3 6,3 · 10-3 0,17 2,7 · 10-3 5,4 · 10-3 3 10,2715 2,1 · 10-3 1,5 · 10-3 3,4 · 10-3 5,4 · 10-4 5,6 · 10-3 - - 6,5 · 10-3 5,6 · 10-3
100 1 99,928 1,3 · 10-2 7,9 · 10-3 2,1 · 10-2 2,2 · 10-2 2,9 · 10-2 0,11 0,17 2,1 · 10-3 3,4 · 10-2
Table 15 – Results of the data evaluation for L-0170-2 standards Standards Results, µH
Lnom, µH f,
MHz Lref u(Lref) FSUE “SNIIM” BelGIM RSE “KazInMetr”
d ud d ud d ud
0,1 1 0,090418 8,3 · 10-5 1,2 · 10-5 1,3 · 10-4 - - 3,8 · 10-5 1,9 · 10-4 3 0,089653 8,3 · 10-5 2,3 · 10-5 1,3 · 10-4 - - 7,7 · 10-5 1,9 · 10-4 10 0,089663 8,2 · 10-5 3,7 · 10-5 1,3 · 10-4 - - 1,2 · 10-4 1,9 · 10-4
1 1 0,95109 5,9 · 10-4 1,1 · 10-4 9,0 · 10-4 6,1 · 10-3 3,4 · 10-3 5,1 · 10-4 1,5 · 10-3 3 0,94779 6,0 · 10-4 1,1 · 10-4 9,1 · 10-4 1,8 · 10-3 3,3 · 10-3 9,3 · 10-5 1,5 · 10-3 10 0,96915 5,8 · 10-4 4,6 · 10-5 8,8 · 10-4 2,4 · 10-2 1,3 · 10-2 4,6 · 10-5 1,5 · 10-3
10 0,1 9,8118 3,4 · 10-3 1,8 · 10-4 4,8 · 10-3 0,20 0,11 - - 1 9,6988 2,9 · 10-3 2,3 · 10-4 4,4 · 10-3 6,2 · 10-2 3,4 · 10-2 1,2 · 10-3 6,9 · 10-3
100 0,1 99,236 1,9 · 10-4 3,5 · 10-3 2,9 · 10-2 0,24 0,34 6,5 · 10-3 4,0 · 10-2 1 103,524 1,8 · 10-4 4,3 · 10-3 2,8 · 10-2 1,8 0,87 1,6 · 10-2 4,0 · 10-2
17
Table 16 – Confirmation of the declared uncertainties (E1-15 standards) Standards Ei
Lnom, µH f, MHz FSUE “SNIIM”
Russia
CMI, Czech Republic
SE “Ukrmetrteststandard”
Ukraine
CNE Uz, Republic of Uzbekistan
0,1 1 0,76 0,45 3,1 1,1 3 0,27 0,85 - 0,12 10 0,26 0,13 - 0,53
1 1 0,56 0,35 0,66 1,3 3 0,24 0,041 - 0,53 10 0,28 0,058 - 0,60
10 1 0,11 0,11 0,37 0,49 3 0,46 0,10 - 1,2
100 1 0,39 0,77 0,63 0,062
Table 17 – Confirmation of the declared uncertainties (L-0170-2 standards) Standards Ei
Lnom, µH f, MHz
FSUE “SNIIM”
Russia
BelGIM, Republic of
Belarus
RSE “KazInMetr”, Republic of Kazakhstan
0,1 1 0,094 - 0,20 3 0,19 - 0,41 10 0,30 - 0,65
1 1 0,13 1,8 0,36 3 0,12 0,55 0,065 10 0,053 1,8 0,033
10 0,1 0,038 1,7 - 1 0,053 1,8 0,18
100 0,1 0,12 0,69 0,16 1 0,16 2,0 0,39

18
SNIIM CMI Ukrmetrteststandard CNE Uz0,1000
0,1005
0,1010
0,1015
0,1020
0,1025
L,
H
Institution
Fig. 3. Results of the comparison for E1-15, L=0,1 μH, f=1 MHz. Horizontal line shows reference value, error bars show expanded uncertainty (k=2).
SNIIM CMI -- CNE Uz
0,0986
0,0988
0,0990
0,0992
0,0994
0,0996
0,0998
L,
H
Institution
Fig. 4. Results of the comparison for E1-15, L=0,1 μH, f=3 MHz. Horizontal line shows reference value, error bars show expanded uncertainty (k=2).

19
SNIIM CMI -- CNE Uz0,0980
0,0982
0,0984
0,0986
0,0988
0,0990
0,0992
L,
H
Institution
Fig. 5. Results of the comparison for E1-15, L=0,1 μH, f=10 MHz. Horizontal line shows reference value, error bars show expanded uncertainty (k=2).
SNIIM CMI Ukrmetrteststandard CNE Uz0,996
0,998
1,000
1,002
1,004
1,006
1,008
1,010
1,012
L,
H
Institution
Fig. 6. Results of the comparison for E1-15, L=1 μH, f=1 MHz. Horizontal line shows reference value, error bars show expanded uncertainty (k=2).

20
SNIIM CMI -- CNE Uz
0,9960
0,9968
0,9976
0,9984
0,9992
1,0000
1,0008
1,0016
1,0024
L,
H
Institution
Fig. 7. Results of the comparison for E1-15, L=1 μH, f=3 MHz. Horizontal line shows reference value, error bars show expanded uncertainty (k=2).
SNIIM CMI -- CNE Uz
1,028
1,029
1,030
1,031
1,032
1,033
1,034
L,
H
Institution
Fig. 8. Results of the comparison for E1-15, L=1 μH, f=10 MHz. Horizontal line shows reference value, error bars show expanded uncertainty (k=2).

21
SNIIM CMI Ukrmetrteststandard CNE Uz
9,96
9,97
9,98
9,99
10,00
10,01
10,02
10,03
L,
H
Institution
Fig. 9. Results of the comparison for E1-15, L=10 μH, f=1 MHz. Horizontal line shows reference value, error bars show expanded uncertainty (k=2).
SNIIM CMI -- CNE Uz
10,260
10,264
10,268
10,272
10,276
10,280
10,284
10,288
10,292
L,
H
Institution
Fig. 10. Results of the comparison for E1-15, L=10 μH, f=3 MHz. Horizontal line shows reference value, error bars show expanded uncertainty (k=2).

22
SNIIM CMI Ukrmetrteststandard CNE Uz99,4
99,5
99,6
99,7
99,8
99,9
100,0
100,1
100,2
L,
H
Institution
Fig. 11. Results of the comparison for E1-15, L=100 μH, f=1 MHz. Horizontal line shows reference value, error bars show expanded uncertainty (k=2)
SNIIM -- KazInMetr
0,0900
0,0901
0,0902
0,0903
0,0904
0,0905
0,0906
0,0907
0,0908
L,
H
Institution
Fig. 12. Results of the comparison for L-0170-2, L=0,1 μH, f=1 MHz. Horizontal line shows reference value, error bars show expanded uncertainty (k=2).
23
SNIIM -- KazInMetr0,0893
0,0894
0,0895
0,0896
0,0897
0,0898
0,0899
0,0900
0,0901
L,
H
Institution
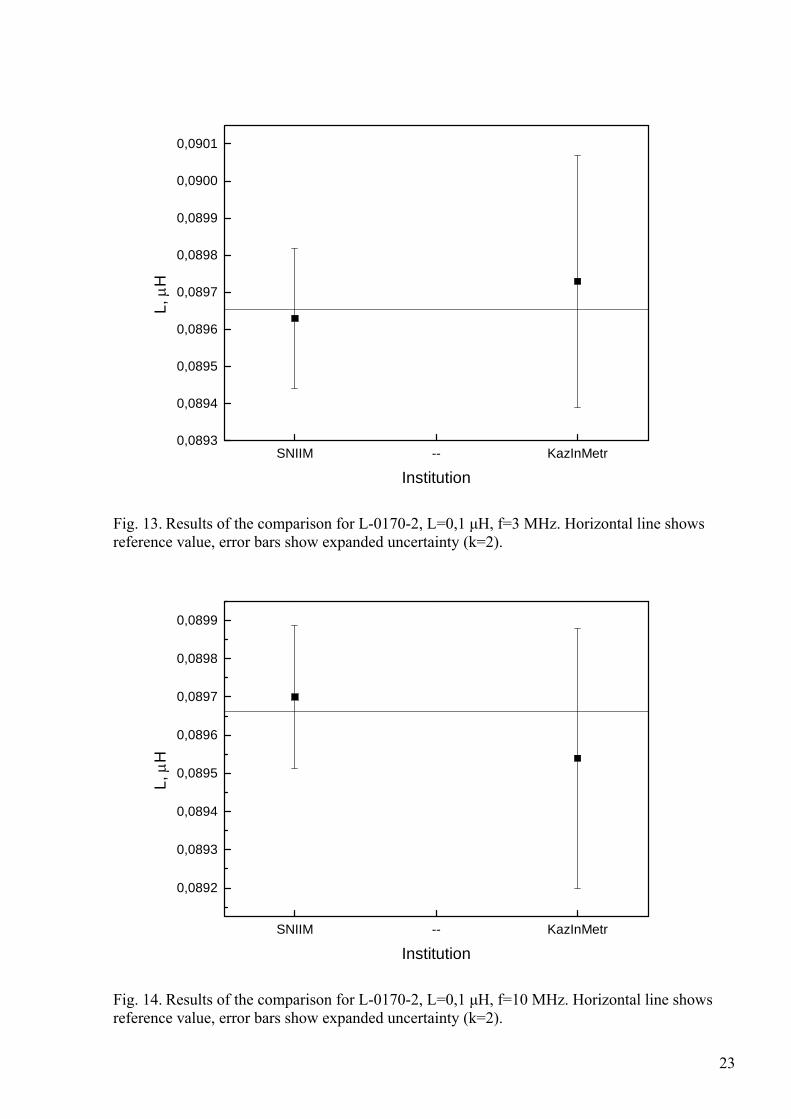
Fig. 13. Results of the comparison for L-0170-2, L=0,1 μH, f=3 MHz. Horizontal line shows reference value, error bars show expanded uncertainty (k=2).
SNIIM -- KazInMetr
0,0892
0,0893
0,0894
0,0895
0,0896
0,0897
0,0898
0,0899
L,
H
Institution
Fig. 14. Results of the comparison for L-0170-2, L=0,1 μH, f=10 MHz. Horizontal line shows reference value, error bars show expanded uncertainty (k=2).

24
SNIIM BelGIM KazInMetr0,936
0,940
0,944
0,948
0,952
0,956
L,
H
Institution
Fig. 15. Results of the comparison for L-0170-2, L=1 μH, f=1 MHz. Horizontal line shows reference value, error bars show expanded uncertainty (k=2).
SNIIM BelGIM KazInMetr0,938
0,940
0,942
0,944
0,946
0,948
0,950
0,952
0,954
L,
H
Institution
Fig. 16. Results of the comparison for L-0170-2, L=1 μH, f=3 MHz. Horizontal line shows reference value, error bars show expanded uncertainty (k=2).

25
SNIIM BelGIM KazInMetr
0,92
0,93
0,94
0,95
0,96
0,97
0,98
L,
H
Institution
Fig. 17. Results of the comparison for L-0170-2, L=1 μH, f=10 MHz. Horizontal line shows reference value, error bars show expanded uncertainty (k=2).
SNIIM BelGIM
9,4
9,5
9,6
9,7
9,8
9,9
L,
H
Institution
Fig. 18. Results of the comparison for L-0170-2, L=10 μH, f=0,1 MHz. Horizontal line shows reference value, error bars show expanded uncertainty (k=2).
26
SNIIM BelGIM KazInMetr
9,56
9,60
9,64
9,68
9,72
L,
H
Institution
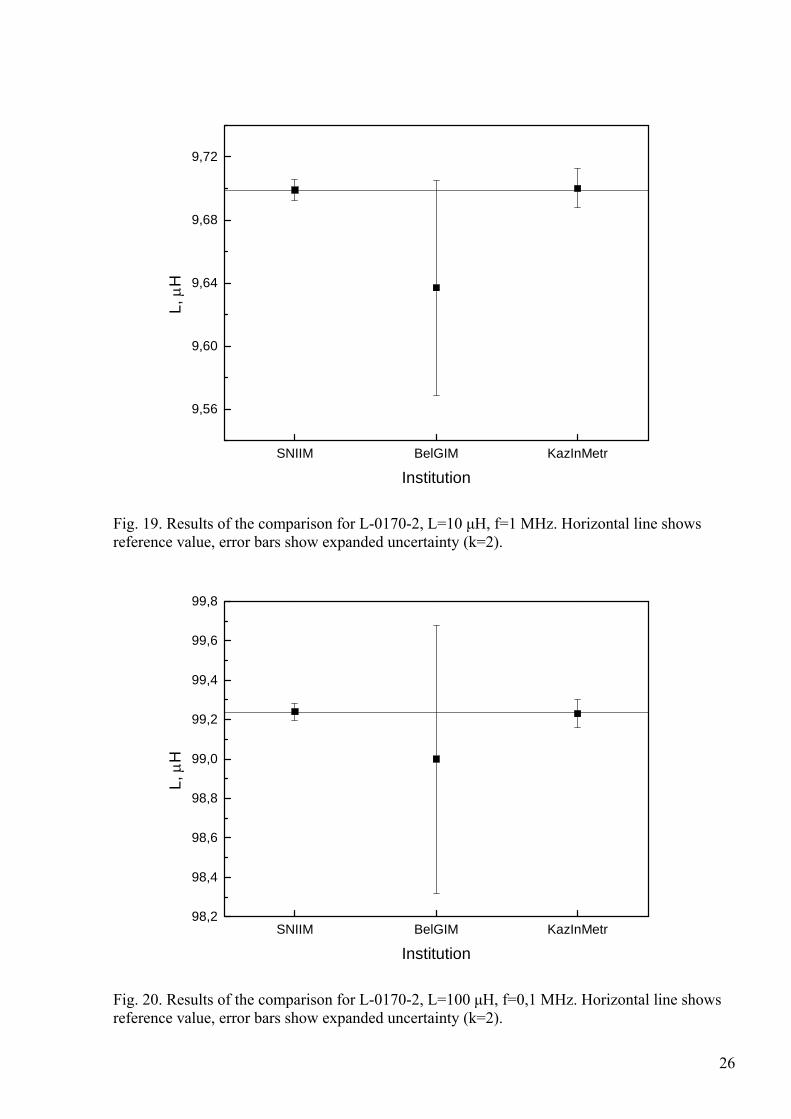
Fig. 19. Results of the comparison for L-0170-2, L=10 μH, f=1 MHz. Horizontal line shows reference value, error bars show expanded uncertainty (k=2).
SNIIM BelGIM KazInMetr98,2
98,4
98,6
98,8
99,0
99,2
99,4
99,6
99,8
L,
H
Institution
Fig. 20. Results of the comparison for L-0170-2, L=100 μH, f=0,1 MHz. Horizontal line shows reference value, error bars show expanded uncertainty (k=2).

27
SNIIM BelGIM KazInMetr
100
101
102
103
104
L,
H
Institution
Fig. 21. Results of the comparison for L-0170-2, L=100 μH, f=1 MHz. Horizontal line shows reference value, error bars show expanded uncertainty (k=2).