460 - defense technical information center · ad- a26 6 460 wl-tr-93-4013 continuous fabrication of...
TRANSCRIPT

AD- A2 6 6 460
WL-TR-93-4013
CONTINUOUS FABRICATIONOF SiC FIBER TOWS BYCHEMICAL VAPOR DEPOSITION
W.J. Lackey, J.A. Hanigofsky, G.B. Freeman,R.D. Hardin,B.N. Beckloff, D.M. Emmerich,A. Prasad, M.D. Ellenburg, J. Pugh,M.D. Langman, and J.S. Lewis
MATERIALS SCIENCE AND TECHNOLOGY LABORATORYGEORGIA TECH RESEARCH INSTITUTEATLANTA, GEORGIA 30332
JANUARY 1993
FINAL REPORT FOR SEPT. 1991 - DEC. 1992
APPROVED FOR PUBLIC RELEASE;DISTRIBUTION IS UNLIMITED
DTICS EL.ECTE
JUL 07 1993 DA
MATERIALS DIRECTORATEWRIGHT LABORATORYAIR FORCE MATERIEL COMMANDWRIGHT PATTERSON AFB, OHIO 45433-7734 93-15308-9 ? 06 038 II/lhI*|ll/

NOTICE
When Government drawings, specifications, or other data are used for any purpose otherthan in connection with a definitely Government-related procurement, the United StatesGovernment incurs no responsibility or any obligation whatsoever. The fact that thegovernment may have formulated or in any way supplied the said drawings, specifications, orother data, is not to be regarded by implication or otherwise in any manner construed, aslicensing the holder, or any other person or corporation; or as conveying any rights orpermission to manufacture, use, or sell any patented invention that may in any way be relatedthereto.
This report is releasable to the National Technical Infurmation Service (NTIS). At NTIS, itwill be available to the general public, including foreign nations.
This technical report has been reviewed and is approved for publication.
PAUIL D. JERO J~roject Engineer WALTER H. REIMANN, ChiefMaterials Development Branch Materials Development BranchMetals and Ceramics Division Metals and Ceramics Division
it IV\.NORMAN M. GEYER, Acting Deputy DirectorMetals and Ceramics Division
If your address has changed, if you wish to be removed from our mailing list, or if theaddressee is no longer employed by your organization please notify WUMLLM, WPAFB, OH45433-b331 to help us maintain a current mailing list.
Copies of this report should not be returned unless return is required by securityconsiderations, contractual obligations, or notice on a specific document.

# orm AOpprovedREPORT DOCUMENTATION PAGE MBNo OAp4rov 8
1 AGENC0 USE ONLY (L'ar+. biank) 2 REPORT DATE 3, REPORT TYPE AND DATES COVERED
I 1 January 1993 Final. 9/1/91 - 12/31/92A TITLE AND SUBTITLE 5, FUNDING NUMBERS
Continuous Fabrication of SiC Fiber Tows by Chemical PE 62102FVapor Deposition PR 2420
TA 01g6AsJTHO•ISW. J. Lackey, J. A. Hanigofsky, G. B. Freeman WU 99
R. D. Hardin, B. N. Beckloff, D. M. Emmerich, A. Prasad,M. D. Ellenburg, J. Pugh, M. D. Langman, and J. S. Lewis
7. PERFORMING ORGANIZATION NAMF(S) AND ADDRESS(ES) 8. PERFORMING ORGANIZATIONREPORT NUMBER
Materials Science and Technology LaboratoryGeorgia Tech Research Institute A-9056Georgia Institute of Technol.ogyAtlanta, Georgia 30332
9ý SPONSORING MONITORING AGENCY NAMF(W) AND ADDRESS(ES) 10. SPONSORINGMONITORING
Materials Directorate (WL/HLLM) AGENCY REPORT NUMBER
Wright LaboratoryAir Force Materiel Command WL-TR-93-4013Wright Patterson AFB, OH 45433-7734WL/MLLM Attn: Jero 513-255-9818__
11 SUPPLFMENTARY NOTES
12a. DISTRIBUTIONW'AVAILABItITY '1,ATEMENT 12b. DISTRIBUTION CODE
Approved for public release; distribution is unlimited.
13. ABSTRSLI ý'AI)n,'_-2 G0wrd 'The objective of this 15-month effort was to determine thefeasibility of preparing small diameter SiC fiber tows by chemical vapor deposition foruse as reinforcing fibers in ceramic and metal matrix composites. The proposed goal ofcodepositing SiC + Si3N4 was modified 2 months into the project in order to concentrateon fiber coating technology for SiC fiber development only. Our approach was to developspreading techniques for filaments of the substrate tow so that SiC could be rapidlydeposited without bonding the filaments together. Following some initial experiments,a statistical processing study was completed to define processing conditions where thedesired 5 pm SiC coating thickness would be achieved. Processing-property correlationswere determined using multiple regression analysis. Stress calculations were used toaide in substrate selection- -the carbon fiber which had the minimal fiber/coating stressdue to thermal expansion mismatch was determined to be the Amoco T-300, unsized anduntwisted fiber. Several fiber spreading techniques were evaluated to minimize fiberagglomeration. Cyclic tension, in conjunction with gas jets or stationary and movingrollers was determined to be ineffective for spreading the fiber tow. The mostpromising results, however, were obtained from electromagnetic spreading of the fibertow.r SUJRJ Ct 7URM'S 15. NUMBER OF PAGES
98Fibers, Silicon (Carbide. Chemical Vapor Deposition 16. PRICE CODE
F SFSCURV C'A1 ','-,(AH.T,.)I•sJ $ ,,ui T 7, r ,, ."7- SSiI CA BON ! 19 SECURITY CLASSIICATION 20, LIMITATION Of ABSTRACT
OF PtPl•(, F rjf 1
,r ~ OF ABSTRACT
Unclassified Unclassified Unclassified U1,,"i ,,, ,+ • • i +',,,dd~ •,,m •QR ' A v 91
TABLE OF CONTENTS
1. EXECUTIVE SUMMARY .................................... 1
2. INTRODUCTION ......................................... 3
3. BACKGROUND .......................................... 63-1. Fiber Coating Literature Review ........................... 63-2. SiC Materials Issues ................................... 93-3. CVD of SiC ....................................... 9
4. M ODELIN ..G ............................................. 114-1. Thermodynamic Modeling ............................... 114-2. Kinetic/Diffusion Modeling ............................... 17
a. Model Description ................................ 17b. Model Input Conditions .............................. 22c. Modeling Results ................................. 25d. Comparison of Experiment to Model ..................... 26
4-3. Stress M odeling ..................................... 30
5. PROCESSING STUDY .. .................................... 395-1. Initial Deposition .................................... 395-2. Statistical Study ..................................... 41
a. Design ........................................ 41b. Property-Processing Correlations ......................... 41
5-3. H2/MTS Ratio Study .................................. 535-4. Pressure Study ...................................... 53
6. FIBER SPREADING TECHNIQUES .............................. 576-1. Cyclic Tension ...................................... 576-2. Gas Jets and Rollers ................................... 576-3. Fiber Splitting ...................................... 586-4. Pneumatic Spreading .................................. 616-5. Electromagnetic Spreading ............................... 63
7. CONCEPT FOR SCALE-UP ................................... 67
8. CONCLUSIONS .......................................... 69
9. REFERENCES ........................................... 70
111ii

TABLE OF CONTENTS
(continued)
Appendix A - Mathematical Development of Process Model ................... 75
Appendix B - Computer Program for Process Model ........................ 88
Appendix C - Statistical Analysis ................................... 93
£OLLLiWaJ u±I X ~o~ikm A 8.MTE
Accesior. For
NTIS CnRA&;
U.:j
By.DiVt ibufo i
Dist,
iv

LIST OF FIGURES
Figure 1. Schematic of the SiC fiber tow deposited by chemical vapor deposition ona carbon fiber tow substrate .............................. 5
Figure 2. Schematic of the Georgia Tech continuous fiber coating system ........ 8Figure 3. Ternary phase diagram for tht SiCI4/MTS/NH 3 deposition system
calculated at 1600 K and 0. 1 atm. Lowering the pressure reduced the SiC+ Si 3N4 two phase region by approximately 50% ................. 15
Figure 4. Ternary phase diagram for the SiCI4/MTS/NH 3 deposition systemcalculated at 1600 K and 1 atm. A large two phase SiC + Si3N4 regionwas predicted to form .................................. 16
Figure 5. Flow plan for the analyses of the reaction/diffusion process ........... 19Figure 6. Physical and theoretical schematics of the geometry defined for the
process model. Both the porosity and the reaction site factors were usedto calculate parameters for the Thiele modulus ................... 20
Figure 7. Arrhenius plot of deposition rate versus reciprocal temperature for SiCdeposition shows an activation energy of 72 kJ/mole ............... 23
Figure 8. Arrhenius plot of experimental SiC deposition data shows an activationenergy of 120 Id/mole .................................. 24
Figure 9. Concentration ratio at the fiber tow center versus temperature at twodifferent pressures for the SiC system ........................ 27
Figure 10. Thiele modulus versus temperature at the two activation energies used tomodel SiC deposition .................................. 28
Figure 11. Ln coating thickness versus l/T for the SiC deposition study. The linearrelationship indicates an activation energy of 113 Id/mole ............ 29
Figure 12. SEM micrograph for a SiC coating which shows a coating thicknessvariation as a function of radial position ....................... 31
Figure 13. Predicted and experimental coating thickness versus radial position for SiCdeposition on carbon fibers. Both profiles decrease as they move towardthe center of the tow .................................. 33
Figure 14. Definition of orientations for stress calculations .................. 34Figure 15. Maximum magnitude of stress components as a function of coating
thickness for two carbon fibers. Tensile stress is positive; compressivestress is negative ..................................... 35
Figure 16. The maximum axial stress for the no-bending case shows that for a 5 "mthick SiC coating, an acceptable stress is predicted ................ 37
Figure 17. Maximum axial stress in the coating as a function of coating thickness forSiC coatings on Amoco T-50 carbon fiber ..................... .38
Figure 18. Schematic of the fiber spreading attachments on the continuous fibercoater. The fiber spreads due to the friction on the curved surface, anddue to the argon jet through the narrow slit ..................... 40
v

LIST OF FIGURES(continued)
Figure 19. A 3 pm SiC film was uniformly deposited at 1250°C, 0.1 atm on fibermoving at 20 cm/min .. ................. .............. 42
Figure 20. Schematic of the statistical processing design used to study SiC deposition.Statistical design of experiments is described in many texts such asNorman L. Johnson and Fred C. Leone, =Statisticq and ExperimentalDesign in Engineering and the Physical Sciences", Vol. 2, Johii Wiley &Sons, NY, 1976 ..................................... 43
Figure 21. SEM micrographs show the thick and thin coatings deposited during thestatistical processing study. For the thick coating, extensive fiberagglomeration was present .............................. 46
Figure 22. Smooth and rough surface morphology was observed for the runscompleted in the study. Smooth surfaces are desired for high strength. 47
Figure 23. Tensile strength versus coating thickness for SiC coated carbon filaments.The average and data ranges are presented on the figure ............. 48
Figure 24. Tensile strength versus deposition temperature for SiC coated carbonfibers; the average and data ranges are shown ................... 49
Figure 25. Results of statistical analysis of the weight of a 15.2 cm long coated fiber.A multiple regression model limited to linear terms for temperature, silaneflow rate, and hydrogen flow rate was used to predict the fiber weight.(a) Predicted contour lines show the strong effect of MTS flow rate andtemperature on fiber weight for a constant H2 flow rate of 2.5 I/min. (b)Plot of observed vs. predicted fiber weight shows good agreement ...... 51
Figure 26. Agglomeration contour lines as a function of the deposition temperatureand MTS flow rate for two fixed hydrogen flow rates shows the stronginfluence of MTS flow rate and temperature on agglomeration and thesmaller influence of hydrogen flow rate ....................... 52
Figure 27. A uniform 2.0 t~m thick coating was deposited using 4 I/min H2 and 5g/min MTS flow rates. Very little fiber agglomeration was observed forthese conditions . .................................... 54
Figure 28. SiC coating thickness versus pressure indicates the wide range ofdeposition over a fairly narrow processing range .................. 55
Figure 29. Schematic of the lower supply spool enclosure with both (a) metal stripand (b) cylindrical fiber tow splitters ......................... 59
Figure 30. Schematic of the pneumatic induction cylinder used to spread the fibertow ............................................ .62
Figure 31. Schematic of the electromagnetic fiber spreading technique ........... 64Figure 32. Photograph of the electromagnetic technique in operation shows a zero
node state of the fiber tow spread to 2 cm tow diameter ............. 66
vi

LIST OF TABLES
1. Enthalpy and entropy for the SiC + Si 3N4 system ........................ 122. Computer input parameters and ranges studied for the first order SiC deposition
process . .............................................. 253. Physical and mechanical properties of fibers and coatings ................... 334. Operating conditions and fiber attributes for the statistical processing study for SiC
deposition .. ........................................... 445. Processing-property correlations revealed by the statistical analysis of the box
study . ............................................... 536. Summary of fiber splitting study results .............................. 60
vii

CONTINUOUS FABRICATION OF SIC FIBER TOWS
BY CHEMICAL VAPOR DEPOSITION
1. EXECUTIVE SUMMARY
The objective of this 15 month effort was to determine the feasibility of preparing small
diameter SiC fiber tows by chemical vapor deposition (CVD) for use as reinforcing fibers in
ceramic and metal matrix composites. The proposed goal of codepositing SiC + SiNl, was
modified 2 months into the project in order to concentrate on fiber coating technology for SiC
fiber development only. Our approach was to develop spreading techniques for filaim its of the
substrate tow so that SiC could be rapidly deposited without bonding the filaments together.
Following some initial experiments, a statistical processing study was completed to define
processing conditions where the desired 5 j•m SiC coating thickness would be achieved.
Processing-property correlations were determined using multiple regression analysis. Stress
calculations were used to aide in substrate selection--the carbon fiber which had the minimal
fiber/coating stress due to thermal expansion mismatch was determined to be the Amoco T-300,
unsized and untwisted fiber.
Several fiber spreading techniques were evaluated to minimize fiber agglomeration.
Cyclic tension, in conjunction with gas jets or stationary and moving rollers, was determined
to be ineffective for spreading the fiber tow. Fiber tow splitting also did not consistently spread
the filaments apart during coating. Pneumatic spreading of the tow resulted in spread fibers with
minimal agglomeration. The most promising results, however, were obtained from

electromagnetic spreading of the fiber tow. This technique was investigated in a cold walled
system, and resulted in extensive spreading (factor of 10) of the fiber tow. Spreading at 1 atm
was also accomplished, which could lead to a more economical process due to faster coating
rates achievable at higher pressures.
Two literature publications have resulted from this work; several conference presentations
were also delivered as part of this project. Part of one doctoral thesis in Materials Engineering
and one master's thesis have resulted from this work.
2
---------

2. INTRODUCTION
Advanced ceramic fibers are needed for use as reinforcement for ceramic and metal
matrix composites. Suc, -omposite materials are receiving increased attention for both
aerospace and industrial applications. The fiber reinforcement enhances toughness, strength,
stiffness. mnd creep resistance for both ceramic and metal matrix composites. In many instances
high temperatures are involved in the fabrication process and/or the in-service environment.
Often the desired temperature exceeds the fiber capability, i.e., the fiber strength degrades
significantly in just a few hours. For example Nicalon, Tyranno, and Nextel (8-20 Mm diameter
filaments), which are three of the more popular fiber tows, degrade at temperatures above
- 1200°C. Textron and Sigma's SiC monofilament (- 100-150 14m diameter) can survive to
- 14000C and are useful in several ceramic and metal matrix composites but their large size
keeps them from being an optimal reinforcement of ceramics; the large size complicates
fabrication of thin components and the desired increase in toughness is not always achieved with
a large fiber. In some instances a large diameter fiber appears to act as a flaw of size similar
to that of the fiber. The large monofilaments are also not sufficiently flexible; weaving and the
fabrication of samples with small radii of curvature are not as easy as with small "textile grade"
fibers. Also, the economics of monofilament production are poor. The higher surface area of
a tow, compared to a monofilament, and the reduced thickness of coating which must be
deposited favor, at least for a CVD process, the production of tows. SiC has the desired
attributes o" light weight, stiffness, strength, and chemical compatibility with desired matrices
such as SiC, SiAN4, and A120 3. To our knowledge, no one, with the possible exception of a
3

small effort at SUNY-Buffalo, is pursuing small diameter SiC fiber multifilament tows via CVD
processing.
The goal of this project was to demonstrate the feasibility of fabricating strong, thermally
stable, continuous SiC fiber tows by the CVD of SiC onto commercially available carbon or
oxide fiber tows. As shown schematically in Figure 1, deposition of a coating which has a
thickness of 5 Im onto a 5 •m diameter fiber substrate yields a fiber which is 89 vol % SiC.
An existing continuous fiber coating system was used and the extensive background on fiber
coating, in general, and the CVD of SiC, in particular, provide an excellent technology base to
support the project.
4

ES=LIE2
LO =1Ln0

3. BACKGROUND
3-1. Fiber Coating Literature Review
In order for fibers to properly fulfill their role as reinforcements in ceramic and metal
matrix composites and carbon-carbon, it is often necessary to coat the fiber with some other
material. The function of the coating may be to protect the fiber during subsequent processing
or in-service use, to provide compatibility with the matrix, or to provide the desired degree of
bonding between the fiber and matrix in order to optimize toughness, strength, creep, and other
properties. Such coatings are often less than I 1m thick and are frequently about 0.1 Am thick.
By applying considerably more coating it is possible to prepare CVD monofilaments or tows
where a smaller fiber serves as the substrate.
There has been extensive prior use of CVD for coating of fibers, felt, tape, and cloth and
the process is increasingly being recognized as having commercial appeal."' Some of the
advantages of CVD are (1) high deposition rate, (2) high purity, (3) applicability to oxides,
carbides, nitrides, borides, silicides, or metals, and (4) the deposits are usually crystalline and
thermally stable. A further advantage compared to line of sight processes, is that fiber tows can
be infiltrated, i.e., each filament is uniforrnly coated. Fibers fabricated by a CVD process are
typically dense, fine grained, and possess higý, strength.
Much of the prior work has relied on batch processing but extensive progress has been
made in developing continuous fiber coating equipment and processes. Notable prior work is
that at Los Alamos National Laboratory,""' the University of Karlsruhe,"6'..1'.2.•,21 and Textron's
commercial use of a continuous CVD process to make B and SiC monofilaments.' 6.21' 31
6

Continuous fiber coating equipment and processes have been recently reviewed by Lackey
et al." The fiber may be heated by one of several means. These include (1) electrical heating
of the fiber alone by passing a current through it, (2) lasers, (3) induction, (4) microwaves, (5)
infrared lamps, and (6) the resistive hot wall method. Plasma assisted CVD is also possible but
it has the disadvantage that the deposition rates are usually low. Some of the techniques permit
operation with a cold wall which has the advantages of reducing reagent consumption and
depletion and minimizing constriction of the reaction chamber as a result of excessive coating
deposition on the walls of !he chamber. Many of these methods have the disadvantage that they
are restricted to use with fibers which are electrically conducting. The resistively heated, hot
wall system has the advantages of simplicity, reliability, and applicability to both conducting and
insulating fibers. This method avoids the need for mercury seals and contacts which have the
disadvantages of (1) possibly contaminating the coating and (2) being difficult to operate at
reduced pressure. A schematic of the Georgia Tech continuous fiber coating system is shown
in Figure 2. This hot walled system consists of a CVD furnace with two spool enclosures at the
top and bottom which allow for visual fiber monitoring during the process and also allows for
both atmospheric and vacuum processing.
An optimal continuous fiber coating system should provide control over the speed at
which the fiber is pulled through the furnace. The desired speed varies over a large range
depending primarily on the material being deposited, the length of the coating zone, and the
desired coating thickness. Literature values for fiber pull speed vary from 0.2 to 100 inches per
minute. Many CVD coatings are capable of being deposited at rates equal to or greater than
several microns per minute. Thus, for a coating zone only I foot in length, a fiber pull speed
7

STAAMm STEL UOCLOBMR
LEXMIWUOWCORMrn PLATE
STEELES JACKETCLO~m
SCALE: 1'.."WI K~fPOT
FigReTCTO 2. UScEmtcothGegaTehoniuufiecaigsye.
GAS WACTO

of 1 foot per minute is possible where the desired coating thickness is several microns.
Obviously, with longer commercial size systems the pull speed is increased proportionately.
Good quality SiC can be deposited at high deposition rates. This provides encouragement that
high fiber pull speeds can be used.
3-2. SiC Materials Issues
SiC is a light weight material with a density of 3.21 g/cm3 .4' It has a high hardness and
strength and good chemical inertness. SiC exists in cubic (,8) and hexagonal (a) forms. This
material has excellent resistance to oxidation to - 1650°C since a protective SiO2 scale is
formed. It has also been used as an oxidation protective coating for carbon-carbon composites.
It is well documented",4 2 that CVD-SiC films possess superior resistance to oxidation,
particularly at 1400-1700°C, and also greater resistance to creep than monolithic material
prepared by sintering, hot pressing, etc. The higher purity of the CVD material probably
accounts for its better properties. SiC possesses exceptionally good resistance to thermal shock.
3-3. CVD of SiC
The CVD of SiC is highly developed and well documented in the open literature and,
therefore, will not be presented in any detail here. The most pertinent body of data is that on
the CVI of SiC matrix composites since this mostly involves the coating and infiltration of fiber
tows. This technology was recently reviewed by Lackey and Starr.35 Their review included
considerable prior work on the thermodynamic and kinetic/mass transport modeling of the CVD-
SiC process.
SiC is normally deposited from either methyltrichlorosilane, CH3SiCl3, or SiCl,-
hydrocarbon mixtures. Typical deposition temperatures, excluding amorphous deposits prepared
9

for microelectronic applications, are in the range 1200-1500°C. An excess of hydrogen, over
that stoichiometrically required, is normally used to react with the chlorine. The cubic 0 form
of SiC is normally obtained by CVD but some a, which has only a different stacking order of
the (I 11) planes may also be present. Monolithic and fibrous carbon are good substrates for the
CVD of SiC.
10

4. MODELING
Mathematical modeling of the thermodynamic, kinetic/diffusion, and stresses developed
during the fiber coating process was completed in order to assist with the deposition and to help
gain insight into the coating process for future scale-up efforts.
4-1. Thermodynamic Modeling
During the initial 2 months of the program, thermodynamic calculations were completed
for the SiC + Si 3N4 deposition system. The SOLGASMIX-PV computer simulation43 was used
to study effects of temperature, pressure, and gas composition under the constraints of the
conservation of mass, constant volume, and minimization of the system free energy.
Table 1 includes the species, enthalpy, and entropy used in the calculations. The
thermodynamic data were obtained from Janaf" and Barin45 at 1500 K. An example of the
results obtained from these calculations is shown in Figure 3. The ternary processing phase
diagram indicates the input gas composition and the predicted phase assemblies for a specific
temperature and pressure. As shown, the two phase SiC + Si3N4 deposition region exists near
the high ammonia, low methyltrichlorosilane area of the diagram. Raising the system pressure
from 0.1 to 1.0 atm increased the two phase region to double the area as shown in Figure 4.
For all of the calculated diagrams, single phase SiC was predicted over the majority of the area
of the diagrams.
Following the change in scope of the project effort, no further thermodynamic
calculations were performed. The thermodynamics of SiC deposition have been studied by
several authors and further work in this area would have only duplicated earlier efforts.
11

Table 1. Enthalpy and entropy for the SiC + Si3N4 system.
Species Enthalpy Entropyk/mole ILm K
Ar(g) 0.000 188.427
C(g) 718.415 191.710
CCI(g) 500.033 281.784
CCIN(g) 140.213 323.073
CCI2(g) 239.895 354.638
CCI3(g) 83.105 419.020
CCl4(g) -85.806 469.835
CH(g) 591.314 238.318
CHCI(g) 333.341 312.780
CHCI3(g) -102.212 434.832
CHN(g) 132.099 275.095
CH2(g) 379.299 260.740
CH2C12(g) -102.442 391.163
CH3(g) 134.662 277.327
CH3CI(g) -96.935 339.823
CH3C13Si -587.547 568.120
CH4(g) -92.553 279.763
CN(g) 259.742 253.732
SiC(g) 715.648 281.167
Si2C(g) 519.228 331.239
C2(g) 835.528 259.869
C2C12(g) 213.026 395.090
C2C14(g) -2.244 532.228
C2C16(g) -107.011 667.971
C2H(g) 470.837 282.188
C2HCI(g) 212.487 351.905
C2H2(g) 185.216 298.567
12

Table 1 (cont.) Enthalpy and entropy for the SiC + Si3N4 system.
Species Enthalpy Entropy
_J/flQ J/mole*K
C2H4(g) 35.456 341.877
C2Si(g) 604.907 323.732
C3(g) 802.255 304.372
C4(g) 964.753 338.748
C4H12Si(g) -319.809 734.499
C4N2(g) 539.082 465.514
C5(g) 973.524 381.756
Cl(g) 125.863 201.323
CIH(g) -95.160 236.219
ClH3Si(g) -149.606 374.510
SiCl(g) 190.341 297.755
C12(g) 0.000 282.052
SiCl2(g) -175.663 371.590
C13HSi(g) -495.845 463.623
C14Si(g) -657.454 495.623
H(g) 234.836 148.299
SiH(g) 367.684 250.076
H 2(g) 0.000 178.846
H2N2(g) 207.275 303.767
H3N(g) -55.954 271.442
-4N2(g) 91.270 369.884
SiH 4(g) 23.548 317.348
N(g) 478.462 186.882
Si 2N(g) 387.658 349.227
SiN(g) 365.006 272.180
N2(g) 0.000 241.880
N3(g) 421.156 309.238
13

Table 1 (cont.) Enthalpy and entropy thermodynamic quantities for the SiC + Si3N. system.
Species Enthalpy Entropy
kT/moe 1/mole*KSi(g) 444.803 202.360
Si2(g) 578.658 294.779
Si3(g) 616.934 364.639
C 2H2C12 -2.650 443.832
C2H3CI(g) 27.117 405.563
C2HCI3(g) -2.069 500.435
CAH4(g) 180.900 349.900
C4H1o(g) -153.740 604.540
C4H6(g) 225.230 624.490
C4Hs(g) -40.961 463.126
CsHg(g) -165.490 627.090
CAH/(g) 60.337 538.580
CsH14(g) 50.860 941.680
C9H16(g) 336.520 363.400
Si2H6(g) 62.250 458.800
SiC2(g) 605.240 323.770
SiCI2H2 -317.690 423.180
SiCI3(g) -402.540 446.260
C(s) 0.000 33.718
SiC(alph) -71.241 84.410
SiC(beta) -72.851 84.619
ClI-4 (s) -265.232 298.149
Si 3N4(s) -735.694 334.510
Si(s) 0.000 58.411
14

4)
+ I>§
15 C

06
+0
(44
zV
!Ri
L.9E
Il
16

4-2. Kinetic/Diffusion Modeling
A process model which helped understand the effects of the deposition and fiber coating
parameters on the coating uniformity was developed. This model could be used to help scale-up
the process in order to increase fiber throughput at an increased deposition rate.
a. Model Description. The model used to study the coating of multifilament fiber
tows, which incorporates understanding the competition between the diffusion of a reactant gas
into the fiber bundle versus the reaction rate process, was investigated by performing a
differential mass balance on a cross section of a fiber bundle. Several assumptions were
required in order to complete the analysis; these include assuming constant physical properties
in the system, isobaric, isothermal, and steady-state processing conditions, and the chemical
diffusion of a single species followed by a simple order reaction involving that chosen specie
were valid. Other assumptions included that the fiber velocity was essentially zero (as compared
to the gas velocity), that an effective diffusion of the specie occurred inside the fiber bundle, that
no reactant depletion occurred along the length of the hot zone in the furnace, and that only one
specie limited the process. The process model wis modified from previous reaction/diffusion
theory for catalyst conversion presented by Satterfield and Sherwood.'
The general form of the mass balance with a first order reaction rate is given by:
r2(d2c/dr2) + r(dc/dr) - (K,/Df)r2c = 0,
where r is the radial position within the fiber tow, c is the concentration of the limiting reactant,
K, is the overall reaction rate constant, and Ddr is the effective diffusion coefficient of species
c. The equation was solved using the following boundary conditions: the concentration of the
limiting reactant at the exterior surface of the fiber bundle is a known value, c(r=R) = cq, and
the concentration of the limiting reactant at the bundle center is a tinite value, dc/dr at (r=0)
17

= 0. The solution to this Modified Bessel Function equation is expressed as a function of
position within the fiber tow, and is given by:
i V 2t )2 t
W (2K)2C _ _-_
CR 1 9r
C.G i (2K) 2
K-1
The c, is the concentration of the limiting reactant at the fiber bundle surface, 4? is the Thiele
modulus, which, in general, is the ratio that relates the reaction rate to the diffusion as:
02 = KcmIR 2/Dy
where m is the reaction rate order, and t and K are counting variables for the series. Details
of the solution are presented in Appendix A. For a first order reaction, the Thiele modulus
reduces to K,R2/D,.
For a zero order reaction, the differential mass balance reduces to:
r2(d2c/dr2) + r(dc/dr) = (K/Df)r2.
The solution to this equation (details preserted in Appendix A) is:
c(r)/cR = 1 - 0 2/4cR[1l - (r/R)2]
The expression for the concentration gradient, c(r)/cR was programmed using BASIC (see
Appendix B) and used to calculate concentration profiles for different experimental parameters
on a personal computer. A flow plan of the theoretical analysis is shown in Figure 5.
Geometrical factors which define the surface available for reaction (called the reaction site
factor) in the fiber bundle are shown in Figure 6. The porosity present in the ttndle, which
18

0 C
CD0
0*wCNCu
0 20
CD
CC
CLuz Cu
0 C
ca a.a
19

Actual
, ofoIndividual Fibers
Porosity Between Fibers( 10im )
.- 'orosity = 1- niber X (# of fibers)nR~tow
Model
Rr
Fiber Tow Cross section
Sv -Reaction Site Factor =* Doe osi rcle
2 xrfibor X 3,000
Figure 6. Physical and theoretical schematics of the geometry defined for the processmodel. Both the porosity and the reaction site factors were used to calculateparameters for the Thiele modulus.
20

was calculated from a measurement of the bundle diameter, the number of filaments in a bundle,
and the fiber diameter, was typically 60-90% for the tows investigated. This corresponds to a
spacing between fibers of over 10 jm, which is much larger than the mean free path of reactant
gases over the range of processing variables investigated, resulting in free diffusion as opposed
to Knudsen diffusion of the reactant. The diffusion coefficients were calculated using the
Chapman-Enskog psuedo-binary theory for multicomponent gases at low density. (See Appendix
A) Either argon or hydrogen was used as the binary partner for the reactant specie assumed to
limit the deposition process.
The effective diffusion coefficient of the reactant specie through the porous fiber bundle
was calculated by:
D -=. DO/-,
where 0 is the porosity fraction within the fiber bundle, D is the pseudo-binary free diffusion
coefficient calculated from the Chapman-Enskog Theory, and r is the tortuosity factor. The
tortuosity factor was assumed to be 21 -- this is an empirical correction factor obtained by
"picturing the pores as randomly oriented cylinders of one fixed diameter which intersect any
plane at an angle of 45 O. ,u
The reaction rate expression is a function of the overall reaction rate constant (KJ, which
is a combination of the surface reaction rate constant (lc), the reaction site factor (Sj, and the
activation energy (E,) for the deposition process. These kinetic parameters were calculated or
estimated from previous studies§74' and the current experimental work for the SiC deposition
system. The calculation for the kinetic parameters was completed using deposition rate
information. The activation energy for the process was determined by:
Coating thickness/time = k,,exp[-E,/kT],
21

where E. is in J/mole, k is the Boltzmann constant (8.314 J/moleK), and T is the temperature
in K at a fixed reactant concentration. The activation energy corresponds to the negative slope
of an Arrhenius plot of In (deposition rate) versus I/T. The kinetic parameters determined from
the Arrhenius plot of thickness or deposition rate vs l/T are valid for the first order rate
expression as long as the concentration of reactant does not vary with temperature for the data
presented.
The surlace reaction rate constant was determined by calculating the surface reaction rate
(moles/cmss) from the deposition rate information using the density and molecular weight of the
solid formed, and dividing by the known reactant concentration, utilizing the following
relationship for first order kinetics:
rate = kc .
The overall reaction rate constant, KI, was determined by multiplying the surface rate constant
by the geometrical site factor, S, defmed in Figure 6. For a first order reaction, the units of
k, are cm/s, and the units of the overall reaction rate constant are s1 .
b. Model Input Conditions. The modeling of SiC deposition onto carbon fiber
tows was completed for the Amoco T-300 fiber. For this deposition, the limiting reactant was
methyltrichlorosilane (MTS), which has been used in several other modeling efforts.4"7 4
Hydrogen was used as the binary component for the diffusion calculations. Figures 7 and 8
show experimental results for the SiC deposition system,2' 4' which were used to determine the
first order reaction rate parameters for the model.
The deposition of SiC from MTS and H2 has been extensively studied. Most of the
kinetic data, and the data shown in Figures 7 and 8 are for atmospheric pressure. The activation
energy has been reported from 72 to 120 Id/mole. This large range has been attributed to the
22

7.0
6.5-S0 P m 101 kPa
6.0- MTS FLOW - 50 cmr/minH2FLOW - 500 cm3/min
Ln(p) 5.5--(nm/mi) E = 72(±13) kJ/Mof'l"0
5.0- 0
4.0 . I6.5 7.0 7.5 8.0 (xlO4)
lI/T (K-1 )
Figure 7. Arrhenius plot of deposition rate versus reciprocal temperature for SiC depositionshows an activation energy of 72 k/mole.
23

1273 1223 K 1173I i I
4 0
nm3.8 EA= 120 kJ/Mole
CC 3.6-C 00.0CL 3.4-
3.2-
3- 0
2.8 1 I I7.5 7.75 8.0 8.25 K-1 8.5 x 10"3
Reciprocal Deposition Temperature
Figure 8. Arrhenius plot of experimental SiC deposition data shows an activation energy of120 U/mole.
24
complex reaction mechanisms involved in SiC deposition chemistry. Poisoning of the reaction
due to HCl formation has been definitively shown to occur. The data used for the theoretical
studies span the previously reported values, although it is clear that the exact reaction rate
expression is currently not understood. The rate constant was varied over a larger region (10Y'-
10') due to the uncertainty in the theoretical model and reaction expression. The computer
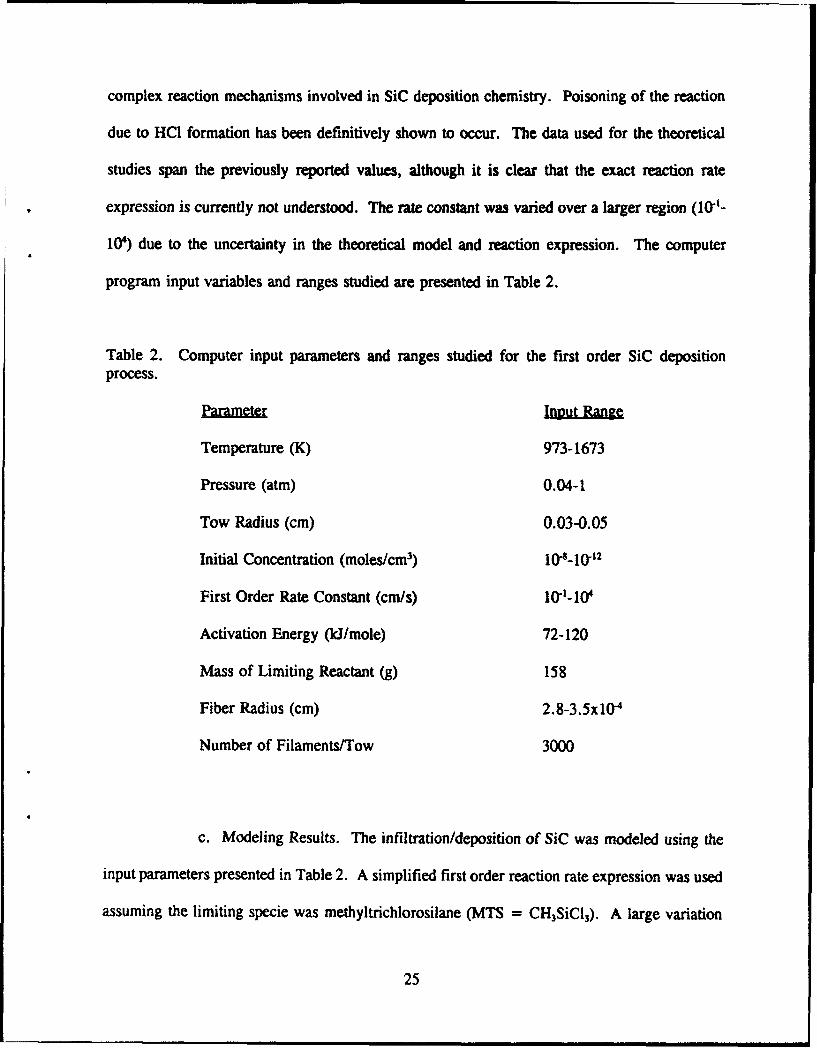
program input variables and ranges studied are presented in Table 2.
Table 2. Computer input parameters and ranges studied for the first order SiC deposition
process.
Parameter
Temperature (K) 973-1673
Pressure (atm) 0.04-I
Tow Radius (cm) 0.03-0.05
Initial Concentration (moles/cm3) 10-_10-12
First Order Rate Constant (cm/s) 10'-10'
Activation Energy (kJ/mole) 72-120
Mass of Limiting Reactant (g) 158
Fiber Radius (cm) 2.8-3.5x101
Number of Filaments/Tow 3000
c. Modeling Results. The infiltration/deposition of SiC was modeled using the
input parameters presented in Table 2. A simplified first order reaction rate expression was used
assuming the limiting specie was methyltrichlorosilane (MTS = CH3SiCI3). A large variation
25

in predicted concentration profiles was observed for this system. For example, at E. = 72
ki/mole, k. = 10' cm/s, 1673 K, and I atm, the concentration ratio changed from 1 at the
outside of the tow to 10.2 at the center of the tow. Figure 9 shows the concentration ratio at the
bundle center as a function of temperature at two different pressures.
Other model input included a range of effective diffusion coefficients of 0.4 to 21 cm2/s.
The o reaction rate constant varied from 1 to 10'/s, and porosity changed from 70 to 89%
depending on the model input conditions. Figure 10 shows the Thiele modulus versus
temperature at the two activation energies used. As shown, the Thiele modulus varies from 103
to 10-1. Large Thiele modulus values were observed for high temperature, high pressure
conditions, where the reaction rate constant times the tow radius squared was at least 10 times
the effective diffusion coefficient.
d. Comparison of Experiment to Model. The experimental deposition work is
summarized in a later section; however, some of the results used to validate the process model
are presented here to assist in defining the kinetic parameters used for the SiC deposition. The
kinetic data determined from the experimental studies were plotted as In (coating thickness)
versus l/T in order to validate the range of activation energies used in the model. This plot is
shown in Figure 11, and gives an activation energy of 113 kJ/mole, which is within the range
studied. The kinetic information was obtained by fixing the pressure, fiber pull speed, hydrogen
and inlet MTS concentration. The majority of processing conditions simulated by the model
predicted a uniform concentration profile throughout the tow. High temperature, high pressure
conditions which used the faster kinetic parameters did result in a drop in expected reactant
concentration as a function of position. For larger fiber spreading values a uniform deposition
would be anticipated.
26

9-
0u
0c
ILIui E~(
0 ao C0; 0 00
0
27

i i
C; CL
N a w
I-go
280

cvd
CV
we
C0
80
* (Wit) SS3N)IOIHJ. EVNLLVOO U-1
29 "

A variation in coating thickness was observed for a run which was conducted at 1350°OC,
3 f/min H2, and 7 g/min MTS flow rate. SEM micrographs from this run are shown in Figure
12. A plot of the predicted coating thickness (converted from the concentration profile) versus
radial position is shown in Figure 13. The experimentally observed coating thickness is also
shown; both values decrease into the fiber tow.
One problem which is not explained by the model is the overcoating, or blocking of the
diffusion paths for samples with fast reaction compared to diffusion. When the Thiele modulus
is greater than - 10, the system operates similar to a chemical vapor infiltration process. If the
reaction/diffusion model predicts a large concentration gradient, it is more likely that the fiber
tow will be "canned" by the solid deposit, with very little or no coating on the inner filaments.
In this model study, the following general relationships were found: 1. Complete
infiltration was favored by low temperture, low pressure, high activation energy, and low
reactant concentration conditions. 2. The Thiele modulus was controlled by the reaction rate,
i.e., the kinetic parameters used controlled the value of the modulus. Diffusion coefficients
were found to vary from - 10--10 cm2/s whereas the reaction rate constant varied over several
orders of magnitude. Finally, the initial fiber also influenced the ability to completely infiltrate
the tow; small diameter filaments and a small number of filarncats wcm,. prtf'.ir1f. ý, complete
infiltration."°
4-3. Stress Modeling
The modeling of stresses which would develop in a coated fiber during cooling due to
thermal expansion mismatch or fiber or coating anisotropy were studied using equations
presented by Hsueh, et al." The results from the analysis are being published as part of a
30

Figure 12. SEM micrograph for a SiC coating which shows a coating thickness variation as
a function of radial position.
31

10.00 COATING THICKNESSS•Actual
A ModelE 8.00
coCf)uz 6.00
I-4.00
z
0O 2.00
0.00 - ... YW WWI...... li i sv -
0.00 100.00 200.00 300.00 400.00
RADIAL POSITION (jim) *\,Exterior of tow
Figure 13. Predicted and experimental coating thickness versus radial position for SiCdeposition on carbon fibers. Both profiles decrease as they move toward thecenter of the tow.
32

larger effort on understanding fiber coating stresses.' 2 Axial, tangential, and radial stress
components were compared for SiC coatings deposited onto various commercial carbon tows.
The goal of this theoretical work was to help guide carbon substrate selection in order to
minimize any fiber/coating damage. The effect of coating thickness and bending on the
maximum axial stress was also considered for the fiber/coating pairs.
Table 3 contains the material properties required for the stress calculations. Calculated
stresses were as high as 2.5 GPa but were typically less than about 0.5 GPa. The stresses
calculated are the sum of the thermal expansion mismatch and the anisotropic stresses. Figure
14 defines the geometry and stress components used in the model. As shown in Table 3, most
carbon fibers contain a high level of anisotropy in their coefficients of thermal expansion
(CTE's); i.e., the CTE in the radial direction differs significantly from that for the axial
direction.
Table 3. Physical and mechanical properties of fibers and coatings."2
Thermal Expansion Young's Tensile FiberRadial Axial Modulus Poisson Strength Radius
(10- K-1) (GPa) Ratio (GPa) (Um)(300-15O0K)_
FibersCarbon
T-50 6.70 0.352 391 0.2 2.8 2.8T-300 8.85 0.932 232 0.2 3.6 2.8
CoatingSiC 5.5 5.5 428 0.2 1-2.4
In order to help judge which fiber-coating combination would not develop catastrophic
stresses due to thermal expansion mismatch, comparison calculations were completed for coating
thicknesses in the range of 0 to 5 tim for the T-50 and T-300 fibers. Figure 15 shows the
33

Fiber
Tangential Radial
Axial
Coating
Fiber Radius = a
Coating Thickness = b-a
Figurt 14. Definition of orientations for stress calculations.
34

Lf) CIcF-
.4 0 ?
IjI, Il a U0LO 0 L
tI Iý z z4
Ild) Sbi 0vixv
3510

maximum radial, axial, and tangential stresses for both fibers as a function of coating thickness.
It can be seen from Figure 15 that the axial stresses in the coating for C(T-50)-SiC systems are
greater than corresponding stresses in C(T-300)-SiC systems for a range of coating thickness
from 0 to 5 •m. For the target coating thickness of 5 1m, the stresses are well below the
strength of CVD-SiC (- 2 GPa). It should be mentioned that cracked coatings were never
observed experimentally even when the coating thickness was 1 pm or less.
Another analysis was completed which evaluated the maximum axial stresses for both no
bending and bending states of the fiber. Figure 16 shows the maximum axial stress as a function
of coating thickness for the no bending case for a T-50 fiber. As shown, for a coating thickness
of 5 14m, which is desired for the development of SiC fibers, a stress of 0.25 GPa is expected.
This is considered an acceptable stress for the fiber/coating system. Figure 17 shows the effect
of bending radius as a function of coating thickness for the maximum axial stress. As the
bending radius decreases, the axial stress increases. Assuming a strength of 2 GPa, these results
indicate that a fiber with a 5 14m thick coating could be bent to a radius of 0.2 cm. This is
sufficient to permit weaving of cloth.
These analyses were useful in determining which fiber was preferred for the deposition
work. The experiments were performed using the T-300 fiber since the tensile stresses were
lower in the I to 5 jpm coating thickness range as compared to the T-50 fiber. Also, the T-300
fiber is available without sizing and not twisted.
36

0Ii
2.5
S2
"is
EE 0. 5
S T e n sile0 2 4 8 8 10 12 14 16 18 20
Coating Thicns (wn)(No Bending)
Figure 16. The maximum axial stress for the no-bending case shows that for a 5 /sm thickSiC coating, an acceptable stress is predicted.
37

5.0___0.1 cm 0.2 Cm 0.25 cm 0. Cm 0.4 cmn
~4.0-
CO 3.0
0 2.0E
1.0- 5 -i C
- Tensile00 10 20 30 40
Coating Thickness (pm)(Bending Radius = 0.1-10 cm)
Figure 17. Maximum axial stres in the coating as a function of coating thickness for SiC
coatings on Amoco T-50 carbon fiber.
38
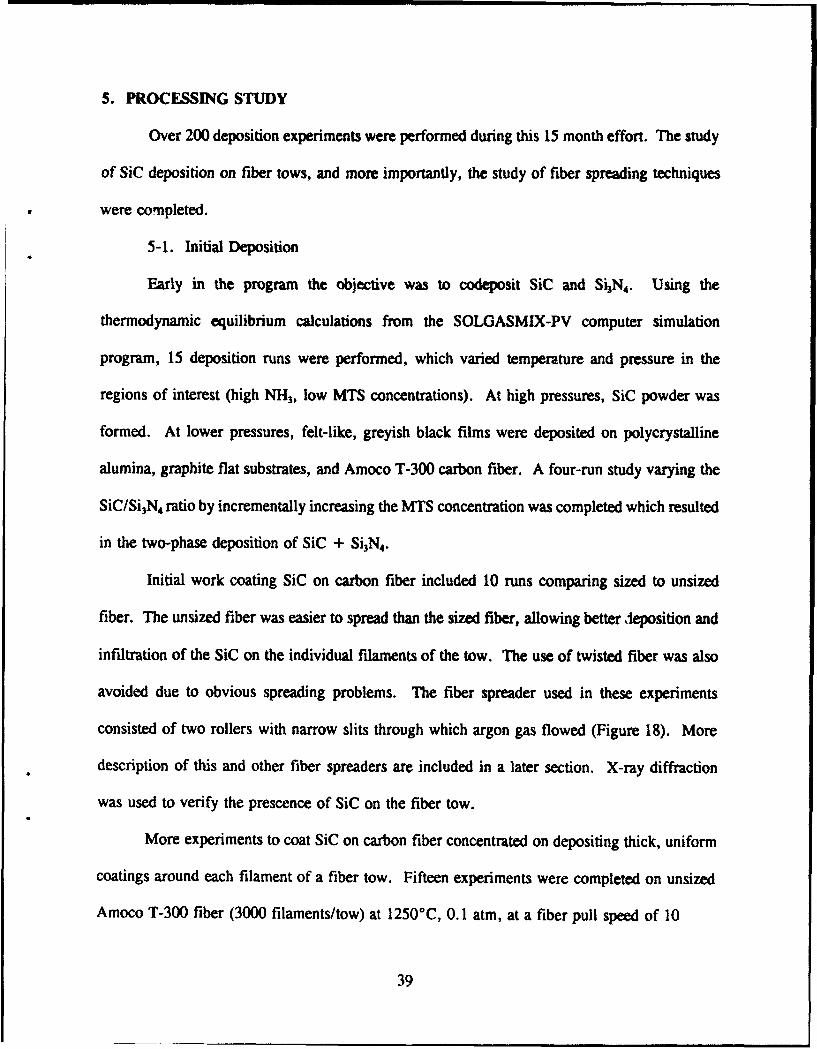
5. PROCESSING STUDY
Over 200 deposition experiments were performed during this 15 month effort. The study
of SiC deposition on fiber tows, and more importantly, the study of fiber spreading techniques
were completed.
5-1. Initial Deposition
Early in the program the objective was to codeposit SiC and Si3N4. Using the
thermodynamic equilibrium calculations from the SOLGASMIX-PV computer simulation
program, 15 deposition runs were performed, which varied temperature and pressure in the
regions of interest (high NH 3 , low MTS concentrations). At high pressures, SiC powder was
formed. At lower pressures, felt-like, greyish black films were deposited on polycrystalline
alumina, graphite flat substrates, and Amoco T-300 carbon fiber. A four-run study varying the
SiC/Si3 N4 ratio by incrementally increasing the MTS concentration was completed which resulted
in the two-phase deposition of SiC + Si3N4.
Initial work coating SiC on carbon fiber included 10 runs comparing sized to unsized
fiber. The unsized fiber was easier to spread than the sized fiber, allowing better dieposition and
infiltration of the SiC on the individual filaments of the tow. The use of twisted fiber was also
avoided due to obvious spreading problems. The fiber spreader used in these experiments
consisted of two rollers with narrow slits through which argon gas flowed (Figure 18). More
description of this and other fiber spreaders are included in a later section. X-ray diffraction
was used to verify the prescence of SiC on the fiber tow.
More experiments to coat SiC on carbon fiber concentrated on depositing thick, uniform
coatings around each filament of a fiber tow. Fifteen experiments were completed on unsized
Amoco T-300 fiber (3000 filaments/tow) at 1250°C, 0.1 atm, at a fiber pull speed of 10
39

IL') 0
cq ZZ
V4
E4cc
E-cc
00
4-. 00
0 w..0-,0
00
C) 06
400

cm/min. The spreading device described previously was used. Figure 19 shows a uniform
coating of SiC on the Amoco fiber. Experiments completed at higher pressures (0.5 atm)
resulted in thick but nonuniform coatings. Further deposition work varied the amount of MiS
from 3 to 7 g/min. The lower MTS concentration produced thin layers of SiC (0.25 - 0.5 tum).
In order to achieve the desired thicker coatings, the MTS flow rate was increased to 5 g/min.
Initial tensile tests of 6 cm gauge length filaments of uncoated Amoco T-300 fiber
resulted in strength values between 2.5 and 3.8 GPa. These values agree with the reported
strength value of 3.65 GPa from Amoco. Tensile tests on some of the initial coated fibers with
1 ttm of SiC yielded strength values of approximately I GPa.
5-2. Statistical Study
a. Design. At this point, a box statistical study was designed (Figure 20) to assist
in defining the optimal conditions for depositing SiC on carbon fibers. This study centered
around deposition conditions of 1250"C, 2.5 1r/min H2, and 5 g/min MTS flow rate. The
experiments varied temperature from 1050"C to 1450"C, H2 flow rate from 1.5 to 3.5 /mrin,
and MTS flow rate from 1 to 9 g/min. A fiber spreading device was employed which cyclically
applied and released tension on the carbon fiber at 1 second intervals. The fiber pull rate was
10 cm/min, and the pressure was 100 torr. Scanning electron microscopy, weight gain, and
x-ray diffraction were used to characterize the fibers. The strength of the coated fibers was
measured by tensile testing, and the percent agglomeration was observed from SEM
micrographs. The study focused on strength values and percent agglomeration as a function of
the processing variables.
b. Property-Processing Correlations. A summary of the experimental study and
response data are shown in Table 4. This table includes run number, run conditions, operating
41

Figure 19. A 3 14m SiC film was uniformly deposited at 1250*C, 0.1 atm on fiber moving
at 20 cm/min.
42

9 ~ ~ T C -
c~ CY
o toC i
V- '-
CtC
a 0 /3
040
43 t

0 42
10 0 ; 0
d v;0c
iua aI0m 0 0 m N r 1
p ~ St~t m Wý IN m St v tSt~
0,,
r~44

pressure, average tensile strength values, and weight of the coated fibers. Both thin and thick
coatings were deposited (Figure 21); the thickness ranged from 0.1 to 7 um. Surface roughness
was also evaluated; smooth coatings are expected to result in higher strength fibers due to the
lack of failure initiating flaws. The morphology range of the coatings from the study is shown
in Figý!re 2?. The nodular films were deposited at high MTS concentrations. Results from this
characterization were used to correlate processing parameters to the fiber attributes.
Tensile strength of the filaments was measured using an Instron model 1331 tensile
testing machine equipped with pneumatic grips to pull the samples to fracture at a rate of 0.031
cm/s. At least 10 fibers were tested at a gauge length of 6 cm unless otherwise noted. Some
of the samples were extremely brittle and could not be separated into individual filaments;
shorter gauge lengths were used to evaluate the strength of these fibers. The strengths generally
ranged between 1 and 2 GPa for the fibers prepared in the statistical study. Fibers prepared in
later work had tensile strengths above 2 GPa. Figure 23 presents the tensile strength versus
coating thickness, and Figure 24 shows the tensile strength versus deposition temperature. The
uncertainties shown in the figures represent the range. The strength appears to generally
decrease with increasing coating thickness and temperature although the trends were not
statistically significant.
Table 5 summarizes the general results from the multiple regression analysis of the data,
indicating the response variable and the processing parameters which had significant positive or
negative affects on the final properties. Multiple regression analysis (see Appendix C) showed,
with greater than 99% confidence, that the weight gain of coated fiber tows had a large positive
correlation with both temperature and MTS flow rate, i.e., weight gain increased with increasing
temperature and MTS flow rate. There was a 94% confidence that hydrogen flow rate had a
45
L1

Figure 21. SEM mnicrographs show the thick arid thin coatings deposited during the statisticalprocessing study. For the thick coating, extensive fiber agglomeration waspresent.
46

II ~ t 4ft 4%U
Figure 221. Smoot' and rough -surface morphology was Observed frtern ope~ i
the study. Smooth surfaces are desIred for Nig foren the uscmltdi
47

7
61 S Uncoated carbon fiber65- Uncoated carbon fiber
pulled through thecoating system
741
Uncoated carbon fiber heat3 treated to 12000C in flowing H2
21, I I,
0. fi . . .i ! i Is I !1 11 11 1 .......... . . . I.
0 2 3 4 5 6Coating Thickness (gm)
Figure 23. Tensile strength versus coating thickness for SiC coated carbon filaments. Theaverage and data ranges are presented on the fir ire.
48

3
2-
C)
Temperature (IC)
Figure 24. Tensile strength versus deposition temperature for SiC coated carbon fibers; theaverage and data ranges are shown.
49
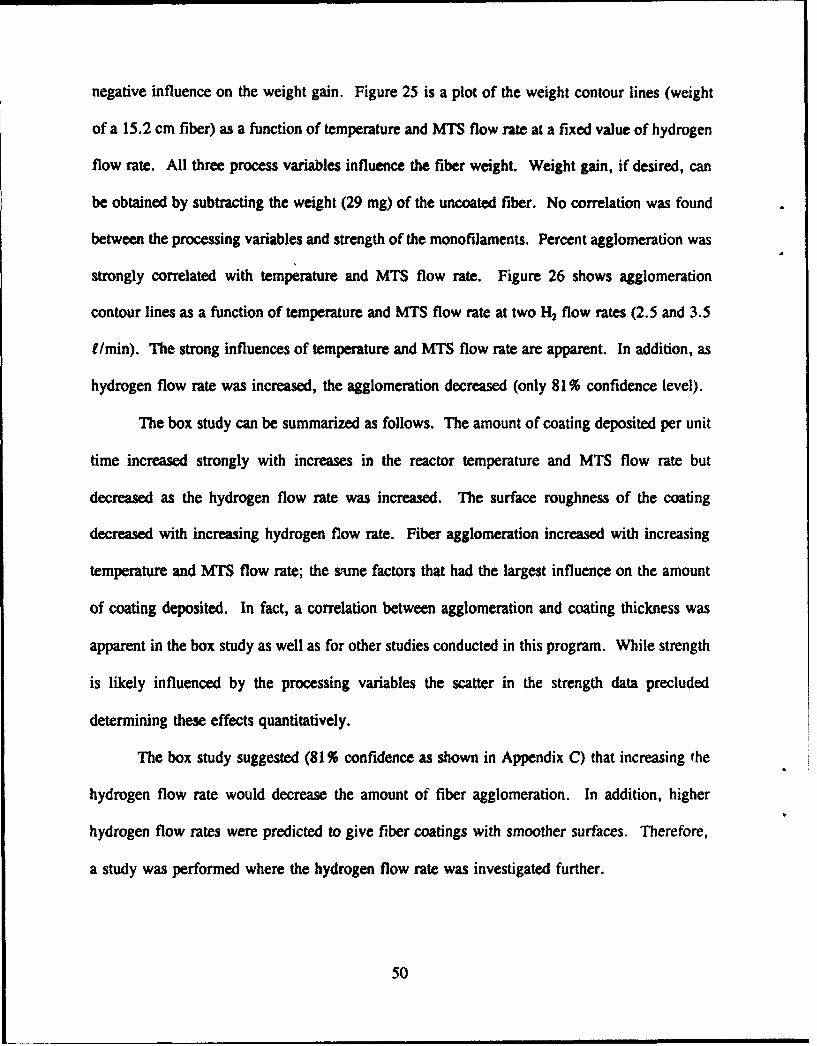
negative influence on the weight gain. Figure 25 is a plot of the weight contour lines (weight
of a 15.2 cm fiber) as a function of temperature and MTS flow rate at a fixed value of hydrogen
flow rate. All three process variables influence the fiber weight. Weight gain, if desired, can
be obtained by subtracting the weight (29 mg) of the uncoated fiber. No correlation was found
between the processing variables and strength of the monofilaments. Percent agglomeration was
strongly correlated with temperature and MTS flow rate. Figure 26 shows agglomeration
contour lines as a function of temperature and MTS flow rate at two H2 flow rates (2.5 and 3.5
I/min). The strong influences of temperature and MTS flow rate are apparent. In addition, as
hydrogen flow rate was increased, the agglomeration decreased (only 81% confidence level).
The box study can be summarized as follows. The amount of coating deposited per unit
time increased strongly with increases in the reactor temperature and MTS flow rate but
decreased as the hydrogen flow rate was increased. The surface roughness of the coating
decreased with increasing hydrogen flow rate. Fiber agglomeration increased with increasing
temperature and MTS flow rate; the same factors that had the largest influence on the amount
of coating deposited. In fact, a correlation between agglomeration and coating thickness was
apparent in the box study as well as for other studies conducted in this program. While strength
is likely influenced by the processing variables the scatter in the strength data precluded
determining these effects quantitatively.
The box study suggested (81 % confidence as shown in Appendix C) that increasing the
hydrogen flow rate would decrease the amount of fiber agglomeration. In addition, higher
hydrogen flow rates were predicted to give fiber coatings with smoother surfaces. Therefore,
a study was performed where the hydrogen flow rate was investigated further.
50

______ , L
0i1
-CV
2 4.:i
co co IV * * 0
cv( ') C') 0 pIt)t4
~L0
51o X

H, at 2.5 elmln ' at 3.5 e/"In
86- 72
E 6-73 60
4- ~~61 -4 7
48 -35-
A36 - 20 ji1 24 T 10 2
o0 AGGLOMERATIONN 0o AGGLOMERAION (%)
1000 1100 1200 1300 1400 1000 1100 1200 1300 1400
TEMPERATURE (-C) TEMPERATURE (-C)
Figure 26. Agglomeration contour lines as a function of the deposition temperature and MTSflow rate for two fixed hydrogen flow rates shows the strong influence of MTSflow rate and temperature on agglomeration and the smaller influence of hydrogenflow rate.
52

Table 5. Processing-property correlations revealed by the statistical analysis of the box study.
DEPENDENT VARIABLE CORRELATING INDEPENDENT VARIABLE
SignificanceVariable Level E%) Effect
Strength None
Weight Gain Temperature > 99 +R2 = 0.79 MTS Flow Rate > 99 +
Surface Roughness Hydrogen Flow Rate 98R2 = 0.60
Agglomeration Temperature 97 +R2 = 0.71 MTS Flow Rate >99 +
5-3. H2/MTS Ratio Study
In this study, the H2 flow rate was varied from 2.5 to 7 /min and the MTS flow rate
was varied from 3 to 7 g/min. The results confirmed that higher H2 flow decreased
agglomeration due to decreased MTS concentration in the gas stream. However, the higher H2
flow led to the deposition of thinner coatings (< 1 pm). The results prove that the MTS
concentration had a significant effect on agglomeration. The optimal SiC coatings were
deposited at 4 /mrin H2 and 5 g/min of MTS. This condition formed a high strength, uniform
coating of 2.0 pm thickness with very little agglomeration (Figure 27).
5-4. Pressure Study
A final processing study was completed which determined the effect of pressure on
coating thickness. For the pressure study the temperature, hydrogen flow rate, and MTS flow
rate were held constant at (1250°C, 4 f/min H2, and 7 g/min MTS, respectively). The pressure
was increased from 150 to 200 torr. Figure 28 shows the extensive variation of coating
53

S~2 p'm
!0
i 50/pm
Figure 27. A uniform 2.0 •m thick coating was deposited using 4 f/min H2 and 5 g/minMTS flow rates. Very little fiber agglomeration was observed for theseconditions.
54

00') 'U
0
00
554

thickness with pressure. With the conclusion of this study, the deposition process was defined
as 1250*C, 4 /mrin H2, 7 g/min MTS, and a pressure approaching 200 tort. The desired
coating thickness may be achieved by selection of an appropriate fiber pull speed. As described
later, with the more effective fiber spreading techniques developed near the end of this program
uniform 5 pm thick coatings and even higher deposition rates can be obtained at even higher
pressures, e.g. 1 atm.
56

6. FIBER SPREADING TECHNIQUES
The study of fiber tow spreading techniques was emphasized following our processing
study because fiber tow agglomeration was evident whenever the coating thickness increased to
over 1 jm. Several mechanical spreading techniques, which will be reviewed next, failed to
adequately prevent fiber agglomeration or damaged the fiber during processing. The use of
more novel spreading devices, including pneumatic and electromagnetic spreading, was pursued
later in the project.
6-1. Cyclic Tension
The continuous fiber coating system was equipped with a mechanical device that
periodically applied and released tension on the fiber tow. This device was controlled by a
motor attached to the supply spool in the bottom spool enclosure. A thin metal strip was passed
across metal rods attached to a plate which was rotated in the opposite direction of the fiber
spool. Adjusting the teasio;n was accomplished by changing the length of the metal strip, or by
changing the material used; hardened stainless steel, bronze, teflon, rubber, and plastic were
used as the strip material. The resulting action was that the fiber vibrated at the controlled one
second intervals.
The best results were obtained using a combination of a hardened stainless steel strip and
a rubber strip. The rubber extended the life of the stainless steel by providing some flexibility
of the combined material. The tension device was used in conjunction with all the other
mechanical spreading techniques.
6-2. Gas Jets and Rollers
The statistical processing study was completed using the cyclic tension device and a
stationary roller with gas jets (shown in Figure 18). The combination of these techniques spread
57

the fiber to a tape geometry and increased the tow diameter to 2.5 times the initial diameter.
The use of a gas jet, passed through a narrow slit in the roller, caused the fiber to be spread
apart and worked with the cyclic tension device. When the tension was released, the fiber tow
was blown away from the roller; as tension was applied, the fiber tow was pullP flat against
the roller surface and spread likiu a tape.
This technique was successful for small coating thicknesses (1 14m and less). As the
coating thickness increased, the fibers tended to agglomerate. Another problem with this
technique was that at high coating thicknesses, the fiber tow frequently broke due to the violent
spreading action. Attempts at lowering the fiber pull rate to increase the coating thickness were
inconclusive.
6-3. Fiber Splitting
Efforts to reduce the number of filaments in the fiber tow were attempted based on the
earlier modeling work. Initially, carbon fiber tow vendors were contacted for purchase of a
fiber tow with less than 3,000 filaments. The only tows with a smaller number of filaments
were the Hercules HMU and Amoco T-300, which had 1,000 filaments--but were available only
in sized material. The development of carbon tow with fewer filaments was regarded as
uneconomical by the vendors. To circumvent this probiem, fiber spreaders were used to split
the tow effectively into two bundles of filaments being pulled through the coating furnace.
Figure 29 shows the two fiber splitting devices used in the bottom spool enclosure. Both
metal strips and metal rollers were used to split the tow. A series of runs was completed which
evaluated the size (metal strip versus 0, 1, and 1.5 cm diameter cylindrical spreaders) versus the
coating thickness and tensile strength of the filaments. The results are summarized in Table 6.
Coating thicknesses varied primarily because of the deliberate use of different MTS flow rates.
58

a 0 0 0 0 0 0 i
, 00of
o 0
A
o 0 o.?
____.• 14
59 tw"iI

Table 6. Summary of fiber splitting study results.
Coating AverageIThickness Tensile Strength % Fiber
Run # (aM) (GPa) Agglomeration
HORIZONTAL METAL STRIP
SC107 5.65 1.16 - 0.367 90SCl19 2.70 0.73 ± 0.030 50SC127 4.75 0.63 ± 0.035 80SC128 3.5 0.76 ± 0.112 95SC142 2.0 2.41 ± 1.086 50SC143 1.5 3.78 ± 0.551 75SC153 2.25 0.60 ± 0.115 10
METAL CYLINDER DIAMETER = 1h cm
SC130 3.5 0.88 ± 0.208 50SC132 3.5 1.76 ± 0.361 100SC133 3.25 1.19 ± 0.124 75SC151 2.25 0.96 ± 0.090 5SC152 2.25 1.29 ± 0.065 5
METAL CYLINDER DIAMETER = 1l/2 cm
SC149 2.0 2.42 ± 0.813 5SC150 2.25 0.68 ±0.089 5
METAL CYLINDER DIAMETER = 1 cm
SC146 1.25 0.71 ± 0.182 5SC147 3.90 0.54 ± 0.114 5SC148 1.5 0.68 ± 0.051 5
60

The use of metal strips was preferred; both thick coatings and high tensile strengths were
achieved using this technique. The major drawback to this mechanical spreading was that the
fiber tended to bunch together where the splitting was accomplished. Long run times were
difficult to achieve with the mechanical splitting technique because "fiber balls" often formed.
6-4. Pneumatic Spreading
The pneumatic spreading technique, which was presented by Kim arid Gray" , was used
to spread the filaments of the carbon tow. One of the unique features of this technique was that
no mechanical force was used with the fiber. A schematic of this technique, which was
modified to a cylindrical geometry for the continuous fiber coating furnace, is shown in Figure
30. The operating principle involved using a vacuum pump to provide a high throughput of gas
down restricted inlet tubes (points A and B in the figure) and utilized the gas flow to force the
filaments apart. This approach successfully spread the fiber tow into a wide tape provided the
fiber was not in tension.
The pneumatic spreading device was placed in the bottom supply spool enclosure. In
order to achieve minimum fiber tension, the supply spool was rotated at a slightly higher speed
than the take-up spool. Also, a gas diffusion ring was attached above the cylinder to both
impinge jets of gas onto the fiber tow and to provide the gas necessary to assist in spreading the
fiber. Another concern involved maintaining a higher pressure in the lower spool enclosure than
the CVD furnace which prevented any diffusion of the reactants into the enclosure.
Initial experiments utilizing this approach appeared to spread the fiber tow to 3 times the
"initial diatietew; a tape geometry was created. A small study which varied the MTS and H2
diluent flow rates was completed. The processing parameters were affected by the large H2 flow
rate required to spread the fiber tow in the bottom spool enclosure. The results from this study
61

H2 o*.-Gas DiffuserRing
iberTo .To
Vacuum A Vacuum
- Fiber Tow
Gas Flow
Figure 30. Schematic of the pneumatic induction cylinder used to spread the fiber tow.
62
were encouraging; thick SiC films (i.e. -5 14m) were deposited with a reduced amount of
agglomeration (< 30 %) than had been previously observed for thick coatings using any of the
mechanical spreading techniques.
6-5. Electromagnetic Spreading
A final spreading technique which involved the use of electromagnetic forces on the fiber
tow gave the most successful results. This technique was developed by Sheehan et al.1 at
MSNW, Inc. The technique is shown schematically in Figure 31; the spreading involved passing
an alternating current through the fiber tow using a 100 watt frequency generator, and
surrounding the fiber external to the system with two 500 Gauss permanent horseshoe magnets.
The initial work with this spreading technique was exciting due to the fact that the tow was
spread to about 2 cm diameter and could be vibrated in a controlled fashion.
The modeling of the spreading of the fiber tow involved solving the wave equation:
65y1& = c2 9y/bx2,
where c = (Tip)°5
T = fiber tension
p = linear fiber density
y = transverse displacement, i.e., how wide the fiber tow spreads
t =time
x = axial position
For fiber tow spreading, the solution to this equation for two nodes is:
Frequency = [T/p]0 5/2f where I is the length of tow being spread. A node corresponds to the
positions where the fiber tow is not spread. The maximum spreading y., is proportional to the
63

Current Contact
0 0AdjustableHook
Quartz-
Tube
Magnet ED
SFol
Magnet ED Varable Frequency••.• • •J•Generator.
To Vacuum
Figure 3!. Schematic of the electromagnetic fiber spreading technique.
64

magnitude of the driving force, which is the cross product of the electrical and magnetic forces,
and inversely proportional to the tension in the fiber.
The results from this spreading technique are shown in Figure 32. These static CVD
experiments were completed in a small glass tube used to monitor the spreading. The current,
which was typically 2-3 Amps, heated the -25 cm long carbon fiber. Several experiments
which studied the effect of tension, pressure, current, and frequency were completed in order
to understand the wave relationships to provide maximum spreading in the anti-node position.
The preferred operating conditions were determined to be 3 Amps (which was required to
adequately heat the fiber) and a frequency of 50 to 100 Hz. Standard 60 Hz power reguLted
with a Variac worked well. As the voltage (i.e. current) was increased to initiate a run, on
some occasions, the tow would move as a unit rather than as individual filaments. This could
be observed visually. However, before the desired voltage level was achieved, the tow would
invariably spread, i.e., the individual filaments moved separately to form the configuration
shown in Figure 32 or a similar configuration having 1 or 2 nodes. Further description of the
benefits of this technology in relation to a commercial process is detailed in the following
section.
65

j
Figure 32. Photograph of the electromagnetic technique in operation shows a zero node stateof the fiber tow spread to 2 cm tow diameter.
66

7. CONCEPT FOR SCALE-UP
Throughout the course of this research we constantly kept in mind that the process and
CVD fiber coating equipment should be amenable to scale-up necessary for commercial
operation. This consideration argues for safe, inexpensive, reliable, easily operated equipment
capable of high throughput. The research and development conducted to date offers
encouragement. Our thoughts regarding the conceptual design of a commercial CVD system for
preparing large quantities of inexpensive SiC fiber tow follow.
The concept is very similar to that used by Textron to fabricate boron monofilament and
presumably similar to that used for fabricating SCS-6 SiC monofilament. A simple cold wall
continuous CVD system is proposed. The carbon fiber tow substrate would be heated
resistively. Electrical connections with the fiber would be accomplished by the use of mercury
contacts. The fiber would be spread extensively using the electromagnetic method. By locating
the mercury contacts near the ends of the reactor but in a region where the fiber is partially
spread the mercury will readily infiltrate the tow to permit good contact with each filament.
(Alternatively, pressure plates or metal rollers could be used to provide electrical contact.)
The reaction chamber would be made of glass and have dimensions of about 1 inch
diameter by 10 feet long. The reagent stream would enter one end of the reaction chamber and
exit the other. It is not anticipated that multiple reagent inlets would be needed. This permits
a very simple, inexpensive, reliable reactor design. The use of a cold wall reactor greatly
enhances reagent utilization since almost all of the deposition is on the fiber. The recycle of
reagents may be possible but considerable development is necessary before this can be asserted
with any confidence.
67

It is anticipated, based on the following argument that very high coating rates could be
achieved. First, as we have demonstrated, the electromagnetic spreading technique causes
extensive spreading of the fiber tow. This is significant since previously there was the necessity
to use low total gas pressure in order to assist infiltration of the reagent(s) into the fiber tow in
order to obtain coating uniformity. Low pressures almost invariably reduce the rate of coating
deposition. With extensive spreading of the fiber high pressures (i.e., I atmosphere) can be
used without sacrificing coating uniformity. Also, since the Plectromagnetically spread fiber is
constantly in motion there is little likelihood of one filament sticking to another. This, and the
use oi a cold wall reactor, prevents fibers from sticking to the wall of the reactor and thus
accumulation of fiber debris is minimized or eliminated.
In summary, with the proposed coating system it should be possible to rapidly fabricate
high quality SiC fiber tows. The fact that SiC monofilaments having coating thicknesses several
tens of microns have been similarly prepared by others at fiber pull speeds of several feet per
minute provides further conildence in the conceptualized process. Our success in development
of the electromagnetic fiber spreading technique encourages us that fabrication of high quality
SiC fiber tows by the CVD technique is indeed a realistic goal,
68

8. CONCLUSIONS
Results from this effort indicate that the continuous deposition of SiC onto small diameter
carbon fiber tows is a feasible process for fabricating strong SiC fibers for use in ceramic and
metal matrix composites provided that the fiber tow is spread effectively during deposition.
Uniform coatings with fiber tensile strengths in excess of 2 GPa have been achieved. Extensive
modeling efforts were performed which led to an increased understanding of the fiber coating
process and final fiber/coating stress states which assisted in selection of the carbon fiber
substrate. The process modeling also can be used to assist in modifying the process to a
commercial scale.
Experimental work was completed in two major areas; understanding the deposition of
SiC onto fibers and evaluating various fiber spreading techniques. The deposition of SiC was
studied using a statistically designed study; processing-property correlations were determined
using multiple regression analysis. The use of several mechý..iical spreading techniques was
evaluated; the results were inconclusive due to a wide variation of tensile strengths, and the
judgement that the fibers were agglomerated an unacceptable amount. The final fiber spreading
techniques evaluated were more encouraging since they did not rely on any mechanical device;
both pneumatic and electromagnetic spreading are techniques which solve the agglomeration
problem without damage to the fiber tow.
ACKNOWLEDGMENTS
We would like to thank Dr. Allan Katz for funding this work and for helpful technical
discussions. He correctly suggested that development of a fiber spreading technique was critical
to success of this project. Dr. Paul Jero is also acknowledged for his technical input to this
program and his thorough, constructive review of this report.
69

9. REFERENCES
1. C.F. Powell, I.E. Campt'211, and B.W. Conser, "Vapor Plating," pp. 9-11, John Wileyand Sons, NY, 1955.
2. P.H. Higgs, R.L. Finicle, R.J. Bobka, E.J. Seldin, and K.J. Zeitsch, "Research andDevelopment on Advanced Graphite Materials," Report No. WADD TR 61-72, May1964.
3. E. Saunders, Martin Weinstein, and A.I. Mlavsky, "Radiant Energy Reactor Techniquefor the Deposition of SiC onto Quartz Filaments," pp. 217-27 in Proceedings of theConference on Chemical Vapor Deposition of Refractory Metals, Alloys, andCompounds, American Nuclear Society, Hinsdale, IL, 1967.
4. Lloyd E. Line, Jr., and U.V. Henderson, Jr., "Boron Filament and OtherReinforcements Produced by Chemical Vapor Plating," pp. 201-36 in Handbook ofFiberglass and Advanced Plastics Composites, ed. George Lubin, Van Nostrand ReinholdCo., NY, 1969.
5. H.E. DeBolt, V.J. Krukokonis, R.M. Neff, F.E. Wawner, SAMPE, "Chemical VaporDeposition of Boron on a Carbon Monofilament Substrate," Materials Review for '72,Vol. 17, pp. II-B-Two-I - II-B-Two-10.
6. E. Fitzer, D. Kehr, and M. Sahebkar, "CVD-SiC on Carbon Fibres," pp. 33-41 inProceedings of the Third International Conference on Silicon Carbide, Miami Beach, FL.1973.
7. H.E. DeBolt, V.J. Krukonis, and F.E. Wawner, Jr., "High Strength, High ModulusSilicon Carbide Filament via Chemical Vapor Deposition," ibid., pp. 168-75.
8. W.I. Heffernan, I. Ahmad, R.W. Haskell, "A Continuous CVD Process for CoatingFilaments with Tantalum Carbide," pp. 498-508 in Proceedings of the FourthInternational Conference on Chemical Vapor Deposition, The Electrochemical Society,Inc., Princeton, NJ, 1973.
9. L. Aggour, E. Fitzer, E. Ignotowitz, and M. Sahebkar, "Chemical Vapour Depositionof Pyro-Carbon, SiC, TiC, TiN, Si and Ta on Different Types of Carbon Fibers,"Carbon 12, 358-62 (1974).
10. R. Warren and M. Carlsson, "TiC- and TiN-Coated Carbon Fibres," pp. 623-33 inProceedings of the Fifth International Conference on Chemical Vapor Deposition, TheElectrochemical Society, Inc., Princeton, NJ, 1975.
11. E. Fitzer, D. Kehr, D. Morin, and M. Sahebkar, "Deposition of Silicon Carbide onCarbon Monofilaments," ibid., pp. 589-99.
70

12. M.J. Hakim, "Chemical Vapour Deposition of Hafnium Nitride and Hafnium Carbideon Tungsten Wires," ibid., pp. 634-49.
13. V.G. Samoilenko and L.N. Pereselentseva, "Deposition of Zirconium Carbide CoatingsActing as Diffusion Barriers in Composites Consisting of a Metallic Matrix andRefractory Metal Fibers," Soviet Powder Met. and Metal Ceramics, Vol. 14, pp. 725-28,1975.
14. R.J. Imprescia, L.S. Levinson, R.D. Reiswig, Terry C. Wallace, and J.M. Williams,"Carbide Coated Fibers in Graphite-Aluminum Composites," Los Alamos ScientificLaboratory, LA-6181-PR, July 1976.
15. J.A. Comie, "Characterization, Shaping, and Joining of SiC/Superalloy Sheet forExhaust System Components," Electric Corp., Report No. NASA CR-135301, July,1977.
16. V. Krukonis, I. Chemical Vapor Deposition of Boron Filament, pp. 517-40 in Boron andRefractory Borides, Springer-Verlag, New York, 1977.
17. M.J. Hakim, Chemical Vapor Deposition, U.S. Patent No. 4,107,352, August 15, 1978.
18. L.R. Newkirk, R.E. Riley, H. Sheinberg, F.A. Valencia, and T.C. Wallace,"Preparation of Unidirectional Fiber Reinforced Tantalum Carbide Composites," pp. 488-98 in Proceedings of the Seventh International Conference on Chemical VaporDeposition, The Electrochemical Society, Inc., Princeton, NJ, 1979.
19. F.S. Galasso, R.D. Veltri, and D.A. Scola, Study of High Resistance Inorganic Coatingson Graphite Fibers, United Technologies Research Center, East Hartford, CT, NASA-CR-159078, June, 1979.
20. K. Brennfleck, M. Dietrich, E. Fitzer, and D. Kehr, "Chemicai Vapor Deposition ofSuperconducting Niobium Carbonitride Films on Carbon Fibers," pp. 300-14 inProceedings on the Seventh International Conference on Chemical Vapor Deposition, TheElectrochemical Society, Inc., Princeton, NJ, 1979.
21. R.J. Suplinskas and T.W. Henge, "A Study of the Deposition of Carbide Coatings onGraphite Fibers," Avco Specialty Materials Division, Lowell, Massachusetts, NASAContractor Report 159133, September, 1979.
22. John B. MacChesney, "Materials and Processes for Preform Fabrication-Modified
Chemical Vapor Deposition and Plasma Chemical Vapor Deposition," Proceedings of theIEEE, 68 [10] 1181-84 (1980).
23. F. Schmaderer, G. Wahl, C.H. Dustmann, and M. Dietrich, "CVD-NbC1 .yNy-CarbonFiber Superconductors," pp. 148-55 in Proceedings of the Fourth European Conference
71
on Chemical Vapor Deposition, Philips Centre for Manufacturing Technology,Eindhoven, The Netherlands, 1983.
24. E. Wilfing, F. Holub, and E. Horl, "Chemical Vapor Deposition of Nb3Sn in a FluidizedBed," ibid., pp. 156-63.
25. K. Brennfleck and E. Fitzer, "SiC-Coatings as Protective Layers for Carbon Fibers andAdhesion Promoters for Superconducting Niobium Carbonitride," ibid., pp. 370-75.
26. K. Brennfleck, E. Fitzer, G. Schoch, and M. Dietrich, "CVD of SiC-Interlayers andTheir Interaction with Carbon Fibers and with Multi-Layered NbN Coatings," pp. 649-62in Proceedings of the Ninth International Conference on Chemical Vapor Deposition, TheElectrochemical Society, Inc., Pennington, NJ, 1984.
27. F. Schmaderer, G. Wahl, M. Dietrich, and C.H. Dustmann, "Preparation of Al-Stabilized Superconducting NbC1.. Ny-Carbon Fibers," ibid., pp. 663-72.
28. Akio Shindo, "Chemical Property of Carbon Fiber Surface and Interfacial Compatibilityof Composites," pp. 93-100 in Composite Interfaces, Proceedings of the FirstInternational Conference on Composite Interfaces, North Holland, NY, 1986.
29. Kuniaki Honjo and Akio Shindo, "Interfacial Behavior of Aluminum Matrix CompositesReinforced with Ceramics-Coated Carbon Fibers," ibid., pp. 101-107.
30. Barry Bender, Damian Shadwell, Charles Bulik, Louis Incorvati, and David Lewis III,"Effect of Fiber Coatings and Composite Processing on Properties of Zirconia-BasedMatrix SiC Fiber Composites," Am. Ceram. Soc. Bull. 5 [2] 363-69 (1986).
31. Joel P. Clark and Merton C. Flemings, "Advanced Materials and the Economy,"Scientific American 25= [4] 51-58, October 1986.
32. D.K. Nath, "A Method for Strengthening Silica Fiber," J. Am. Ceram. Soc. 5 [5] 752(1986).
33. Roy W. Rice, BN Coating of Ceramic Fibers for Ceramic Fiber Composites, U.S. PatentNo. 4,642,271, February 10, 1987.
34. E. Fitzer, "Ceramic and Coated Carbon Fibers for High Temperature Ceramics," pp. 9-52 in Whisker- and Fiber-Toughened Ceramics, ASM International, 1988.
35. W.J. Lackey and T.L. Starr, "Fabrication of Fiber-Reinforced Ceramic Composites byChemical Vapor Infiltration: Processing, Structure and Properties," pp. 397-450 in FiberReinforced Ceramics, ed. K.S. Mazdiyasni, Noyes Publications, Park Ridge NJ (1990).
36. W.J. Lackey, W.B Carter, John A. Hanigofsky, D.N. Hill, E. Kent Barefield, GalinaNeumeier, David F. O'Brien, Michael J. Shapiro, John R. Thompson, Andrew J. Green,
72

and Thomas S. Moss, III, *Rapid Chemical Vapor Deposition of SuperconductingYBa2Cu3O," Appl. Phys. Lett. 5k [12] 1175-77, March 19, 1990.
37. W.J. Lackey, J.A. Hanigofsky, M.J. Shapiro, W.B. Carter, D.N. Hill, E.K. Barefield,E.A. Judson, D.F. O'Brien, Y.S. Chung, and T.S. Moss, "Preparation ofSuperconducting Wire by Deposition of YBa 2Cu3Ox onto Fibers," pp. 195-210 inEleventh International Conference on Chemical Vapor Deposition, Seattle, WA, October14-19, 1990, The E'ectrochemical Society, Pennington, NJ.
38. T.M. Besmann, Processing Science for Chemical Vapor Infiltration,Industry/Government Briefing, Oak Ridge National Laboratory, Oak Ridge, TN,November 9, 1990.
39. W.J. Lackey, John A. Hanigofsky, Michael K. Groves, and Joseph A. Heane),"Continuous Fiber Coating System," pp. 1048-63 in Proceedings of the 15th AnnualConference on Composites and Advanced Ceramics, Cocoa Beach, FL, The AmericanCeramic Society, January 13-16, 1991.
40. W.J. Lackey et al., "Ceramic Coatings for Heat Engine Materials-Status and FutureNeeds, ORNL/TM-8959, Oak Ridge National Laboratory, Oak Ridge, Tennessee.
41. T. Narushima, T. Goto, and T. Hirai, "High-Temperature Passive Oxidation ofChemically Vapor Deposited Silicor Carbide," j. Am. Ceram. Soc., 72 [8] 1386-90(1989).
42. G.S. Corman, "Creep of Oxide Single Crystals," GE Corporate Research andDevelopment Center, WRDC-TR-90-4059, Materials Laboratory, WRDC, Wright-Patterson AFB, OH, August 1990.
43. Eriksson, G., "Thermodynamic Studies of High Temperature Equilibria," ChemicaScripta, 8, (1974).
44. D.R. Lide, Jr., (ed.), Janaf Thermochemical Tables, 3rd edn., Vols. I and II, AmericanChemical Society and American Institute of Physics for National Bureau of Standards(US), 1985.
45. I. Barin, 0. Knacke and 0. Kubaschewski, Thermochemical Properties of InorganicSubstances: Supplement, Springer, Berlin, 1977.
46. Satterfield, C.N. and Sherwood, T.K., "The Role of Diffusion in Catalysis, Chapter 3,Addison-Wesley Publishing Co., Inc., Reading, MA (1963).
47. Starr, T.L., "Modeling of Forced Flow/Thermal Gradient CVI," Proceedings onInternational Conference on Whisker- and Fiber Toughened Ceramics," pp. 1-6, June 7-9,1988, Oak Ridge, TN.
73

48. Starr, T.L., "Model for Rapid CVI of Ceramic Composites," pp. 1147-55 in Proceedingsof the 10th Int. Conf. on CVD, October 1987, Edited by G.W. Cullen, The Electro.Chem. Soc., Pennington, NJ, Vol. 87-88.
49. Besmann, T.M., Sheldon, B.W., and Kaster, M.D., "Temperature and ConcentrationDependence of SiC Deposition on Nicalon Fibers," Surface and Coatings Technology,43/44, 167-175 (1990).
50. l.A. Hanigofsky, "Modeling of the Chemical Vapor Deposition of YI3a 2Cu30z, TiB•, andSiC Thin Films Onto Continuous Ceramic Tows," Ph.D. Dissertation, School ofMaterials Engineering, Georgia Institute of Technology, Atlanta, GA, September, 1992.
51. C.H. Hsueh, P.F. Becher, and W.J. Lackey, "Thermal and Mechanical Induced Stressesin Superconducting YBa2Cu3O1 Coatings on Fibers," J. Appl. Phys. 70(3), 1337-41,August 1, 1991.
52. M.G. Ellenburg, J.A. Hanigofsky, and W.J. Lackey, "Thermal Stress Analysis forCoated Fibers," submitted to J. Mater. Res., April, 1993.
53. C. Kim and R.A. Gray, "Pneumatic Induction Fiber Spreader with Lateral VentunRestrictors," Dept. of :he Navy, Office of the Chief of Naval Research, patentapplication, Serial Number 131,684, 1987.
54. i.E. Sheehan, J.T. Porter, C.H. Meyers, R.J. Price, and R. Bacon, "Coated CarbonFiber Development for Oxidation Protection of Carbon-Carbon Composites," InterimProgress Report No. 10, Contract No. F33615-88-C-5449, MSNW, Inc., San Marcos.CA 1990.
74

APPENDIX A
Mathematical Development of Process Model
75

APPENDIX A
Mathematical DeYelopment of Process Model
This appendix describes the theoretical derivation for the solution to the partial
differential equation which relates the competition between the reaction rate and diffusion
steps for a chemical process. A brief description of the Chapman-Enskog pseudo-binary
diffusion coefficient calculation is also presented.
The solution procedure is similar to the catalysis work presented by Satterfield
and Sherwood"; however, the catalysis work they presented is for spherical coordinates.
The fiber processing problem utilizes cylindrical coordinates, which complicates the
analysis. Instead of a theoretical solution a series solution is required. For the zero
order reaction rate (Rate = K,) the differential equation can be written as:
d 2 c i dc Kvdr 2 r dr D
multiplying through by r2 gives:
2 d 2c + dc Kv 2
dr 2 dr D
76

A complete solution of the equation consists of a solution of the •mnogeneous
equation and the particular solution.
The homogeneous equation is:
,2A dc + dc =0
dr 2 dr
This second order homogenous ordinary differential equation has the form of a
Cauchy-Euler Equation, which has the general solution:
Ch - A + Blnr where A, B are constants
The solution to the homogeneous part can be verified by inserting the solution into the
differential equation, e.g.:
dc_ 1 d 2 c 1dr r dr 2 r2
S1-- 2 +rI- = 1-1 = 0r2 r
Ch = A + Bin z
Using the first boundary condition:
77

c finite B a 0
Ch = A C - c, + particular solution
The particular solution is solved as follows:
Choosing a solution for the equation, where B is a constant
C, = BrA. Plugging this expression into the differential equation:
S= 2Brdr
d2 c, 2d-- = 28
dr 2
Setting the two sides of the equation equal:
r 2 "2B + r'2Br = LrD
4Br 2 = =r2D
B r 2 which is the value for the constant B:4D
CP =S4D
78

c = ch + c. defines the complete solution:
Kv=A + Z
4D
The value for A can be determined using the following boundary condition:
dc- - = = 02 K-0
K•CIZ.R = Ca = A + KDR
K.
A -cR- -R 2
4D
'Tr, 2 R D 2
CIZ..R = CR A + -vR 2
4D
A Cj v4 D
The solution for the zero order reaction rate for the differential equation is:
C(r) = C- -(R r)4D
79

or, in a more convenient form:
C a 1 K'EL(R2 - Z2)
CFR 4CRtD
The Ist order reaction expression, Rate = KC results in the ordinary differential
equation:
d2c + 1 dc K cdr 2 r dr D
which can be rewritten as:
d2_fc + rd_ Ka r2c o
dr 2 dr D
Defining a constant W for convenience:
W = r
so:
;f2 = v Kw2
D
The differential equation can be rewritten in terms of W, which is presented in several
steps:
dc dc dw [ dcdr dWd NY
80

dc 1 i • dc dc
drc d [ ic _ d1 W dc _Wd 2c dc
dr2 4, D dw2 dw2
D
The differential equation in terms of W becomes:
W2d 2c +w-WCdw 2 dw
The second order ordinary differential equation is a Modified Bessel Function, which can
be solved using a series solution in terms of W:
81

Let C(W) = £ atWttoo
CI(W) at" twL-IC-O
c-O
W2CI + WC' - W2C = 0
The series form of the differential equation is:
t at. t(t-l)wt + t a. twe- aW t 2 0-Oo t.O too
i at t(t-l)wt + t -t aUwt*2 0t-2 t-1 -Oo
This equation is used to solve for the a, term:
aW+ t a," t(t-1)We + t attWt- i atW Pa = 0
j t-2 j =t-2
At this point, changing the index is used to match powers with the last term:
a. - 0 since the w-terms are linearly independent:
Uo aj. 2 (_+2) (J+l) W'" + To aj,2 (j+2) WJ÷2
82

-• awi"2 = 0
The equation can be simplified into:
S{a [(j +2) (j + 1) + (j + 2)] -aj w + = 0
The coefficients mast be zero since the Wi + 2 are linearly independent.
For the even values:
aj+ 2 (J + 2) [(j+ 1) + ] = aj
a,+2 =. recall(j + 2) 2 a- 0
a.a2 - T22a2= a0
a 4 = a42
ao
42.22a4a6 - 62
ao62-42.22
doa. 82 .42.22
a2j ao
7(2t)2
For the odd values, all odd coefficients are zero, since they are linearly dependent on the
83

a, coefficient.
a3 3 2
a3a. 52=0
a2j . 1 * 0
The even coefficients can be rewritten as a product under the summation:
a6 = 3ni (2t)2
t-1
aas before22.42 2 a
C(N) = ao O t.o it (2K) 2
K-1
0
where x (2K) 2 =: 1K-i
By our own definition:
84

W =
Cl(r) = 4o 2
t.o o (2X) 2K-i
At r =R:
C(R) = CR =cao 2
x (2K) 2
K-1
a° = CR
25 2C.o x (2K) 2
- r I 20
Cp (2K) 2CRR
C •-o it (2K)2
t-O (2K) aK-1
which is the final solution to the first order reaction rate differential equation.
Proof that C(W) satisfies the differential equation:
W2-d2C + w--dc - W2C = 0
dw2 dw
Ignore ao since it cancels:
t = I term:
85

C(W) = ao w2tto0 (2K)2
X-1
1 Wa.• 12/ +W t-1 w (2K) 2
K-i
dc 2 2t(2 W2tl
x (2K) 2K-i
d 2t(2t-) 2 t1) W22
dW2 t:=
wl wi1 (2K)2ir-
2 (2t-1) + 2 t -- W2 =0
C -1 c (2K) 2 t- C i c (2K) 2
K -i K-1t C(2t) 2 -W2 2] t - W2tai w (2K)3
K-1
4 W2 W2 = 0 equation is satisfied for W 2 term
(2 t) 2 w2C - w~t+2 0tw (2K)2 C-i 7t (2K) 2
K-i K-1
2j =2(t + 1)
j-t+l
86
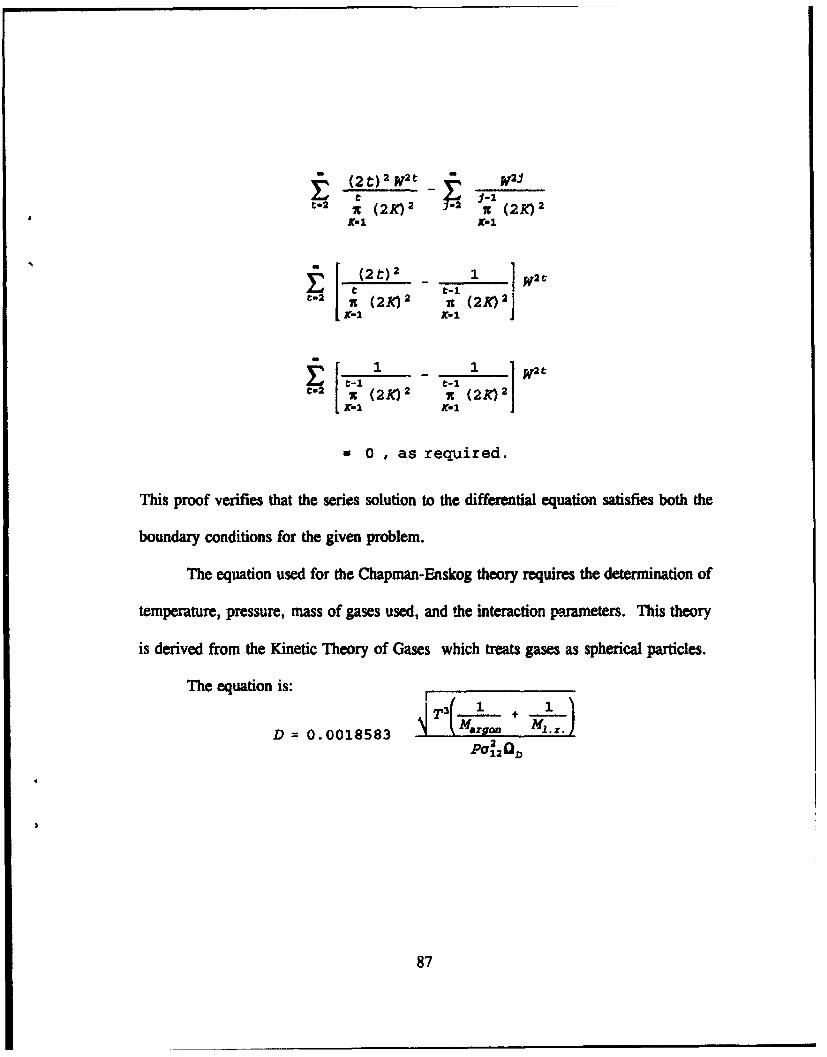
S(2 t) 2 N2t W2J
x (24 2 7 (4i
- 12K) 2 i (2K.) 2
_____ 1 1W2 tSx (2K) 2 x 2K) 2
X1K-1
0 0 , as required.
This proof verifies that the series solution to the differential equation satisfies both the
boundary conditions for the given problem.
The equation used for the Chapman-Enskog theory requires the determination of
temperature, pressure, mass of gases used, and the interaction ptrameters. This theory
is derived from the Kinetic Theory of Gases which treats gases as spherical particles.
The equation is:
D= 0.0018583 2, M1 .v.
87

APPENDIX B
Computer Program for Process Model
88
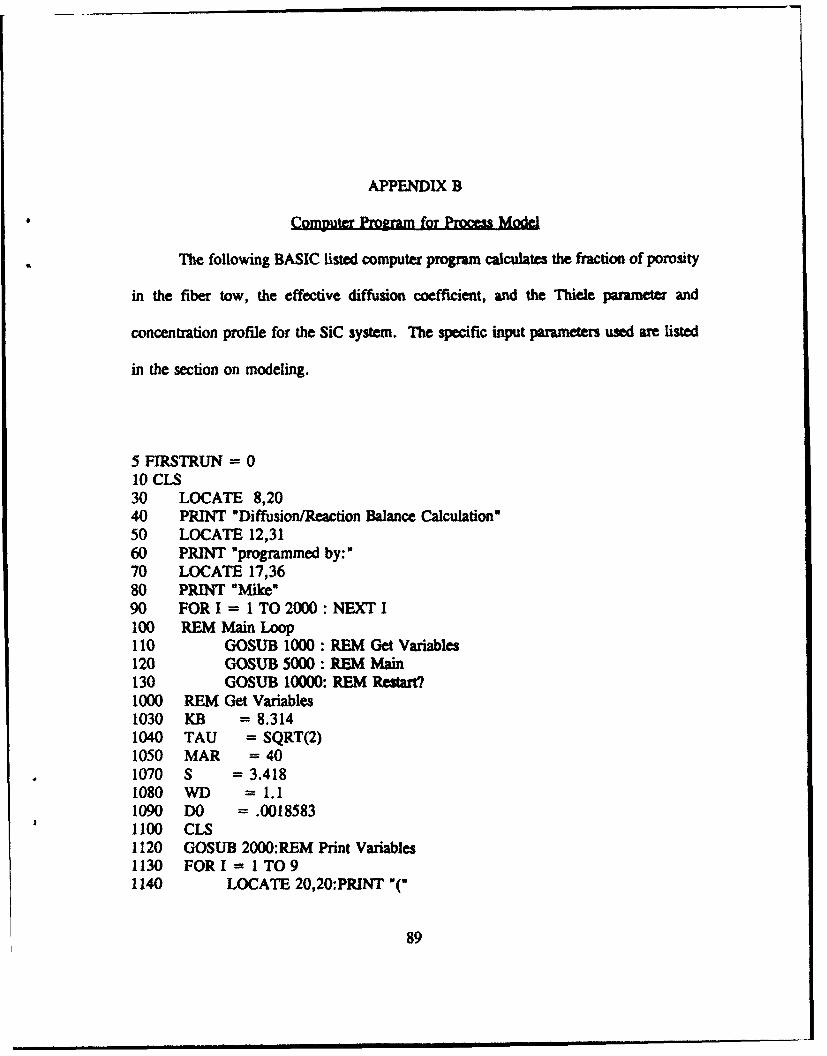
APPENDIX B
Co0rputer Program for Process Model
The following BASIC listed computer program calculates the fraction of porosity
in the fiber tow, the effective diffusion coefficient, and the Thiele parameter and
concentration profile for the SiC system. The specific input parameters used are listed
in the section on modeling.
5 FIRSTRUN = 010 CLS30 LOCATE 8,2040 PRINT "Diffusion/Reaction Balance Calculation"50 LOCATE 12,3160 PRINT "programmed by:"70 LOCATE 17,3680 PRINT "Mike"90 FOR I = I TO 2000: NEXT I100 REM Main Loop110 GOSUB 1000 : REM Get Variables120 GOSUB 5000 : REM Main130 GOSUB 10000: REM Restart?1000 REM Get Variables1030 KB = 8.3141040 TAU = SQRT(2)1050 MAR = 401070 S 3.4181080 WD = 1.11090 DO = .00185831100 CLS1120 GOSUB 2000:REM Print Variables1130 FORI = ITO91140 LOCATE 20,20:PRINT "(
89

1150 LOCATE 20,24:PRINT1155 LOCATE 20,21:PRINT 11157 LOCATE 20,27:INPUT VAR1158 IF VAR = 0 THEN 11401159 LOCATE 20,20: PRINT "1160 IF VAR = -1 THEN GOTO 11801161 IF VAR = -2 THEN GOTO 12001165 LOCATE 20,20: PRINT *
1170 GOSUB 3000:REM Index Variables1180 NEXT I1190 GOTO 11301200 RETURN2000 LOCATE 5,102010 PRINT "(1) ..... T - temperature (K) = ";T;2015 LOCATE 6,102020 PRINT "(2) ..... P - pressure (atm) =;P;2025 LOCATE 7, 102030 PRINT "(3) ..... R - tow radius *;RT;2035 LOCATE 8,102040 PRINT "(4) ..... Cs - initial concentration = CS;2045 LOCATE 9,102050 PRINT "(5) ..... KO - rate constant =;K0;2055 LOCATE 10,102060 PRINT "(6) ..... Ea - activation energy =";EA;2065 LOCATE 11,102070 PRINT "(7) ..... Mlr- mass of lir. reactant = ";MLR;2075 LOCATE 12,102080 PRINT "(8) ..... r - fiber radius = ";RF;2085 LOCATE 13,102090 PRINT "(9) ..... N - # of filaments =;N;2200 RETURN3000 REM Index Variables3010 IFI = ITtENT =VAR3020 IFI=2THENP =VAR3030 IFI=3THENRT =VAR3050 IFI =4THENCS =VAR3060 IFI =5THENKO=VAR3070 IFI=6THENEA =VAR3080 IFI = 7THENMLR= VAR3090 IFI = 8THENRF -VAR3100 IFI=9THENN =VAR
90

3110 GOSUB 29003120 RETURN5000 REM Main5005 GOSUB 6000: REM Get Constants5010 CLS5020 LOCATE 20,205030 INPUT "# of points";Q5035 IF FIRSTRUN = 0 THEN DIM RATIO(Q)5040 FORI = 1TOQ5050 R = RT*(I-I)/(I-Q)5065 GOSUB 9000: REM Print Data5070 NEXT I5080 RETURN6000 REM Get Constants6005 PRINT P6010 D = DO*(((fA3)*((I/MAR) + (I/MLR)))A.5)/(P*(S^2)*SWD)6020 THETA = 1-(((RF/RT)A2)*N)6030 DEFF = D*THETA/I1.4146040 SV = 2*RF*N/(RTA2)6050 KS = K0*EXP(-(EAI(KB*T)))6060 KV = KS*SV6070 PHI2 = KV*(RTA2)/DEFF6080 PROD = 1 : PHISUM = 0: RATIO 06090 RETURN9000 REM Print Data9010 CLS9015 LOCATE 1,20: PRINT "Kv y";KV9020 LOCATE 3,209030 PRINT "Thiele Modulus ="; PHI29040 LOCATE 5,209050 PRINT "Deff -"; DEFF9055 LOCATE 7,209057 PRINT "Theta ""THETA9060 LOCATE 10,159070 PRINT " R"9080 LOCATE 11,159090 PRINT" ------------9100 LOCATE 10,359110 PRINT "Cr/Cs"9120 LOCATE 11,359130 PRINT "-----"
91

9140 FORI = ITOQ9150 LOCATE I+11, 17:RADIUS = RTO(1-I)/(I-Q)9160 PRINT RADIUS9170 LOCATE 1+11,359180 PHI = PHI2A.5: W = RADIUS/RT9181 FOR J =0 TO 49182 FORK =1TO J9183 PROD - PROD * ((2*K)^2)9184 NEXT K9185 RATIO - RATIO + (((PI*w)&(2*W)/PROD)9186 PHISUM- PHISUM + ((PHIM(2-J))/PROD)9187 NEXT J9188 RATIO = (RATIO/PHISUM)9189 PROD = 19194 PRINT RATIO: RATIO = 0 : PHISUM - 0 : PROD - 19195 NEXT I9200 A$= INKEY$9210 IF LEN(A$) = 0 THEN 92009220 RETURN10000 CIS : FIRSTRUN = I10010 LOCATE 20,2010020 INPUT "Another Rtm(l - YES ; 2 - No)?,ANSWER10030 IF ANSWER = 2 THEN CLS10040 IF ANSWER = I THEN GOTO 100 ELSE END
92

APPENDIX C
Statistical Analysis
93

APPENDIX C
Statisti.W AnLlylb
The statistical analyses were performed using the commercially available code
STATGRAPHICS. This code permits determination of which prooe; variable, or variables,
have an influence on the various product attributes. Least squares regression analysis permits
the fitting of equations such as the following:
y =A+BX1 +CX 2 +DX 3
where y represents product attributes such as strength, fiber weight (or weight gain), surface
roughness, and agglomeration, and X,, X. and X3 represent process variables such as reactor
temperature, MTS flow rate, and hydrogen flow rate. For this study we also performed the
analyses (using STATGRAPHICS) that permitted determination of whether the squared (e.g. X,2)
and interaction terms (e.g. XJX 2) should be incorporated into the model equation. For the data
analyzed here, these higher order terms were generally not statistically significant so the above
equation containing only linear terms was used. It can be seen from Table C-I that the equation
relating fiber weight (mg) after coating to the process variables (X, = temperature, X2 = MTS
flow rate, and X3 = hydrogen flow rate) is:
Fiber Weight = - 0.106858 + (1.33727E-4) X, + (6.7476E-3) X2 - (0.0128031) X3
Once the constants for the above regression equation are determined it is possible, again
using STATGRAPHICS, to generate contour plots such as the ones shown in Figures 25 and 26.
These plots are generated from the regression equation and are the best predictions of how the
process variables influence the particular response variable (product attribute) being studied.
94

Another useful statistical procedure is generation of the analysis of variance table (see
Tables C-i to C-3). This analysis shows how much of the variation of the response is caused
by the process variables. For example, the "Sum of Squares" column in Table C-I shows that
the MTS flow ,ate (sum of squares = 0.004997) accounts for more of the variation observed
for fiber weight than the other two process variables. The same column shows that temperature
had a stronger influence than hydrogen flow rate. The column labeled "Mean Square" is
obtained by dividing the sum of squares by the degrees of freedom. The column labeled "F-
Ratio" is obtained by dividing the mean square by the "error mean square". The F-Ratio is
useful in that it permits quantification of the confidence we have that a particular process
variable is having a real influence on the response. For example, the right most column, labeled
"P-Value", is the probability that data showing this much variation (or correlation with a
particular process variable) would have been obtained even if there was not a real cause and
effect relationship. For example, in Table C-i the "P-Value" for "Temperature" is 0.0040.
This means that if temperature was not influencing the fiber weight (i.e. the amount of coating
deposited) then data showing this much correlation between fiber weight and temperature would
be obtained (on average) only 4 times out of 1000 trials. That is, we are 99.6% confident that
the reactor temperature influences the fiber weight.
Other useful values are included in the following tables. The first column of numbers
gives the values for the coefficients (e.g. A, B, C, and D) in the model equation. The
correlation coefficient (R2) is a measure of how well the regression equation describes the
experimental data, i.e., a measure of the degree of fit. The R2 value theoretically varies from
zero to unity. Values closer to unity indicate a better fit.
95

Table C-1. Analysis of Variance for Fiber Weight (mg).
Regression Sum of Mean F- P-Effect Coefficient Squares D.F. Square Ratio Value
Constant -0.106858(i.e., A)
Temperature 1.33727E-4 0.00294869 1 0.0029487 12.63 0.0040(°C)
MTS Flow Rate 6.7476E-3 0.00499673 1 0.0049967 21.41 0.0006(g/min)
Hydrogen Flow -0.0128031 0.00096938 1 0.0009694 4.15 0.0642Rate (/mrin)
Error 0.00280111 12 0.0002334
Total 0.01311668 15
R-squared = 0.786
96

Table C-2. Analysis of Variance for Surface Roughness (arbitrary scale from 1 to 10 with 10being roughest).
Regression Sum of Mean F- P-Effect Coefficient Squares D.F. Square Ratio Value
Constant -4.52767(i.e., A)
Temperature 9.12269E-3 13.7226148 1 13.7226148 3.38 0.0907(°C)
MTS Flow Rate 0.341039 12.7642586 1 12.7642586 3.15 0.1014(g/min)
Hydrogen Flow -2.33477 32.2368567 1 32.236857 7.95 0.0155Rate (f/min)
Error 48.6660916 12 4.055508
Total 113.000000 15
R-squared = 0.569
97

Table C-3. Analysis of Variance for Agglomeration (%).
Regression Sum of Mean F- P-Effect Coefficient Squares D.F. Square Ratio Value
Constant -139.323(i.e., A)
Temperature 0.138539 3164.7003 1 3164.700 5.69 0.0344(°C)
MTS Flow Rate 9.57144 10054.0619 1 10054.0619 18.08 0.0011(g/min)
Hydrogen Flow -13.3184 1048.9897 1 1048.9897 1.89 0.1948Rate (f/min)
Error 6674.2691 12 556.189
Total 22946.4375 15
I I H I -- -
R-squared = 0.709
98
II.S. GOVERNMENT PRINTING OFFrICE /'fl-11