445772_forrester tei - the total economic impact of private cloud
DESCRIPTION
total economic impact private cloudTRANSCRIPT

A Forrester Total Economic
Impact™ Study
Commissioned By
Dell
Project Director:
Sarah Musto
June 2015
The Total Economic Impact™ Of Private Cloud Cost Savings And Business Benefits Enabled By Private Cloud

Table Of Contents
Executive Summary .................................................................................... 3
Disclosures .................................................................................................. 4
TEI Framework And Methodology ............................................................ 5
Analysis ........................................................................................................ 6
Financial Summary ................................................................................... 22
Appendix A: Composite Organization Description .............................. 23
Appendix B: Total Economic Impact™ Overview ................................. 25
Appendix C: Forrester And The Age Of The Customer ....................... 26
Appendix D: Glossary ............................................................................... 27
ABOUT FORRESTER CONSULTING
Forrester Consulting provides independent and objective research-based
consulting to help leaders succeed in their organizations. Ranging in scope from a
short strategy session to custom projects, Forrester’s Consulting services connect
you directly with research analysts who apply expert insight to your specific
business challenges. For more information, visit forrester.com/consulting.
© 2015, Forrester Research, Inc. All rights reserved. Unauthorized reproduction is strictly prohibited.
Information is based on best available resources. Opinions reflect judgment at the time and are subject to change. Forrester®, Technographics®, Forrester Wave, RoleView, TechRadar, and Total Economic Impact are trademarks of Forrester Research, Inc. All other trademarks are the property of their respective
companies. For additional information, go to www.forrester.com.

3
Executive Summary
Dell commissioned Forrester Consulting to conduct a Total
Economic Impact™ (TEI) study and examine the potential
return on investment (ROI) enterprises may realize by
investing in an on-premises private cloud. The purpose of this
study is to provide readers with a framework to evaluate the
potential financial impact of an on-premises private cloud
deployment on their organizations and to understand how
leveraging private cloud can help their organization win,
serve, and retain customers.
To better understand the benefits, costs, and risks associated
with a private cloud deployment, Forrester surveyed 40 current users and interviewed two current users of private cloud. A
private cloud deployment provides on-demand self-service access to virtualized infrastructure resources, resource pooling,
rapid elasticity, and the ability to measure usage by business unit. Private clouds can also provide security and performance
benefits from behind the organization’s firewall.
Prior to investing in private cloud, these organizations had constrained data centers and manual processes that created
inefficiencies in application delivery and performance. While they had begun virtualizing some of their resources, continuing
frustration often led the business to look to external resources. These organizations viewed the private cloud investment as a
way to significantly improve the ability of developers and end users to rely on internal resources. In progressing toward this
goal, the organizations prioritized asset consolidation and virtualization, boosting effective utilization rates and cutting costs.
Through extensive automation and process improvement, they have been able to create time savings for the IT team and
end users, speed time-to-market for application development, and capture incremental revenue.
ON-PREMISES PRIVATE CLOUD INVESTMENTS IMPROVE EFFICIENCY AND REDUCE COSTS
Our interviews and surveys with existing on-premises private cloud adopters and subsequent financial analysis found that a
composite organization based on these adopters experienced the risk-adjusted ROI, benefits, and costs shown in Figure 1.
See Appendix A for a description of the composite organization.
The analysis points to three-year benefits of $13,545,616 versus three-year costs of $6,406,435, adding up to a net present
value (NPV) of $7,139,181.
With private cloud, IT management efficiency was improved 10%, application delivery was reduced by 30 days, and the
composite organization experienced additional savings in business end user productivity and hardware, software, and
facilities cost savings.
FIGURE 1
Financial Summary Showing Three-Year Risk-Adjusted Results
ROI: 111%
NPV: $7,139,181
Payback: 13.2 months
Time savings: IT FTEs: 10% Business: 4%
Source: Forrester Research, Inc.
The three-year risk-adjusted benefits for a
composite organization of 15,000 employees,
based on interviews and a survey, are:
• IT efficiency and business productivity:
$6,556,000.
• Hardware, software, and facilities cost
savings: $6,980,000.

4
› Benefits. The composite organization experienced the following risk-adjusted benefits that represent those experienced by the interviewed and surveyed companies:
• Five percent to 10% time savings for IT management and support. IT operations staff along with application
developers and owners saw time savings in management and support activities from process improvement and
automation. Automated resource provisioning also helped speed project delivery by 30 days.
• Improved business agility and productivity. The composite organization generated $1 million in incremental
revenue each year on average from application performance improvement and innovation enabled by private cloud.
Business end users achieved a 4% productivity boost due to reduction in project times as well as from more reliable
applications.
• Server and facilities cost savings of $1,291,240 over three years. The composite organization was able to retire
a number of physical servers as well as avoid future purchases due to consolidation and improved asset utilization.
• Software, storage, and networking cost savings of up to $2,324,000 by Year 3. Consolidation, virtualization,
and much higher utilization enable these cost savings.
• Improved security and compliance. The composite organization is able to avoid two small security breaches as
well as reduce compliance and litigation costs by $330,000.
• Reduced downtime, providing costs savings of $285,000 per year. The composite organization has better
security control with private cloud usage and is able to reduce outages and other performance issues.
› Costs. The composite organization experienced the following risk-adjusted costs:
• Hardware and facilities costs. These include upfront hardware costs of $555,000 along with hardware refresh
costs each year. The composite also requires $90,000 in additional power, cooling, and space.
• Software license costs of $107,100 upfront and $168,000 ongoing. This is for software associated with the
private cloud deployment.
• Resource costs of $1,792,000 upfront and $903,000 ongoing. These include upfront professional services
support costs and ongoing vendor support. These costs also include internal IT full-time equivalent (FTE) time spent
on implementation and deployment, along with ongoing management, support, and enhancements.
• $144,540 in upfront training costs. This is for approximately two weeks of training for core leaders.
Disclosures
The reader should be aware of the following:
› The study is commissioned by Dell and delivered by Forrester Consulting. It is not meant to be used as a competitive analysis.
› Forrester makes no assumptions as to the potential ROI that other organizations will receive. Forrester strongly advises that readers use their own estimates within the framework provided in the report to determine the appropriateness of an
investment in private cloud.
› Dell reviewed and provided feedback to Forrester, but Forrester maintains editorial control over the study and its findings and does not accept changes to the study that contradict Forrester's findings or obscure the meaning of the study.
› Dell provided the interview contact for one of the interviews.
5
TEI Framework And Methodology
INTRODUCTION
From the information provided in the interviews, Forrester has constructed a Total Economic Impact (TEI) framework for
those organizations considering implementing private cloud. The objective of the framework is to identify the cost, benefit,
flexibility, and risk factors that affect the investment decision and to help organizations understand how to take advantage of
specific benefits, reduce costs, and improve the overall business goals of winning, serving, and retaining customers.
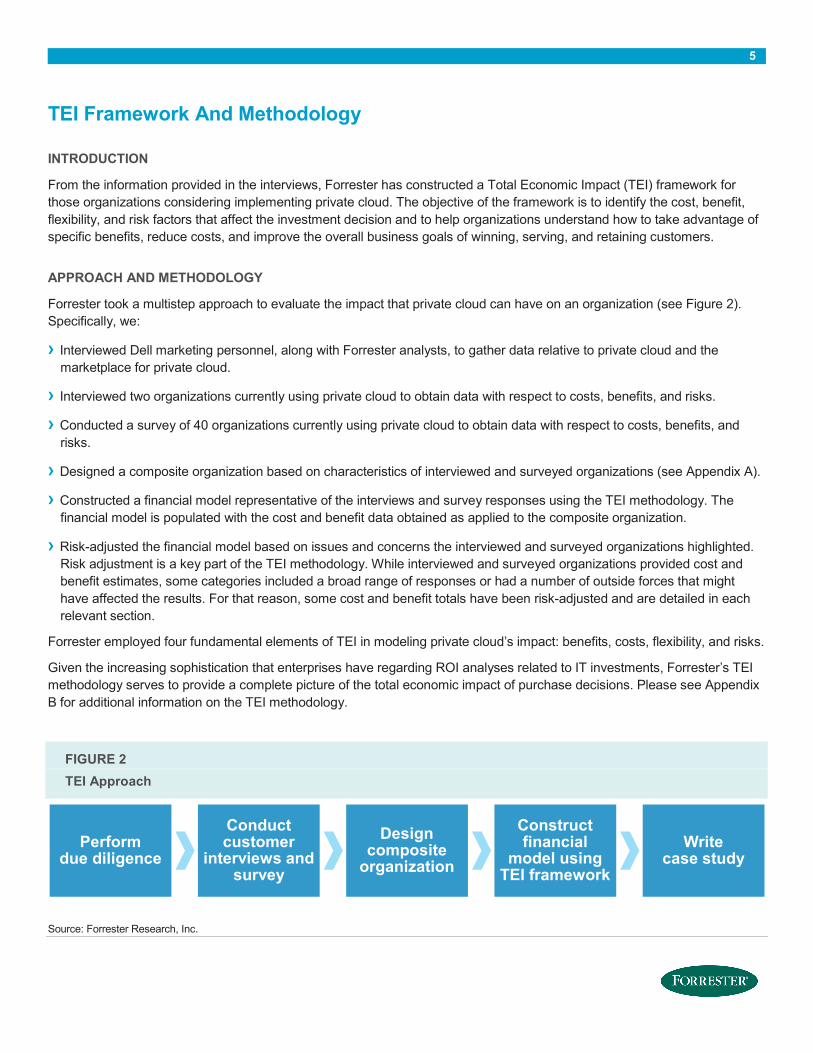
APPROACH AND METHODOLOGY
Forrester took a multistep approach to evaluate the impact that private cloud can have on an organization (see Figure 2).
Specifically, we:
› Interviewed Dell marketing personnel, along with Forrester analysts, to gather data relative to private cloud and the marketplace for private cloud.
› Interviewed two organizations currently using private cloud to obtain data with respect to costs, benefits, and risks.
› Conducted a survey of 40 organizations currently using private cloud to obtain data with respect to costs, benefits, and risks.
› Designed a composite organization based on characteristics of interviewed and surveyed organizations (see Appendix A).
› Constructed a financial model representative of the interviews and survey responses using the TEI methodology. The financial model is populated with the cost and benefit data obtained as applied to the composite organization.
› Risk-adjusted the financial model based on issues and concerns the interviewed and surveyed organizations highlighted. Risk adjustment is a key part of the TEI methodology. While interviewed and surveyed organizations provided cost and
benefit estimates, some categories included a broad range of responses or had a number of outside forces that might
have affected the results. For that reason, some cost and benefit totals have been risk-adjusted and are detailed in each
relevant section.
Forrester employed four fundamental elements of TEI in modeling private cloud’s impact: benefits, costs, flexibility, and risks.
Given the increasing sophistication that enterprises have regarding ROI analyses related to IT investments, Forrester’s TEI
methodology serves to provide a complete picture of the total economic impact of purchase decisions. Please see Appendix
B for additional information on the TEI methodology.
FIGURE 2
TEI Approach
Source: Forrester Research, Inc.
Perform due diligence
Conduct customer
interviews and survey
Design composite organization
Construct financial
model using TEI framework
Write case study

6
Analysis
COMPOSITE ORGANIZATION
For this study, Forrester conducted a total of two interviews with representatives from the following companies:
› A large organization based in the United States that has been using private cloud for approximately four months. The organization also utilizes public cloud resources and has been investing in private cloud to streamline technology use and
processes, protect data from external threats, and gain better visibility and control over costs.
› A global organization headquartered in the United States with over $50 billion in revenue in the most recent fiscal year and over 100,000 employees. The organization has been using private cloud for over four years and also utilizes public cloud
resources. The organization invested in private cloud to realize cost benefits through more efficient use of resources and
achieve greater flexibility and agility through effectively supporting business units with resources in-house.
For this study, Forrester also fielded a survey to 40 respondents, representing a broad range of organizations:
› These organizations have at least 1,000 to over 20,000 employees, and the majority of the organizations had over $1 billion in revenue in the most recent fiscal year.
› Prior to the investment in private cloud, most of these organizations had virtualized less than 50% of their infrastructure environment. Approximately half of the respondents were also using public cloud resources at the time of the private cloud
investment.
› Thirty-seven percent of the respondents have been using private cloud for 7 to 12 months, while 50% have been using private cloud for one or more years.
Based on the interviews and survey, Forrester constructed a TEI framework, a composite company, and an associated ROI
analysis that illustrates the areas financially affected. The composite organization, referred to as The Organization, that
Forrester synthesized from these results represents an
organization with the following characteristics:
› It is a global US-based organization with recent fiscal year revenue of $3.7 billion.
› It has 15,000 employees, with approximately 245 IT FTEs.
› It has been using its on-premises private cloud for three years.
INTERVIEW HIGHLIGHTS
Situation
Leading up to the decision to invest in private cloud, The
Organization assessed its infrastructure investments and ability
to support current and future business initiatives. The
Organization identified the following challenges and objectives:
› The Organization had several data centers with a lot of spare capacity and had already made investments in virtualization for
smaller and less demanding systems. While these efforts were
often requested by business units, full-scale virtualization was
not yet a priority. The Organization wanted to leverage the investments it had already made for future initiatives.
“If we hadn’t gone the private
cloud route, we would have
been inundated with physical
servers. Our data centers were
constrained already, and we
didn’t want to build new ones,
or our users would have gone
third party.”
~ Staff technologist

7
› Within its data center, The Organization had multiple silos of legacy infrastructure that were disconnected and often managed separately. The resulting complexity in management and visibility led to inefficiencies for IT FTEs in day-to-day
operations and constrained IT budgets. The Organization needed to find ways to automate and remove these
management challenges and better manage costs.
› Provisioning of resources was often a lengthy process, which frustrated business users and application developers responsible for innovation and operational efficiency. This meant that some business units relied on public cloud
resources, circumventing IT, which could be more costly and less reliable than using internal resources. Additionally, many
mission-critical applications and services were not well-suited to a public cloud delivery model due to performance,
security, and compliance concerns. The IT organization was trying to find ways to deliver services and resources internally
in a more efficient fashion, utilize the excess capacity that existed and avoid data center expansion, and become a reliable
and responsive value partner to the business.
› Data security and the performance of applications are vital for The Organization’s operations. The IT team wanted to improve security, increase performance, and minimize outages to enable increased productivity for end users.
Solution
The Organization made the decision to invest in private cloud for its ability to provide flexibility and agility to business units
and developers, simplify IT management, and reduce costs.
› The Organization spent seven months on the initial implementation and deployment of its private cloud. The Organization continued to make additional smaller investments to enhance its private cloud over the course of the following three years
that the private cloud was used.
› The first phases focused on increased server virtualization, consolidation, and pooling of resources. Additionally, the IT team prioritized streamlining and improving processes along with automation. Eventually, The Organization was able to
provide on-demand self-service access to developers and
business units. The Organization then focused on providing a
platform for application developers to build and host
applications in the cloud. The Organization continues to use
public cloud resources for some applications and to increase
scalability and provide burst capacity for applications and
services within the on-premises private cloud.
› Currently, The Organization supports almost one-third of its application portfolio within the private cloud, and 42% of
business units are utilizing private cloud resources.
Results
The interviews and survey results revealed several common
themes:
› The investment in private cloud resolved key challenges in
the delivery of IT services. Some of the most significant IT challenges prior to the private cloud deployment were high
levels of infrastructure complexity from silos of legacy infrastructure, IT inefficiencies affecting the ability to support
business needs, and an inability to use public cloud resources due to security and regulatory hurdles. With the private
cloud, the IT team can not only better support existing applications but also provide the agility the business needs to
innovate.
“Service delivery time shifted
when we deployed on-demand
provisioning for compute and
storage. Before it would take
weeks and months, and now it
takes minutes. This is an
enabler for the business.”
~ Staff technologist

8
› Most organizations believe that a private cloud investment provides an important alternative to public cloud
resources. For many applications, the private cloud can be a more cost-effective delivery model over the long term than
solely relying on public cloud. As private cloud benefits scale over time, the cost to provide additional capacity goes down.
In addition, organizations believe that business needs can be more effectively met by IT and private cloud resources, in
conjunction with public cloud usage, versus using just public cloud. The flexibility of on-premises private cloud easily allows
integration and governance of public cloud services, creating hybrid cloud extension within the portfolio of IT services.
› An important benefit to private cloud is the ability to do more with less. The private cloud investment enables higher
utilization of assets, driving down the costs to provision virtual machines (VMs) and, in turn, applications. These higher
utilization rates prevent otherwise costly growth by helping
organizations get more out of their physical assets. Additionally,
system administrators become more efficient and are able to
support a greater footprint of resources over time. This allows
organizations to retain and redirect valuable IT talent to higher-
impact projects and avoid unnecessary expansion.
› In order to maximize the value from a private cloud
investment, business leaders and IT management need to be
a driving force for change. With such a transformational
investment, one of the keys to success is business leaders and
IT management promoting and encouraging new usage patterns
and ways for the IT team and business units to work together.
Within the IT team, management silos need to be broken down
and cross-functional roles created. This may include redefining
and blending the roles of the data center team to support the
business more effectively, including the creation of a “cloud
system administrator” role. Driving upfront adoption of private
cloud services and applications by users is critical to investment
success. The IT team needs to take a cloud-first approach,
constraining new requests to virtual servers whenever possible
and increasing the perceived quality of application and service
delivery. Once stakeholders understand the benefits of these new
ways of working, less time can be spent on driving change.
“Whenever we had a request
for a server, we would first see
if we could use a virtual
machine. This was critical. We
needed to make sure we had
high VM adoption upfront,
and we needed to push existing
systems from physical to
virtual machines.”
~ Staff technologist

9
BENEFITS
The Organization experienced a number of quantified benefits in this case study:
› IT management and project delivery efficiencies.
› Improved business agility and productivity.
› Server and facilities cost savings.
› Software, storage, and networking cost savings.
› Improved security and compliance.
› Reduced downtime.
Another benefit mentioned by The Organization was a decrease in the use of public cloud resources. While not quantified as
part of the financial business case, this benefit is described in more detail below.
IT Management And Project Delivery Efficiencies
One of the main objectives for the private cloud deployment was to make it easier for business end users and
developers to consume resources. Prior to the private cloud investment, The Organization had highly complex
and constrained data centers that were managed in silos, oftentimes through manual processes. Delays and
reliability concerns caused end users and developers to often circumvent IT and look externally for resources.
In order to ensure the IT team could meet business needs, The Organization focused on asset consolidation,
virtualization, and resource pooling. Additionally, The Organization streamlined and automated many IT
processes associated with management and provisioning. Through extensive automation, The Organization was
able to build a self-service portal, allowing for a smooth request process and rapid provisioning of resources to
scale an existing application or build out new functionality. These improvements support the agility the business
needs to innovate, creating a tighter partnership between the business and IT. These investments have also
allowed IT operations FTEs and application owners and developers to free up time to focus on higher value
activities. The Organization estimates that 55 operations FTEs and application owners and developers saw
overall time savings of 5% in Year 1 and up to 10% time savings in years 2 and 3 related to management and
support driven by orchestration and self-service access.
In Year 1, the IT team was focused on driving adoption of VMs whenever possible to ensure that efficiencies
from private cloud were realized. Along with enabling self-service provisioning, The Organization created a
platform for application developers with a rich set of services for development and hosting of cloud applications.
Ten projects each year are affected by these improvements, resulting in 30 days saved on average per project in
time-to-market in years 2 and 3 (see Figure 3).

10
FIGURE 3
IT Management And Project Delivery Efficiencies
Source: Forrester Research, Inc.
Interviewed and surveyed organizations provided a broad range for efficiency and time-to-market improvements,
since there are a variety of internal and external forces that might also affect this. To compensate, this benefit
was risk-adjusted and reduced by 10%. The risk-adjusted total benefit resulting from IT management and project
delivery efficiencies over the three years was $1,796,538. See the section on Risks for more detail.
Year 1 Year 2 Year 3
Total time savings: $1,796,538
IT management time savings Project delivery time savings
5%
10% 10%
Year 1 Year 2 Year 3
150dayssaved
300dayssaved
300dayssaved
11
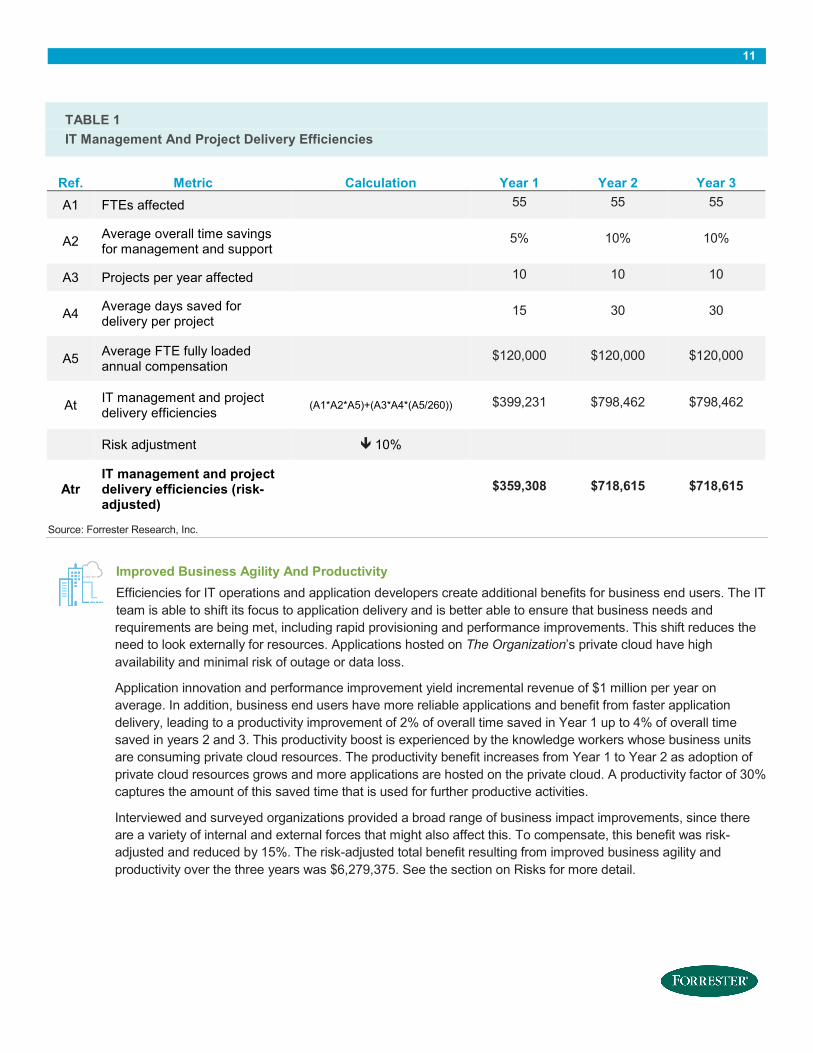
TABLE 1
IT Management And Project Delivery Efficiencies
Ref. Metric Calculation Year 1 Year 2 Year 3
A1 FTEs affected 55 55 55
A2 Average overall time savings for management and support
5% 10% 10%
A3 Projects per year affected 10 10 10
A4 Average days saved for delivery per project
15 30 30
A5 Average FTE fully loaded annual compensation
$120,000 $120,000 $120,000
At IT management and project delivery efficiencies
(A1*A2*A5)+(A3*A4*(A5/260)) $399,231 $798,462 $798,462
Risk adjustment � 10%
Atr IT management and project delivery efficiencies (risk-adjusted)
$359,308 $718,615 $718,615
Source: Forrester Research, Inc.
Improved Business Agility And Productivity
Efficiencies for IT operations and application developers create additional benefits for business end users. The IT
team is able to shift its focus to application delivery and is better able to ensure that business needs and
requirements are being met, including rapid provisioning and performance improvements. This shift reduces the
need to look externally for resources. Applications hosted on The Organization’s private cloud have high
availability and minimal risk of outage or data loss.
Application innovation and performance improvement yield incremental revenue of $1 million per year on
average. In addition, business end users have more reliable applications and benefit from faster application
delivery, leading to a productivity improvement of 2% of overall time saved in Year 1 up to 4% of overall time
saved in years 2 and 3. This productivity boost is experienced by the knowledge workers whose business units
are consuming private cloud resources. The productivity benefit increases from Year 1 to Year 2 as adoption of
private cloud resources grows and more applications are hosted on the private cloud. A productivity factor of 30%
captures the amount of this saved time that is used for further productive activities.
Interviewed and surveyed organizations provided a broad range of business impact improvements, since there
are a variety of internal and external forces that might also affect this. To compensate, this benefit was risk-
adjusted and reduced by 15%. The risk-adjusted total benefit resulting from improved business agility and
productivity over the three years was $6,279,375. See the section on Risks for more detail.

12
TABLE 2
Improved Business Agility And Productivity
Ref. Metric Calculation Year 1 Year 2 Year 3
B1 Incremental revenue $1,000,000 $1,000,000 $1,000,000
B2 Average improvement in business end user productivity 2% 4% 4%
B3 Business end users affected 1,250 2,500 2,500
B4 Average end user fully loaded compensation
$65,000 $65,000 $65,000
B5 Productivity capture 30% 30% 30%
Bt Improved business agility and productivity
B1+(B2*B3*B4*B5) $1,487,500 $2,950,000 $2,950,000
Risk adjustment � 15%
Btr Improved business agility and productivity (risk-adjusted)
$1,264,375 $2,507,500 $2,507,500
Source: Forrester Research, Inc.
Server And Facilities Cost Savings
One of the main challenges facing The Organization prior to its private cloud deployment was constrained data
centers with low asset utilization. Therefore, two main objectives were to better provide and manage capacity and
make processes more efficient to encourage use of internal resources when possible. The Organization
immediately realized cost savings from virtualization and consolidation, including reduction in physical servers
and accompanying reductions in facilities costs. With the addition of workflow automation and metered usage,
The Organization was able to meet business requirements while making costs associated with IT resources
visible to business units.
These efforts resulted in better utilization of server capacity, allowing The Organization to avoid scheduled future
purchases due to the ability to support more with its existing physical assets. The Organization was able to avoid
purchasing 20 physical servers in years 2 and 3, and it was able to retire 80 physical servers upfront. In addition
to this physical server reduction’s impact on facilities (space, power, cooling) costs, The Organization was also
able to use more power-efficient industry standard servers, further reducing power and cooling costs for a total
10% reduction in facilities spend by Year 3.
There are many internal and external forces related to an organization’s prior environment and private cloud
deployment that can affect the ability to realize these benefits. To compensate, this benefit was risk-adjusted and
reduced by 5%. The risk-adjusted total benefit resulting from server and facilities cost savings over the three
years was $1,291,240. See the section on Risks for more detail.

13
TABLE 3
Server And Facilities Cost Savings
Ref. Metric Calculation Year 1 Year 2 Year 3
C1 Physical servers retired 80
C2 Average residual value for physical
server
$2,000
C3 Physical server purchases avoided 20 20
C4 Average cost per physical server
$10,000 $10,000
C5 Prior annual facilities spend (space,
power, cooling) $3,330,000
C6 Average facilities cost savings
5% 9% 10%
Ct Server and facilities cost savings (C1*C2)+(C3*C4)+(C5*C6) $326,500 $499,700 $533,000
Risk adjustment � 5%
Ctr Server and facilities cost savings
(risk-adjusted) $310,175 $474,715 $506,350
Source: Forrester Research, Inc.
Software, Storage, And Networking Cost Savings
Similar to its efforts to increase utilization of server capacity, The Organization assessed the utilization of its
storage and networking assets as well as software usage. The Organization focused on virtualization of these
assets, increasing utilization and allowing it to achieve cost savings and cost avoidance in each of these areas.
The Organization achieved network cost savings due to the reduced server footprint as well. Just as with servers,
The Organization is able to support many more initiatives with its current physical storage and network assets
and is able to avoid previously anticipated growth in costs. The Organization is able to save 2% of overall
software spend, 28% of storage spend, and 6% of networking spend by Year 3.
While The Organization’s networking cost savings are due to reducing the data center footprint and virtualizing
networking assets, another important contributor to networking cost savings is avoidance or reduction of ISP
network costs. As noted in the final benefit category below, The Organization reduced its use of public cloud
services after deploying its private cloud. Bandwidth consumption and other connectivity costs associated with
connecting to public cloud services can be expensive and unpredictable. By reducing the use of public cloud
services, organizations may see further networking cost savings that are not included in this study.
There are many internal and external forces related to an organization’s prior environment and private cloud
deployment that can affect its ability to realize these benefits. To compensate, this benefit was risk-adjusted and
reduced by 5%. The risk-adjusted total benefit resulting from software, storage, and networking cost savings over
the three years was $4,355,085. See the section on Risks for more detail.

14
TABLE 4
Software, Storage, And Networking Cost Savings
Ref. Metric Calculation Year 1 Year 2 Year 3
D1 Prior annual software spend $17,760,000
D2 Average software cost savings
1% 2% 2%
D3 Prior annual storage spend $5,328,000
D4 Average storage cost savings
7% 10% 28%
D5 Prior annual networking spend $9,990,000
D6 Average networking cost savings
3% 4% 6%
Dt Software, storage, and networking
cost savings (D1*D2)+(D3*D4)+(D5*D6) $850,260 $1,287,600 $2,446,440
Risk adjustment � 5%
Dtr Software, storage, and networking
cost savings (risk-adjusted) $807,747 $1,223,220 $2,324,118
Source: Forrester Research, Inc.
Improved Security And Compliance
By making internal IT services easier to use and more reliable, business users and application developers have
more incentive to use private cloud resources before looking externally. This is important for The Organization in
establishing and maintaining greater control over the security of sensitive data. Applications where performance
is critical or data needs to be extremely secure can be hosted on the private cloud behind The Organization’s
firewall while still providing the benefits and usage model of public cloud.
With the help of security management practices and tools, this results in two smaller security breaches being
eliminated per year. Each breach costs $200,000 on average, resulting in a $400,000 savings each year. In
addition, The Organization is better able to remain in compliance with regulations, resulting in a cost savings of
$330,000 per year from reduced litigation costs and fines.
This benefit will be dependent on the prevalence of security and compliance issues prior to the private cloud
deployment along with the ability for private cloud usage to provide improvements. To compensate, this benefit
was risk-adjusted and reduced by 5%. The risk-adjusted total benefit resulting from improved security and
compliance over the three years was $2,080,500. See the section on Risks for more detail.

15
TABLE 5
Improved Security And Compliance
Ref. Metric Calculation Year 1 Year 2 Year 3
E1 Security breaches avoided per year 2 2 2
E2 Average cost of security breach $200,000 $200,000 $200,000
E3 Average reduction in compliance and litigation costs
$330,000 $330,000 $330,000
Et Improved security and compliance (E1*E2)+E3 $730,000 $730,000 $730,000
Risk adjustment � 5%
Etr Improved security and compliance (risk-adjusted)
$693,500 $693,500 $693,500
Source: Forrester Research, Inc.
Reduced Downtime
With the private cloud investment, The Organization was able to achieve greater redundancy and capacity
management. This, combined with automation and improvement of many previously manual processes, has
allowed The Organization to significantly reduce the amount of downtime, as well as the risk of outages, for
applications hosted on its private cloud. These improvements result in 6 fewer hours of downtime. While the
revenue and productivity impact of reduced downtime has been captured above, each hour of downtime is
approximately $50,000 for the cost of repair and regulatory impact.
This benefit will vary based on the redundancy of systems and extent of automation. To compensate, this benefit
was risk-adjusted and reduced by 5%. The risk-adjusted total benefit resulting from reduced downtime over the
three years was $855,000. See the section on Risks for more detail.
TABLE 6
Reduced Downtime
Ref. Metric Calculation Year 1 Year 2 Year 3
F1 Hours of downtime avoided 6 6 6
F2 Average cost of downtime per hour
$50,000 $50,000 $50,000
Ft Reduced downtime F1*F2 $300,000 $300,000 $300,000
Risk adjustment � 5%
Ftr Reduced downtime (risk-adjusted) $285,000 $285,000 $285,000
Source: Forrester Research, Inc.

16
Reduction In Public Cloud Costs
The Organization realized a reduction in public cloud use following the deployment of its private cloud, though
this was not a primary objective. Prior to investing in private cloud, The Organization was using public cloud
resources, commonly referred to as “shadow IT.” Some of this use was due to developers and business users
circumventing the IT team in order to procure resources more quickly externally. Additionally, demand for IT
resources is unpredictable, so The Organization favors the pay-as-you-go model for some applications.
However, many of these applications are better suited for on-premises private cloud due to the importance of
performance, data security and compliance, and cost-effectiveness. While The Organization continues to host
some of its applications on the public cloud, bringing applications in-house helped to reduce public cloud costs by
approximately $240,000 per year.
Total Benefits
Table 7 shows the total of all benefits across the six areas listed above, as well as present values (PVs) discounted at 10%.
Over three years, The Organization expects risk-adjusted total benefits to be a PV of just over $13.5 million.
TABLE 7
Total Benefits (Risk-Adjusted)
Ref. Benefit Category Year 1 Year 2 Year 3 Total Present Value
Atr IT management and project delivery
efficiencies $359,308 $718,615 $718,615 $1,796,538 $1,460,447
Btr Improved business agility and productivity $1,264,375 $2,507,500 $2,507,500 $6,279,375 $5,105,668
Ctr Server and facilities cost savings $310,175 $474,715 $506,350 $1,291,240 $1,054,732
Dtr Software, storage, and networking cost
savings $807,747 $1,223,220 $2,324,118 $4,355,085 $3,491,385
Etr Improved security and compliance $693,500 $693,500 $693,500 $2,080,500 $1,724,632
Ftr Reduced downtime $285,000 $285,000 $285,000 $855,000 $708,753
Total benefits (risk-adjusted) $3,720,105 $5,902,550 $7,035,083 $16,657,738 $13,545,616
Source: Forrester Research, Inc.

17
COSTS
The Organization experienced a number of costs associated with the private cloud investment:
› Hardware and facilities costs.
› Software license costs.
› Resource costs.
› Training costs.
These represent the mix of internal and external costs experienced by The Organization for initial planning, implementation,
and ongoing maintenance associated with the private cloud.
Hardware And Facilities Costs
The Organization made incremental investments in cloud infrastructure, including hardware and facilities costs.
This includes purchasing additional physical servers and regular server refreshes to capitalize on more cost-
effective options, as well as purchasing storage and networking assets. Associated facilities costs for these
additional assets are incurred as well.
Hardware and facilities costs vary from organization to organization based on prior environment and vendor
discounts. To compensate, this cost was risk-adjusted up by 5%. The risk-adjusted cost of hardware and facilities
over the three years was $1,915,200. See the section on Risks for more detail.
TABLE 8
Hardware And Facilities Costs
Ref. Metric Calculation Initial Year 1 Year 2 Year 3
G1 Upfront hardware costs $555,000
G2 Hardware refresh costs $160,000 $160,000 $160,000
G3 Hardware maintenance and support
$111,000 $143,000 $175,000
G4 Incremental facilities costs $90,000 $90,000 $90,000 $90,000
Gt Hardware and facilities costs G1+G2+G3+G4 $645,000 $361,000 $393,000 $425,000
Risk adjustment � 5%
Gtr Hardware and facilities costs (risk-adjusted)
$677,250 $379,050 $412,650 $446,250
Source: Forrester Research, Inc.

18
Software License Costs
The Organization made incremental software investments in virtualization software for compute, storage, and
networking. The Organization also purchased additional management, monitoring, and automation tools. This
resulted in $102,000 in incremental software license costs upfront and $160,000 in software license and support
costs each year.
Software costs vary from organization to organization, considering different licensing agreements, what other
products may be licensed from the same vendor, and other discounts. To compensate, this cost was risk-
adjusted up by 5%. The risk-adjusted cost of software over the three years was $611,100. See the section on
Risks for more detail.
TABLE 9
Software License Costs
Ref. Metric Calculation Initial Year 1 Year 2 Year 3
Ht Software license and support costs
H1 $102,000 $160,000 $160,000 $160,000
Risk adjustment � 5%
Htr Software license and support costs (risk-adjusted)
$107,100 $168,000 $168,000 $168,000
Source: Forrester Research, Inc.
Resource Costs
The Organization implemented and deployed its private cloud over the course of seven months. For this upfront
period, The Organization relied on 40 FTEs, including four FTE hires with new skill sets, who each spent 300
hours on average on implementation and deployment. These internal efforts were supplemented by slightly less
than 3,000 total hours of professional services and vendor support. The upfront internal resource costs are
equivalent to 178% of the initial hardware and software investment, and the professional services spend is
approximately 70%. On an ongoing basis, 25 FTEs spend 165 hours per year on ongoing management and
support, and The Organization uses 600 total hours per year of ongoing professional services and vendor
support, equivalent to 114% and 11% of the initial hardware and software spend, respectively.
Resource costs are more variable from organization to organization, considering some organizations rely on
professional services and vendor support more heavily and have varying skill sets in-house. To compensate, this
cost was risk-adjusted up by 10%. The risk-adjusted cost for external and internal resources over the three years
was $4,502,421. See the section on Risks for more detail.

19
TABLE 10
Resource Costs
Ref. Metric Calculation Initial Year 1 Year 2 Year 3
I1
Professional services costs
(percent of hardware and
software investment)
70% 11% 11% 11%
I2 Professional services costs
$459,900 $72,270 $72,270 $72,270
I3
Internal FTE costs (percent of
hardware and software
investment)
178% 114% 114% 114%
I4 Internal FTE costs
$1,169,460 $748,980 $748,980 $748,980
It Resource costs I2+I4 $1,629,360 $821,250 $821,250 $821,250
Risk adjustment � 10%
Itr Resource costs (risk-
adjusted) $1,792,296 $903,375 $903,375 $903,375
Source: Forrester Research, Inc.
Training Costs
The Organization required minimal training associated with the private cloud investment. The 25 core IT FTEs
responsible for maintaining and supporting the private cloud received a total of two weeks of training upfront over
the seven-month implementation and deployment period. This is equivalent to 22% of the initial hardware and
software investment.
TABLE 11
Training Costs
Ref. Metric Calculation Initial Year 1 Year 2 Year 3
J1
Training costs (percent of
hardware and software
investment)
22%
J2 Training costs
$144,540
Jt Training costs J2 $144,540 $0 $0 $0
Source: Forrester Research, Inc.
20
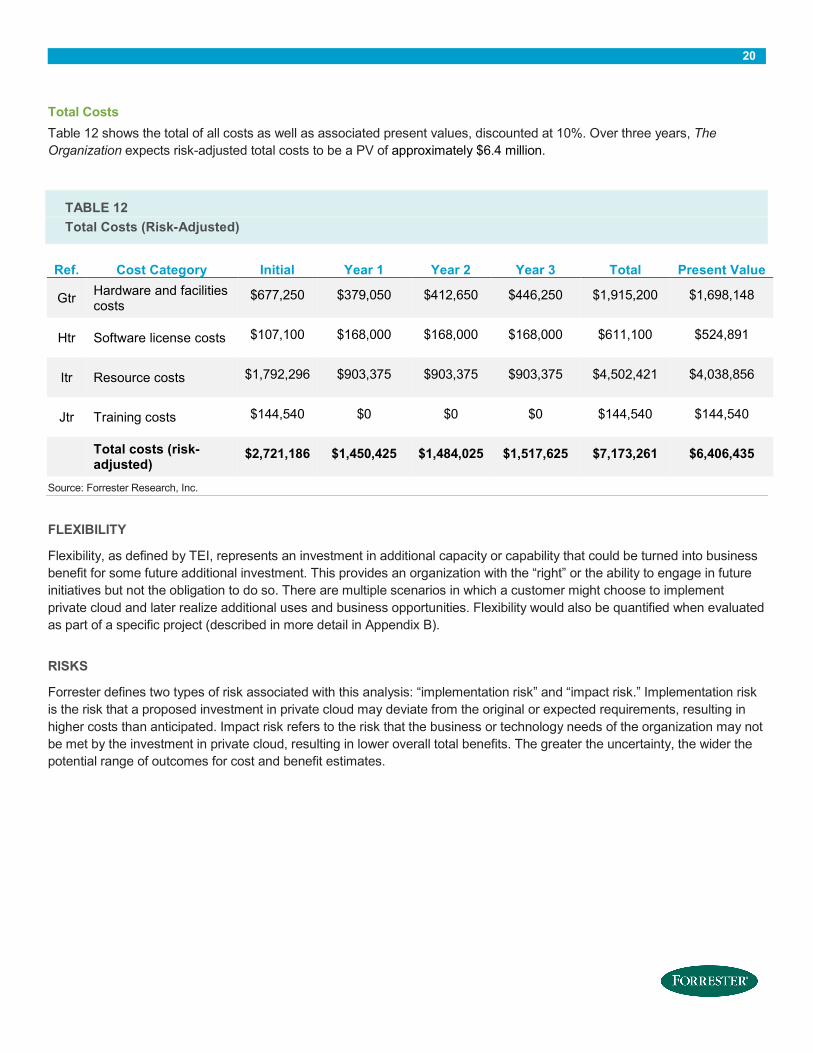
Total Costs
Table 12 shows the total of all costs as well as associated present values, discounted at 10%. Over three years, The
Organization expects risk-adjusted total costs to be a PV of approximately $6.4 million.
TABLE 12
Total Costs (Risk-Adjusted)
Ref. Cost Category Initial Year 1 Year 2 Year 3 Total Present Value
Gtr Hardware and facilities costs
$677,250 $379,050 $412,650 $446,250 $1,915,200 $1,698,148
Htr Software license costs $107,100 $168,000 $168,000 $168,000 $611,100 $524,891
Itr Resource costs $1,792,296 $903,375 $903,375 $903,375 $4,502,421 $4,038,856
Jtr Training costs $144,540 $0 $0 $0 $144,540 $144,540
Total costs (risk-adjusted)
$2,721,186 $1,450,425 $1,484,025 $1,517,625 $7,173,261 $6,406,435
Source: Forrester Research, Inc.
FLEXIBILITY
Flexibility, as defined by TEI, represents an investment in additional capacity or capability that could be turned into business
benefit for some future additional investment. This provides an organization with the “right” or the ability to engage in future
initiatives but not the obligation to do so. There are multiple scenarios in which a customer might choose to implement
private cloud and later realize additional uses and business opportunities. Flexibility would also be quantified when evaluated
as part of a specific project (described in more detail in Appendix B).
RISKS
Forrester defines two types of risk associated with this analysis: “implementation risk” and “impact risk.” Implementation risk
is the risk that a proposed investment in private cloud may deviate from the original or expected requirements, resulting in
higher costs than anticipated. Impact risk refers to the risk that the business or technology needs of the organization may not
be met by the investment in private cloud, resulting in lower overall total benefits. The greater the uncertainty, the wider the
potential range of outcomes for cost and benefit estimates.

21
TABLE 13
Benefit And Cost Risk Adjustments
Benefits Adjustment
IT management and project delivery efficiencies � 10%
Improved business agility and productivity � 15%
Cost savings � 5%
Costs Adjustment
Hardware, software, and facilities costs � 5%
Resource costs � 10%
Source: Forrester Research, Inc.
Quantitatively capturing implementation risk and impact risk by directly adjusting the financial estimates provides more
meaningful and accurate estimates and a more accurate projection of the ROI. In general, risks affect costs by raising the
original estimates, and they affect benefits by reducing the original estimates. The risk-adjusted numbers should be taken as
“realistic” expectations since they represent the expected values considering risk.
The following impact risks that affect benefits are identified as part of the analysis:
› Productivity and efficiency benefits are dependent on degree of adoption, the number of employees affected and their compensation levels, and the extent to which automation and application improvements can be achieved.
› The degree to which organizations can consolidate and virtualize assets is dependent on the prior environment, priorities with the private cloud investment, and FTE skill, among other factors.
The following implementation risks that affect costs are identified as part of this analysis:
› Hardware and software costs vary considering different licensing agreements, what other products may be licensed from the same vendor, and other discounts.
› Resource costs are more variable from organization to organization, considering some organizations rely on professional services and vendor support more heavily and have varying skill sets in-house. Unexpected challenges could inflate the
hours required of various resources.
Table 13 shows the values used to adjust for risk and uncertainty in the cost and benefit estimates for The Organization.
Readers are urged to apply their own risk ranges based on their own degree of confidence in the cost and benefit estimates.

22
Financial Summary
The financial results calculated in the Benefits and Costs sections can be used to determine the ROI, NPV, and payback
period for The Organization’s investment. Figure 4 shows the total costs and benefits for each year of the analysis, as well as
the net benefit over time. This line crosses over the x-axis right after Year 1, showing the payback period.
Table 14 below shows the risk-adjusted ROI, NPV, and payback period values. These values are determined by applying the
risk-adjustment values from Table 13 in the Risks section to the unadjusted results in each relevant cost and benefit section.
FIGURE 4
Cash Flow Chart (Risk-Adjusted)
Source: Forrester Research, Inc.
TABLE 14
Cash Flow (Risk-Adjusted)
Initial Year 1 Year 2 Year 3 Total Present Value
Costs ($2,721,186) ($1,450,425) ($1,484,025) ($1,517,625) ($7,173,261) ($6,406,435)
Benefits $0 $3,720,105 $5,902,550 $7,035,083 $16,657,738 $13,545,616
Net benefits ($2,721,186) $2,269,680 $4,418,525 $5,517,458 $9,484,477 $7,139,181
ROI
111%
Payback period (months) 13.2
Source: Forrester Research, Inc.
($4,000,000)
($2,000,000)
$0
$2,000,000
$4,000,000
$6,000,000
$8,000,000
$10,000,000
$12,000,000
Initial Year 1 Year 2 Year 3
Cash flows
Financial Analysis (risk-adjusted)
Total costs Total benefits Cumulative total

23
Appendix A: Composite Organization Description
For this TEI study, Forrester has created a composite organization, referred to as The Organization, to illustrate the
quantifiable benefits and costs of implementing private cloud. The Organization is intended to represent a large global
organization with 15,000 employees and $3.7 billion in recent fiscal year revenue and is based on characteristics of the
interviewed and surveyed customers.
Prior to the investment in on-premises private cloud, The Organization had begun virtualizing its infrastructure resources but
still struggled with lengthy delays in provisioning resources and low resource utilization. Business units were not aware of or
accountable for the cost or inefficient use of resources and would often look to external resources to speed access and
support innovation. High complexity combined with manual processes reduced IT FTE efficiency. Segmentation made
performance issues harder to control. Expanding and adding data centers to meet future needs would be too costly to
support.
In investing in on-premises private cloud, The Organization had the following objectives:
› Improve IT agility and support business innovation and faster time-to-market for new initiatives.
› Improve IT management efficiency.
› Improve performance and reduce latency.
› Reduce shadow IT.
› Improve security and oversight.
› Reduce hardware and software costs.
› Reduce spending on public cloud resources.
The Organization has been able to achieve these objectives and currently supports 42% of its business units with on-
premises private cloud resources. Through the creation of a self-service portal, users are now able to rapidly provision
resources, reducing the need to look externally to support business innovation and reducing the overall time-to-market.
Through consolidation, process improvement, and automation, IT FTEs have been able to achieve efficiencies and minimize
service disruptions. Due to consolidation, metered usage, and higher asset utilization, The Organization has also been able
to reduce and better control costs. By effectively supporting mission-critical applications in-house and reducing the use of
public cloud resources, The Organization is also able to improve security and prevent small breaches from occurring. In
those instances where public cloud resources are being used, whether for particular applications or to provide burst capacity,
the on-premises private cloud allows for the flexibility to effectively govern public cloud usage.
FRAMEWORK ASSUMPTIONS
Table 15 provides the model assumptions that Forrester used in this analysis.
The discount rate used in the PV and NPV calculations is 10%, and the time horizon used for the financial modeling is three
years. Organizations typically use discount rates between 8% and 16% based on their current environment. Readers are
urged to consult with their respective company’s finance department to determine the most appropriate discount rate to use
within their own organizations.

24
TABLE 15
Model Assumptions
Ref. Metric Calculation Value
X1 Hours per week 40
X2 Weeks per year 52
X3 Hours per year (M-F, 9-5) 2,080
X4 Hours per year (24x7) 8,736
X5 IT FTE annual fully loaded compensation $120,000
X6 Hourly (X5/X3) $58
Source: Forrester Research, Inc.

25
Appendix B: Total Economic Impact™ Overview
Total Economic Impact is a methodology developed by Forrester Research that enhances a company’s technology decision-
making processes and assists vendors in communicating the value proposition of their products and services to clients. The
TEI methodology helps companies demonstrate, justify, and realize the tangible value of IT initiatives to both senior
management and other key business stakeholders. TEI assists technology vendors in winning, serving, and retaining
customers.
The TEI methodology consists of four components to evaluate investment value: benefits, costs, flexibility, and risks.
BENEFITS
Benefits represent the value delivered to the user organization — IT and/or business units — by the proposed product or
project. Often, product or project justification exercises focus just on IT cost and cost reduction, leaving little room to analyze
the effect of the technology on the entire organization. The TEI methodology and the resulting financial model place equal
weight on the measure of benefits and the measure of costs, allowing for a full examination of the effect of the technology on
the entire organization. Calculation of benefit estimates involves a clear dialogue with the user organization to understand
the specific value that is created. In addition, Forrester also requires that there be a clear line of accountability established
between the measurement and justification of benefit estimates after the project has been completed. This ensures that
benefit estimates tie back directly to the bottom line.
COSTS
Costs represent the investment necessary to capture the value, or benefits, of the proposed project. IT or the business units
may incur costs in the form of fully burdened labor, subcontractors, or materials. Costs consider all the investments and
expenses necessary to deliver the proposed value. In addition, the cost category within TEI captures any incremental costs
over the existing environment for ongoing costs associated with the solution. All costs must be tied to the benefits that are
created.
FLEXIBILITY
Within the TEI methodology, direct benefits represent one part of the investment value. While direct benefits can typically be
the primary way to justify a project, Forrester believes that organizations should be able to measure the strategic value of an
investment. Flexibility represents the value that can be obtained for some future additional investment building on top of the
initial investment already made. For instance, an investment in an enterprisewide upgrade of an office productivity suite can
potentially increase standardization (to increase efficiency) and reduce licensing costs. However, an embedded collaboration
feature may translate to greater worker productivity if activated. The collaboration can only be used with additional
investment in training at some future point. However, having the ability to capture that benefit has a PV that can be
estimated. The flexibility component of TEI captures that value.
RISKS
Risks measure the uncertainty of benefit and cost estimates contained within the investment. Uncertainty is measured in two
ways: 1) the likelihood that the cost and benefit estimates will meet the original projections and 2) the likelihood that the
estimates will be measured and tracked over time. TEI risk factors are based on a probability density function known as
“triangular distribution” to the values entered. At a minimum, three values are calculated to estimate the risk factor around
each cost and benefit.
26
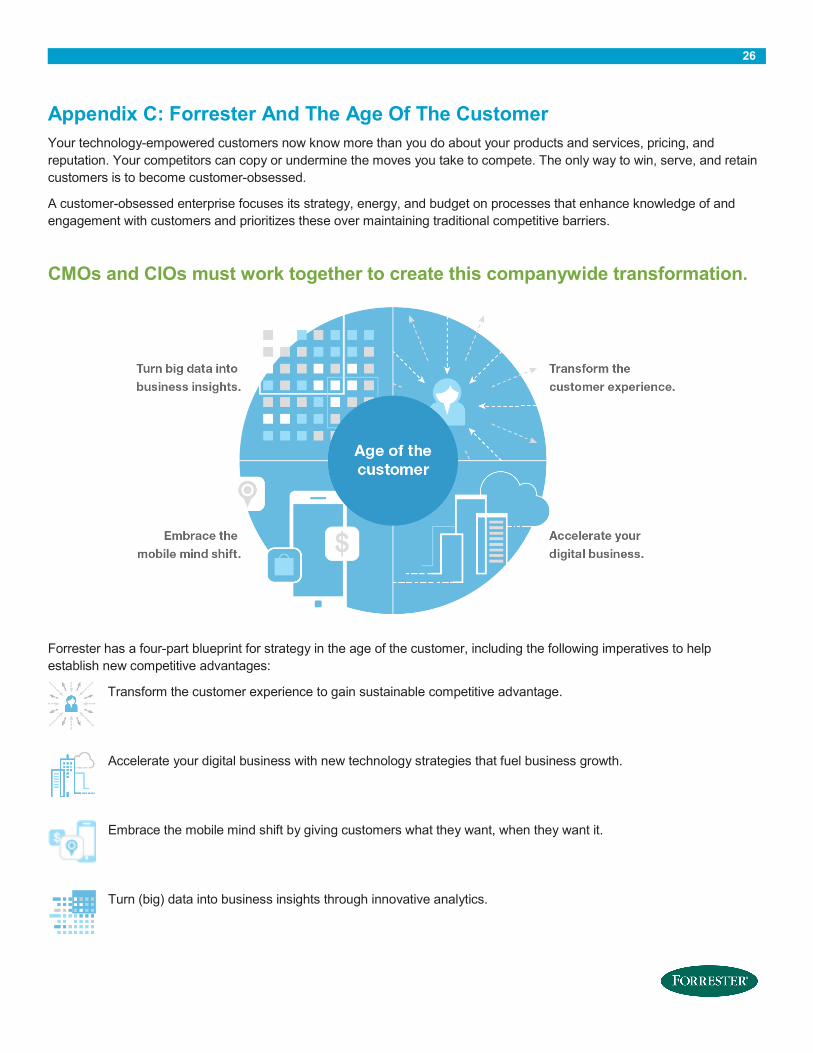
Appendix C: Forrester And The Age Of The Customer
Your technology-empowered customers now know more than you do about your products and services, pricing, and
reputation. Your competitors can copy or undermine the moves you take to compete. The only way to win, serve, and retain
customers is to become customer-obsessed.
A customer-obsessed enterprise focuses its strategy, energy, and budget on processes that enhance knowledge of and
engagement with customers and prioritizes these over maintaining traditional competitive barriers.
CMOs and CIOs must work together to create this companywide transformation.
Forrester has a four-part blueprint for strategy in the age of the customer, including the following imperatives to help
establish new competitive advantages:
Transform the customer experience to gain sustainable competitive advantage.
Accelerate your digital business with new technology strategies that fuel business growth.
Embrace the mobile mind shift by giving customers what they want, when they want it.
Turn (big) data into business insights through innovative analytics.

27
Appendix D: Glossary
Discount rate: The interest rate used in cash flow analysis to take into account the time value of money. Companies set
their own discount rate based on their business and investment environment. Forrester assumes a yearly discount rate of
10% for this analysis. Organizations typically use discount rates between 8% and 16% based on their current environment.
Readers are urged to consult their respective organizations to determine the most appropriate discount rate to use in their
own environment.
Net present value (NPV): The present or current value of (discounted) future net cash flows given an interest rate (the
discount rate). A positive project NPV normally indicates that the investment should be made, unless other projects have
higher NPVs.
Present value (PV): The present or current value of (discounted) cost and benefit estimates given at an interest rate (the
discount rate). The PV of costs and benefits feed into the total NPV of cash flows.
Payback period: The breakeven point for an investment. This is the point in time at which net benefits (benefits minus costs)
equal initial investment or cost.
Return on investment (ROI): A measure of a project’s expected return in percentage terms. ROI is calculated by dividing
net benefits (benefits minus costs) by costs.
A NOTE ON CASH FLOW TABLES
The following is a note on the cash flow tables used in this study (see the example table below). The initial investment
column contains costs incurred at “time 0” or at the beginning of Year 1. Those costs are not discounted. All other cash flows
in years 1 through 3 are discounted using the discount rate (shown in the Framework Assumptions section) at the end of the
year. PV calculations are calculated for each total cost and benefit estimate. NPV calculations are not calculated until the
summary tables are the sum of the initial investment and the discounted cash flows in each year.
Sums and present value calculations of the Total Benefits, Total Costs, and Cash Flow tables may not exactly add up, as
some rounding may occur.
TABLE [EXAMPLE]
Example Table
Ref. Metric Calculation Year 1 Year 2 Year 3
Source: Forrester Research, Inc.