44 - world athletics
TRANSCRIPT
A model for the scientific preparation ofhigh level sprinters
[fggi e by IAAF 7:4; 57-64, 1992
by Christophe Deleclu.se, Herman Van Coppenolle, Rudi Diels, and Marina Goris
44 The authors describe thc creation of the Leuven sprint and slarl evaluation system which provides accurate and immediate infinmation on an uthlete's s/)rinling abililies hy analysing the slarl aclion and the velocity curve. They explain their use of an apparatus called a 'velocimeter' and demonstrate how data from this velocimeter can be a.sed in the study ofthe evolulion of the sprint performance structure of each athlete antl as the basis for the furiher /dunning of Iraining programmes.
??
1 Introduction
Sprinting is a very natural movemeni, but a fast sprint action is not easy to analyze. A coach needs objective informalion about the sprint performance of an athlete when preparing a training programme.
As coaches and athletes prefer the advantages of specific field tests lo laboratory lests. the athletic staff of ihe Institute of Physical Educat ion at the Cathol ic University of Leuven established the Leuven Alhletic Sprint and Start Evaluation Centre and undertook a project in 1984 to develop specific measuring devices and procedures for the evalualion of high level sprinters (Van Coppenolle, 1989). The purpose was to provide accurate and immediate informalion on an a th l e t e ' s spr in t ing abi l i t ies by analysing the slarl aclion and the velocity curve.
Christophe Delecluse is a .sports .scientist at the Inslilule of Physical Educalion af the Catholic University of Leuven, Belgium.
Herman Van Coppenolle is a Profes.sor al the Institute of Physical Educalion at the Universiiy of Leuven, Belgitim
Marina (ioris is a Professor at the Institute of Physical Educatitm al the Univer.siiy of Leuven, Belgium
Rudi Diels is a sporis scientist al lhc Institute of Physical Education at the Universiiy of Leuven. Belgium
2 Analysis ofthe velocity curve
2.1 The velocimeter
The first step in thc projccl was the construct ion of an appara tus cal led ' the velocimeter," The velocimeter permits a continuous registration of the running speed of an alhlete over disiances of up lo 100 metres.
Its working principle is quite simple (Witters, 19K5). A thin wire is attached to the pelvis (trousers) of the athlele. The lension on the wire is jusl enough to keep the wire straighl, withoul disturbing lhc athlete's running aclion. When Ihe athlele 57
• -̂
• •
4 -
2 -
velocity (m/s)
^
f^ /
• 2
n i t>an i l l t>( l lN>lB)
- • ^ worlö C U * * l^•31
^ ^ ^ ^
^ ^ ^ ^ ^
1 1
< e e distance (m)
14 «i i * 1
- 5 - nat ioni i i»v»i(N->i)
- — wo'ld e l l » » (N-S)
^ ^
' 1 10
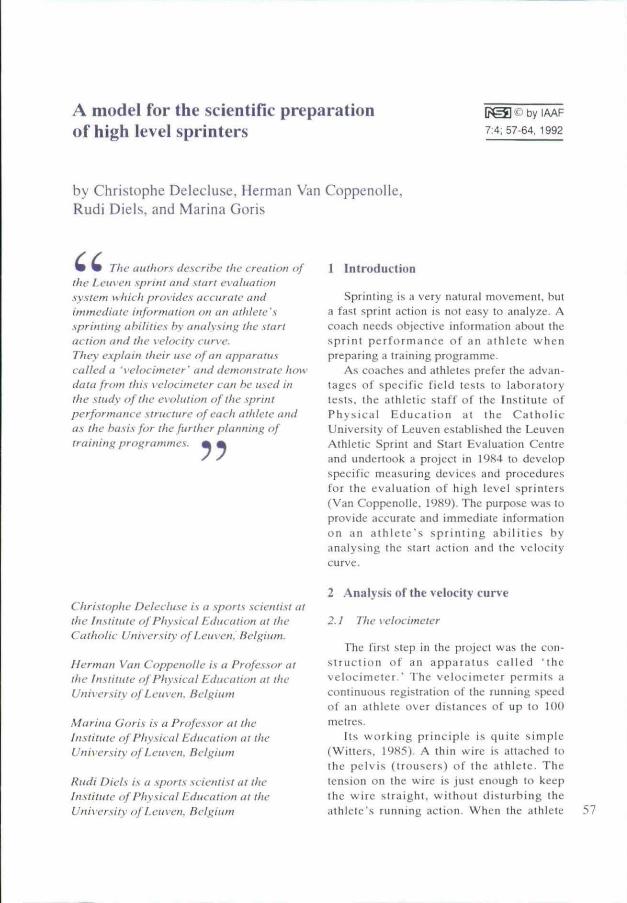
Figure 1: Mean velocity of male and female sprinters during the first acceleration phase o f a 40 metre sprint
58
moves forward, he or she pulls Ihe wire which makes a wheel turn around in the apparatus . On the rim of this wheel are placed reflectors al 10cm intervals. With every 10cm of progre.sston one of the rellec-tors passes an infra-red sensor. By this means, the running time is recorded for each 10cm interval and the running speed can then be calculated.
F igure 1 and Figure 2 i l lus t ra te the velocity curve for two differeni performance levels of male and female sprinters during the first 10 meires, and the following 30 meires of a 40 metre sprint. The mean 100 metre best times of Ihe differeni performance levels were: • Male world cla,ss 10.21 • Mate naiional level 10.94 • Female world class 10.99 • Female naiional level 12.05
When in te rpre l ing dala from ihe velocimeter the coach must realise thai the 100 metres consists uf three phases. In the first phase, the athlete accelerates oul of the
blocks. There is a very steep increase of ruiming speed during the first 10 metres. In the second phase, the athlele builds up his maximum speed. In the third phase, the athlete tries lo maintain that speed until the finish. On the basis of the velocimeter data Ihe running speed in each phase of the run can be analysed.
The following parameters were selected to quantify the performance in the three phases (Van Coppenolle, 1990):
• Phase 1 the mean acceleration during ihe first ten metres (AIO). This is the speed on the 10 metre point d ivided by Ihe 10 metre running time
• Phase 2 the maximum running speed (Vmax)
• Phase 3 the percentage of speed loss (% loss) during the lasl 40 metres of the 100 metre sprint
v«loc)ty (m/s)
22 2» 26 2B distance (m)
national level(N'IB)
waria cl>»s <N-3) M national leveIIN<111
world cU*« N-6)
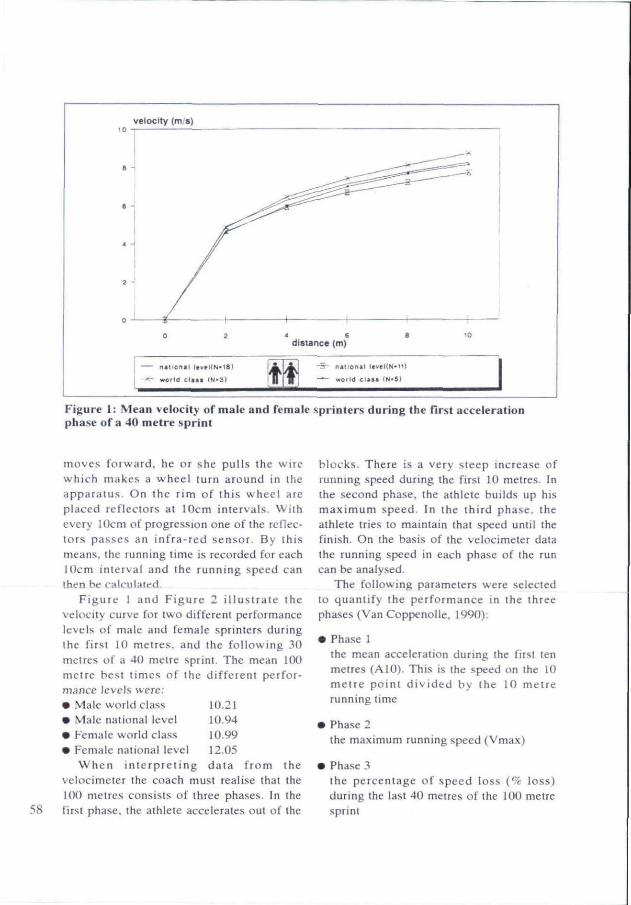
Figure 2: mean velocity of male and female sprinters between 10 and 40 metres
Scientific research and field experti.se indicate that the performance related faclors differ from phase to phase. This means, tor example, that a good performance in thc first phase of the run does not necessarily correspond with a high maximum running speed or a good speed endurance, and vice versa
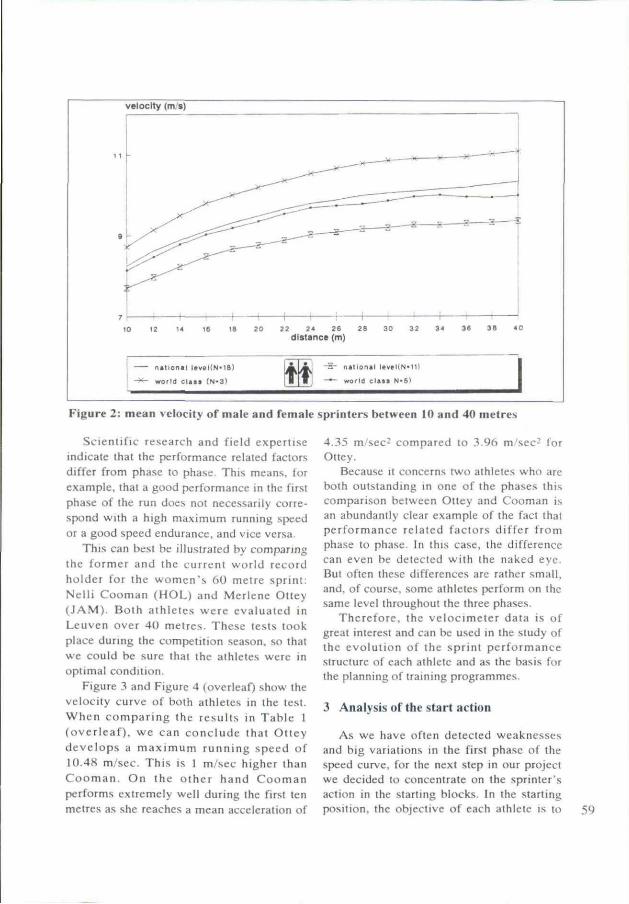
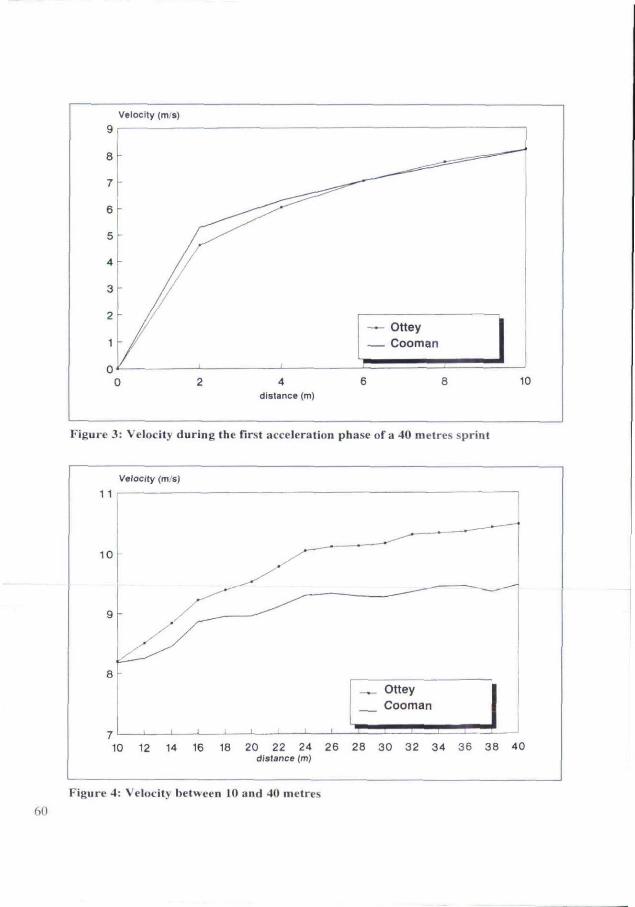
This can best be illuslraled by comparing the former and the curreni world record holder for the women ' s fiO metre sprint; Nelli Cooman (HOL) and Merlene Oltey (JAM). Both athletes were evaluated in Leuven over 40 metres. These tests took place durmg the compeiition season, so that we could be sure that the athletes were in optimal condition.
Figure 3 and Figure 4 (overleaO show Ihe velocity curve of both athleles in the test. When compar ing the results in Table I (over leaf ) , we can conc lude that Oltey deve lops a maximum running speed of 10.48 m/sec. This is 1 m/.sec higher than C o o m a n . On the o ther hand Cooman performs exiremely well during the first ten metres as she reaches a mean acceleration of
4.35 m/sec- compared lo 3.96 m/sec^ for Oltey.
Because tl concern.s two athletes who are bolh outstanding in one of the phases this comparison belween Otley and Cooman is an abundantly clear example of the facl that performance related faclors differ from phase lo phase. In this case, the difference can even be detected with the naked eye. But often these differences are rather small, and, of course, some athletes perform on the same level throughout the Ihree phases.
Therefore, the velocimeter data is of great interest and can be used in the sludy of the evolution of the sprint performance siructure of each athlete and as the basis for the planning of training programmes.
3 Analysis ofthe start action
As we have often detected weaknesses and big varialions in Ihe first phase of the speed curve, for the next step in our project we decided to concentrate on the sprinter's action in Ihc starling blocks. In the starling position, Ihe objective of each athlele is lo 59
9
8
7
6
5
4
3
2
1
0 £
Velocity (m/s)
-
-
-
-
/
• /
/
)
_,---'
/ > /
2
^^^^..^
.^-:::::=^^^'' '^^
1
4 distance (m)
^ ^
^ ^ " " ' ^ " " ^
— Ottey — Cooman
6 8 10
Figure 3: Velocity during the Tirst acceleration phase ofa 40 metres sprint
Velocity (m/s)
1 1
Ottey Cooman
10 12 14 16 18 20 22 24 26 28 30 32 34 36 38 40 distance (m)
6Ü
Figure 4: Velocity between 10 and 40 metres
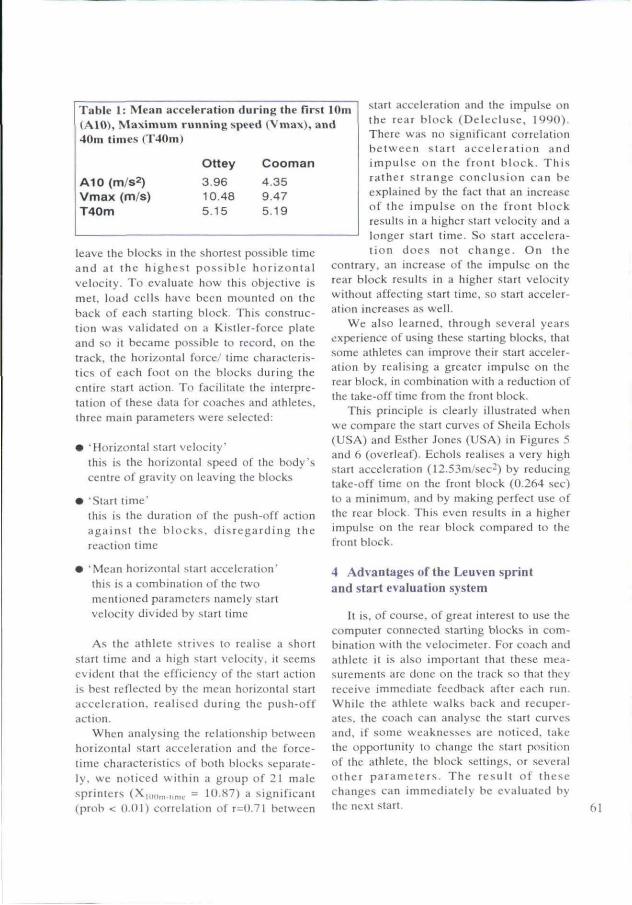
Table 1: Mean acceleration during the First tOm (AIO), Maximum running speed (Vmax), and 40m times (T40m)
AIO (m/s2) Vmax (m/s) T40m
Ottey 3.96 10,48 5.15
Cooman 4.35 9,47 5.19
leave the blocks in the shortest possible time and at the h ighes t poss ib le hor izonta l velocity. To evaluate how this objective is met. load cells have been mounted on the back of each starling block. This conslruc-ti<m was validated on a Kisller-force plate and so it became possible to record, on the track, the horizontal force/ time characteristics of each foot on the blocks during the entire start action. To facilitate the interpretation of these data for coaches and alhletes, Ihree main parameters were selected:
• 'Horizontal start velocity' this is the horizontal speed of the body's centre of gravity on leaving the blocks
• 'Start time' this is the duration of the push-off action aga ins t the b locks , d i s regard ing the reaction time
• Mean horizontal start acceleration" this is a combination of the two meniioned parameters namely start velocity divided by start time
As the athlele strives to realise a shorl start time and a high slart velocity, it seems evidenl thai the efficiency of the start action is best reOected by thc mean horizontal start acceleralion, realised during Ihe push-off action.
When analysing the relationship belween horizontal start acceleration and the force-time characteristics of both blocks separately, we noticed within a group of 21 male sprinters (X,||„n,.|,„^. = 10.87) a significant (prob < 0.01) correlation of r=Ü.71 beiween
start acceleralion and ihe impulse on the rear block (Delecluse , 1990), There was no significam correlation between start acce le ra l ion and impulse on the front block. This rather s t range conclus ion can be explained by the fact thai an increase of Ihe impulse on Ihe front block results in a higher start velocity and a longer start time. So start acceleration does not change . On the
conlrary. an increase of the impulse on the rear block results in a higher start velocity without affecting start time, so slarl acceleralion increases as well.
We also learned, ihrough several years experience of using ihese starting blocks, that some athletes can improve their start acceleration by realising a greater impulse on the rear block, in combination wilh a reduclion of the take-off time from the front block.
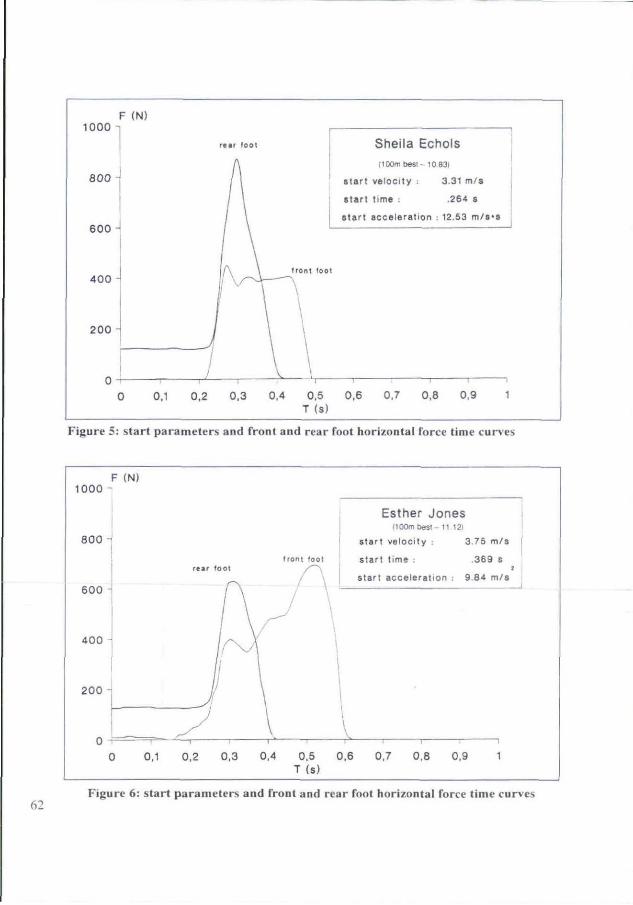
This principle is clearly illustrated when we compare the start curves of Sheila Echols (USA) and Esther Jones (USA) in Figures 5 and 6 (overleaf)- Echols realises a very high slarl acceleralion (12.53m/sec') by reducing take-off lime on the front block (0.264 sec) lo a minimum, and by making perfect use of the rear block. This even results in a higher impulse on the rear block compared to the front block.
4 Advantages ofthe Leuven sprint and start evaluation system
It is. of course, of great interest to u.se the computer connected starling blocks in combination with the velocimeter. For coach and athlete it is also important that these measurements are done on thc track so that they receive immediate feedback after each run. While the athlele walks back and recuperates, the coach can analyse the start curves and, if some weaknesses are noticed, lake the opportunity to change Ihe slart posiiion of the alhlete, the block settings, or several other pa rame te r s . The resul t of Ihese changes can immediately be evaluated by the next start.
61
F (N) 1000 -1
8 0 0 -
6 0 0 -
4 0 0 -
2 0 0 -
0 0 0.1
rear foot
A / \
ü /
/
0,2 0.3
Sheila Echols (100m besi --10831
Start vftlocity : 3.31 m/s
«tart tim« ; .264 s
start acceleration : 12.53 m/s*»
I ront fool
\
0,4 0,5 T (s)
1 , . , 1
0.6 0.7 0,8 0,9 1
Figure 5: s tar t parameters and fronl and rear foot horizontal force time curves
1000 -
8 0 0 -
600 -
400 -
200 -
0
F (N)
0 0,1
re *
^
0,2
loot
f\ / ^
r 1
0,3
t font (ool
/ \
V \
1 \ '
0,4 0,5 C T (s)
Esther Jones MOOm Desi - t l 121
Stan velocity : 3 75 m/s
start lime -. ,369 s 1
start acceleralion : 9.84 m/s
\ V
1 1
),6 0,7 0.8 0,9 1
62 Figure 6: start parameters and front and rear foot horizontal force time curves
When it is possible to repeal these tests at selected limes, ii becomes even more interes t ing . This is because the coach can evaluate the effects of the training load and the training volume on the sprini performance of each individual.
It is often valuable to bring together a group of athletes at a training camp, so that Iraining and evalualion can be combined. Recently, 12 athletes from a national team came lo Leuven for such a training camp. All athletes were evaluated, and the national coach received a ranking of his athletes for each relevant parameler: sprini acceleration, maximum running speed, speed endurance, start velocity, start time and start acceleration.
Another advantage of the system we have developed is that as all instruments of the system are portable, such a camp can be organised almost anywhere.
5 Specific advice for training
At the Leuven Athletic Sprint and Start Evalualion Centre, coaches expect more than jusl an evalualion of siarl and sprini performance. They want specific advice on training for each individual. This advice must, of course, be based on scientific findings. So, for example, in a recent experiment, we analysed Ihe relalionship between horizontal slarl acceleration and running speed during a 40 metres sprint among a group of 51 experienced sprinters. Primarily, we wanted to verify if, within this group of alhletes, the differences in sprinting speed could be explained by varialions in start performance.
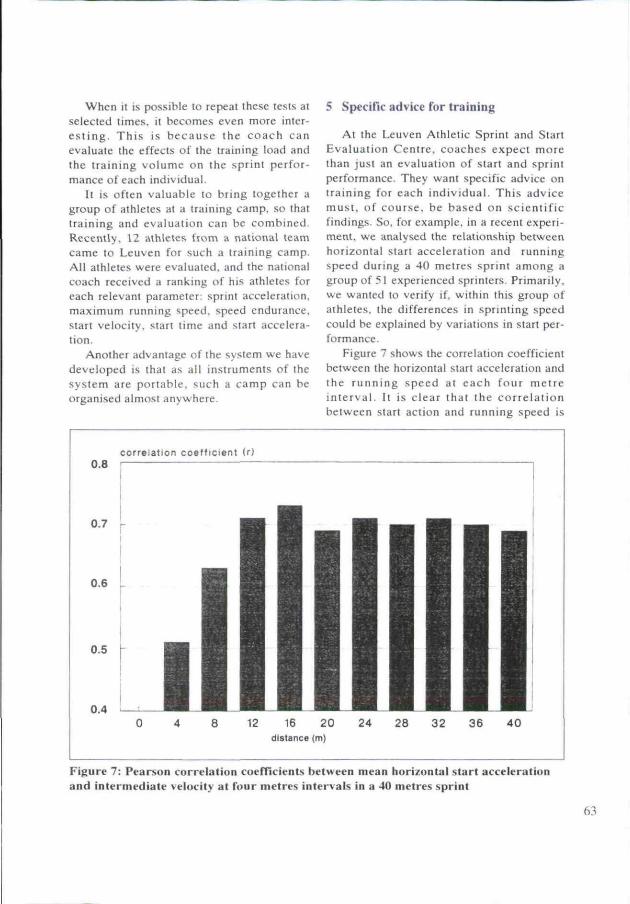
Figure 7 shows Ihe correlation coefficieni beiween the horizonial start acceleration and the running speed al each four metre inierval . It is clear that Ihe correla t ion between start action and running speed is
correlation coefficient (r) 0.8
0.7 r
0.6 .
0.5
0.4 16 20
distance (m)
Figure 7: Pearson correlation coefficients between mean horizontal start acceleration and intermediate velocity at four metres intervals in a 40 meires sprint
63
lowest in the first ten metres of Ihe run. E\'cn at Ihc two metre poinl Ihere is no significant correlation. As we find higher correlations between slarl action and running speed in the second part of the run compared to the first part, this analysis suggests that wi th in our g roup of sp r in te r s there is probably no causative connection between start performance and running speed during the first metre following Ihe start aclion, Bul otherwise there is a correlation of aboul 0.70 between start action and running speed from 10 to 4(1 metres.
We can Iherefore. conclude thai about 50% of the qualilies thai are relaled wiih a good start action, are also associated with Ihc ability to attain a high running speed. As we may consider Ihe start and sprini action as Iwo completely differeni skills with very few similarities regarding technique, we can suggest that the 50% of common performance related faclors within these two skills
are Io do with the muscle slrength of lower limbs. To provide coaches with more information related to sprini training, the athletic staff of our institute will, in the years to come, concenlrale further scieniific research on:
• The relationship belween strength training and sprint performance
• the re la t ionship be tween start act ion and sprint acceleration
M e a n w h i l e , the Leuven Athle t ic Spr in i and Slarl Evaluation Centre is open for the further evaluation of high level sprinters and na t iona l t e a m s , and for c o - o p e r a t i o n w i t h their coaches,
Il is our hope that this scientific approach to s p r i n t i n g wil l result in m o r e e f fec t ive Iraining programmes.
REFERENCES:
64
UbLECLUSE. C : VAN COPPENOILF, H . GORIS, M; DIELS. R.. DlDDEN. R,(1W()): Analysis of thc from and rear fool aclion in ilie sprint slarl. In Briiggemann and Rühl J,K.n (Eds). Techniques in Aihletics Conference pm-ceedings. Volume 2. pp.4(12-406,
VAN COPPENOLLE. H,; DELECLUSE. C ; GORIS. M,: BOHETS. W,. VANDEN EYNDE. E. (I9K9): Technology and devehipment of speed. Evalualion of thc .ttart. sprint and bodv composition of Pavoni. Cooman and Desruelles. AlhlelR-s Coach 23 (1): pp.K2-m
VAN COPPENOLLE. H-: DELECLUSE, C ; GORIS. M,; DIELS. R, (I'J'-X)): Evalualion of the start and sprini aciion of high level spriniers. In Briiggcman, G.P, and Riihl. J,K. (Eds). Techniques in Aihletics Conference profccdings Volume 2, pp..^%-4()l
tt'lTTERS, J.; HEREMANS, G,: BOHETS. W.; STIJNEN. V,: VAN COPPENOLLE. H, (198.'!): Tiie design and testing of a wire velocimeter. Journal of Sport Sciences (3), pp. 197-206,