43% increase in measured & indicated resources at
TRANSCRIPT
1
43% Increase in Measured & Indicated Resources at Wonawinta Silver Project
Highlights
• Measured and Indicated Resources increased 43% following completion of 14,000m in-fill RC drilling program
• Measured and Indicated Resources now account for 39% of total JORC Resources versus 28% previously
• The classification upgrade paves the way for the completion of the Wonawinta Mine Plan and release of Manuka’s maiden Wonawinta JORC reserve Q2 2021
• Manuka is set to become Australia’s largest primary silver producer commencing in Q3 2021 using existing stockpiles presently on the ROM pad
• Following processing of existing stockpiles, silver production from mining the Belah and Bimble pits to commence February 2022
• Further in-fill drilling of specific oxide targets within the Inferred Resource and Exploration Targets, will occur over the next six months.
Manuka Resources Ltd - ASX:MKR (‘Manuka’ or ‘the Company’), the 100% owner of Wonawinta Silver Project and Mt Boppy Gold Project (‘the Projects’) is pleased to announce the following Resource Update and upgrade for the Wonawinta Silver Project (“the Property”). This update follows an extensive 14,000 metre in-fill drilling program.
Mineral Resource Estimate Update
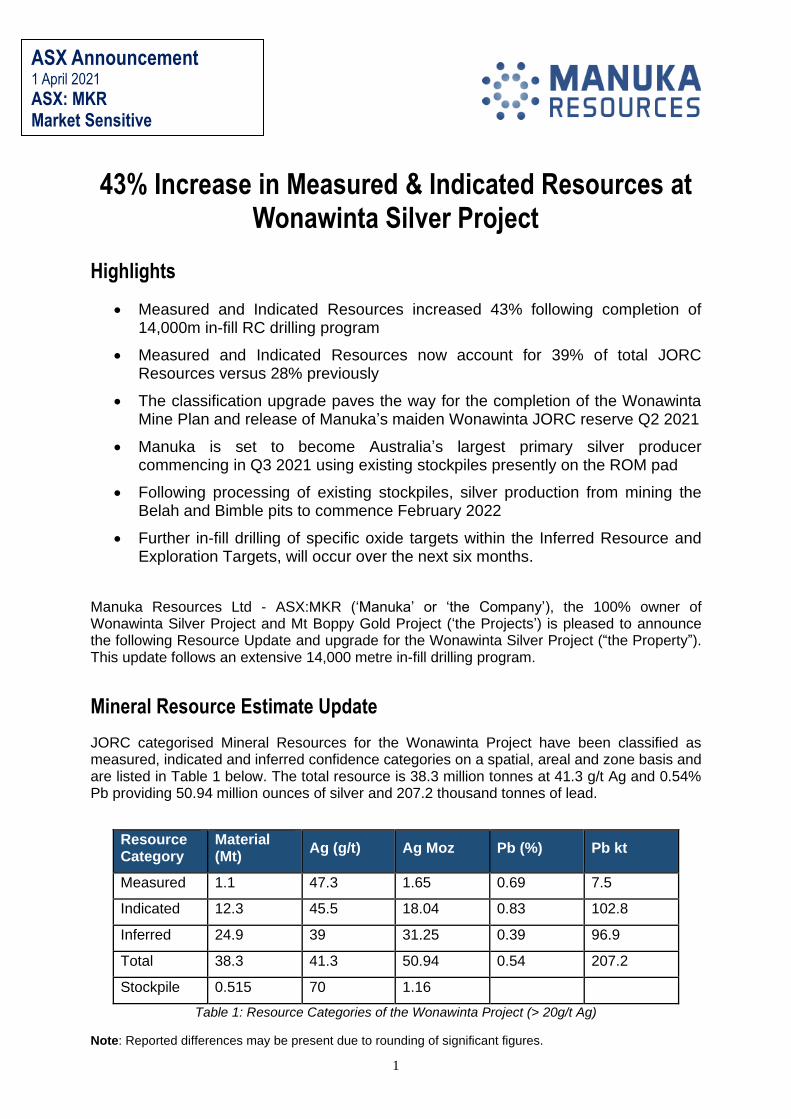
JORC categorised Mineral Resources for the Wonawinta Project have been classified as measured, indicated and inferred confidence categories on a spatial, areal and zone basis and are listed in Table 1 below. The total resource is 38.3 million tonnes at 41.3 g/t Ag and 0.54% Pb providing 50.94 million ounces of silver and 207.2 thousand tonnes of lead.
Resource Category
Material (Mt)
Ag (g/t) Ag Moz Pb (%) Pb kt
Measured 1.1 47.3 1.65 0.69 7.5
Indicated 12.3 45.5 18.04 0.83 102.8
Inferred 24.9 39 31.25 0.39 96.9
Total 38.3 41.3 50.94 0.54 207.2
Stockpile 0.515 70 1.16
Table 1: Resource Categories of the Wonawinta Project (> 20g/t Ag)
Note: Reported differences may be present due to rounding of significant figures.
ASX Announcement 1 April 2021
ASX: MKR Market Sensitive

2
“The information in this report that relates to Mineral Resources is based on information compiled by Mr Ian Taylor, who is a Certified Professional by The Australasian Institute of Mining and Metallurgy and is employed by Mining Associates Pty Ltd. Mr Taylor has sufficient experience which is relevant to the style of mineralisation and type of deposit under consideration and to the activity which he is undertaking to qualify as a Competent Person as defined in the 2012 Edition of the ‘Australasian Code for Reporting of Exploration Results, Mineral Resources and Ore Reserves’. Mr Taylor consents to the inclusion in the report of the matters based on his information in the form and context in which it appears”.
Dennis Karp, Executive Chairman commented: “This significant upgrade to Measured and Indicated JORC categories of 43% is an important outcome for the Company. The drilling program was designed not to grow ounces but to improve confidence in the previous, largely Inferred JORC Resource. It is pleasing to note that in this conversion process the silver grade and contained ounces have not changed materially but our confidence in the Wonawinta silver Resource is now even stronger and we can proceed through Mine Planning and Reserve estimation with greater certainty on projected outcomes. We expect to release the Mine Plan and our maiden Reserve at Wonawinta in the coming quarter and transform Manuka into Australia’s largest primary silver producer shortly thereafter.”
Locality
The Property is in the central part of New South Wales at latitude 32.2° South and longitude 145.75° East (Figure 1). The nearest population centres include Cobar, approximately 85 km north and Nymagee, approximately 55 km east.
Figure 1. Property location.
Project Location
The Wonawinta silver project area lies mostly on the gently-dipping western limb of the Wonawinta Anticline comprising Devonian-aged sedimentary rocks. The older (Silurian) Thule granite is exposed in the core of the anticline, which developed due to reverse movement on the Wonawinta Fault.

3
Figure 2 shows outcrop geology from NSW Geological Survey 1:100 000 scale mapping overlain with major structures and the location of the Manuka silver deposits (Manuka and Boundary pits). Outcrop in the Project area is variable. Sandstones and siltstones of the upper part of the Winduck Group and lower Mulga Downs Group form hills and ridges, whereas lower Winduck Group calcareous sediments are generally recessive and covered by a thin veneer of transported sediments.
Figure 2. Local geology in vicinity of Manuka silver deposits.
Deposit Type
Silver-lead-zinc mineralisation at Wonawinta has been interpreted as an oxidised (supergene-enriched) Mississippi-Valley Type (MVT) deposit. The overall regional geological setting, host rocks and geometry of mineralisation fit this model. There is evidence in fresh samples for low-temperature marcasite and colloform cavity-fill textures in sphalerite typical of MVT mineralisation. Sulphur isotope values indicate a basinal brine sulphur source, with some syn-diagenetic sedimentary pyrite.
High silver grades and the presence of significant amounts of mercury, arsenic and antimony are however, unusual for an MVT deposit. This geochemical association is more like Irish-style carbonate hosted mineralisation.
Most MVT deposits occur in carbonate shelf deposits on the margins of sedimentary basins. MVT mineral districts are commonly large, with individual deposits having a median size and grade of 7 Mt at 1.6% Pb, 6% Zn and 32.5 g/t Ag (Leach, Taylor, Fey, Diehl, & Saltus, 2010).

4
Deposits were formed by migration of warm saline aqueous solutions, similar to oilfield brines, through aquifers within carbonates near the basin periphery.
Mineralisation
The main zone of Ag-Pb-Zn mineralisation in the Property occurs along a 6 km strike length that is parallel to the Wonawinta Anticline hinge. Primary mineralisation is stratabound within the Booth Limestone Member. Most mineralisation occurs on the western limb of the Wonawinta Anticline close to the fold hinge, but to the north it also occurs on the eastern limb.
Two main mineralisation styles are developed in the Property: secondary oxide mineralisation and primary sulphide mineralisation (Figure 3).
Figure 3. Typical cross section through mineralisation, 6431560 mN
Drilling Techniques
The company commenced infill drilling within the inferred oxide resource at Wonawinta in August 2020, with the aim of upgrading the JORC category to Indicated. The oxide infill drilling program comprises 380 RC drill holes for 14,042m focussing on the Bimble and Belah areas (the Northern Pits). Oxide drilling to date has also covered the proposed pit extensions/step-outs at the Northern Pits, and the Pothole and Tweens areas (previous poorly-defined target areas between the Manuka and Boundary pits).
The Wonawinta Deeps sulphides proof of concept drilling program is ongoing, with 18 holes of the 20-hole program completed and the company waiting on independent assays.
Samples from all the RC drill holes were geologically logged while drilling was underway. Sub-sampling during drilling was routinely undertaken using a rig-mounted splitter that produced a 1-3kg sample that was representative of any given interval, for independent assay analysis.
All drilled RC samples were scanned with a portable XRF analyser (pXRF). The pXRF showed that it could reliably indicate the presence of silver. Comparison of the initial returned batches of assays to the pXRF readings from those samples showed a close and positive correlation. This allowed the company to subsequently despatch only those samples that the pXRF determined were mineralised.
At least one duplicate sample was routinely collected from each RC hole (more than one from holes deeper than 30 metres). The duplicate samples were despatched and assayed with the
5
regular sequence of samples and the resultant assays compared to their primary samples as a QAQC test of the assay procedure.
A “reference standard” sample was routinely inserted throughout the program as every 25th sample. The standard samples were despatched within the regular sequence of samples and the variability of their assays compared to other samples of the same standard as a QAQC test of the assay procedure.
The company initially used proprietary certified standards that remained on site from previous operators but determined that these small standards were not being put through the routine sample preparation process (crush and pulverise) prior to assay. Once the initial assays were returned and found to be reliable, inhouse standards were produced (in consultation with Ian Taylor) that comprised homogenised material from numerous mineralised intervals. The inhouse standards were then prepared as 3kg samples inserted into the sampling process and compared for variability as previously. The inhouse standards WWA2 and WWA3 proved to have excellent homogeneity and assay repeatability, with a very small standard deviation.
All samples were sent to an external laboratory (ALS in Orange) for preparation and analysis. Samples were dried, crushed and pulverised to get 85% passing a 75um sieve to provide a 0.5g sample for aqua regia digestion with an ICP-AES finish. Each sample was analysed for a multiple element suite. Where a silver assay was over 100ppm or lead and zinc were over 1%, those sample pulps was re-assayed and reported in a separate “Ore Grade” column.
Mineral Resource Estimate Approach
Mineralisation has been interpreted using deterministic modelling techniques of hanging wall and footwall contacts from sectional interpretations. Initial considerations focused on geological contacts of weathered clays, reduced clays (hydrothermal alteration), limestone contacts (top and bottom) and basement (consisting of arkose and granite). Specific wireframes of each contact were created along with the base of oxidation.
Global statistics encompassing RC and diamond core drill data were considered to determine a natural break in the distribution of silver and lead grades to be used in defining a mineralised domain. The dominant statistical break for determining mineralisation was 10 g/t silver. To determine the extent of mineralisation between footwall and hanging wall, lead and zinc could individually be above 1%. Lead mineralisation rarely extended higher or lower in the oxide profile than zinc or silver and these zones outside 10 g/t Ag were excluded. Zinc does not have complete assay coverage in the data supplied.
Footwall and hanging wall mineralisation contacts were extracted from the drill hole database and gridded surfaces were created using inverse distance squared (ID2) interpolation. Original data points were added back into the surfaces, ensuring they were “snapped” to the drill holes. Weathering profiles were used to assign oxidation state, and both lithology and oxidation state were used to assign bulk density.
Lithological contacts were extracted from the drill hole database and gridded in Mapinfo using minimum curvature interpolation with raw data added back in. Points were imported and the surfaces were wireframed in Surpac 7.4.1.
All drilling excluding blast holes, RAB and Air core holes were used to inform the lithological contacts and only RC (including RC grade control) and DD were used to inform the estimate.

6
Measured Indicated Inferred
Deposit Tonnes (kt)
Ag (g/t)
Pb (%)
koz kt Tonnes (kt)
Ag (g/t)
Pb (%)
Moz kt Tonnes (kt)
Ag (g/t)
Pb (%)
Moz kt
Blue Mountain
OX - - - - - - - - - - 999 28.1 0.4 0.9 3.9
Fr - - - - - - - - - - 8,101 34 0.3 8.9 26.7
Belah Ox - - - - - 1,778 51.4 1.2 2.9 21.5 534 50 1 0.9 5.1
Fr - - - - - 299 38.1 0.6 0.4 1.8 482 39.1 0.8 0.6 3.8
Bimble Ox - - - - - 3,180 44.6 1 4.6 33.1 497 39.6 1 0.6 5.1
Fr - - - - - 956 46.1 0.6 1.4 5.9 1,032 46.9 0.7 1.6 6.7
Boundary Ox 314 52.5 0.9 0.5 2.8 1,560 50 0.8 2.5 12 2,242 48.4 0.6 3.5 12.6
Fr 253 37.7 0.45 0.3 1.1 1,272 37.7 0.4 1.5 5.1 4,014 40.7 0.4 5.2 16.5
Tween Ox - - - - - - - - - - 1,675 35.6 0 1.9 -
Fr - - - - - - - - - - 2,427 42.6 0 3.3 -
Manuka Ox 144 59.4 1.02 0.3 1.5 1,418 42.4 0.9 1.9 12.1 777 33 0.6 0.8 4.6
Fr 376 44.9 0.56 0.5 2.1 1,348 49.2 0.6 2.1 8.6 1,918 44.5 0.6 2.7 10.9
Pothole Ox - - - - - 504 39.3 0.5 0.6 2.7 190 41 0.5 0.3 0.9
FR - - - - - - - - - - - - - - -
SubTotal Ox 458 54.6 0.9 0.8 4.3 8,440 46.4 1 12.6 81.3 6,914 39.9 0.5 8.9 32.2
SubTotal Fr 629 42 0.5 0.8 3.2 3,875 43.8 0.6 5.5 21.4 17,974 38.7 0.4 22.3 64.6
Total 1,087 47.3 0.7 1.7 7.5 12,315 45.6 0.8 18 102.8 24,888 39 0.4 31.2 96.8
Table 2. Wonawinta Resource by Prospect (>20g/t Ag)
Figure 1. Wonawinta Project Resource Boundaries

7
All resources have been stated above a 20g/t Ag cut-off, the cut-off grade is based on past mining costs.
Resource classification is based on data quality, drill density, number of informing samples, kriging efficiency, conditional bias slope, average distance to informing samples and deposit consistency (geological continuity. Resources have been classified according to the JORC 2012 code as Measured, Indicated and Inferred. Areas of tight grade control style drill patterns where grade and geological continuity are confirmed are classified as measured. Areas of sufficient drilling to assume geological and grade continuity are classified as Indicated. In areas broadly drilled and sampled where geological and grade continuity can only be inferred are classified as Inferred resources. It is expected that most of the Inferred Mineral Resources would upgrade to Indicated Mineral Resources with continued exploration. However, due to the uncertainty of Inferred Mineral Resources, it should not be assumed that such upgrading will always occur. Distal portions of the model with sparce drilling indicating mineralisation exists, but too sparce to assume geological continuity remain as exploration potential.
Comparison with Previous Estimates
The previous block model is shown in Table 3 reported above 20 g/t Ag. The updated or current resource is shown in Table 4 reported above a 20g/t Ag cut off. The updated model slightly reduces the total tonnes and marginally increases the grade of both silver and lead, resulting in a reduction of contained silver ounces and an increase in the contained lead tonnes. However, the updated or current Resource sees some 43% more tonnes reclassified into the measured and indicated classifications. The additional reclassified tonnages will be available and assessed for the future Reserve update, planned for Q2, 2021.
Resource Category
Material (Mt)
Ag (g/t) Ag Moz Pb (%) Pb kt
Measured 0.9 45 1.3 0.7 6.2
Indicated 8.5 48.5 13.2 0.79 67.5
Inferred 29.4 40 37.9 0.55 162.9
Total 38.8 42 52.4 0.61 236.6
Table 3. 2016 Resource Estimate reported at >20g/t Ag
Resource Category
Material (Mt)
Ag (g/t) Ag Moz Pb (%) Pb kt
Measured 1.1 47.3 1.65 0.69 7.5
Indicated 12.3 45.5 18.04 0.83 102.8
Inferred 24.9 39 31.25 0.39 96.9
Total 38.3 41.3 50.94 0.54 207.2
Table 4. 2021 Resource Estimate reported >20g/t Ag

8
About Manuka
Manuka Resources Limited (ASX: MKR) is an Australian mining company located in the Cobar Basin, central west New South Wales. It is the 100% owner of two fully permitted gold and silver projects which include the following:
Mt Boppy Gold mine and neighbouring tenements hosting an existing open pit Measured and Indicated Resource of 351,430 tonnes grading 4.62 g/t gold, based on a cut-off grade of 1.6 g/t for material within its current open pit design and a cut-off grade of 3.0 g/t for material below the current pit design, and an inferred resource of 11,000 tonnes grading 6.7 g/t below the designed pit reported at a 3.0 g/t cut off, The Mt Boppy project is currently in production and processing its gold ore through the Company’s processing plant at Wonawinta.
Wonawinta silver project, with mine, processing plant and neighbouring tenements, hosting 51 million ounces of silver in an inferred JORC compliant silver resource grading 42 g/t silver at a cut-off grade of 20 g/t silver. The Wonawinta processing plant has a nameplate capacity of 850,000 tonnes per year.
The Wonawinta silver project was previously the largest producer of primary silver in Australia. Manuka intends to resume the production of silver doré in Q3 2021, following the completion of mining at Mt Boppy.
This announcement has been approved for release by the Board of Directors of Manuka Resources Limited. For further information contact: Dennis Karp Media Contact Executive Chairman Ben Henri Manuka Resources Limited M+C Partners 0412 268 114 0473 246 040
Important Information
This report includes forward-looking statements and comments about future events, including the Company’s expectations about the performance of its businesses. Forward-looking words such as “expect”, “should”, “could”, “may”, “predict”, “plan”, “will”, “believe”, “forecast”, “estimate”, “target” or other similar expressions are intended to identify forward-looking statements. Such statements involve known and unknown risks, uncertainties, assumptions and other important factors, many of which are beyond the control of the Company and which may cause actual results, performance or achievements to differ materially from those expressed or implied by such statements. Forward-looking statements are provided as a general guide only, and should not be relied on as an indication or guarantee of future performance. Given these uncertainties, recipients are cautioned to not place undue reliance on any forward-looking statement. Subject to any continuing obligations under applicable law, the Company disclaims any obligation or undertaking to disseminate any updates or revisions to any forward-looking statements in this report to reflect any change in expectations in relation to any forward-looking statements or any change in events, conditions or circumstances on which any such statement is based. No Limited Party or any other person makes any representation or gives any assurance or guarantee that the occurrence of the events expressed or implied in any forward-looking statements in the report will occur.

9
Previously reported information This report includes information that relates to Mineral Resources and Ore Reserves which were prepared and first disclosed under JORC Code 2012. The information was extracted from the Company’s previous ASX announcement dated 10 July 2020 (Prospectus) and updated in its ASX release on 2 February 2021. The Company confirms that it is not aware of any new information or data that materially affects the information included in the original market announcement and, in the case of reporting of Ore Reserves and Mineral Resources, that all material assumptions and technical parameters underpinning the estimates in the relevant market announcement continue to apply and have not materially changed. The Company confirms that the form and context in which any Competent Person’s findings are presented have not been materially modified from the original market announcement. Competent Person Statement Information in this announcement that relates to Exploration Results and Resource Updates is based on, and fairly represents, information and supporting documentation prepared by Mr Ian Taylor, a Competent Person who is a Member of the Australian Institute of Geoscientists. Mr Taylor has sufficient experience which is relevant to the style of mineralisation and type of deposit under consideration and to the activity which he is undertaking to qualify as a Competent Person (or “CP”) as defined in the 2012 Edition of the Australasian Code for Reporting of Information in this announcement that relates to Exploration Results. Mr Taylor consents to the inclusion in this announcement of all technical statements based on his information in the form and context in which they appear.

10
APPENDIX 1: JORC CODE, 2012 EDITION – TABLE 1
SECTION 1. Sampling Techniques and Data
Criteria JORC Code explanation Commentary
Sampling techniques
• Nature and quality of sampling (e.g. cut channels, random chips, or specific specialised industry standard measurement tools appropriate to the minerals under investigation, such as down hole gamma sondes, or handheld XRF instruments, etc). These examples should not be taken as limiting the broad meaning of sampling.
• Include reference to measures taken to ensure sample representivity and the appropriate calibration of any measurement tools or systems used.
• Aspects of the determination of mineralisation that are Material to the Public Report.
• Reverse circulation (RC), diamond coring (core) and aircore (AC) drilling undertaken by Cobar Consolidated Resources Limited (CCR) was used to obtain over 76% of the samples and Manuka Resources Ltd (MKR) have obtained 15% of the samples used in the current resource estimate.
• Grade control RC drilling by Black Oak Minerals (BOK) in 2015 is also included. The remaining samples were sourced from diamond and RC undertaken by previous explorers Geopeko, CBH, Savage, Pasminco and Triako. The drilling database within the resource area comprises 2163 RC and 13 pre-collared core holes and 49 diamond core holes. Also, in the database (not used in the resource estimate) are 920 rotary air blast holes, 148 Air Core holes and 10,472 blast holes.
• RC and AC samples were predominantly collected over one metre intervals and subsampled utilising a rig-mounted cyclone/ cone splitter to provide a 1.5kg to 3.0kg assay sample. Diamond core (NQ, HQ) was halved with a diamond saw, PQ core was ¼ cored. In highly weathered material a hammer and chisel were used to provide representative sub-samples. Aircore samples were sub-sampled every metre using a two-tier riffle splitter. MRK drill core was photographed in the splits before placement into core trays.
• Measures taken to ensure the sample representivity included routine monitoring of sample recovery and RC field duplicates. Assay quality control measures included duplicates, blanks and certified reference standards. In addition, the laboratories undertook their own duplicate sampling as part of their own internal QA processes. The available QAQC data demonstrate that the sampling and assaying are of appropriate quality for use in the current estimates.
• MKR used portable XRF readings to determine intervals to be sent for analysis, blank holes in the database showed no silver in the pXRF readings.
Drilling techniques
• Drill type (eg core, reverse circulation, open-hole hammer, rotary air blast, auger, Bangka, sonic, etc) and details (eg core diameter, triple or standard tube, depth of diamond tails, face-sampling bit or other type, whether core is oriented and if so, by what method, etc).
• All RC drilling used face sampling bits.
• Core holes were drilled PQ triple tube (83mm core diameter), HQ (63mm core diameter) triple tube was trailed. The diamond holes were surveyed using a multi-shot camera and core orientations undertaken using an Ace orientation tool. The core was photographed in detail, and the core remaining after sampling was used in its entirety for metallurgical test work.
Drill sample recovery
• Method of recording and assessing core and chip sample recoveries and results assessed.
• Measures taken to maximise sample recovery and ensure representative nature of the samples.
Whether a relationship exists between sample recovery and grade and whether sample bias may have occurred due to preferential loss/gain of fine/coarse material.
• RC drilling was closely monitored by field geologists and used face-sampling bits, and generally had sufficient air capacity to provide dry, high recovery samples. The RC drilling rigs usually had access to booster compressors.
• For RC holes visual estimates were made of recovery and wetness. It is estimated that less than 2% of samples were damp or wet.
• Diamond drilling core recovery was estimated from recovered core lengths and showed an average recovery of 89% within mineralised sections.
• The available sample recovery data shows generally reasonable recoveries and no relationship between recovery and assay grade, and no indication of significant biases due to sample loss.
Logging • Whether core and chip samples have been geologically and geotechnically logged to a level of detail to support appropriate Mineral Resource estimation, mining studies and
• All RC and AC samples were logged for lithology, texture, grainsize, colour, alteration, regolith and wetness. In addition core holes were geotechnically logged and had density determinations undertaken. Logging of holes drilled by explorers prior to MKR was undertaken in a

11
Criteria JORC Code explanation Commentary
metallurgical studies.
• Whether logging is qualitative or quantitative in nature. Core (or costean, channel, etc) photography.
The total length and percentage of the relevant intersections logged.
similar manner. MKR and CCR routinely photographed all diamond core and RC chip trays.
• All the resource drilling has been qualitatively logged with appropriate detail, to support the current Mineral Resource estimates, and metallurgical and mining studies.
Sub-sampling techniques and sample preparation
• If core, whether cut or sawn and whether quarter, half or all core taken.
• If non-core, whether riffled, tube sampled, rotary split, etc and whether sampled wet or dry.
• For all sample types, the nature, quality and appropriateness of the sample preparation technique.
• Quality control procedures adopted for all sub-sampling stages to maximise representivity of samples.
• Measures taken to ensure that the sampling is representative of the in situ material collected, including for instance results for field duplicate/second-half sampling.
Whether sample sizes are appropriate to the grain size of the material being sampled.
• RC hole logs were reviewed and the samples scanned with a field portable XRF analyser prior to the selection of mineralised or potentially mineralised intervals for laboratory analysis. Remaining samples were stored pending receipt of analytical results. The sampled intervals were extended if required.
• Sub-sampling of RC holes was undertaken using a rig-mounted rotary or riffle splitter to provide a 1-3kg lab sample. Less than two percent of the samples were damp or wet.
• Harder sections of PQ core were filleted (CCR) or ¼ cored (MKR) with a diamond saw. Clay sections of core were sampled with a hammer or chisel, or by filleting with an angle grinder. In all cases the sampled portion represented about 20% of the core or 2kg per linear metre.
• All samples were sent to an external laboratory (mostly ALS Global - Orange) for preparation and analysis. Samples were dried, crushed and pulverised to get 85% passing a 75um sieve to provide a 0.5g sample for aqua regia digestion with an ICP-AES finish.
• RC field duplicates undertaken on a 1:40 basis showed acceptable variation and repeatability.
• Samples sizes are appropriate to the grain size of the silver mineralisation which is predominantly very fine.
Quality of assay data and laboratory tests
• The nature, quality and appropriateness of the assaying and laboratory procedures used and whether the technique is considered partial or total.
• For geophysical tools, spectrometers, handheld XRF instruments, etc, the parameters used in determining the analysis including instrument make and model, reading times, calibrations factors applied and their derivation, etc.
• Nature of quality control procedures adopted (eg standards, blanks, duplicates, external laboratory checks) and whether acceptable levels of accuracy (ie lack of bias) and precision have been established.
• Samples from RC and diamond drilling were sent to ALS laboratories for preparation and analyses. No information from geophysical methods or hand held XRF devices are used in resource estimations, except to confirm holes are barren, as opposed to assays pending.
• Aqua-regia analyses are considered to be a total extraction given the style of mineralisation. MKR’s BOKs and CCR’s samples were analysed by ALS Global, an accredited commercial laboratory in Orange, NSW. After oven drying, (and jaw crushing of core samples and RC samples with coarse material), the samples were pulverised to at least 85% passing 75 microns. Sub-samples were digested by aqua regia and analysed by ICP for silver, lead, zinc, iron, sulphur, manganese, calcium and magnesium. When results were above upper detection limits the analyses were repeated using a multi-acid digestion and ICP. Quality control methods included field duplicates, coarse blanks and certified standards. Three control samples were inserted for every 20 to 30 samples. The laboratories also maintain their own process of QA/QC utilising standards, repeats and duplicates.
• QAQC procedures and results for MRK’s drilling are available and were reviewed by MA.
• QAQC procedures and results for pre-CCR and BOK drilling are not available, although QAQC samples are present in the assay databases. The pre-CCR/BOK drilling only informs a small proportion of the resources.
• The quality control measures have established that the assaying is of appropriate precision and accuracy for the current estimates.
Verification of sampling and assaying
• The verification of significant intersections by either independent or alternative company personnel.
• The use of twinned holes.
• Documentation of primary data, data entry procedures, data verification, data storage
• Reported significant intersections were reviewed by geological staff onsite, and checked by senior geological management, including the Exploration/Geology Manager
• Six diamond holes and two RC holes were drilled to twin earlier RC and aircore holes, with satisfactory results.
• Geological logging data and sampling information is
12
Criteria JORC Code explanation Commentary
(physical and electronic) protocols.
Discuss any adjustment to assay data.
recorded on printed standard forms and then key punched into Excel spreadsheets.
• Summaries of geological logs, survey and analysis data were electronically merged and validated into a central database in Surpac mining software. Data was viewed and interpreted using Surpac software.
• Assay results were not modified for resource estimation.
• All pXRF readings over 10ppm are verified by certified assay analysis.
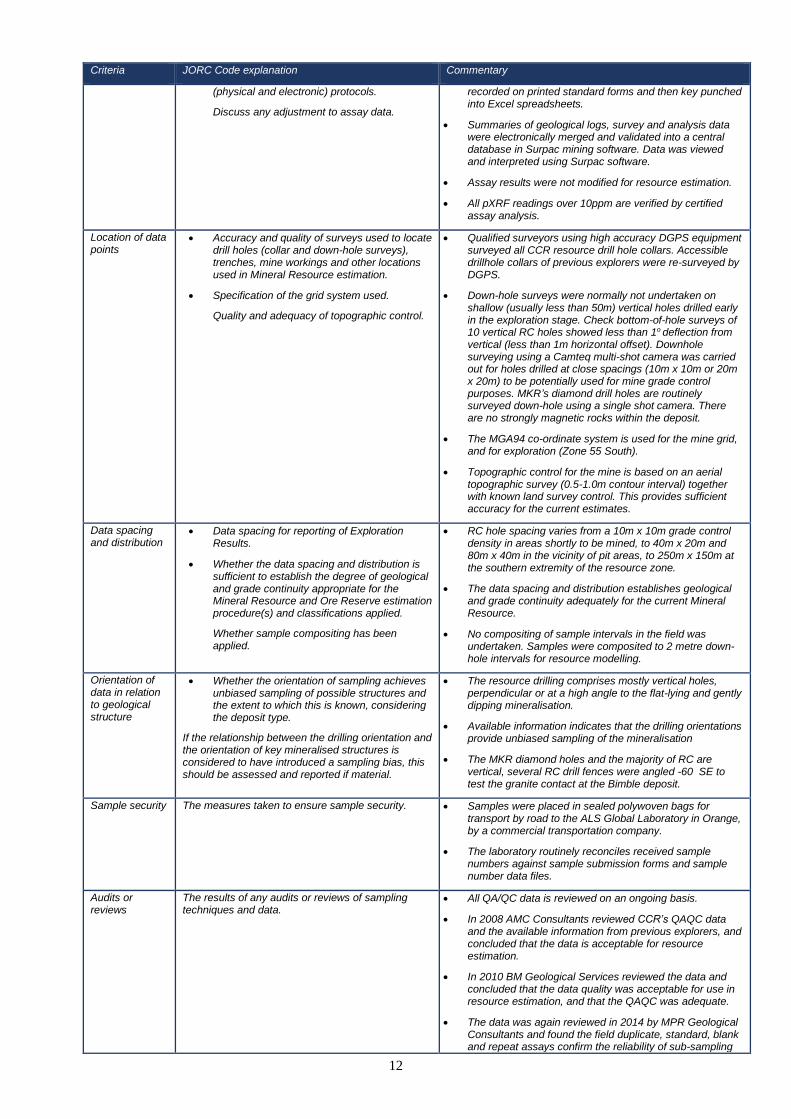
Location of data points
• Accuracy and quality of surveys used to locate drill holes (collar and down-hole surveys), trenches, mine workings and other locations used in Mineral Resource estimation.
• Specification of the grid system used.
Quality and adequacy of topographic control.
• Qualified surveyors using high accuracy DGPS equipment surveyed all CCR resource drill hole collars. Accessible drillhole collars of previous explorers were re-surveyed by DGPS.
• Down-hole surveys were normally not undertaken on shallow (usually less than 50m) vertical holes drilled early in the exploration stage. Check bottom-of-hole surveys of 10 vertical RC holes showed less than 1o deflection from vertical (less than 1m horizontal offset). Downhole surveying using a Camteq multi-shot camera was carried out for holes drilled at close spacings (10m x 10m or 20m x 20m) to be potentially used for mine grade control purposes. MKR’s diamond drill holes are routinely surveyed down-hole using a single shot camera. There are no strongly magnetic rocks within the deposit.
• The MGA94 co-ordinate system is used for the mine grid, and for exploration (Zone 55 South).
• Topographic control for the mine is based on an aerial topographic survey (0.5-1.0m contour interval) together with known land survey control. This provides sufficient accuracy for the current estimates.
Data spacing and distribution
• Data spacing for reporting of Exploration Results.
• Whether the data spacing and distribution is sufficient to establish the degree of geological and grade continuity appropriate for the Mineral Resource and Ore Reserve estimation procedure(s) and classifications applied.
Whether sample compositing has been applied.
• RC hole spacing varies from a 10m x 10m grade control density in areas shortly to be mined, to 40m x 20m and 80m x 40m in the vicinity of pit areas, to 250m x 150m at the southern extremity of the resource zone.
• The data spacing and distribution establishes geological and grade continuity adequately for the current Mineral Resource.
• No compositing of sample intervals in the field was undertaken. Samples were composited to 2 metre down-hole intervals for resource modelling.
Orientation of data in relation to geological structure
• Whether the orientation of sampling achieves unbiased sampling of possible structures and the extent to which this is known, considering the deposit type.
If the relationship between the drilling orientation and the orientation of key mineralised structures is considered to have introduced a sampling bias, this should be assessed and reported if material.
• The resource drilling comprises mostly vertical holes, perpendicular or at a high angle to the flat-lying and gently dipping mineralisation.
• Available information indicates that the drilling orientations provide unbiased sampling of the mineralisation
• The MKR diamond holes and the majority of RC are vertical, several RC drill fences were angled -60 SE to test the granite contact at the Bimble deposit.
Sample security The measures taken to ensure sample security. • Samples were placed in sealed polywoven bags for transport by road to the ALS Global Laboratory in Orange, by a commercial transportation company.
• The laboratory routinely reconciles received sample numbers against sample submission forms and sample number data files.
Audits or reviews
The results of any audits or reviews of sampling techniques and data.
• All QA/QC data is reviewed on an ongoing basis.
• In 2008 AMC Consultants reviewed CCR’s QAQC data and the available information from previous explorers, and concluded that the data is acceptable for resource estimation.
• In 2010 BM Geological Services reviewed the data and concluded that the data quality was acceptable for use in resource estimation, and that the QAQC was adequate.
• The data was again reviewed in 2014 by MPR Geological Consultants and found the field duplicate, standard, blank and repeat assays confirm the reliability of sub-sampling

13
Criteria JORC Code explanation Commentary
and assaying.
• MA reviewed the MKR QAQC data and concluded it is suitable for use in a Resource Estimate

14
SECTION 2. Reporting of Exploration Results
Criteria JORC Code explanation Commentary
Mineral tenement and land tenure status
• Type, reference name/number, location and ownership including agreements or material issues with third parties such as joint ventures, partnerships, overriding royalties, native title interests, historical sites, wilderness or national park and environmental settings.
• The security of the tenure held at the time of reporting along with any known impediments to obtaining a licence to operate in the area.
• ML1659 is held by Manuka Resources Limited (MKR) MKR is holder of 7 exploration licences in the district. The exploration Licences are EL 6155, EL 6302, EL6623, EL 6482, EL 7515, EL 8498 and EL 7345.
• The property Manuka, on which the resources are situated, is owned by MRL.
• The resources occur in the Western Lands Leases of NSW where Native Title has been extinguished. However, where disturbance could occur by mining operations or drilling, Aboriginal heritage surveys are undertaken in consultation with traditional owners.
• The Company notes that no land within the licence area may be classified as sensitive land. No further approvals other than those required under the Mining Act 1992 are required.
Exploration done by other parties
• Acknowledgment and appraisal of exploration by other parties.
• Stream sediment sampling by Geopeko in 1989 resulted in the discovery of significant base metal sample values. Drilling programs (RAB, RC and diamond) were carried out by Geopeko, CRA, Savage Resources, Pasminco and Triako. Follow up work by CCR resulted in definition of the Wonawinta silver - lead deposits. BOK completed some RC grade control drilling in one open pit.
Geology • Deposit type, geological setting and style of mineralisation.
• The Wonawinta silver-lead-zinc project, is a carbonate-hosted Pb-Zn-Ag deposit with affinities to MVT-style mineralisation. The primary host is the dolomitised upper fossiliferous portion of the Booth Limestone member of the Early Devonian Winduck Group.
• Oxide Ag-Pb-Zn mineralisation is developed as a gently-dipping blanket up to 160m wide and averaging 13m thick on and around the contact between the Booth Limestone and an overlying thick quartz-kaolinite-illite- muscovite clay sequence. Discrete silver minerals are rare with the bulk of the silver associated with lead and iron oxides and sulphates, and lead and zinc carbonates and dolomite. Primary mineralisation consists of vein, breccia and replacement style marcasite, galena and sphalerite.
• The NNW-trending, strata-bound Wonawinta deposit extends for about 6km along the western flank of the Wonawinta Anticline.
Drill hole Information
• A summary of all information material to the understanding of the exploration results including a tabulation of the following information for all Material drill holes:
• easting and northing of the drill hole collar
• elevation or RL (Reduced Level – elevation above sea level in metres) of the drill hole collar
• dip and azimuth of the hole
• down hole length and interception depth
• hole length.
• If the exclusion of this information is justified on the basis that the information is not Material and this exclusion does not detract from the understanding of the report, the Competent Person should clearly explain why this is the case.
• Drillhole data and results are too numerous to list. No new exploration results are included in this announcement.
• Summary drillhole information was prepared and first disclosed under the JORC Code 2004. It is not being reported in detail according to the JORC Code 2012 on the basis that the information has not materially changed since it was originally reported.
• Drilling by MKR has been publicly disclosed under the JORC Code 2012 on an ongoing basis as appropriate.
Data aggregation methods
• In reporting Exploration Results, weighting averaging techniques, maximum and/or minimum grade truncations (eg cutting of high grades) and cut-off grades are usually Material and should be stated.
• Where aggregate intercepts incorporate short lengths of high grade results and longer lengths
• No new exploration results are included in this announcement.

15
Criteria JORC Code explanation Commentary
of low grade results, the procedure used for such aggregation should be stated and some typical examples of such aggregations should be shown in detail.
• The assumptions used for any reporting of metal equivalent values should be clearly stated.
Relationship between mineralisation widths and intercept lengths
• These relationships are particularly important in the reporting of Exploration Results.
• If the geometry of the mineralisation with respect to the drill hole angle is known, its nature should be reported.
• If it is not known and only the down hole lengths are reported, there should be a clear statement to this effect (eg ‘down hole length, true width not known’).
• The resource drilling is dominated by steep to vertical holes drilled perpendicular or at a high angle to gently dipping mineralisation
Diagrams • Appropriate maps and sections (with scales) and tabulations of intercepts should be included for any significant discovery being reported These should include, but not be limited to a plan view of drill hole collar locations and appropriate sectional views.
• Appropriate diagrams in relation to the deposit, including plans and cross sections, accompany previous public announcements.
Balanced reporting
• Where comprehensive reporting of all Exploration Results is not practicable, representative reporting of both low and high grades and/or widths should be practiced avoiding misleading reporting of Exploration Results.
• It is not practical to list individual drill holes and intersections due to the high number of drill holes concerned. No new exploration results are included in this report.
Other substantive exploration data
• Other exploration data, if meaningful and material, should be reported including (but not limited to): geological observations; geophysical survey results; geochemical survey results; bulk samples – size and method of treatment; metallurgical test results; bulk density, groundwater, geotechnical and rock characteristics; potential deleterious or contaminating substances.
• No exploration data has been collected or is considered material to this announcement.
Further work • The nature and scale of planned further work (eg tests for lateral extensions or depth extensions or large-scale step-out drilling).
• Diagrams clearly highlighting the areas of possible extensions, including the main geological interpretations and future drilling areas, provided this information is not commercially sensitive.
• MKR intend to develop further infill drilling and resource extension drilling budget as a result of this update to the Mineral Resource Estimate
• Manuka Resources has commenced an initial 16 hole program as proof of concept for base metal sulphides hosted within the Booth Limestone. This program will be reported on in due course.

16
SECTION 3. Estimation and Reporting of Mineral Resources
Criteria JORC Code explanation Commentary
Database integrity
• Measures taken to ensure that data has not been corrupted by, for example, transcription or keying errors, between its initial collection and its use for Mineral Resource estimation purposes.
• Data validation procedures used
• Resources were estimated from drill hole data in a MS Access format database linked to Geovia Surpac. Consistency checking between and within these files showed no significant inconsistencies.
• Historic data were supplied as CSV files exported from a Micromine database. Supplied data is assumed validated and checked for data corruption, based on historic resource estimation reports that detail validation checks. Random checks of assay values in database against original assay certificates did not find any inconsistencies. All data was imported into an Access database linked to Surpac mining software and checked for errors in collar locations, down hole depths and intervals.
Site visits • Comment on any site visits undertaken by the Competent Person and the outcome of those visits.
• If no site visits have been undertaken indicate why this is the case.
• The competent person has visited the site on three occasions in March 2016, August 2020 and in December 2020 for one to two days to examine the geological setting of the deposit, observe drilling activities including sampling logging and the core storage facility.
Geological inter-pretation
• Confidence in (or conversely, the uncertainty of) the geological interpretation of the mineral deposit
• Nature of the data used and of any assumptions made.
• The effect, if any, of alternative interpretations on Mineral Resource estimation.
• The use of geology in guiding and controlling Mineral Resource estimation.
• The factors affecting continuity both of grade and geology
• Geological setting and mineralisation controls of the deposit have been confidently established from drill hole logging and geological mapping, including development of a robust three-dimensional model of the major rock units.
• Geological and mineralisation interpretation was carried out on approximately 10 m spaced sections in the pit areas and 25 m spaced sections away from the pit areas, oriented with the main drilling direction.
• Resources were estimated within a mineralised domain wireframe capturing the zone of continuous mineralisation grading more than approximately 10 g/t silver. Intercepts of lesser grade were sometimes included to aid continuity.
• The domains are flat lying and comprise a main, generally north-south trending zone, and two smaller subsidiary zones. The main zone was subdivided into seven mineralised domains on the basis of the tenor of silver grades, data spacing and mineralisation orientation.
• Drill hole logging and sampling, surface mapping and grade control including blast hole sampling were all used to help build the geological and mineralisation models to a high degree of confidence. The mineralised domain displayed very good continuity between sections.
• Lithological wire-frames interpreted from drill hole logging were used to assign densities to the estimates.
• Due to the confidence in understanding of mineralisation controls and the robustness of the geological model, investigation of alternative interpretations is unnecessary.
Dimensions • The extent and variability of the Mineral Resource expressed as length (along strike or otherwise), plan width, and depth below surface to the upper and lower limits of the Mineral Resource
• The main mineralised zone extends over approximately 6.5 km of strike with an average width of approximately 380 m.
• Thickness of the mineralised domains averages around 13 m with an average of around 36 m of barren overburden. Estimated resources extend to around 100 m depth.

17
Estimation and modelling techniques
• The nature and appropriateness of the estimation technique(s) applied and key assumptions, including treatment of extreme grade values, domaining, interpolation parameters and maximum distance of extrapolation from data points. If a computer assisted estimation method was chosen include a description of computer software and parameters used.
• The availability of check estimates, previous estimates and/or mine production records and whether the Mineral Resource estimate takes appropriate account of such data.
• The assumptions made regarding recovery of by-products.
• Estimation of deleterious elements or other non-grade variables of economic significance (eg sulphur for acid mine drainage characterisation).
• In the case of block model interpolation, the block size in relation to the average sample spacing and the search employed.
• Any assumptions behind modelling of selective mining units.
• Any assumptions about correlation between variables.
• Description of how the geological interpretation was used to control the resource estimates.
• Discussion of basis for using or not using grade cutting or capping.
• The process of validation, the checking process used, the comparison of model data to drill hole data, and use of reconciliation data if available.
• Silver resources were estimated by Ordinary Kriging within unfolded model space that preserved the stratiform nature of mineralisation. Lead, calcium, iron and sulphur grades were estimated by Ordinary Kriging.
• Continuity of silver grades was characterised by variograms modelled for the main mineralised domains.
• Silver, lead and zinc Lead estimates for each domain included upper cuts of between 2.5 and 5% which generally approximate the 98.5th percentile of each dataset.
• Mineralised domains boundaries were generally extrapolated around 20 m across strike and up to 100 m along strike from drill holes.
• Some areas of mineralisation are broadly sampled with up to approximately 240 m between drill traverses. In these areas, the estimates are extrapolated to around 120 m from drilling (1/2 the drill spacing).
• The mineralised domains used for resource estimation are consistent with geological interpretation of mineralisation controls.
• Geovia Surpac software was used for data compilation, domain wire-framing, coding of composite values, and resource estimation.
• The estimation techniques are appropriate for the mineralisation style.
• Available information suggests that the blast hole samples poorly represent grade and were not used in to estimate grade of the Mineral Resource. (they were used to help define the extents of mineralisation)
• With allowance for these deficiencies in the production data, the current estimates reconcile reasonably with production.
• Estimated resources include only silver and lead grades, with no assumptions about recovery of by-products.
• The resource model includes estimates of sulphur, iron and calcium grades within the mineralised domains.
• Resources were estimated into varying block sizes depending on drill spacing: 10 x 10 x 2.5 m where RC grade control exists; 40 x 40 x 10 where only wide-spaced exploration drill lines exist, and 20 x 20 x 5 in all other areas.
• Estimation of silver, lead, zinc, iron, and sulphur occurred in un-fold space, composite locations and blocks were unfolded using the midpoint of the mineralised domain as a reference surface. Calcium grades were estimated without-unfolding.
• The estimation included a four pass search strategy with a limitation on the maximum number of samples per drill hole. Major axis search distances ranged from 50 m to 75 m, with a semi-major ratio between 1 and 2.2 and a minor ratio between 1 and 3.8.
• The modelling did not include any specific assumptions about correlation between variables.
• Wire-framed interpretations of key rock units were used to assign densities to the estimates.
• Model validation included visual comparison of model estimates and composite grades, and trend (swath) plots, along with comparison with production estimates.
• Available information suggests that mined grade control ore outlines have included significant misclassification and comparison between production and model estimates are not definitive.
Moisture • Whether the tonnages are estimated on a dry basis or with natural moisture, and the method of determination of the moisture content
• Tonnages were estimated on a dry basis

18
Cut-off parameters
• The basis of the adopted cut-off grade(s) or quality parameters applied.
• A cut-off grade was applied according to actual mining and processing methods and their associated costs, recoveries, state royalties and silver price (AU$30/oz in this case). A cut-off grade of 20 g/t was used for any material that could potentially be mined by open pit methods.
Mining factors or assumptions
• Assumptions made regarding possible mining methods, minimum mining dimensions and internal (or, if applicable, external) mining dilution. It is always necessary as part of the process of determining reasonable prospects for eventual economic extraction to consider potential mining methods, but the assumptions made regarding mining methods and parameters when estimating Mineral Resources may not always be rigorous. Where this is the case, this should be reported with an explanation of the basis of the mining assumptions made.
• No mining factors have been applied to the in-situ grade estimates for mining dilution or loss as a result of the grade control or mining process. No metallurgical factors have been applied to the in situ grade estimates
• Open Pit Mining is a considered a likely scenario for extracting the mineral resources.
Metallurgical factors or assumptions
• The basis for assumptions or predictions regarding metallurgical amenability. It is always necessary as part of the process of determining reasonable prospects for eventual economic extraction to consider potential metallurgical methods, but the assumptions regarding metallurgical treatment processes and parameters made when reporting Mineral Resources may not always be rigorous. Where this is the case, this should be reported with an explanation of the basis of the metallurgical assumptions made
• Actual silver recoveries based on plant performance since July 2011.
Environmental factors or assumptions
• Assumptions made regarding possible waste and process residue disposal options. It is always necessary as part of the process of determining reasonable prospects for eventual economic extraction to consider the potential environmental impacts of the mining and processing operation. While at this stage the determination of potential environmental impacts, particularly for a greenfields project, may not always be well advanced, the status of early consideration of these potential environmental impacts should be reported. Where these aspects have not been considered this should be reported with an explanation of the environmental assumptions made
• No specific issues beyond normal requirements for open pit mining in NSW
Bulk density • Whether assumed or determined. If assumed, the basis for the assumptions. If determined, the method used, whether wet or dry, the frequency of the measurements, the nature, size and representativeness of the samples.
• The bulk density for bulk material must have been measured by methods that adequately account for void spaces (vugs, porosity, etc), moisture and differences between rock and alteration zones within the deposit.
• Densities were applied to the estimates by rock type. Densities of 2.0, 2.0, 2.4 and 2.6 t/bcm were applied to oxide clay, sulphide clay, oxide limestone and sulphide limestone respectively.
• These values were derived from 153 immersion density measurements of oven dried drill core from six diamond holes
• MKR have obtained 31 calliper measurements of oven dried drill core from 13 diamond holes over Bimble and Belah. Reading ranged from 1.69 to 2.74, oxidised and reduced clay samples average 1.96 and fresh samples averaged 2.44

19
Classification • The basis for the classification of the Mineral Resources into varying confidence categories.
• Whether appropriate account has been taken of all relevant factors (ie relative confidence in tonnage/grade estimations, reliability of input data, confidence in continuity of geology and metal values, quality, quantity and distribution of the data).
• Whether the result appropriately reflects the Competent Person’s view of the deposit.
• Resource classification is based on data quality, drill density, number of informing samples, kriging efficiency, conditional bias slope, average distance to informing samples and deposit consistency (geological continuity).
• Measured resources adopt the following guidelines. Blocks are dominantly estimated with a minimum of 12 composites, the nearest drill hole within 20m and the average distance to all informing samples approximately 30m or less. Krige efficiencies for measured mineral resources are dominantly higher than 0.5. The conditional bias slope recorded is greater than 0.8. Measured Mineral Resource are estimated in the first kriging run.
• Indicated resources are defined as those portions of the deposit estimated with a drill spacing of 40 m x 40 m that demonstrate a reasonable level of confidence in the geological continuity of the mineralisation. The following estimation statistics were used as a guideline to assist defining grade continuity. Indicated blocks have been estimated with a minimum of 6 samples, and within 40m of a drill hole, and an average distance to all informing composites of 80 m. Krige efficiencies of blocks within the indicated category fall within the range of 0.25 to 0.4. Lower efficiency blocks may be included if a structural trend is present. Indicated resources may be estimated in the first or second kriging run.
• Inferred resources are defined as those portions of the deposit estimated with a drill spacing of greater than 40 m x 40 m, and include areas drilled on a 250 m x 100 m sections or those portions of the deposit with a smaller number of intersections (including limited blocks estimated in pass 4) but demonstrating a reasonable level of geological continuity.
• The resource classification accounts for all relevant factors.
Audits or reviews
• The results of any audits or reviews of Mineral Resource estimates
• The resource classifications reflect the Competent Person’s views of the deposit.
Discussion of relative accuracy/ confidence
• Where appropriate a statement of the relative accuracy and confidence level in the Mineral Resource estimate using an approach or procedure deemed appropriate by the Competent Person. For example, the application of statistical or geostatistical procedures to quantify the relative accuracy of the resource within stated confidence limits, or, if such an approach is not deemed appropriate, a qualitative discussion of the factors that could affect the relative accuracy and confidence of the estimate.
• The statement should specify whether it relates to global or local estimates, and, if local, state the relevant tonnages, which should be relevant to technical and economic evaluation. Documentation should include assumptions made and the procedures used.
• These statements of relative accuracy and confidence of the estimate should be compared with production data, where available.
• The Resource estimate for the Manuka deposit is considered robust and is representative of the global tonnes and grade contained within the area of the deposit tested by drilling. The interpretations of geology and mineralisation are well constrained and support high confidence in the estimate.
• Confidence in the relative accuracy of the estimates is reflected by the classification of estimates as Measured, Indicated and Inferred.
• With allowance for some deficiencies in the grade control production data, the current estimates reconcile reasonably with production undertaken by past tenement holders.