4000 wisconsin avenue - office of planning · pdf filethe proposed mixed-use redevelopment is...
TRANSCRIPT
4000 Wisconsin Avenue Comprehensive Transportation Review March 2017
i
TABLE OF CONTENTS PAGE
INTRODUCTION ______________________________________________________________ 1 Overview ................................................................................................................................... 1 Study Scope .............................................................................................................................. 2
EXISTING TRANSPORTATION FACILITIES ___________________________________________ 2 Roadway Network ..................................................................................................................... 3
Table 1: Roadway Segment Details ........................................................................ 2 Non-Auto Transportation Facilities ........................................................................................... 3
Public Transportation Facilities and Services ...................................................................... 3 Table 2: Metrorail Headways (in minutes) ............................................................. 4 Table 3: Metrobusl Headways (in minutes) ........................................................... 4 Pedestrian Facilities ............................................................................................................ 5 Table 4: Pedestrian Inventory by Intersection ....................................................... 6 Bicycle Facilities .................................................................................................................. 7Capital Bikeshare................................................................................................................. 7 Car Sharing Services ............................................................................................................ 8
EXISTING CONDITIONS ANALYSIS ________________________________________________ 8 Traffic Volumes ......................................................................................................................... 8 Capacity Analysis ....................................................................................................................... 9
Table 5: Level of Service Summary ....................................................................... 10 Queue Analysis ........................................................................................................................ 11
Table 6: Synchro 95th Percentile Queue Summary (in feet) ................................. 12 Safety Analysis ........................................................................................................................ 14
Table 7: Crash Data Summary .............................................................................. 14 Wisconsin Avenue/Van Ness Street ............................................................................ 15 Wisconsin Avenue/Upton Street ................................................................................ 15 Wisconsin Avenue/Porter Street ................................................................................ 15
FUTURE BACKGROUND CONDITIONS ____________________________________________ 16
Traffic Volumes ....................................................................................................................... 16 Overview ........................................................................................................................... 16 Regional Growth ............................................................................................................... 16 Pipeline Developments ..................................................................................................... 16 4700Wisconsin Avenue (Steak and Eggs) ................................................................... 16 4614 Wisconsin Avenue .............................................................................................. 17 Washington College of Law ........................................................................................ 17 Cathedral Commons ................................................................................................... 17 Georgetown Day School ............................................................................................. 18 Sidwell Friends School ................................................................................................ 18 3900 Wisconsin Avenue .............................................................................................. 18
ii
TABLE OF CONTENTS (CONTINUED) Table 8: Fannie Mae Existing Trip Generation ..................................................... 18 Combined Pipeline Developments ............................................................................. 19 Background Forecasts ....................................................................................................... 19
Capacity Analysis ..................................................................................................................... 19 Queue Analysis ........................................................................................................................ 19
SITE ANALYSIS ______________________________________________________________ 20 Overview ................................................................................................................................. 20 Site Access and Circulation ..................................................................................................... 20
Vehicular Access ............................................................................................................... 20 Pedestrian and Bicycle Access .......................................................................................... 20
Trip Generation Analysis......................................................................................................... 21 Overview ........................................................................................................................... 21 Total Trips ......................................................................................................................... 21 Existing Development ................................................................................................. 21 Proposed Redevelopment .......................................................................................... 21 Table 9: Site Trip Generation Summary – Existing Uses ...................................... 22 Table 10: Site Trip Generation Summary – Proposed Uses .................................. 23 Non-Auto Mode Split ........................................................................................................ 24 Proposed Redevelopment .......................................................................................... 25 Pass-by Trips ..................................................................................................................... 25 Existing Development ................................................................................................. 25 Proposed Redevelopment .......................................................................................... 26 Net Vehicle Trips ............................................................................................................... 26 Table 11: Site Trip Generation Summary – Net New Vehicle Trips ...................... 26 Site Trip Distribution and Assignment .............................................................................. 26 Table 12: Site Trip Distributions ........................................................................... 27
Proposed Parking .................................................................................................................... 27 Vehicular Parking .............................................................................................................. 27 Table 13: Parking Summary ................................................................................. 27 Bicycle Parking .................................................................................................................. 28 Table 14: Bicycle Parking Summary ..................................................................... 28
Proposed Loading ................................................................................................................... 28 Table 15: Loading Summary................................................................................. 29
TOTAL FUTURE CONDITIONS ___________________________________________________ 29 Traffic Forecasts ...................................................................................................................... 29 Capacity Analysis ..................................................................................................................... 29 Queue Analysis ........................................................................................................................ 30 Improvement Analysis ............................................................................................................ 31
Wisconsin Avenue/Van Ness Street .................................................................................. 31

iii
TABLE OF CONTENTS (CONTINUED)
Wisconsin Avenue/Upton Street ...................................................................................... 32 Table 16: Level of Service Summary with Recommended Improvements ........... 32 Table 17: 95th Percentile Queue Summary (in feet) with Recommended Improvements .................................................................. 34
CONCLUSIONS AND RECOMMENDATIONS ________________________________________ 37
iv
LIST OF FIGURES
FIGURE TITLE
1 Site Location Map 2A Site Plan – R0 Level Plan 2B Site Plan – First Level Plan 3 Multi-Modal Transportation Options 4 One Quarter Mile Walk Shed 5 One Mile Bike Shed 6 Existing Peak Hour Traffic Volumes 7 Existing Peak Hour Pedestrian Volumes 8 Existing Lane Use and Traffic Control 9 Existing Volumes with Regional Growth 10 Pipeline Locations 11 Pipeline Traffic Forecasts12 2021 Background Traffic Forecasts 13A Site Circulation – G2 Level Plan 13B Site Circulation – G1 Level Plan 13C Site Circulation – R0 Level Plan 13D Site Circulation – First Level Plan 14 Removed Office and Retail Site Trips 15 Residential Site Trips 16A Retail Site Trips 16B Pass-By Retail Site Trips 17 Total Site Trips 18 2021 Total Future Traffic Forecasts
v
LIST OF APPENDICES
APPENDIX TITLE
A Scoping Document
B Pedestrian Master Plan Excerpts
C Traffic Count Data
D DDOT Traffic Signal Timings
E Level of Service (LOS) Descriptions
F LOS and Queue Reports for Existing Conditions
G Pipeline Developments
H LOS and Queue Reports for 2021 Background Conditions
I Autoturn Diagrams
J 2021 Total Future LOS and Queue Reports
K Total Future with Improvements LOS and Queue Reports

1
INTRODUCTION
Overview
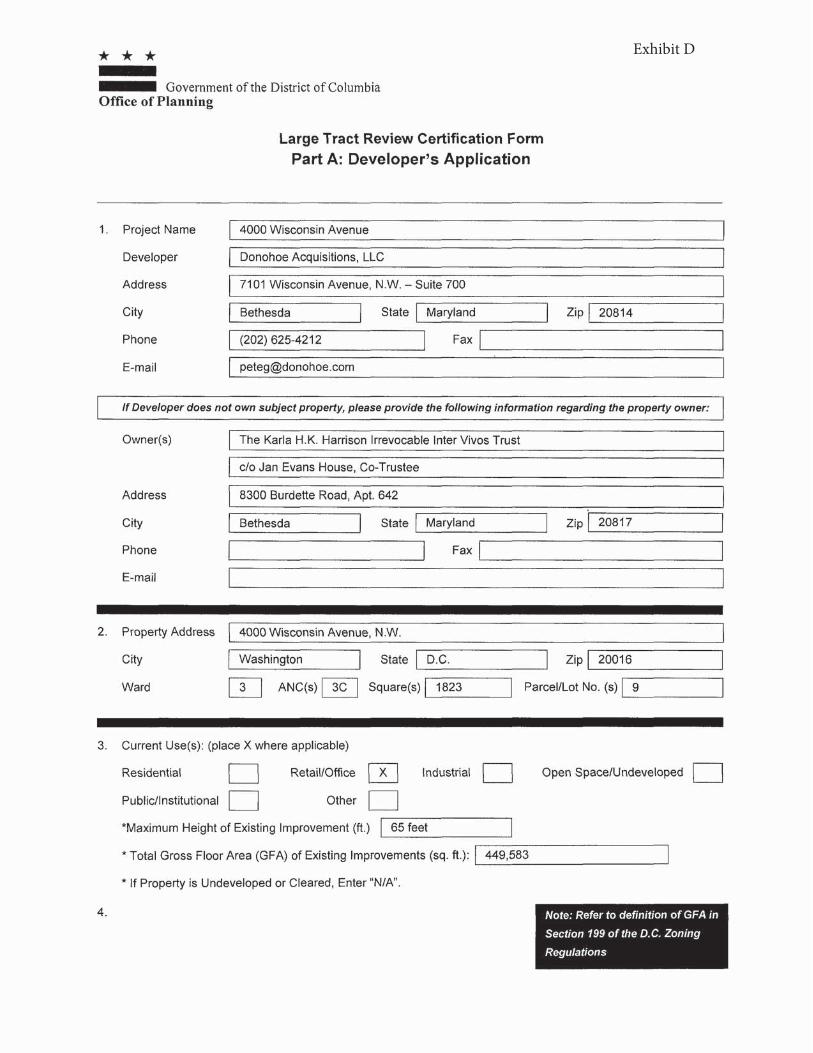
This report presents a Comprehensive Transportation Review (CTR) conducted in conjunction with the Large Tract Review application filed by Donohoe Acquisitions, LLC (herein referred to as the Applicant). The proposed mixed-use redevelopment is located at 4000 Wisconsin Avenue in northwest Washington, DC (Square 1823, Lot 9) and is zoned MU-5A. The subject site is bordered by Upton Street to the north, Wisconsin Avenue to the east, the Fannie Mae driveway to the south, and Glover Archbold Park to the west. The site location is shown on Figure 1.
The site currently is occupied with approximately 404,547 SF of office, 40,998 SF of retail, a 37,916 SF health club, and a conference center (which was originally a 2,070-seat cinema). Approximately 1,035 parking spaces are currently provided with access via two existing curb cuts on Upton Street. Access to the loading facilities currently is provided via a third curb cut on Upton Street, which requires back-in loading. One curb cut on Wisconsin Avenue also provides vehicular access to the site.
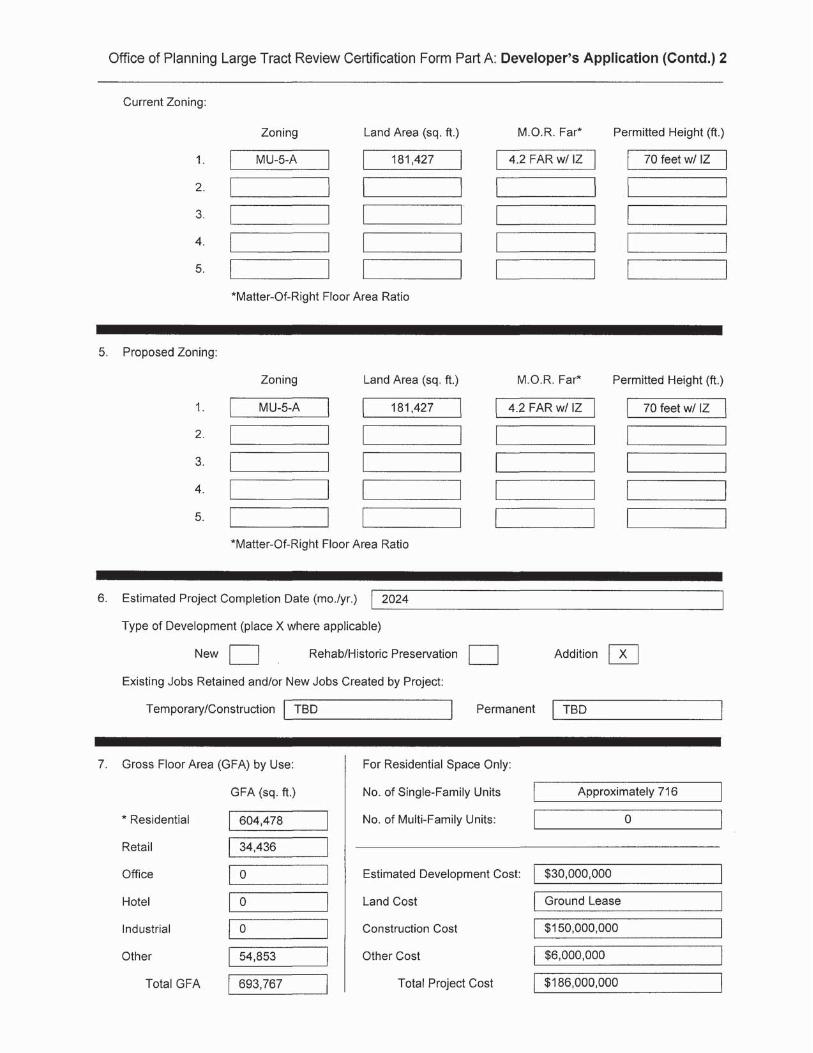
The proposed redevelopment will be constructed as a matter-of-right and is subject to Large Tract Review procedures. Approximately 716 residential units, a 60,200 SF grocery store, a 49,388 SF health club, and 22,598 SF of general retail space are proposed with the redevelopment.1 The proposed site plan is shown on Figure 2. The existing parking supply would be reduced to approximately 900 parking spaces and the loading facilities would be reconfigured to facilitate front-in/front-out loading. In conjunction with the proposed project, the existing curb cut on Wisconsin Avenue would be closed.
The purpose of this report is to:
Evaluate existing traffic operational and safety conditions,
Evaluate future traffic conditions without the proposed project,
Evaluate future traffic conditions with the proposed project,
Identify existing mode choice alternatives,
Identify any traffic operational impacts associated with the proposed project,
Evaluate the appropriateness of the proposed parking areas,
Evaluate effectiveness of the proposed loading facilities, and
Recommend transportation improvements (including roadway, operational, and demand management strategies) to mitigate the impact of the project and promote the safe and efficient flow of vehicular and pedestrian traffic associated with the proposed redevelopment.
1 The total square footage for the grocery store, health club, and general retail space is 132,186 SF. The square
footage has been updated since the analysis was conducted. Current plans show 126,917 SF for retail uses.
2
Study Scope
In order to assess the impacts of the proposed development on the surrounding roadway network, the Applicant commissioned this comprehensive transportation review. The scope of the study and proposed methodologies were presented to the District Department of Transportation (DDOT) prior to beginning the study. As DDOT is still completing its review, the most recent version of the scoping document is included in Appendix A.
The study area was selected based on those roadway segments that potentially could be impacted by the proposed project. The following intersections were identified for detailed analysis:
Wisconsin Avenue/Van Ness Street,
Wisconsin Avenue/Upton Street,
Wisconsin Avenue/Fannie Mae Driveway/Post Office Driveway/Sidwell Driveway,
Wisconsin Avenue/Rodman Street/Sidwell Driveway,
Wisconsin Avenue/Quebec Street,
Wisconsin Avenue/Porter Street,
Van Ness Street/Nebraska Avenue,
Van Ness Street/40th Place,
Upton Street/40th Place, and
Upton Street/Site Driveways.
EXISTING TRANSPORTATON FACILITIES
Roadway Network
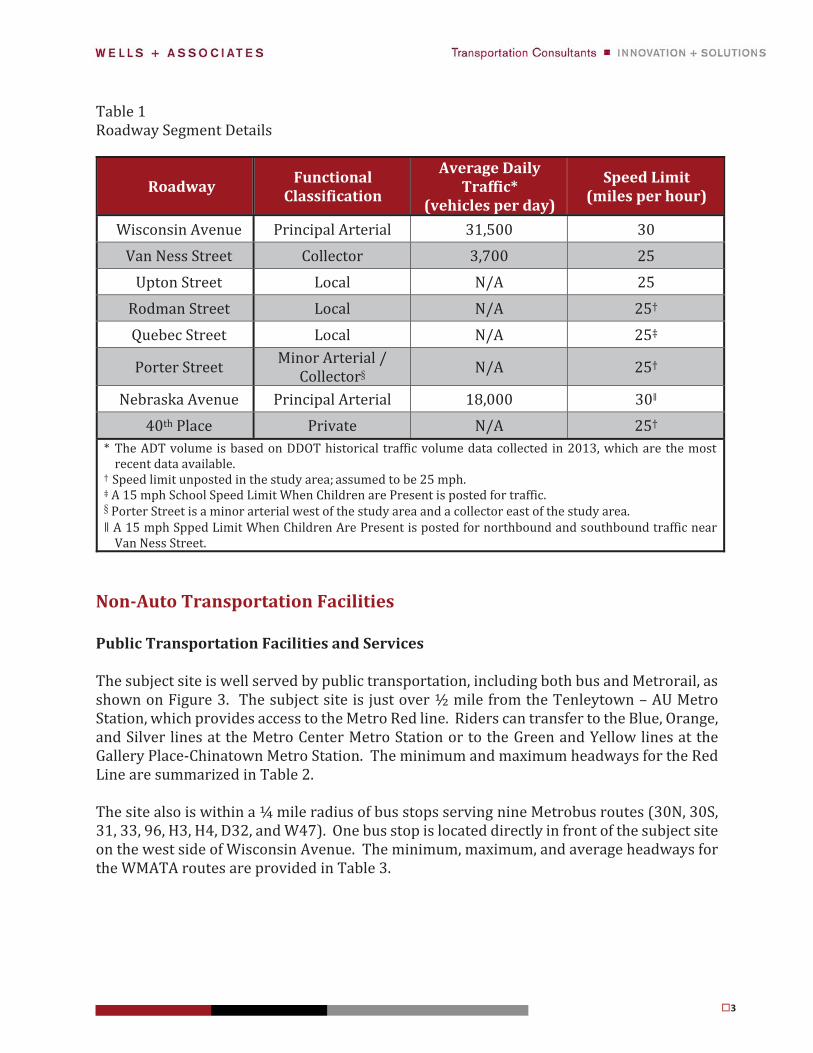
General details regarding the surrounding roadway segments, including functional classification, average daily traffic volume (ADT), and speed limit are summarized in Table 1. All roadways in the study area operate as two-way streets.
3
Table 1 Roadway Segment Details
Roadway Functional Classification
Average Daily Traffic*
(vehicles per day)
Speed Limit (miles per hour)
Wisconsin Avenue Principal Arterial 31,500 30
Van Ness Street Collector 3,700 25
Upton Street Local N/A 25
Rodman Street Local N/A 25†
Quebec Street Local N/A 25‡
Porter Street Minor Arterial / Collector§ N/A 25†
Nebraska Avenue Principal Arterial 18,000 30ǁ
40th Place Private N/A 25† * The ADT volume is based on DDOT historical traffic volume data collected in 2013, which are the most
recent data available. † Speed limit unposted in the study area; assumed to be 25 mph. ‡ A 15 mph School Speed Limit When Children are Present is posted for traffic. § Porter Street is a minor arterial west of the study area and a collector east of the study area. ǁ A 15 mph Spped Limit When Children Are Present is posted for northbound and southbound traffic near
Van Ness Street.
Non-Auto Transportation Facilities
Public Transportation Facilities and Services
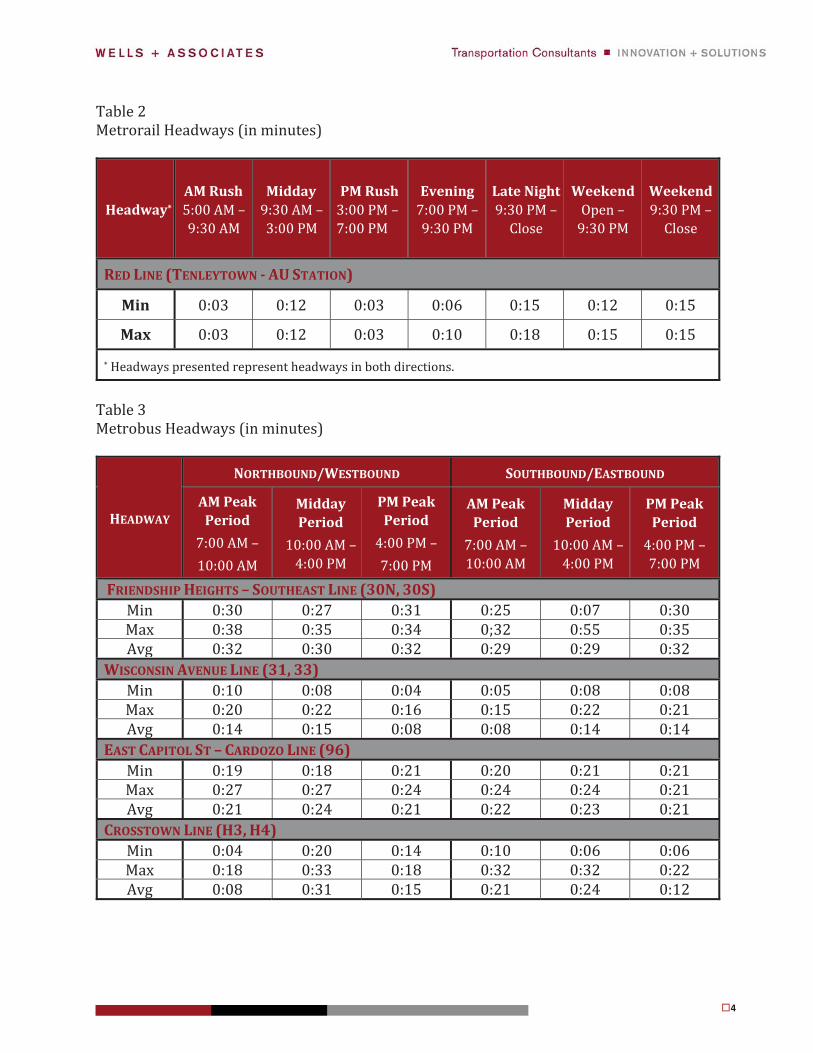
The subject site is well served by public transportation, including both bus and Metrorail, as shown on Figure 3. The subject site is just over ½ mile from the Tenleytown – AU Metro Station, which provides access to the Metro Red line. Riders can transfer to the Blue, Orange, and Silver lines at the Metro Center Metro Station or to the Green and Yellow lines at the Gallery Place-Chinatown Metro Station. The minimum and maximum headways for the Red Line are summarized in Table 2.
The site also is within a ¼ mile radius of bus stops serving nine Metrobus routes (30N, 30S, 31, 33, 96, H3, H4, D32, and W47). One bus stop is located directly in front of the subject site on the west side of Wisconsin Avenue. The minimum, maximum, and average headways for the WMATA routes are provided in Table 3.
4
Table 2 Metrorail Headways (in minutes)
Headway* AM Rush 5:00 AM – 9:30 AM
Midday 9:30 AM – 3:00 PM
PM Rush 3:00 PM – 7:00 PM
Evening 7:00 PM – 9:30 PM
Late Night 9:30 PM –
Close
Weekend Open –
9:30 PM
Weekend 9:30 PM –
Close
RED LINE (TENLEYTOWN - AU STATION)
Min 0:03 0:12 0:03 0:06 0:15 0:12 0:15
Max 0:03 0:12 0:03 0:10 0:18 0:15 0:15
* Headways presented represent headways in both directions.
Table 3 Metrobus Headways (in minutes)
HEADWAY
NORTHBOUND/WESTBOUND SOUTHBOUND/EASTBOUND
AM Peak Period
7:00 AM – 10:00 AM
Midday Period
10:00 AM – 4:00 PM
PM Peak Period
4:00 PM – 7:00 PM
AM Peak Period
7:00 AM – 10:00 AM
Midday Period
10:00 AM – 4:00 PM
PM Peak Period
4:00 PM – 7:00 PM
FRIENDSHIP HEIGHTS – SOUTHEAST LINE (30N, 30S) Min 0:30 0:27 0:31 0:25 0:07 0:30 Max 0:38 0:35 0:34 0;32 0:55 0:35 Avg 0:32 0:30 0:32 0:29 0:29 0:32
WISCONSIN AVENUE LINE (31, 33) Min 0:10 0:08 0:04 0:05 0:08 0:08 Max 0:20 0:22 0:16 0:15 0:22 0:21 Avg 0:14 0:15 0:08 0:08 0:14 0:14
EAST CAPITOL ST – CARDOZO LINE (96) Min 0:19 0:18 0:21 0:20 0:21 0:21 Max 0:27 0:27 0:24 0:24 0:24 0:21 Avg 0:21 0:24 0:21 0:22 0:23 0:21
CROSSTOWN LINE (H3, H4) Min 0:04 0:20 0:14 0:10 0:06 0:06 Max 0:18 0:33 0:18 0:32 0:32 0:22 Avg 0:08 0:31 0:15 0:21 0:24 0:12
5
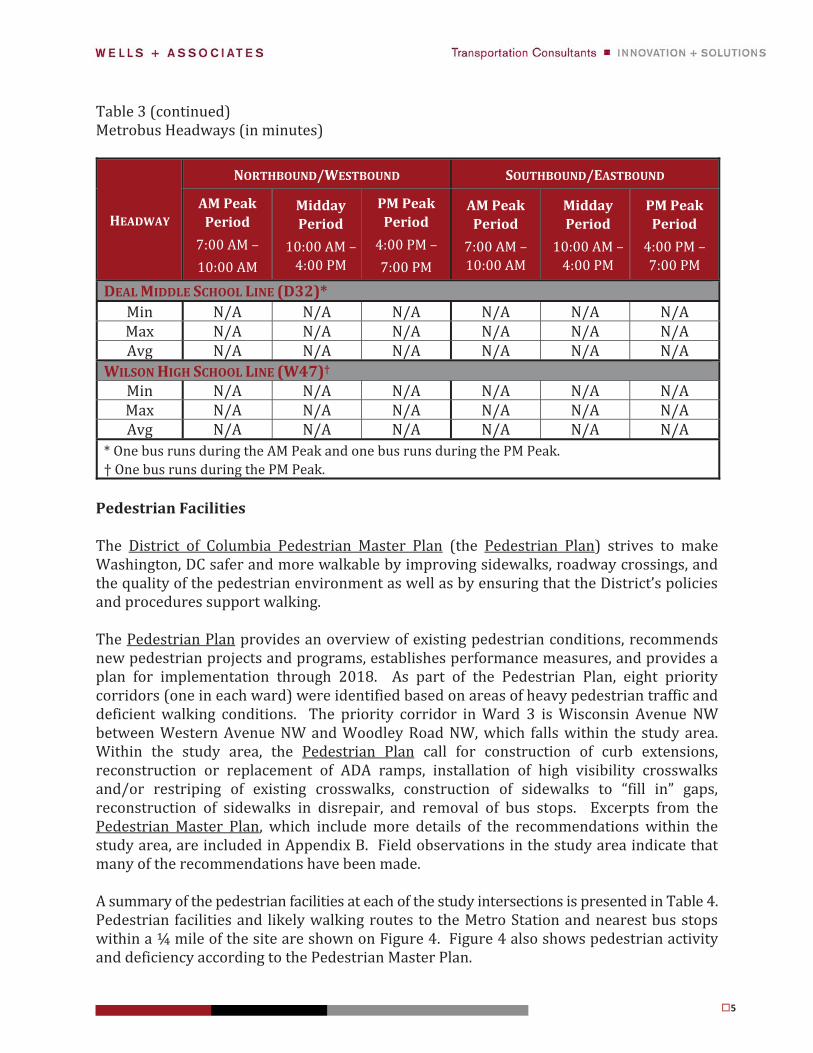
Table 3 (continued) Metrobus Headways (in minutes)
HEADWAY
NORTHBOUND/WESTBOUND SOUTHBOUND/EASTBOUND
AM Peak Period
7:00 AM – 10:00 AM
Midday Period
10:00 AM – 4:00 PM
PM Peak Period
4:00 PM – 7:00 PM
AM Peak Period
7:00 AM – 10:00 AM
Midday Period
10:00 AM – 4:00 PM
PM Peak Period
4:00 PM – 7:00 PM
DEAL MIDDLE SCHOOL LINE (D32)* Min N/A N/A N/A N/A N/A N/A Max N/A N/A N/A N/A N/A N/A Avg N/A N/A N/A N/A N/A N/A
WILSON HIGH SCHOOL LINE (W47)†
Min N/A N/A N/A N/A N/A N/A Max N/A N/A N/A N/A N/A N/A Avg N/A N/A N/A N/A N/A N/A
* One bus runs during the AM Peak and one bus runs during the PM Peak. † One bus runs during the PM Peak.
Pedestrian Facilities
The District of Columbia Pedestrian Master Plan (the Pedestrian Plan) strives to make Washington, DC safer and more walkable by improving sidewalks, roadway crossings, and the quality of the pedestrian environment as well as by ensuring that the District’s policies and procedures support walking.
The Pedestrian Plan provides an overview of existing pedestrian conditions, recommends new pedestrian projects and programs, establishes performance measures, and provides a plan for implementation through 2018. As part of the Pedestrian Plan, eight priority corridors (one in each ward) were identified based on areas of heavy pedestrian traffic and deficient walking conditions. The priority corridor in Ward 3 is Wisconsin Avenue NWbetween Western Avenue NW and Woodley Road NW, which falls within the study area. Within the study area, the Pedestrian Plan call for construction of curb extensions, reconstruction or replacement of ADA ramps, installation of high visibility crosswalks and/or restriping of existing crosswalks, construction of sidewalks to “fill in” gaps, reconstruction of sidewalks in disrepair, and removal of bus stops. Excerpts from the Pedestrian Master Plan, which include more details of the recommendations within the study area, are included in Appendix B. Field observations in the study area indicate that many of the recommendations have been made.
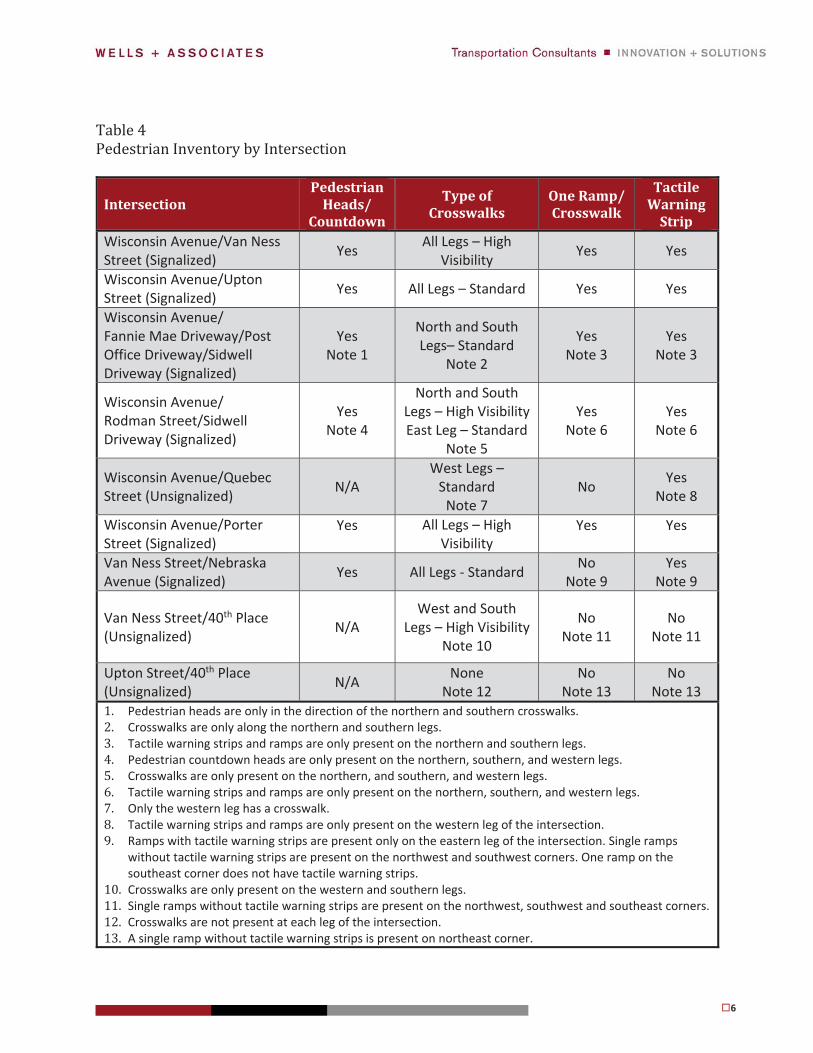
A summary of the pedestrian facilities at each of the study intersections is presented in Table 4. Pedestrian facilities and likely walking routes to the Metro Station and nearest bus stops within a ¼ mile of the site are shown on Figure 4. Figure 4 also shows pedestrian activity and deficiency according to the Pedestrian Master Plan.
6
Table 4 Pedestrian Inventory by Intersection
IntersectionPedestrian
Heads/ Countdown
Type of Crosswalks
One Ramp/ Crosswalk
Tactile Warning
Strip Wisconsin Avenue/Van Ness Street (Signalized) Yes All Legs – High
Visibility Yes Yes
Wisconsin Avenue/Upton Street (Signalized) Yes All Legs – Standard Yes Yes
Wisconsin Avenue/ Fannie Mae Driveway/Post Office Driveway/Sidwell Driveway (Signalized)
Yes Note 1
North and South Legs– Standard
Note 2
Yes Note 3
Yes Note 3
Wisconsin Avenue/ Rodman Street/Sidwell Driveway (Signalized)
Yes Note 4
North and South Legs – High Visibility East Leg – Standard
Note 5
Yes Note 6
Yes Note 6
Wisconsin Avenue/Quebec Street (Unsignalized) N/A
West Legs – Standard
Note 7 No Yes
Note 8
Wisconsin Avenue/Porter Street (Signalized)
Yes
All Legs – High Visibility
Yes
Yes
Van Ness Street/Nebraska Avenue (Signalized) Yes All Legs - Standard No
Note 9 Yes
Note 9
Van Ness Street/40th Place (Unsignalized) N/A
West and South Legs – High Visibility
Note 10
No Note 11
No Note 11
Upton Street/40th Place (Unsignalized) N/A None
Note 12 No
Note 13 No
Note 13 1. Pedestrian heads are only in the direction of the northern and southern crosswalks.2. Crosswalks are only along the northern and southern legs. 3. Tactile warning strips and ramps are only present on the northern and southern legs. 4. Pedestrian countdown heads are only present on the northern, southern, and western legs. 5. Crosswalks are only present on the northern, and southern, and western legs. 6. Tactile warning strips and ramps are only present on the northern, southern, and western legs. 7. Only the western leg has a crosswalk. 8. Tactile warning strips and ramps are only present on the western leg of the intersection. 9. Ramps with tactile warning strips are present only on the eastern leg of the intersection. Single ramps
without tactile warning strips are present on the northwest and southwest corners. One ramp on the southeast corner does not have tactile warning strips.
10. Crosswalks are only present on the western and southern legs. 11. Single ramps without tactile warning strips are present on the northwest, southwest and southeast corners. 12. Crosswalks are not present at each leg of the intersection. 13. A single ramp without tactile warning strips is present on northeast corner.
7
Bicycle Facilities
The District of Columbia Bicycle Master Plan (the Bicycle Plan) seeks to create a more bicycle-friendly city by establishing high-quality bicycle facilities and programs that are safe and convenient.
The Bicycle Plan provides bicycle levels of service (BLOS) for roadways in the District where bicycles share the road with vehicles. The Bicycle Plan also reports the number of bicycle crashes that occurred between 2000 and 2002.
Finally, the Bicycle Plan identifies areas and corridors that are barriers to cyclists. These barriers include “freeways, railroad and highway grade separations, neighborhoods with heavy traffic, and other impediments to bicycle travel.” No such barriers exist in the vicinity of the site.
Bicycle facilities and likely biking routes to the Metro Station and nearest bus stops within one mile of the site are shown on Figure 5. Figure 5 also shows the BLOS for roadways in the study area and the reported bicycle crashes in the study area, per the Bicycle Plan.
Dedicated bicycle lanes are present on north side of Van Ness Street between Wisconsin Avenue and Nebraska Avenue. East of 38th Street, sharrows are painted on the north and south sides of Van Ness Street.
Capital Bikeshare
Capital Bikeshare is an automated bicycle rental or bicycle sharing program that provides approximately 3,700 bicycles at 440 stations across Washington, DC, Arlington, VA, Alexandria, VA, Montgomery County, MD, and Fairfax County, VA.
Membership, which is required to use Capital Bikeshare, includes five options for joining: single trip ($2), 24 hours ($8), three days ($17), 30 days ($28), or one year ($85). During WMATA’s SafeTrack Initiative, Capital Bikeshare is piloting a single trip fare for $2. Under any membership option, the first 30 minutes of use are free; users then are charged a usage fee for each additional 30-minute period. Bicycles can be returned to any station with an available dock.
As shown on Figure 3, the closest Bikeshare station is located within just two blocks from the site at 39th Street/Veazey Street. This station includes 14 docks.
The District of Columbia Capital Bikeshare Development Plan outlines a system-wide expansion plan including 99 new Bikeshare stations by the end of 2018 and 21 existing stations to be expanded by the end of 2017. In the vicinity of the site, the nearest new Bikeshare station is identified on Wisconsin Avenue south of Macomb Street and is slated for completion in 2018.
8
Car Sharing Services
Three car-sharing providers currently operate in the District. Zipcar requires a $25 application fee and members can choose from three plans: occasional driving plan - $70 per year (pay as you go based on the standard hourly or daily rate), monthly plan - $7 per month (pay as you go based on the standard hourly or daily rate), extra value - $50 per month, $75 per month (1 month rollover), $125 per month (2 month rollover), and $250 per month (2 month rollover) (after using up the monthly cash, pay as you go based on a discounted hourly or daily rate). Cars must be returned to the same designated parking spaces from which they were picked up. One Zipcar is located within ½ mile of the site at AU College of Law, as shown on Figure 3.
Car2Go requires a one-time $5 application fee. Once registered, a member card is issued, which enables members to access an available car. Car2Go members can choose from two plans: smart fortwo – $0.32 per minute/$15 per hour/$59 per day, and Mercedes-Benz CLA & GLA – $0.45 per minute/$19 per hour/$79 per day. No reservation is required and car usage is charged by the minute, with hourly and daily maximum fees. Unlike Zipcar, a Car2Go vehicle does not have to be returned to its original location. A Car2Go vehicle can be parked in any unrestricted curbside parking space, in any metered/paystation curbside parking space (without paying meter/paystation fees), or in any residential permit parking space. Car2Go currently has 500 vehicles in the District.
Enterprise CarShare requires one-time $25 application fee and $40 annual membership fee. Cars can be reserved by the hour or day (hourly and daily fees are charged per usage). In the District, cars must be returned to their original location.
EXISTING CONDITIONS ANALYSIS
Traffic Volumes
For study intersections on Wisconsin Avenue, existing vehicular turning movement, bicycle, and pedestrian counts were conducted on Thursday, May 21, 2015, from 7:00 AM to 10:00 AM and from 3:00 PM to 7:00 PM. Counts were also conducted on Wednesday, October 28, 2015 and Thursday, October 29, 2015.
As these Wisconsin Avenue volumes were used in the preparation of the traffic impact analysis for the Sidwell Friends School redevelopment, the baseline volumes are consistent with previous studies recently conducted in the area. The peak hour volumes were grown to the year 2017 assuming one percent regional growth, which is also consistent with the analysis conducted for the Sidwell Friends School redevelopment.
For other study intersections not located along Wisconsin Avenue, vehicular turning movement, bicycle, and pedestrian counts were conducted on Wednesday, February 8, 2017,
9
from 7:00 AM to 10:00 AM and from 3:00 PM to 7:00 PM. Regional growth was not added to these volumes for existing conditions.
Existing vehicular peak hour traffic volumes are shown on Figure 6. Pedestrian volumes are shown on Figure 7. Traffic count data are included in Appendix C.
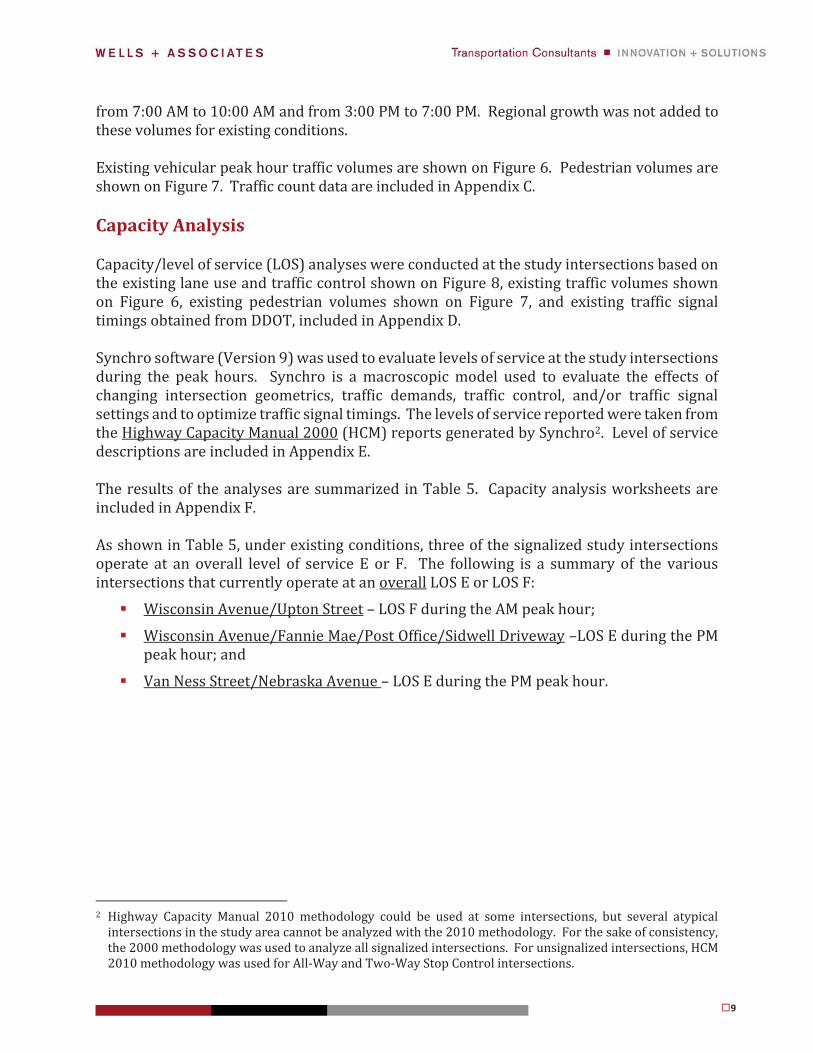
Capacity Analysis
Capacity/level of service (LOS) analyses were conducted at the study intersections based on the existing lane use and traffic control shown on Figure 8, existing traffic volumes shown on Figure 6, existing pedestrian volumes shown on Figure 7, and existing traffic signal timings obtained from DDOT, included in Appendix D.
Synchro software (Version 9) was used to evaluate levels of service at the study intersections during the peak hours. Synchro is a macroscopic model used to evaluate the effects of changing intersection geometrics, traffic demands, traffic control, and/or traffic signal settings and to optimize traffic signal timings. The levels of service reported were taken from the Highway Capacity Manual 2000 (HCM) reports generated by Synchro2. Level of service descriptions are included in Appendix E.
The results of the analyses are summarized in Table 5. Capacity analysis worksheets are included in Appendix F.
As shown in Table 5, under existing conditions, three of the signalized study intersections operate at an overall level of service E or F. The following is a summary of the various intersections that currently operate at an overall LOS E or LOS F:
Wisconsin Avenue/Upton Street – LOS F during the AM peak hour;
Wisconsin Avenue/Fannie Mae/Post Office/Sidwell Driveway –LOS E during the PM peak hour; and
Van Ness Street/Nebraska Avenue – LOS E during the PM peak hour.
2 Highway Capacity Manual 2010 methodology could be used at some intersections, but several atypical
intersections in the study area cannot be analyzed with the 2010 methodology. For the sake of consistency, the 2000 methodology was used to analyze all signalized intersections. For unsignalized intersections, HCM 2010 methodology was used for All-Way and Two-Way Stop Control intersections.

10
Table 5 Level of Service Summary
Approach Existing Conditions Background Conditions Total Future Conditions
AM Peak PM Peak AM Peak PM Peak AM Peak PM Peak 1. Wisconsin Avenue/Van Ness Street EBL D E (62.1) D E (72.4) D F (120.3) EBTR D E (56.4) D E (66.4) E (61.4) E (64.7) WBL E (70.5) D F (89.1) E (78.2) F (102.9) F (97.4) WBTR F (80.3) F (106.7) F (108.3) F (124.9) F (87.8) F (134.2) NBLTR B B B B B B SBLTR B C B C B C Overall C C C D C D 2. Wisconsin Avenue/Upton Street EBL D D D D D D EBR C C C C D C WBR D C D C D C NBLT F (241.7) C F (262.2) D F (124.3) E (68.7) NBR B A A SBTR B B B B B C Overall F (112.4) C F (119.7) D E (58.5) D 3. Wisconsin Avenue/Fannie Mae/Post Office/Sidwell Driveway EBLTR D E (71.5) D D D D WBLTR E (66.6) F (982.6) E (62.5) F (93.4) E (62.5) F (93.4) NBLTR C B C B C B SBLTR A A A A B A SWLR D D E (56.1) D E (56.1) DOverall B E (73.9) B C B C 4. Wisconsin Avenue/Rodman Street/Sidwell Driveway EBLTR F (100.3) D F (109.2) D F (109.2) D WBLTR E (59.7) D E (64.3) D E (64.3) D NBLTR A A A A A A SBLTR B A B B B B Overall C A C A C B 5. Wisconsin Avenue/Quebec Street WBLR A C B C C C NBTR A A A A A A SBLT A A A A A A [x.x] = unsignalized intersection control delay in sec/veh (x.x) = signalized intersection control delay in sec/veh
11
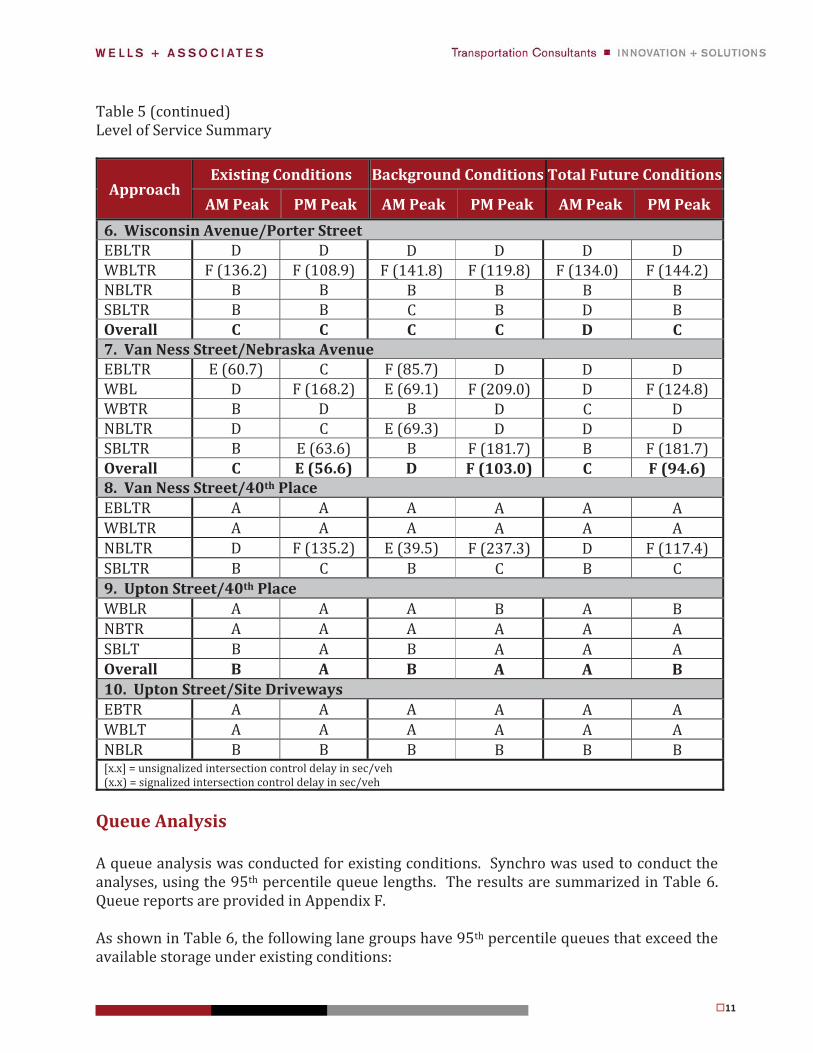
Table 5 (continued) Level of Service Summary
Approach Existing Conditions Background Conditions Total Future Conditions
AM Peak PM Peak AM Peak PM Peak AM Peak PM Peak 6. Wisconsin Avenue/Porter Street EBLTR D D D D D D WBLTR F (136.2) F (108.9) F (141.8) F (119.8) F (134.0) F (144.2) NBLTR B B B B B B SBLTR B B C B D B Overall C C C C D C 7. Van Ness Street/Nebraska Avenue EBLTR E (60.7) C F (85.7) D D D WBL D F (168.2) E (69.1) F (209.0) D F (124.8) WBTR B D B D C D NBLTR D C E (69.3) D D D SBLTR B E (63.6) B F (181.7) B F (181.7) Overall C E (56.6) D F (103.0) C F (94.6) 8. Van Ness Street/40th Place EBLTR A A A A A A WBLTR A A A A A A NBLTR D F (135.2) E (39.5) F (237.3) D F (117.4) SBLTR B C B C B C 9. Upton Street/40th Place WBLR A A A B A B NBTR A A A A A A SBLT B A B A A A Overall B A B A A B 10. Upton Street/Site Driveways EBTR A A A A A A WBLT A A A A A A NBLR B B B B B B [x.x] = unsignalized intersection control delay in sec/veh (x.x) = signalized intersection control delay in sec/veh
Queue Analysis
A queue analysis was conducted for existing conditions. Synchro was used to conduct the analyses, using the 95th percentile queue lengths. The results are summarized in Table 6. Queue reports are provided in Appendix F.
As shown in Table 6, the following lane groups have 95th percentile queues that exceed the available storage under existing conditions:
12
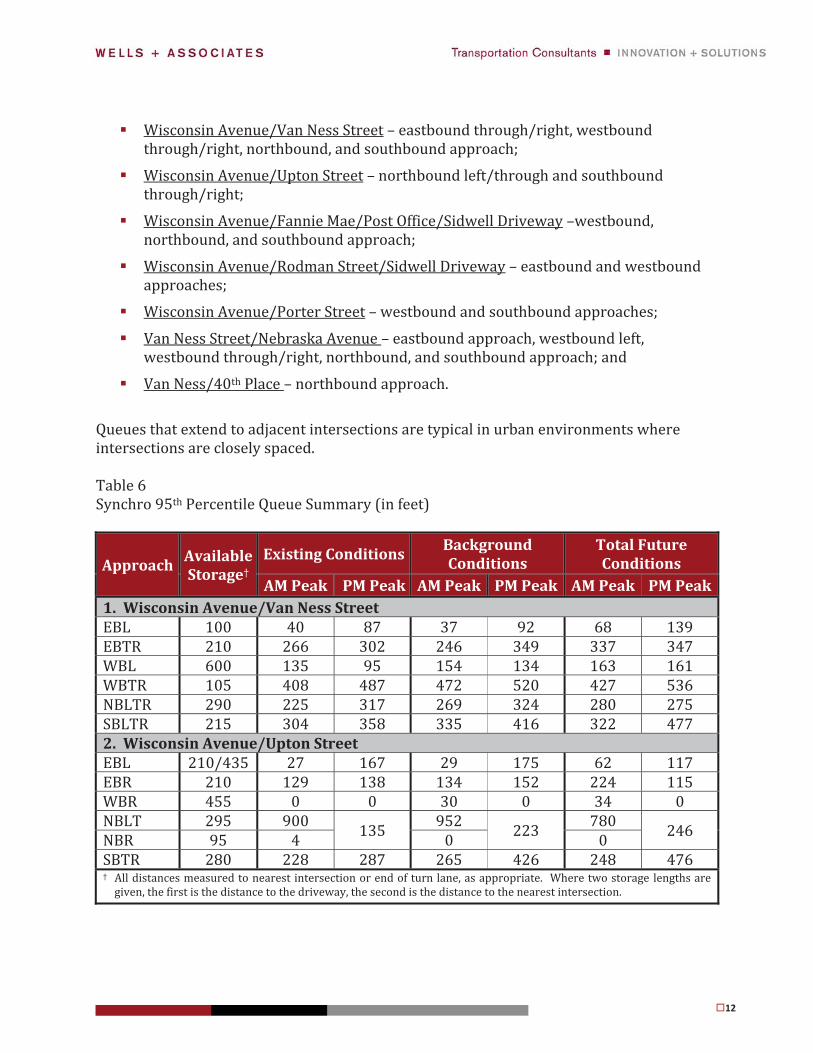
Wisconsin Avenue/Van Ness Street – eastbound through/right, westbound through/right, northbound, and southbound approach;
Wisconsin Avenue/Upton Street – northbound left/through and southbound through/right;
Wisconsin Avenue/Fannie Mae/Post Office/Sidwell Driveway –westbound, northbound, and southbound approach;
Wisconsin Avenue/Rodman Street/Sidwell Driveway – eastbound and westbound approaches;
Wisconsin Avenue/Porter Street – westbound and southbound approaches;
Van Ness Street/Nebraska Avenue – eastbound approach, westbound left, westbound through/right, northbound, and southbound approach; and
Van Ness/40th Place – northbound approach.
Queues that extend to adjacent intersections are typical in urban environments where intersections are closely spaced.
Table 6 Synchro 95th Percentile Queue Summary (in feet)
Approach Available Storage†
Existing Conditions Background Conditions
Total Future Conditions
AM Peak PM Peak AM Peak PM Peak AM Peak PM Peak 1. Wisconsin Avenue/Van Ness Street EBL 100 40 87 37 92 68 139 EBTR 210 266 302 246 349 337 347 WBL 600 135 95 154 134 163 161 WBTR 105 408 487 472 520 427 536 NBLTR 290 225 317 269 324 280 275 SBLTR 215 304 358 335 416 322 477 2. Wisconsin Avenue/Upton Street EBL 210/435 27 167 29 175 62 117 EBR 210 129 138 134 152 224 115 WBR 455 0 0 30 0 34 0 NBLT 295 900
135 952 223 780 246 NBR 95 4 0 0 SBTR 280 228 287 265 426 248 476 † All distances measured to nearest intersection or end of turn lane, as appropriate. Where two storage lengths are
given, the first is the distance to the driveway, the second is the distance to the nearest intersection.

13
Table 6 (continued) Synchro 95th Percentile Queue Summary (in feet)
Approach Available Storage†
Existing Conditions Background Conditions
Total Future Conditions
AM Peak PM Peak AM Peak PM Peak AM Peak PM Peak 3. Wisconsin Avenue/Fannie Mae/Post Office/Sidwell Driveway EBLTR 520 21 150 21 156 21 156 WBLTR 345 84 347 138 302 138 302 NBLTR 565 657 365 570 388 483 415 SBLT 300 600 113 575 143 620 129 SBR 170 SWLR 75 0 12 0 17 0 17 4. Wisconsin Avenue/Rodman Street/Sidwell Driveway EBLTR 100 222 92 231 95 231 95 WBLTR 95 122 77 133 80 133 80 NBLTR 490 130 34 120 36 110 46 SBLTR 565 534 138 594 172 615 166 5. Wisconsin Avenue/Quebec Street WBLR 440 0 18 8 10 13 13 NBTR 265 0 0 0 0 0 0 SBLT 490 8 28 8 35 8 38 6. Wisconsin Avenue/Porter Street EBLTR 220 137 72 142 75 138 75 WBLTR 310 385 407 390 426 381 463 NBLTR 385 277 201 305 223 251 238 SBLTR 265 332 217 493 230 643 218 7. Van Ness Street/Nebraska Avenue
EBLTR 100 451 150 538 172 354 182 WBL 245 94 369 100 386 110 272 WBTR 100 78 306 90 333 114 254 NBLTR 210 524 551 614 636 546 644 SBLTR 280/465 234 824 263 1109 262 1110 8. Van Ness Street/40th Place EBLTR 145/590 3 0 3 0 3 0 WBLTR 20/185 8 0 8 0 5 5 NBLTR 120/290 30 350 43 495 60 263 SBLTR 25 3 15 3 18 3 23 † All distances measured to nearest intersection or end of turn lane, as appropriate. Where two storage lengths are
given, the first is the distance to the driveway, the second is the distance to the nearest intersection.
14
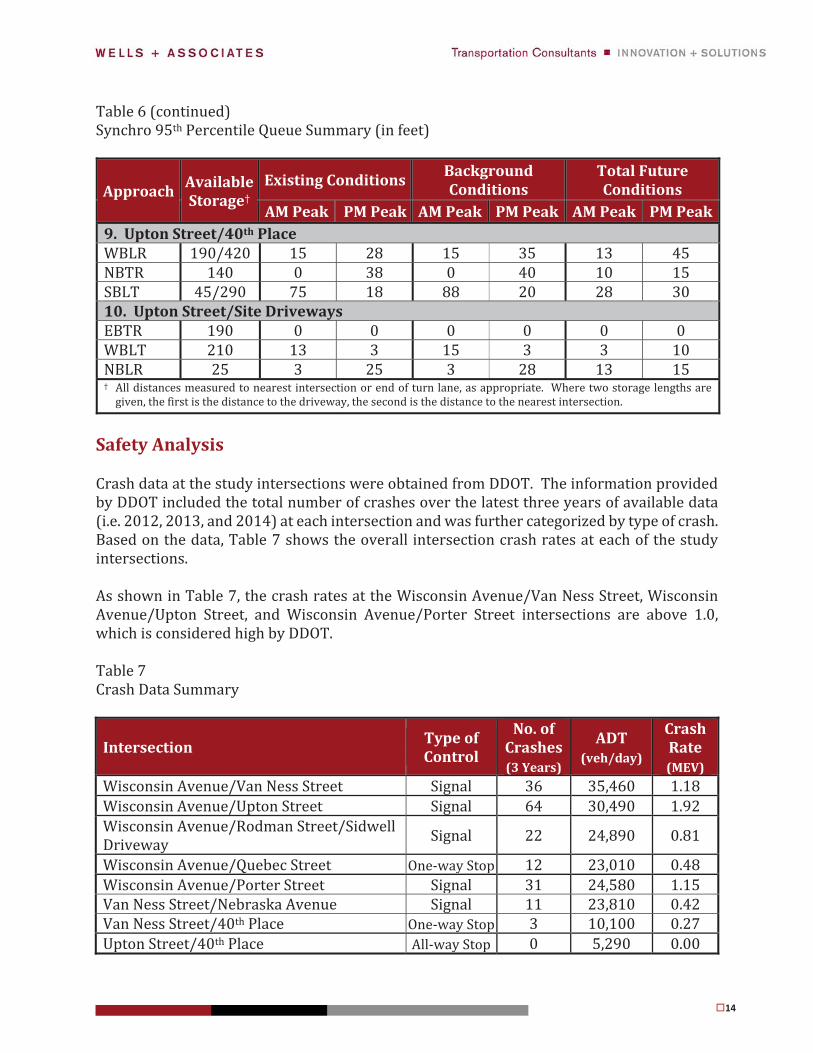
Table 6 (continued) Synchro 95th Percentile Queue Summary (in feet)
Approach Available Storage†
Existing Conditions Background Conditions
Total Future Conditions
AM Peak PM Peak AM Peak PM Peak AM Peak PM Peak 9. Upton Street/40th Place WBLR 190/420 15 28 15 35 13 45 NBTR 140 0 38 0 40 10 15 SBLT 45/290 75 18 88 20 28 30 10. Upton Street/Site Driveways EBTR 190 0 0 0 0 0 0 WBLT 210 13 3 15 3 3 10 NBLR 25 3 25 3 28 13 15 † All distances measured to nearest intersection or end of turn lane, as appropriate. Where two storage lengths are
given, the first is the distance to the driveway, the second is the distance to the nearest intersection.
Safety Analysis
Crash data at the study intersections were obtained from DDOT. The information provided by DDOT included the total number of crashes over the latest three years of available data (i.e. 2012, 2013, and 2014) at each intersection and was further categorized by type of crash. Based on the data, Table 7 shows the overall intersection crash rates at each of the study intersections.
As shown in Table 7, the crash rates at the Wisconsin Avenue/Van Ness Street, Wisconsin Avenue/Upton Street, and Wisconsin Avenue/Porter Street intersections are above 1.0, which is considered high by DDOT.
Table 7 Crash Data Summary
Intersection Type of Control
No. of Crashes (3 Years)
ADT (veh/day)
Crash Rate (MEV)
Wisconsin Avenue/Van Ness Street Signal 36 35,460 1.18 Wisconsin Avenue/Upton Street Signal 64 30,490 1.92 Wisconsin Avenue/Rodman Street/Sidwell Driveway Signal 22 24,890 0.81
Wisconsin Avenue/Quebec Street One-way Stop 12 23,010 0.48 Wisconsin Avenue/Porter Street Signal 31 24,580 1.15 Van Ness Street/Nebraska Avenue Signal 11 23,810 0.42 Van Ness Street/40th Place One-way Stop 3 10,100 0.27 Upton Street/40th Place All-way Stop 0 5,290 0.00
15
Wisconsin Avenue/Van Ness Street
A review of the crash types at the Wisconsin Avenue/Van Ness Street intersection reveals that the majority of the crashes at the intersection involved side swipe collisions (28 percent). Other crashes making up a significant portion of collisions included rear end collisions (20 percent) and left turn collisions (13 percent). There were five crashes involving pedestrians (11 percent) and one crash involving bicycles (two percent) at the intersection.
In addition, the majority of crashes occurred under clear weather conditions (85 percent) and during the day time (85 percent). Given the high number of side swipe collisions, the narrow width of Van Ness Street, and the provision of on-street parking on the north side of Van Ness Street, the presence of on-street parking may contribute to the high crash rate at the intersection. However, in order to make recommendations to improve safety, details regarding the crash history, primarily direction of travel, would need be needed.
Wisconsin Avenue/Upton Street
A review of the crash types at the Wisconsin Avenue/Upton Street intersection reveals that the majority of the crashes at the intersection involved rear end collisions (28 percent) and side swiped collisions (25 percent). There were six crashes involving pedestrians (nine percent) and one crash involving bicycles (two percent) at the intersection.
In addition, the majority of crashes occurred under clear weather conditions (80 percent) and during the day time (67 percent). Based on conversations with DDOT, an evaluation of this intersection is being conducted to better understand the higher crash rate at this location. Based on our understanding, DDOT’s study of the intersection is not yet complete.
Wisconsin Avenue/Porter Street
A review of the crash types at the Wisconsin Avenue/Porter Street intersection reveals that the majority of the crashes at the intersection were side swipe collisions (23 percent). Other crashes making up a significant portion of collisions included rear end collisions (16 percent) and left turn collisions (16 percent). There were two crashes involving pedestrians (seven percent) and no crashes involving bicycles at the intersection.
In addition, a number of crashes occurred under rain/snow weather conditions (26 percent)and during the day time (61 percent). In order to make recommendations to improve safety, details regarding the crash history, primarily direction of travel, would need be needed.
16
FUTURE BACKGROUND CONDITIONS
Traffic Volumes
Overview
In order to forecast year 2021 background traffic volumes in the study area without the proposed redevelopment, increases in traffic associated with growth outside the immediate site vicinity (regional growth) and increases in traffic associated with planned or approved but not yet constructed developments in the study area (pipeline developments) were considered.
Regional Growth
In order to account for potential increases in traffic associated with regional growth and developments outside of the study area, a growth rate was applied to existing traffic volumes. DDOT’s historical average daily traffic (ADT) volume maps were examined to determine an appropriate growth rate for the study area. The historical ADTs indicate that traffic volumes in the study area generally have a growth rate less than one percent per year. Therefore, a growth rate of one percent per year, compounded annually over four years (2017 to 2021), conservatively was applied to the existing vehicular volumes shown on Figure 6. The resulting 2021 volumes with regional growth are shown on Figure 9.
Pipeline Developments
Seven other developments that are planned in and around the study area were identified and considered in forecasting background traffic growth for the 2021 study year (see Figure 10 for locations). A summary of each pipeline development is provided below.
4700 Wisconsin Avenue (Steak and Eggs)
The current Steak and Eggs located at 4700 Wisconsin Avenue will be redeveloped to a mixed-use development featuring approximately 16 residential dwelling units and 3,724 SF of retail. Half of the proposed retail use will be occupied by the existing Steak and Eggs restaurant. The proposed redevelopment received approval from the Board of Zoning Adjustment in October 2014. It is anticipated construction will be completed by 2021.
Trip generation for the redevelopment was determined using the Institute of Transportation Engineers’ (ITE) Trip Generation and applying an 89 percent non-auto mode split, as was presented in the 4700 Wisconsin Avenue Parking Statement prepared by Gorove/Slade, dated October 2014. Square footage for the retail trip generation was calculated using only the square footage of the new retail uses on the site. The redevelopment will generate an estimated 3 AM peak hour vehicle trips and 7 PM peak hour vehicle trips. Given the low trip generation profile and considerable distance from the site, trips for this pipeline
17
development were not explicitly included in the pipeline forecasts. The conservative regional growth applied to the existing vehicular volumes would account for this nominal increase in traffic.
4614 Wisconsin Avenue
The 4614 Wisconsin Avenue mixed-use development will feature approximately 60 residential dwelling units and 14,000 SF of retail space. The proposed redevelopment received approval from the Zoning Commission in February 2013.
Site trip assignments for the redevelopment were taken from the 4600 Wisconsin Ave Transportation and Parking Assessment Report, prepared by O.R. George & Associates, dated September 2012. According to the study, the development will generate an estimated 10 AM peak hour vehicle trips and 39 PM peak hour vehicle trips.
Washington College of Law
The 2011 American University Campus Plan includes the relocation of the Washington College of Law to the Tenleytown Campus. In addition to the relocation, 400 – 500 parking spaces will be added with the Washington College of Law. The 2011 American University Campus Plan including the relocation of the Washington College of Law was approved by the Zoning Commission in May 2012. Classes were planned to begin at the College’s new location in January 2016. As some counts were conducted in 2015 before the intended opening, pipeline trip assignments for this development were still included in the background traffic forecasts.
Site trip assignments for the redevelopment were taken from the American University 2011 Campus Plan Transportation Technical Analysis prepared by Gorove/Slade, dated March 2011.
Cathedral Commons
The Cathedral Commons mixed-use development contains approximately 146 residential dwelling units and 136,484 SF of commercial/retail space. The proposed redevelopment came online in Spring of 2015. However, the redevelopment was not fully leased at the time counts were conducted. The residential occupancy rate was approximately 80 percent and the commercial/retail occupancy rate was approximately 89 percent
Site trip assignments for the redevelopment were taken from the Wisconsin Avenue Giant Transportation Impact Study prepared by Wells + Associates, dated May 2008. Residential and retail/commercial site trips were added to the network proportional to the respective occupancy rates.
18
Georgetown Day School
The Georgetown Day School Planned Unit Development proposed to consolidate the Lower, Middle, and High School divisions and contain approximately 280 residential dwelling units, 13,000 SF of grocery, and 15,700 SF of retail. As the project has not yet been approved and the development program may change, the background trips associated with this pipeline development have not been finalized. Therefore, trips associated with this project cannot be explicitly included in the background analysis at this time.
Sidwell Friends School
The Sidwell Friends School redevelopment will consolidate the Lower, Middle, and High School divisions on one contiguous campus off Wisconsin Avenue. The project was approved by the Board of Zoning Adjustment in March 2016. A number of transportation and operational improvements were recommended in conjunction with the proposed project, including the relocation of the Middle School pick-up/drop-off from 37th Street to a new area off Wisconsin Avenue.
Site trip assignments for the redevelopment were taken from the Sidwell Friends School Revised Comprehensive Transportation Review prepared by Wells + Associates, dated February 2016. Any improvements proposed with the project were included in the analyses.
3900 Wisconsin Avenue
With Fannie Mae’s impending relocation from their current headquarters at 3900 Wisconsin Avenue, the site is likely to be redeveloped in the future. Roadside Development currently is evaluating proposed redevelopment options for the site; however, the development program for the project has not been finalized. Since the development program for the site still is in flux and since the project is at least four months behind the 4000 Wisconsin Avenue redevelopment, the project cannot be explicitly included in the background analysis at this time. However, trips from this redevelopment are at least partially accounted for since existing traffic generated by Fannie Mae is imbedded in the existing traffic counts and will be included in the background traffic forecasts. Based on driveway counts, Fannie Mae currently generates 131 AM peak hour vehicle trips and 136 PM peak hour vehicle trips, as shown on Table 8 below.
Table 8 Fannie Mae Existing Trip Generation
Peak Hour In Out Total*
AM Peak Hour 122 9 131 PM Peak Hour 15 111 136 * An additional access on the southwest corner of the site at 39th Street is open to vehicular traffic during
the peak periods only to allow additional garage access/egress. Counts have not yet been conducted at this access location and are therefore not included in the existing trip generation.
19
Combined Pipeline Developments
Details for each of the pipeline developments and trip assignments are included in Appendix G. The traffic associated with the pipeline developments combined is shown at each of the study intersections on Figure 11.
Background Forecasts
Background 2021 traffic forecasts (without the proposed redevelopment) were developed by combining the existing traffic volumes grown to the year 2021 (shown on Figure 9) with the pipeline traffic volumes shown on Figure 11. The resulting 2021 background traffic forecasts are shown on Figure 12.
Capacity Analysis
Capacity/level of service (LOS) analyses were conducted at the study intersections based on the existing lane use and traffic control shown on Figure 8, future background traffic forecasts shown on Figure 12, and existing DDOT traffic signal timings3.
The level of service results for the 2021 background conditions without the 4000 Wisconsin Avenue redevelopment are presented in Appendix H and summarized in Table 5. As shown in Table 5, under background conditions, many of the study intersections will experience an increase in delay as a result of the background traffic growth and the pipeline projects.
The Van Ness Street/Nebraska Avenue intersection would drop from an overall LOS E to an overall LOS F during the PM peak hour. As shown in Table 5, a number of lane groups at the study intersections also would operate at a LOS E or LOS F during the AM and PM peak hours under background conditions.
Queue Analysis
A queue analysis was conducted for 2021 conditions without the 4000 Wisconsin Avenue redevelopment. Synchro was used to conduct the analyses, using the 95th percentile queue lengths. The results are summarized in Table 6. Queue reports are provided in Appendix H.
As shown in Table 6, the 95th percentile queues at several study intersections will increase under background conditions.
3 Note phasing changes were recommended at the Wisconsin Avenue/Fannie Mae/Post Office/Sidwell
Driveway intersection as part of the Sidwell Friends School Revised Comprehensive Transportation Review. These phasing changes were modeled under background and total future conditions.
20
SITE ANALYSIS
Overview
Donohoe Acquisitions, LLC proposes to redevelop the subject property (4000 Wisconsin Avenue NW) with a mixed-use residential and retail project. The site is located on Square 1823, Lot 9 and is zoned MU-5A. The existing site currently is occupied with approximately 404547 SF of office, 40,998 SF of retail, a 37,916 SF health club, and a conference center (which was originally a 2,070-seat cinema). The proposed redevelopment would raze the existing building from ground level up (below grade space will be retained) to accommodate a new building containing approximately 716 residential units, a 60,200 SF grocery store, a 49,388 SF heath club, and 22,598 SF of general retail space.
Site Access and Circulation
Vehicular Access
Parking access to the site currently is provided via two curb cuts on Upton Street. Loading access is provided via a third curb cut on Upton Street, which provides back-in/front-out loading accommodations. One curb cut on Wisconsin Avenue currently provides access to a motor court with short-term visitor parking.
Under the proposed redevelopment, the two curb cuts that currently provide parking access will be reused. The curb cut for loading access will be shifted approximately 70 feet to the west to accommodate a redesigned loading area that will accommodate front-in/front-out maneuvers. The curb cut on Wisconsin Avenue will be eliminated.
The existing and proposed vehicular circulation patterns for the site are shown on Figures 13A-D. Pedestrian and Bicycle Access
Pedestrians will access to the residential component of the project via two lobby locations on Upton Street. Secondary access to the residential component will be provided on the southern side of the site, along the private roadway. Retail access will be provided along both Upton Street and Wisconsin Avenue. Figures 13B through 13D illustrate the pedestrian circulation for the project.
Access to the long-term bicycle parking is available via the garage entrances and can be accessed from the elevators in the easternmost residential lobby and the elevators that provide access to the Wisconsin Avenue retail.

21
Trip Generation Analysis
Overview
The total number of trips generated by the proposed redevelopment would be comprised of vehicular trips, pedestrian trips, bicycle trips, and transit trips.
Total Trips
Existing Development
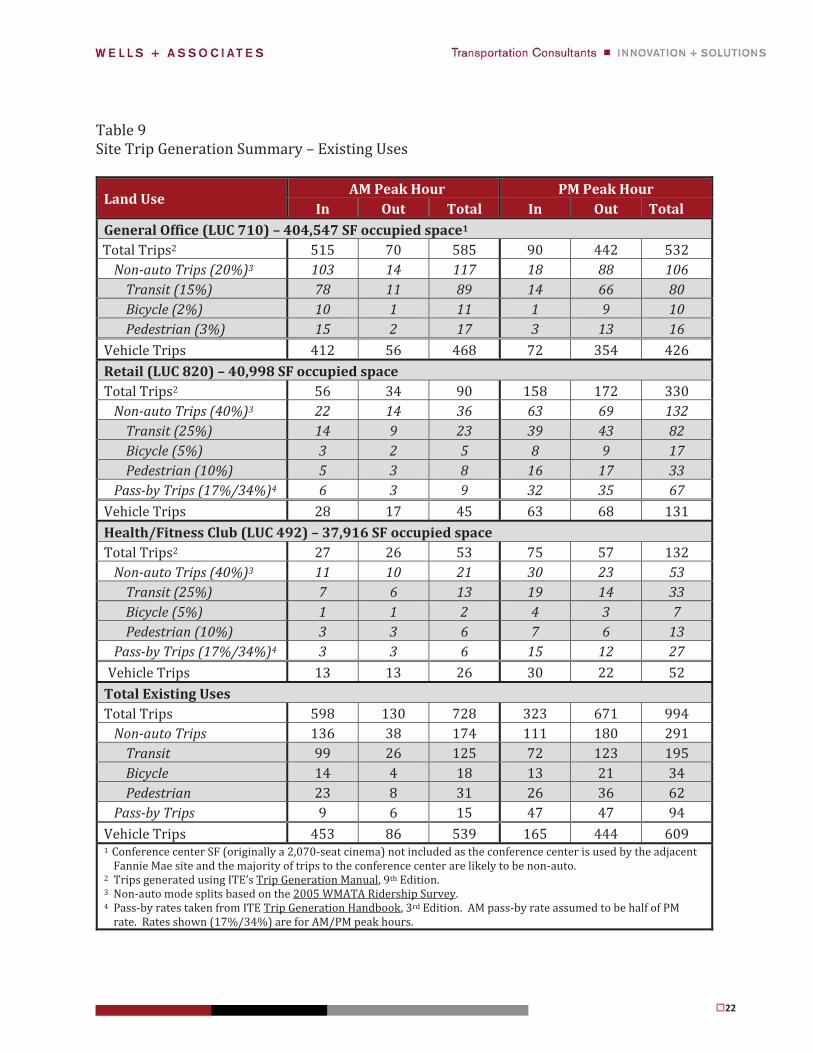
The total number of net new trips anticipated to be generated by the proposed redevelopment was estimated based on the Institute of Transportation Engineer’s (ITE’s) Trip Generation Manual. To estimate the number of trips currently generated by the site, Land Use Code (LUC) 710 (General Office), LUC 820 (Retail), and LUC 492 (Health/Fitness Club) were used with the occupied square footage as the independent variable. Note that trips were not estimated for the conference center in the lower level since the conference center is used by Fannie Mae, which is located next door. The analysis conservatively assumes that the conference center does not generate any additional vehicle trips beyond that which currently is generated by Fannie Mae. The trip generation for the existing development is summarized in Table 9.
Proposed Redevelopment
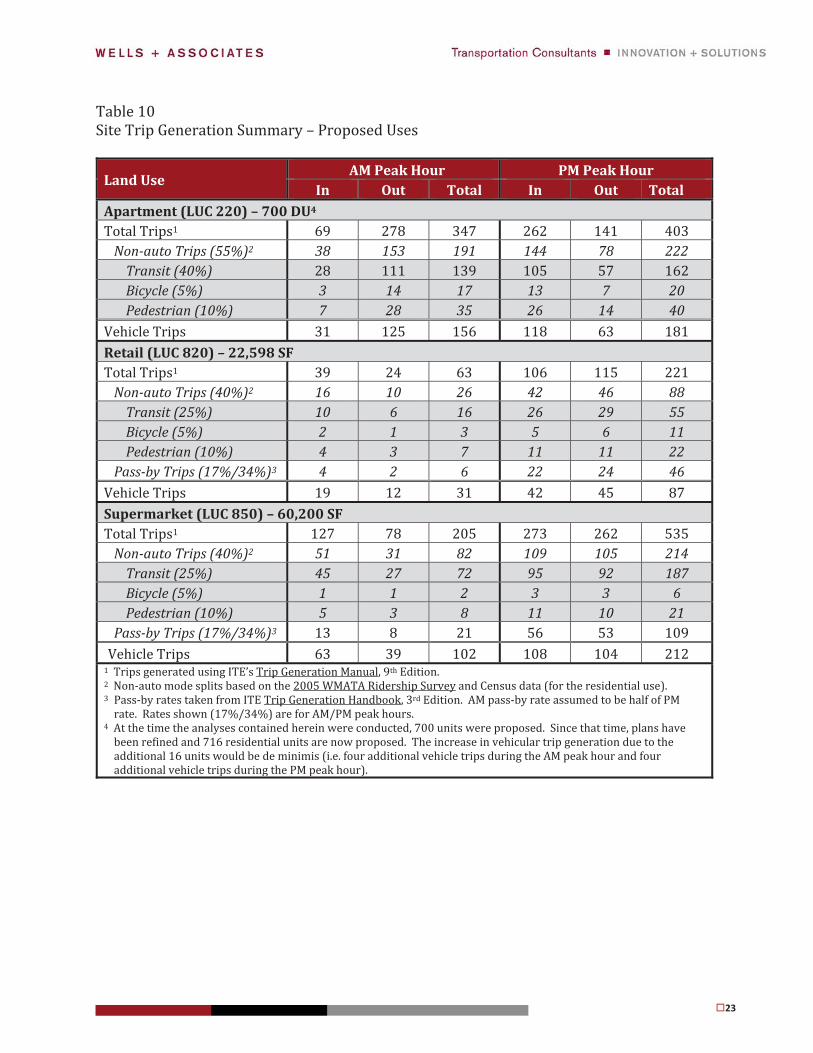
To estimate the number of trips anticipated to be generated by the new uses on site, LUC 220 (Apartment), LUC 492 (Health/Fitness Club), LUC 850 (Supermarket), and LUC 820 (Retail) were used. The number of dwelling units was used as the independent variable for the residential component, while square footage was used as the independent variable for the remaining uses. The trip generation for the proposed development is summarized in Table 10.
22
Table 9 Site Trip Generation Summary – Existing Uses
Land Use AM Peak Hour PM Peak Hour
In Out Total In Out Total General Office (LUC 710) – 404,547 SF occupied space1
Total Trips2 515 70 585 90 442 532 Non-auto Trips (20%)3 103 14 117 18 88 106
Transit (15%) 78 11 89 14 66 80 Bicycle (2%) 10 1 11 1 9 10 Pedestrian (3%) 15 2 17 3 13 16
Vehicle Trips 412 56 468 72 354 426 Retail (LUC 820) – 40,998 SF occupied space Total Trips2 56 34 90 158 172 330
Non-auto Trips (40%)3 22 14 36 63 69 132 Transit (25%) 14 9 23 39 43 82 Bicycle (5%) 3 2 5 8 9 17 Pedestrian (10%) 5 3 8 16 17 33
Pass-by Trips (17%/34%)4 6 3 9 32 35 67 Vehicle Trips 28 17 45 63 68 131 Health/Fitness Club (LUC 492) – 37,916 SF occupied space Total Trips2 27 26 53 75 57 132
Non-auto Trips (40%)3 11 10 21 30 23 53 Transit (25%) 7 6 13 19 14 33 Bicycle (5%) 1 1 2 4 3 7 Pedestrian (10%) 3 3 6 7 6 13
Pass-by Trips (17%/34%)4 3 3 6 15 12 27 Vehicle Trips 13 13 26 30 22 52
Total Existing Uses Total Trips 598 130 728 323 671 994
Non-auto Trips 136 38 174 111 180 291 Transit 99 26 125 72 123 195 Bicycle 14 4 18 13 21 34 Pedestrian 23 8 31 26 36 62
Pass-by Trips 9 6 15 47 47 94 Vehicle Trips 453 86 539 165 444 609 1 Conference center SF (originally a 2,070-seat cinema) not included as the conference center is used by the adjacent
Fannie Mae site and the majority of trips to the conference center are likely to be non-auto. 2 Trips generated using ITE’s Trip Generation Manual, 9th Edition. 3 Non-auto mode splits based on the 2005 WMATA Ridership Survey. 4 Pass-by rates taken from ITE Trip Generation Handbook, 3rd Edition. AM pass-by rate assumed to be half of PM
rate. Rates shown (17%/34%) are for AM/PM peak hours.
23
Table 10 Site Trip Generation Summary – Proposed Uses
Land Use AM Peak Hour PM Peak Hour
In Out Total In Out Total Apartment (LUC 220) – 700 DU4
Total Trips1 69 278 347 262 141 403 Non-auto Trips (55%)2 38 153 191 144 78 222
Transit (40%) 28 111 139 105 57 162 Bicycle (5%) 3 14 17 13 7 20 Pedestrian (10%) 7 28 35 26 14 40
Vehicle Trips 31 125 156 118 63 181 Retail (LUC 820) – 22,598 SF Total Trips1 39 24 63 106 115 221
Non-auto Trips (40%)2 16 10 26 42 46 88 Transit (25%) 10 6 16 26 29 55 Bicycle (5%) 2 1 3 5 6 11 Pedestrian (10%) 4 3 7 11 11 22
Pass-by Trips (17%/34%)3 4 2 6 22 24 46 Vehicle Trips 19 12 31 42 45 87 Supermarket (LUC 850) – 60,200 SF Total Trips1 127 78 205 273 262 535
Non-auto Trips (40%)2 51 31 82 109 105 214 Transit (25%) 45 27 72 95 92 187 Bicycle (5%) 1 1 2 3 3 6 Pedestrian (10%) 5 3 8 11 10 21
Pass-by Trips (17%/34%)3 13 8 21 56 53 109 Vehicle Trips 63 39 102 108 104 212
1 Trips generated using ITE’s Trip Generation Manual, 9th Edition. 2 Non-auto mode splits based on the 2005 WMATA Ridership Survey and Census data (for the residential use). 3 Pass-by rates taken from ITE Trip Generation Handbook, 3rd Edition. AM pass-by rate assumed to be half of PM
rate. Rates shown (17%/34%) are for AM/PM peak hours. 4 At the time the analyses contained herein were conducted, 700 units were proposed. Since that time, plans have
been refined and 716 residential units are now proposed. The increase in vehicular trip generation due to the additional 16 units would be de minimis (i.e. four additional vehicle trips during the AM peak hour and four additional vehicle trips during the PM peak hour).

24
Table 10 (continued) Site Trip Generation Summary – Proposed Uses
Land Use AM Peak Hour PM Peak Hour
In Out Total In Out Total Health/Fitness Club (LUC 492) – 49,388 SF Total Trips1 35 35 70 97 73 170
Non-auto Trips (40%)2 14 14 28 39 29 68 Transit (25%) 9 9 18 24 18 42 Bicycle (5%) 2 2 4 5 4 9 Pedestrian (10%) 3 3 6 10 7 17
Pass-by Trips (17%/34%)3 4 4 8 20 15 35 Vehicle Trips 17 17 34 38 29 67 Total Proposed Uses Total Trips 270 415 685 738 591 1,329
Non-auto Trips 119 208 327 334 258 592 Transit 92 153 245 250 196 446 Bicycle 8 18 26 26 20 46Pedestrian 19 37 56 58 42 100
Pass-by Trips 21 14 35 98 92 190 Vehicle Trips 130 193 323 306 241 547 1 Trips generated using ITE’s Trip Generation Manual, 9th Edition. 2 Non-auto mode splits based on the 2005 WMATA Ridership Survey and Census data (for the residential use). 3 Pass-by rates taken from ITE Trip Generation Handbook, 3rd Edition. AM pass-by rate assumed to be half of PM rate.
Rates shown (17%/34%) are for AM/PM peak hours. 4 At the time the analyses contained herein were conducted, 700 units were proposed. Since that time, plans have
been refined and 716 residential units are now proposed. The increase in vehicular trip generation due to the additional 16 units would be de minimis (i.e. four additional vehicle trips during the AM peak hour and four additional vehicle trips during the PM peak hour).
Non-Auto Mode Split
A portion of the trips generated by the existing development are made via non-auto modes of transportation. The percentage of site-generated trips that use non-auto modes of transportation is dependent on the proximity of the site to transit stops, the walkability of the surrounding area, and the degree to which the use of non-auto modes is encouraged, such as by implementation of a transportation demand management (TDM) program.
To estimate the office non-auto mode split, the 2005 WMATA Ridership Survey equations (based on distance to metro) were used. Approximately 14 percent of employees would be expected to use transit currently. To account for additional walkers and bikers, the non-auto mode split was conservatively assumed to be 20 percent for the office component.
To estimate the non-auto mode split for the retail uses, the 2005 WMATA Ridership Survey equations (based on distance to metro) were used. The WMATA Ridership data indicates
25
approximately 10 percent of trips would be made via transit. A 40 percent mode split was assumed to account for walking and bicycling and the neighborhood-serving nature of the retail.
Based on these mode split estimates, the existing development is estimated to generate 174 AM peak hour trips and 291 PM peak hour trips by non-auto modes of transportation. The non-auto trips will be comprised on transit, pedestrian, and bicycle trips. The estimates for the specific modes were based on data contained in the 2005 WMATA Ridership Survey.
Proposed Redevelopment
Like the existing development, a portion of the trips generated by the proposed redevelopment would be made via non-auto modes of transportation.
According to US Census data, approximately 48 percent of residents in the vicinity of the site take public transportation, walk, or bike to work. Another six percent carpool and six percent work at home. Therefore, it is anticipated that the non-auto mode split for the proposed residential component would be 55 percent.
Consistent with the non-auto mode split assumptions for the existing development, the proposed retail uses were assumed to have a non-auto mode split of 40 percent.
Based on these mode split estimates, the proposed uses are expected to generate 327 AM peak hour trips and 592 PM peak hour trips by non-auto modes of transportation.
The non-auto trips will be comprised on transit, pedestrian, and bicycle trips. The estimates for the specific modes were based on data contained in US Census data and the 2005 WMATA Ridership Survey.
Pass-by Trips
Existing Development
A portion of the trips generated by retail and service uses are made by vehicles already using the adjacent streets to reach a different destination but stop at the site in passing. This type of trip is called a pass-by trip, and is defined by Trip Generation Manual as a trip in which the retail or service destination is the secondary part of a primary trip, such as a work-to-shopping-to-home trip. An example of a pass-by trip would be one in which a driver stops at the retail or service uses on his/her way home from work. Pass-by rates were obtained from the ITE Trip Generation Handbook, 9th Edition. Since no AM pass-by rates were provided, the AM peak hour pass-by rate was assumed to be half of the PM peak hour pass-by rate.
Pass-by trips are estimated to account for 15 AM peak hour vehicle trips and 94 PM peak hour vehicle trips generated by the current development.
26
Proposed Redevelopment
Like the existing development, a portion of the trips generated by the proposed redevelopment would be pass-by trips.
The pass-by rates for the proposed retail uses were assumed to be the same as that assumed for the existing retail uses. Pass-by trips are expected to account for 35 AM peak hour vehicle trips and 190 PM peak hour vehicle trips generated by the proposed redevelopment.
Net Vehicle Trips
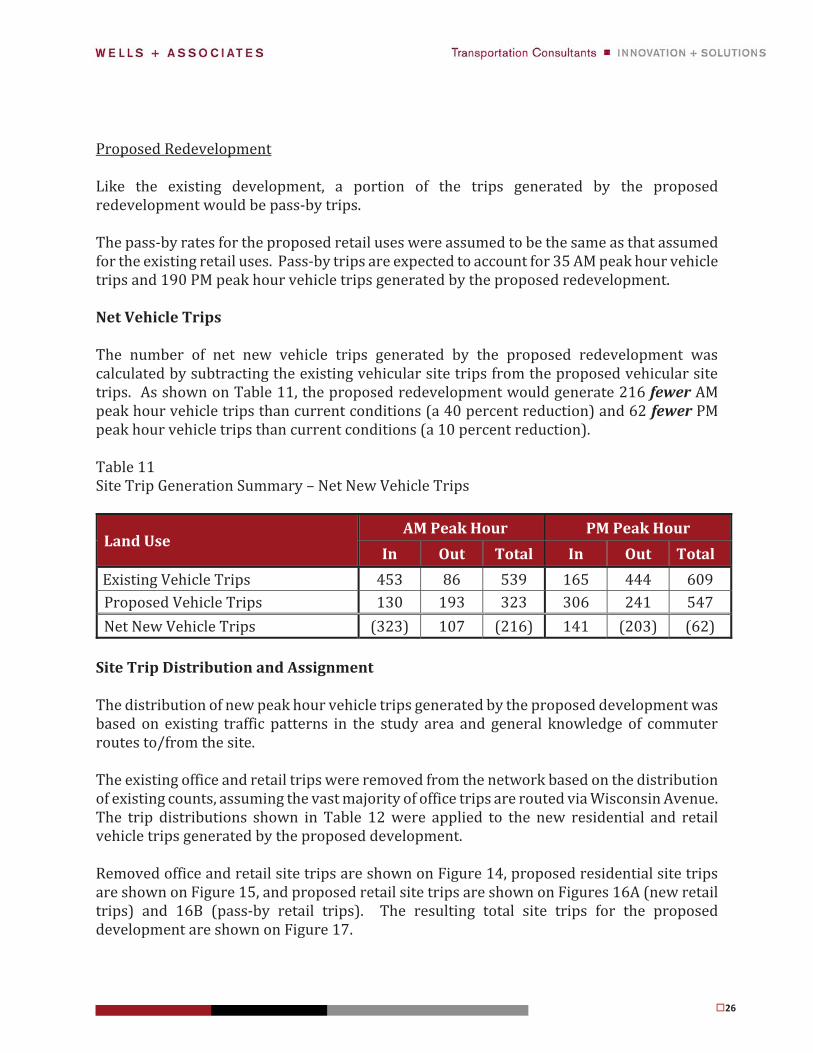
The number of net new vehicle trips generated by the proposed redevelopment was calculated by subtracting the existing vehicular site trips from the proposed vehicular site trips. As shown on Table 11, the proposed redevelopment would generate 216 fewer AM peak hour vehicle trips than current conditions (a 40 percent reduction) and 62 fewer PM peak hour vehicle trips than current conditions (a 10 percent reduction).
Table 11 Site Trip Generation Summary – Net New Vehicle Trips
Land Use AM Peak Hour PM Peak Hour
In Out Total In Out Total Existing Vehicle Trips 453 86 539 165 444 609 Proposed Vehicle Trips 130 193 323 306 241 547Net New Vehicle Trips (323) 107 (216) 141 (203) (62)
Site Trip Distribution and Assignment
The distribution of new peak hour vehicle trips generated by the proposed development was based on existing traffic patterns in the study area and general knowledge of commuter routes to/from the site.
The existing office and retail trips were removed from the network based on the distribution of existing counts, assuming the vast majority of office trips are routed via Wisconsin Avenue. The trip distributions shown in Table 12 were applied to the new residential and retail vehicle trips generated by the proposed development.
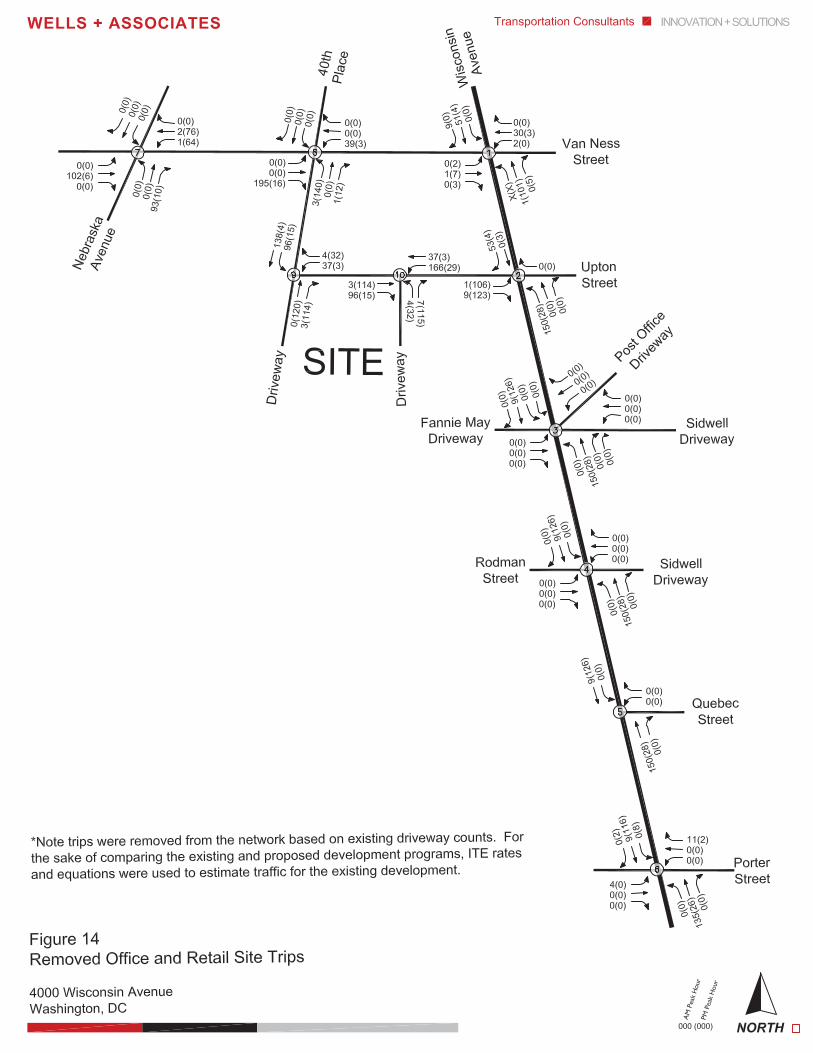
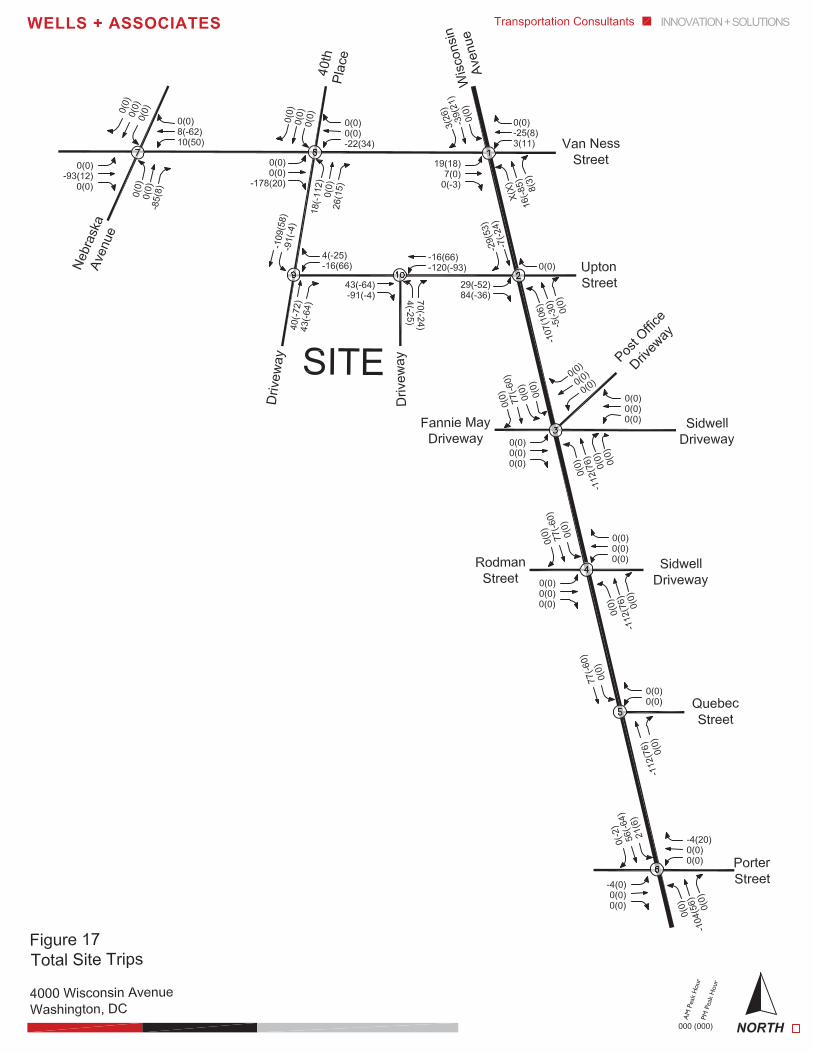
Removed office and retail site trips are shown on Figure 14, proposed residential site trips are shown on Figure 15, and proposed retail site trips are shown on Figures 16A (new retail trips) and 16B (pass-by retail trips). The resulting total site trips for the proposed development are shown on Figure 17.
27
Table 12 Site Trip Distributions
Roadway Direction Residential Retail
Wisconsin Avenue North 20% 30% South 45% 30%
Van Ness Street East 10% 10% West 10% 25%
Porter Road East 15% 5%
Proposed Parking
Vehicular Parking
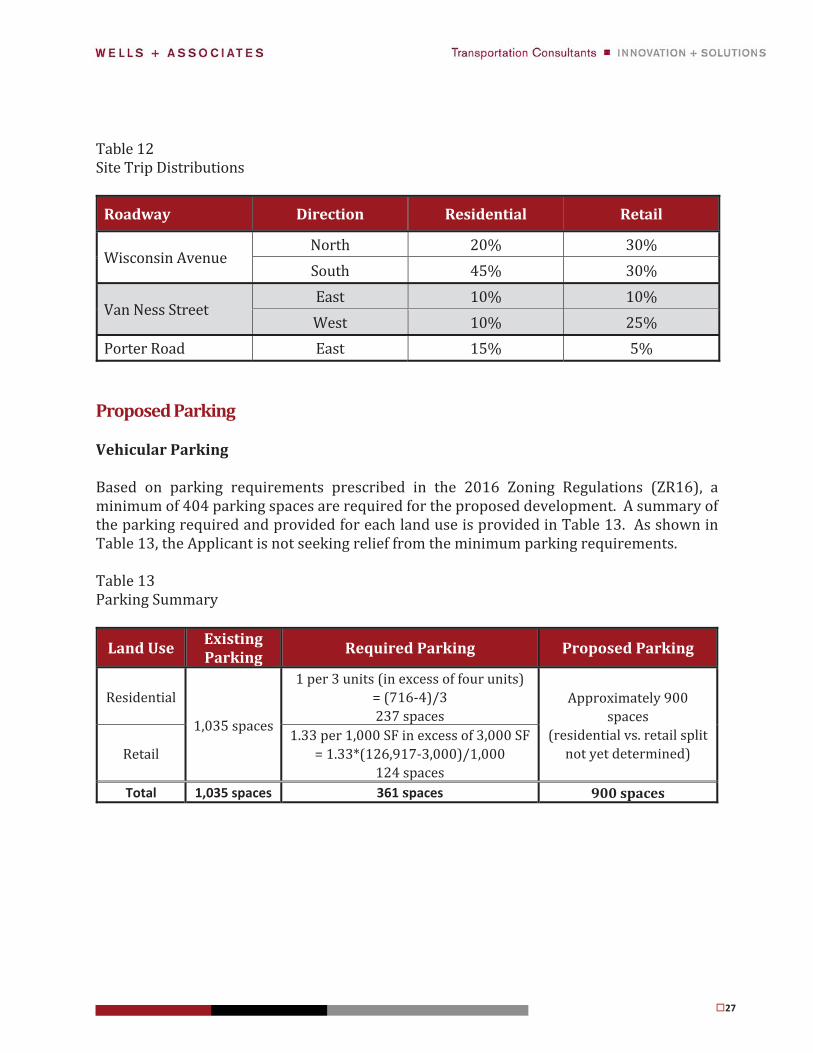
Based on parking requirements prescribed in the 2016 Zoning Regulations (ZR16), a minimum of 404 parking spaces are required for the proposed development. A summary of the parking required and provided for each land use is provided in Table 13. As shown in Table 13, the Applicant is not seeking relief from the minimum parking requirements.
Table 13 Parking Summary
Land Use Existing Parking
Required Parking Proposed Parking
Residential
1,035 spaces
1 per 3 units (in excess of four units) = (716-4)/3 237 spaces
Approximately 900 spaces
(residential vs. retail split not yet determined) Retail
1.33 per 1,000 SF in excess of 3,000 SF = 1.33*(126,917-3,000)/1,000
124 spaces Total 1,035 spaces 361 spaces 900 spaces
28
Bicycle Parking
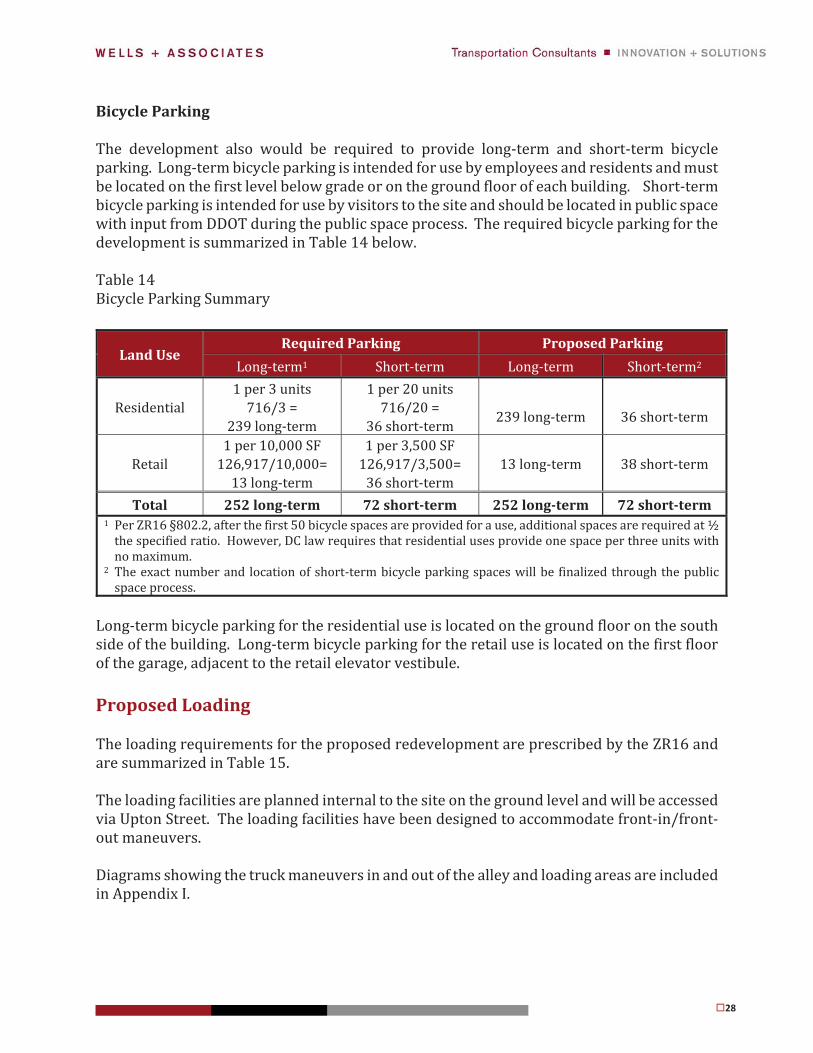
The development also would be required to provide long-term and short-term bicycle parking. Long-term bicycle parking is intended for use by employees and residents and must be located on the first level below grade or on the ground floor of each building. Short-term bicycle parking is intended for use by visitors to the site and should be located in public space with input from DDOT during the public space process. The required bicycle parking for the development is summarized in Table 14 below.
Table 14 Bicycle Parking Summary
Land Use Required Parking Proposed Parking
Long-term1 Short-term Long-term Short-term2
Residential 1 per 3 units
716/3 = 239 long-term
1 per 20 units 716/20 =
36 short-term
239 long-term
36 short-term
Retail 1 per 10,000 SF
126,917/10,000= 13 long-term
1 per 3,500 SF 126,917/3,500=
36 short-term 13 long-term 38 short-term
Total 252 long-term 72 short-term 252 long-term 72 short-term 1 Per ZR16 §802.2, after the first 50 bicycle spaces are provided for a use, additional spaces are required at ½
the specified ratio. However, DC law requires that residential uses provide one space per three units with no maximum.
2 The exact number and location of short-term bicycle parking spaces will be finalized through the public space process.
Long-term bicycle parking for the residential use is located on the ground floor on the south side of the building. Long-term bicycle parking for the retail use is located on the first floor of the garage, adjacent to the retail elevator vestibule.
Proposed Loading
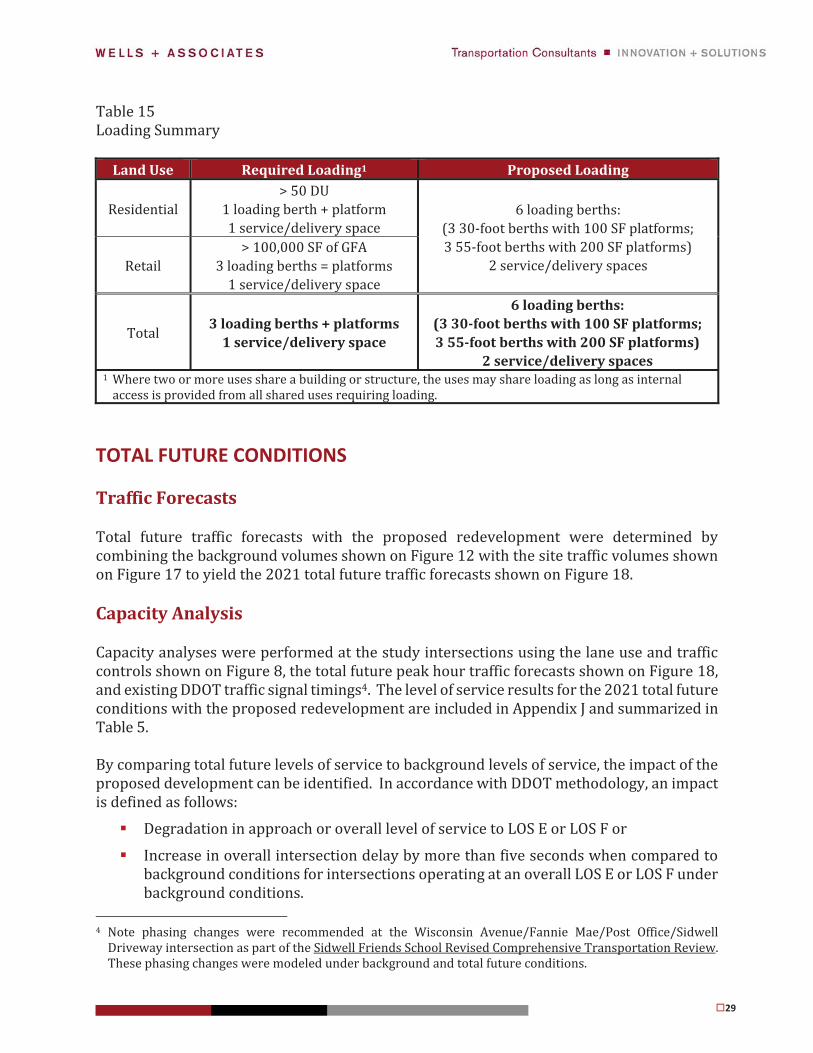
The loading requirements for the proposed redevelopment are prescribed by the ZR16 and are summarized in Table 15.
The loading facilities are planned internal to the site on the ground level and will be accessed via Upton Street. The loading facilities have been designed to accommodate front-in/front-out maneuvers.
Diagrams showing the truck maneuvers in and out of the alley and loading areas are included in Appendix I.
29
Table 15 Loading Summary
Land Use Required Loading1 Proposed Loading
Residential> 50 DU
1 loading berth + platform 1 service/delivery space
6 loading berths: (3 30-foot berths with 100 SF platforms; 3 55-foot berths with 200 SF platforms)
2 service/delivery spaces Retail > 100,000 SF of GFA
3 loading berths = platforms 1 service/delivery space
Total 3 loading berths + platforms 1 service/delivery space
6 loading berths: (3 30-foot berths with 100 SF platforms; 3 55-foot berths with 200 SF platforms)
2 service/delivery spaces 1 Where two or more uses share a building or structure, the uses may share loading as long as internal
access is provided from all shared uses requiring loading.
TOTAL FUTURE CONDITIONS
Traffic Forecasts
Total future traffic forecasts with the proposed redevelopment were determined by combining the background volumes shown on Figure 12 with the site traffic volumes shown on Figure 17 to yield the 2021 total future traffic forecasts shown on Figure 18.
Capacity Analysis
Capacity analyses were performed at the study intersections using the lane use and traffic controls shown on Figure 8, the total future peak hour traffic forecasts shown on Figure 18, and existing DDOT traffic signal timings4. The level of service results for the 2021 total future conditions with the proposed redevelopment are included in Appendix J and summarized in Table 5.
By comparing total future levels of service to background levels of service, the impact of the proposed development can be identified. In accordance with DDOT methodology, an impact is defined as follows:
Degradation in approach or overall level of service to LOS E or LOS F or
Increase in overall intersection delay by more than five seconds when compared to background conditions for intersections operating at an overall LOS E or LOS F under background conditions.
4 Note phasing changes were recommended at the Wisconsin Avenue/Fannie Mae/Post Office/Sidwell
Driveway intersection as part of the Sidwell Friends School Revised Comprehensive Transportation Review. These phasing changes were modeled under background and total future conditions.
30
As shown in Table 5, where overall intersection levels of service under background conditions are projected to be a LOS D or better, overall intersection levels of service under total future conditions with the proposed redevelopment also are projected to be at a LOS D or better. No intersections operating at an overall LOS E or worse are projected to experience an increase in overall intersection delay by more than five seconds when compared to background conditions.
Individual intersection lane groups are projected to maintain acceptable levels of service (LOS D or better) with four exceptions:
Wisconsin Avenue/Van Ness Street eastbound left – drops from LOS E to LOS F during the PM peak hour;
Wisconsin Avenue/Van Ness Street eastbound through/right – drops from LOS D to LOS E during the AM peak hour;
Wisconsin Avenue/Van Ness Street westbound left – drops from LOS E to LOS F during the PM peak hour; and
Wisconsin Avenue/Upton Street northbound left/through/right – drops from LOS D to LOS E during the PM peak hour.
In some cases, intersection levels of service are expected to improve from background to total future conditions due to the removal of existing site trips. The following locations are expected to experience an improvement in level of service:
Wisconsin Avenue/Upton Street overall level of service – improves from LOS F to LOS E during the AM peak hour;
Van Ness Street/Nebraska Avenue eastbound approach – improves from LOS F to LOS D during the AM peak hour;
Van Ness Street/Nebraska Avenue northbound approach – improves from LOS E to LOS D during the AM peak hour; and
Van Ness Street/40th Place northbound approach – improves from LOS E to LOS D during the AM peak hour.
Queue Analysis
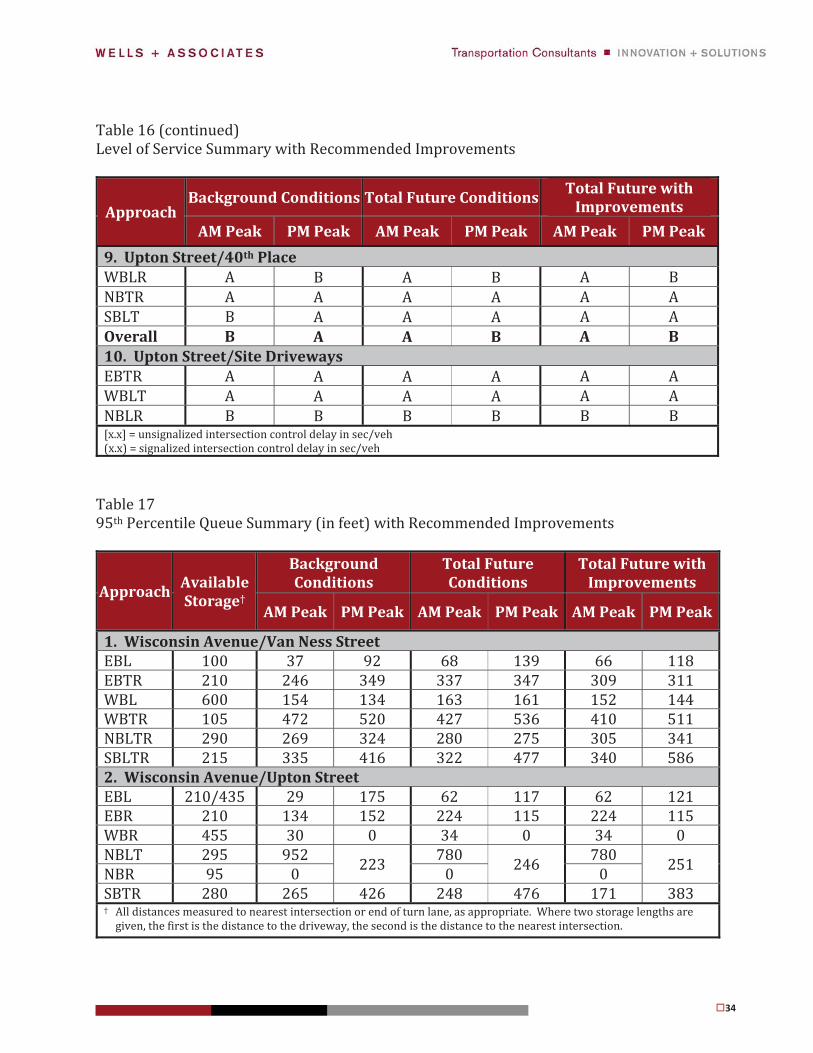
A queue analysis was conducted for 2021 total future conditions. Synchro was used to conduct the analyses, using the 95th percentile queue lengths. The results are summarized in Table 6 and queue reports are provided in Appendix J.
By comparing total future queues to background queues, the impact of the proposed development can be identified. In accordance with DDOT methodology, an impact is defined as an increase in the 95th percentile queue greater than 150 feet when compared to background conditions. As shown in Table 6, no queues would increase by more than 150
31
feet; however, 95th percentile queues are expected to improve (shorten) by more than 150 feet at the following locations:
Wisconsin Avenue/Upton Street northbound left/through lane group – queue is projected to decrease by 172 feet during the AM peak hour;
Van Ness Street/Nebraska Avenue eastbound approach – queue is projected to decrease by 184 feet during the AM peak hour; and
Van Ness Street/40th Place northbound approach – queue is projected to decrease by 232 feet during the AM peak hour.
Improvement Analysis
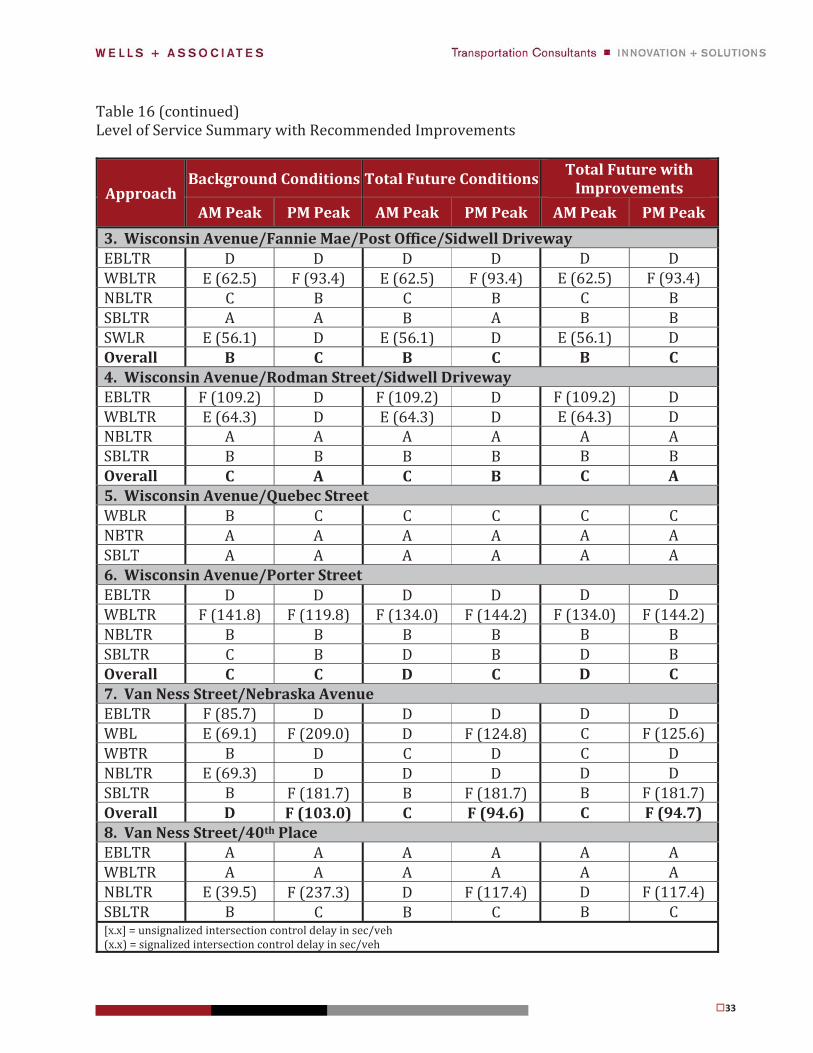
Although the proposed redevelopment is projected to substantially reduce the number of peak hour vehicle trips compared to current conditions, the directional distribution of the trips would be altered as a result of the redevelopment. For example, due to the large office component, current trips are heavily directed inbound during the morning peak hour and outbound during the evening peak hour. With the proposed redevelopment, the residential component would cause the directionality of trips to be in the reverse direction (i.e. trips would be more heavily weighted in the outbound direction during the morning peak hour and the inbound direction during the evening peak hour). As a result of this directional change of trips, some approaches at certain intersections would experience a drop in levels of service and some would experience an improvement in levels of service as previously noted. To mitigate the impact of the proposed redevelopment, improvements were examined at each impacted intersection. Specifically, minor timing adjustments were evaluated to better accommodate the redirection of the trips. Note that the cycle lengths and offsets are consistent with existing conditions. Results of the analyses are summarized in Tables 16 and 17. For comparison purposes, the background and total future conditions (without improvements) also are provided in Tables 16 and 17.
Wisconsin Avenue/Van Ness Street
The eastbound left, eastbound through/right, and westbound levels of service for this intersection are projected to drop to LOS E or LOS F under future conditions. In order to offset the impact associated with the proposed redevelopment and improve the overall level of service at the intersection, the following minor timing adjustments could be made:
During the AM peak, shift two seconds of green time from the mainline northbound/southbound phases to the eastbound/westbound phases.
During the PM peak, shift three seconds of green time from the mainline northbound/southbound phases to the eastbound/westbound phases.
As shown in Table 16, these timing adjustments would improve the levels of service for the eastbound through/right, westbound left, and westbound through/right during the AM peak hour. During the PM peak hour, the levels of service would improve for the eastbound left, eastbound through/right, and westbound left.
32
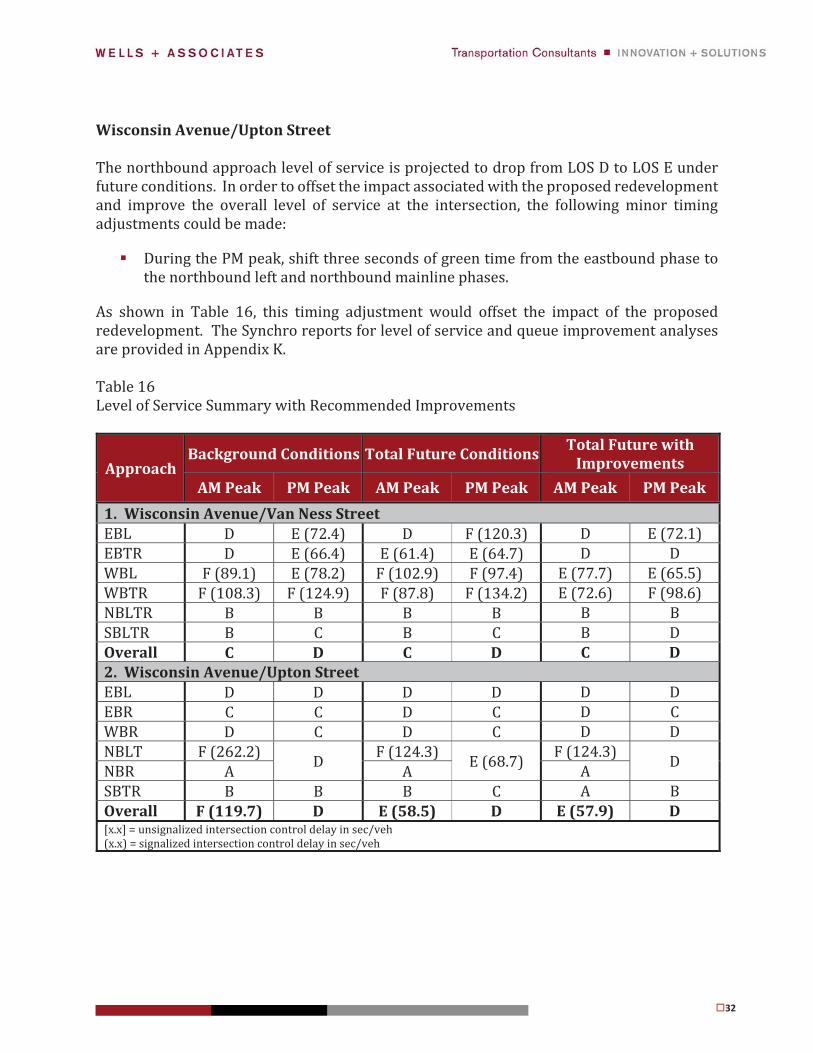
Wisconsin Avenue/Upton Street
The northbound approach level of service is projected to drop from LOS D to LOS E under future conditions. In order to offset the impact associated with the proposed redevelopment and improve the overall level of service at the intersection, the following minor timing adjustments could be made:
During the PM peak, shift three seconds of green time from the eastbound phase to the northbound left and northbound mainline phases.
As shown in Table 16, this timing adjustment would offset the impact of the proposed redevelopment. The Synchro reports for level of service and queue improvement analyses are provided in Appendix K.
Table 16 Level of Service Summary with Recommended Improvements
Approach Background Conditions Total Future Conditions Total Future with
Improvements AM Peak PM Peak AM Peak PM Peak AM Peak PM Peak
1. Wisconsin Avenue/Van Ness Street EBL D E (72.4) D F (120.3) D E (72.1) EBTR D E (66.4) E (61.4) E (64.7) D D WBL F (89.1) E (78.2) F (102.9) F (97.4) E (77.7) E (65.5) WBTR F (108.3) F (124.9) F (87.8) F (134.2) E (72.6) F (98.6) NBLTR B B B B B B SBLTR B C B C B D Overall C D C D C D 2. Wisconsin Avenue/Upton Street EBL D D D D D D EBR C C D C D C WBR D C D C D D NBLT F (262.2) D F (124.3) E (68.7) F (124.3) D NBR A A A SBTR B B B C A B Overall F (119.7) D E (58.5) D E (57.9) D [x.x] = unsignalized intersection control delay in sec/veh (x.x) = signalized intersection control delay in sec/veh
33
Table 16 (continued) Level of Service Summary with Recommended Improvements
Approach Background Conditions Total Future Conditions Total Future with
Improvements AM Peak PM Peak AM Peak PM Peak AM Peak PM Peak
3. Wisconsin Avenue/Fannie Mae/Post Office/Sidwell Driveway EBLTR D D D D D D WBLTR E (62.5) F (93.4) E (62.5) F (93.4) E (62.5) F (93.4) NBLTR C B C B C B SBLTR A A B A B B SWLR E (56.1) D E (56.1) D E (56.1) D Overall B C B C B C 4. Wisconsin Avenue/Rodman Street/Sidwell Driveway EBLTR F (109.2) D F (109.2) D F (109.2) D WBLTR E (64.3) D E (64.3) D E (64.3) D NBLTR A A A A A A SBLTR B B B B B B Overall C A C B C A5. Wisconsin Avenue/Quebec Street WBLR B C C C C C NBTR A A A A A A SBLT A A A A A A 6. Wisconsin Avenue/Porter Street EBLTR D D D D D D WBLTR F (141.8) F (119.8) F (134.0) F (144.2) F (134.0) F (144.2) NBLTR B B B B B B SBLTR C B D B D B Overall C C D C D C7. Van Ness Street/Nebraska Avenue EBLTR F (85.7) D D D D D WBL E (69.1) F (209.0) D F (124.8) C F (125.6) WBTR B D C D C D NBLTR E (69.3) D D D D D SBLTR B F (181.7) B F (181.7) B F (181.7) Overall D F (103.0) C F (94.6) C F (94.7) 8. Van Ness Street/40th Place EBLTR A A A A A A WBLTR A A A A A A NBLTR E (39.5) F (237.3) D F (117.4) D F (117.4) SBLTR B C B C B C [x.x] = unsignalized intersection control delay in sec/veh (x.x) = signalized intersection control delay in sec/veh
34
Table 16 (continued) Level of Service Summary with Recommended Improvements
Approach Background Conditions Total Future Conditions Total Future with
Improvements AM Peak PM Peak AM Peak PM Peak AM Peak PM Peak
9. Upton Street/40th Place WBLR A B A B A B NBTR A A A A A A SBLT B A A A A A Overall B A A B A B 10. Upton Street/Site Driveways EBTR A A A A A AWBLT A A A A A A NBLR B B B B B B [x.x] = unsignalized intersection control delay in sec/veh (x.x) = signalized intersection control delay in sec/veh
Table 17 95th Percentile Queue Summary (in feet) with Recommended Improvements
Approach AvailableStorage†
Background Conditions
Total Future Conditions
Total Future with Improvements
AM Peak PM Peak AM Peak PM Peak AM Peak PM Peak
1. Wisconsin Avenue/Van Ness Street EBL 100 37 92 68 139 66 118 EBTR 210 246 349 337 347 309 311 WBL 600 154 134 163 161 152 144 WBTR 105 472 520 427 536 410 511 NBLTR 290 269 324 280 275 305 341 SBLTR 215 335 416 322 477 340 5862. Wisconsin Avenue/Upton Street EBL 210/435 29 175 62 117 62 121 EBR 210 134 152 224 115 224 115 WBR 455 30 0 34 0 34 0 NBLT 295 952
223 780 246 780 251 NBR 95 0 0 0
SBTR 280 265 426 248 476 171 383† All distances measured to nearest intersection or end of turn lane, as appropriate. Where two storage lengths are
given, the first is the distance to the driveway, the second is the distance to the nearest intersection.
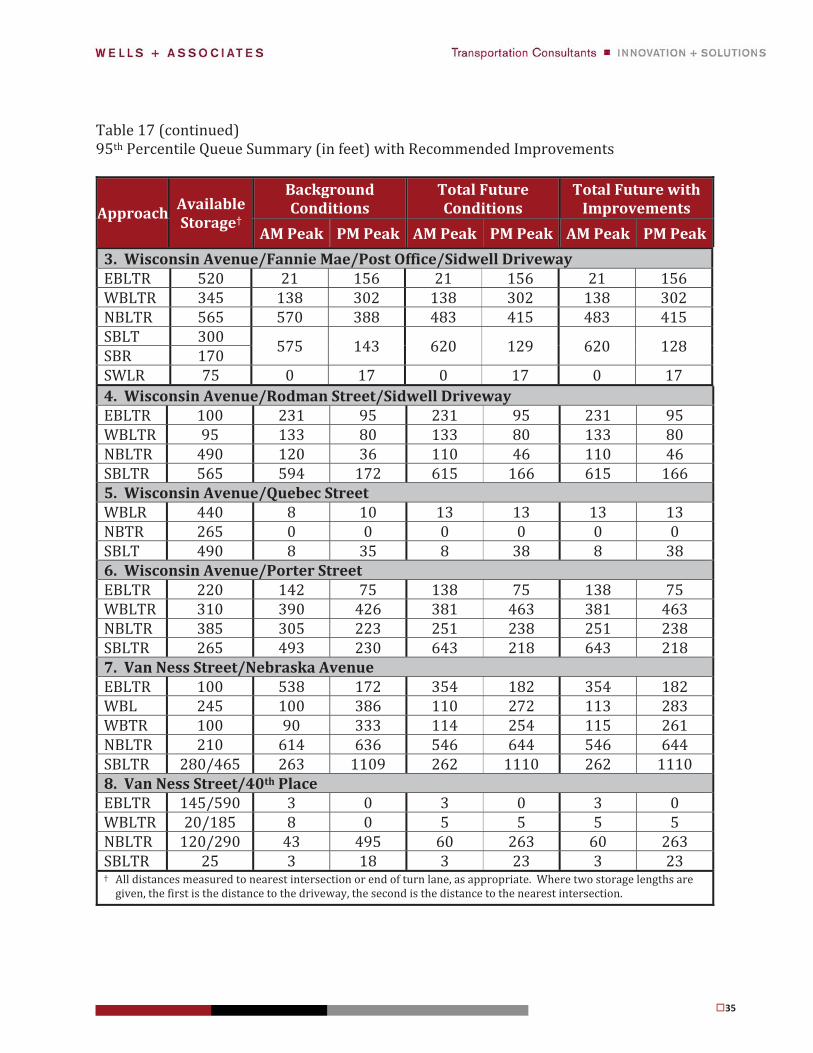
35
Table 17 (continued) 95th Percentile Queue Summary (in feet) with Recommended Improvements
Approach Available Storage†
Background Conditions
Total Future Conditions
Total Future with Improvements
AM Peak PM Peak AM Peak PM Peak AM Peak PM Peak 3. Wisconsin Avenue/Fannie Mae/Post Office/Sidwell Driveway EBLTR 520 21 156 21 156 21 156 WBLTR 345 138 302 138 302 138 302 NBLTR 565 570 388 483 415 483 415 SBLT 300 575 143 620 129 620 128 SBR 170 SWLR 75 0 17 0 17 0 17 4. Wisconsin Avenue/Rodman Street/Sidwell DrivewayEBLTR 100 231 95 231 95 231 95 WBLTR 95 133 80 133 80 133 80 NBLTR 490 120 36 110 46 110 46 SBLTR 565 594 172 615 166 615 166 5. Wisconsin Avenue/Quebec Street WBLR 440 8 10 13 13 13 13 NBTR 265 0 0 0 0 0 0 SBLT 490 8 35 8 38 8 38 6. Wisconsin Avenue/Porter Street EBLTR 220 142 75 138 75 138 75 WBLTR 310 390 426 381 463 381 463 NBLTR 385 305 223 251 238 251 238 SBLTR 265 493 230 643 218 643 218 7. Van Ness Street/Nebraska Avenue EBLTR 100 538 172 354 182 354 182 WBL 245 100 386 110 272 113 283 WBTR 100 90 333 114 254 115 261 NBLTR 210 614 636 546 644 546 644 SBLTR 280/465 263 1109 262 1110 262 1110 8. Van Ness Street/40th Place
EBLTR 145/590 3 0 3 0 3 0 WBLTR 20/185 8 0 5 5 5 5 NBLTR 120/290 43 495 60 263 60 263 SBLTR 25 3 18 3 23 3 23 † All distances measured to nearest intersection or end of turn lane, as appropriate. Where two storage lengths are
given, the first is the distance to the driveway, the second is the distance to the nearest intersection.
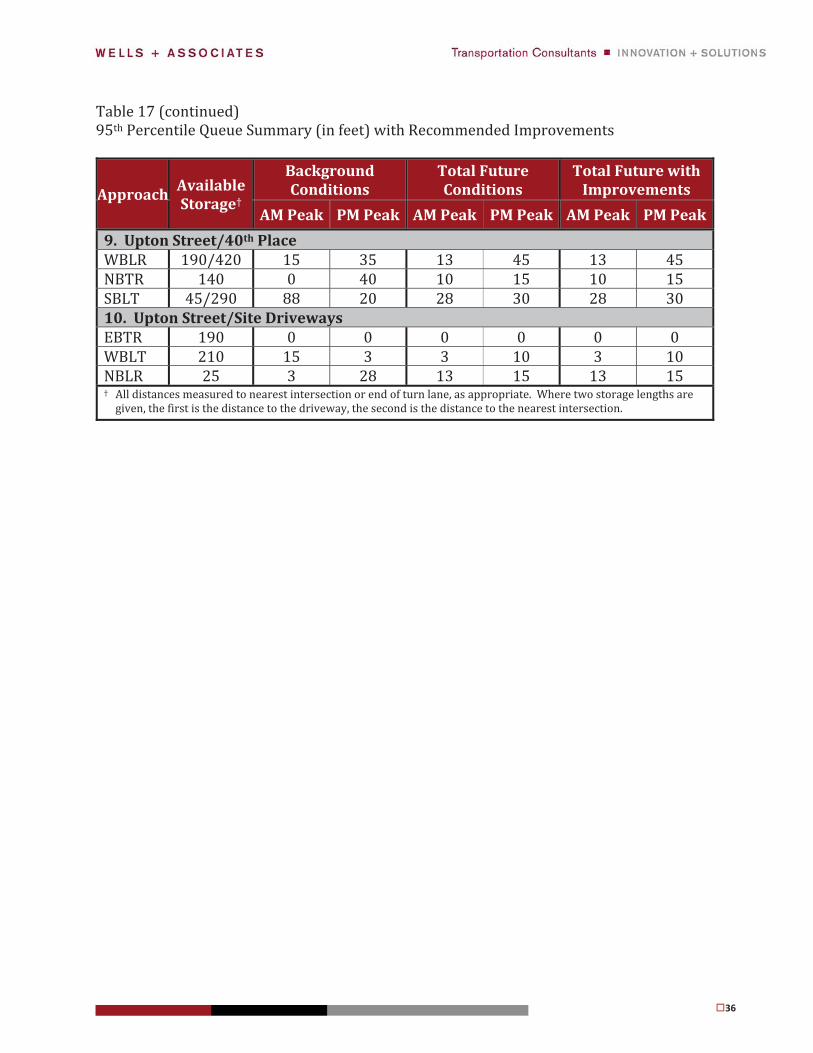
36
Table 17 (continued) 95th Percentile Queue Summary (in feet) with Recommended Improvements
Approach Available Storage†
Background Conditions
Total Future Conditions
Total Future with Improvements
AM Peak PM Peak AM Peak PM Peak AM Peak PM Peak 9. Upton Street/40th Place
WBLR 190/420 15 35 13 45 13 45 NBTR 140 0 40 10 15 10 15 SBLT 45/290 88 20 28 30 28 30 10. Upton Street/Site Driveways EBTR 190 0 0 0 0 0 0 WBLT 210 15 3 3 10 3 10 NBLR 25 3 28 13 15 13 15 † All distances measured to nearest intersection or end of turn lane, as appropriate. Where two storage lengths are
given, the first is the distance to the driveway, the second is the distance to the nearest intersection.
37
CONCLUSIONS AND RECOMMENDATIONS
The conclusions and recommendations of this study are as follows:
1. The subject site is well served by a high-quality multi-modal transportation system that includes: a corridor of arterial, collector, and local streets; a connected network of sidewalks; the Tenleytown-AU Metro station; multiple bus lines; and bicycle facilities.
2. The site is currently occupied with approximately 404,547 SF of office, 40,998 SF of retail, a 37,916 SF health club, and a conference center (which was originally a 2,070-seat cinema). Approximately 1,035 parking spaces are currently provided on site.
3. The proposed redevelopment will include approximately 716 residential units, a 60,200 SF grocery store, a 49,388 SF health club, and 22,598 SF of general retail space.
4. The proposed redevelopment will reduce the number of parking spaces on site from 1,035 spaces to approximately 900 spaces, a reduction of 13 percent.
5. Per ITE rates and equations, the site currently generates 539 AM peak hour vehicle trips and 609 PM peak hour vehicle trips. The proposed redevelopment is anticipated to generate 323 AM peak hour vehicle trips and 547 PM peak hour vehicle trips. Therefore, the redevelopment is expected reduce site traffic by 40 percent during the AM peak hour and 10 percent during the PM peak hour.
6. Two existing curb cuts on Upton Street will provide access to the approximately 900 parking spaces proposed with the project. The existing curb cut on Wisconsin Avenue would be closed in conjunction with the proposed redevelopment.
7. A third existing curb cut on Upton Street would be shifted to the west approximately 70 feet to accommodate front-in/front-out loading access to the site.
8. Minor adjustments to the signal timings at the Wisconsin Avenue/Van Ness Street and Wisconsin Avenue/Upton Street intersections are recommended to better accommodate the change in directionality of the vehicle trips generated by the proposed redevelopment.
O:\Projects\7001 - 7500\7116 4000 Wisconsin Avenue\Documentation\7116 CTR Report.docx
FIGURES
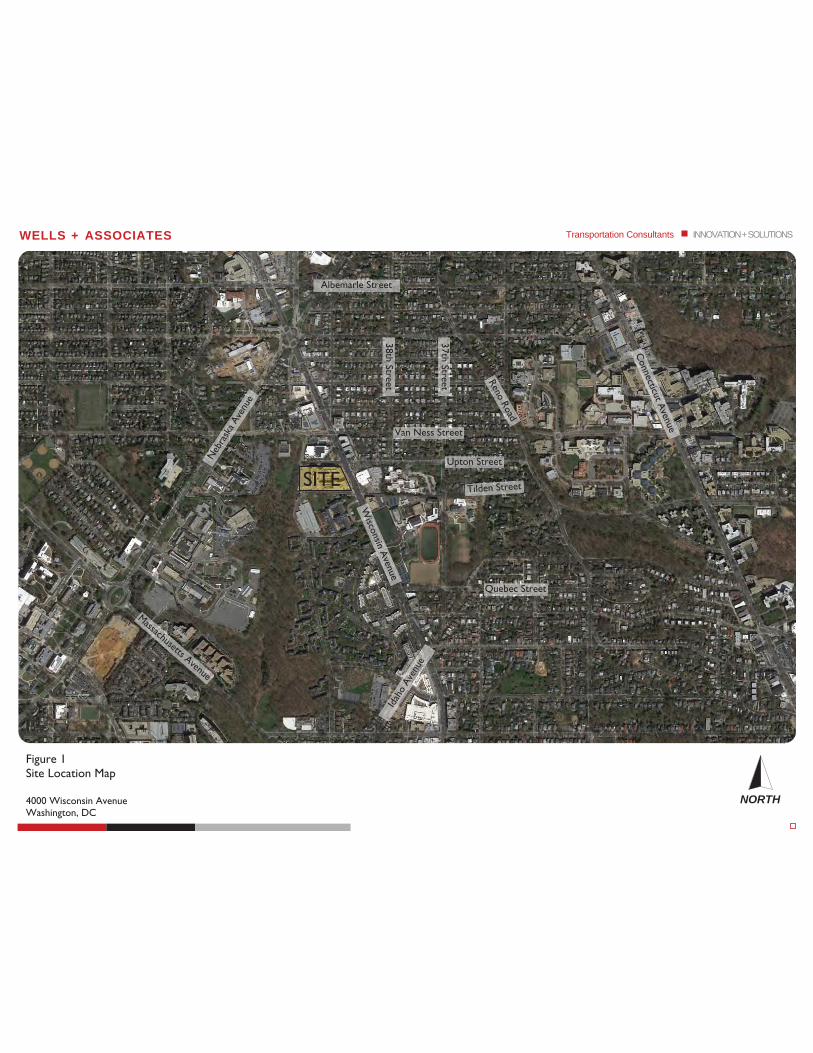
Figure 1 Site Location Map 4000 Wisconsin Avenue Washington, DC
WELLS + ASSOCIATES Transportation Consultants INNOVATION + SOLUTIONS
NORTH
Upton Street
Quebec Street
38th Street
37th Street
Van Ness Street
Albemarle Street
SITE
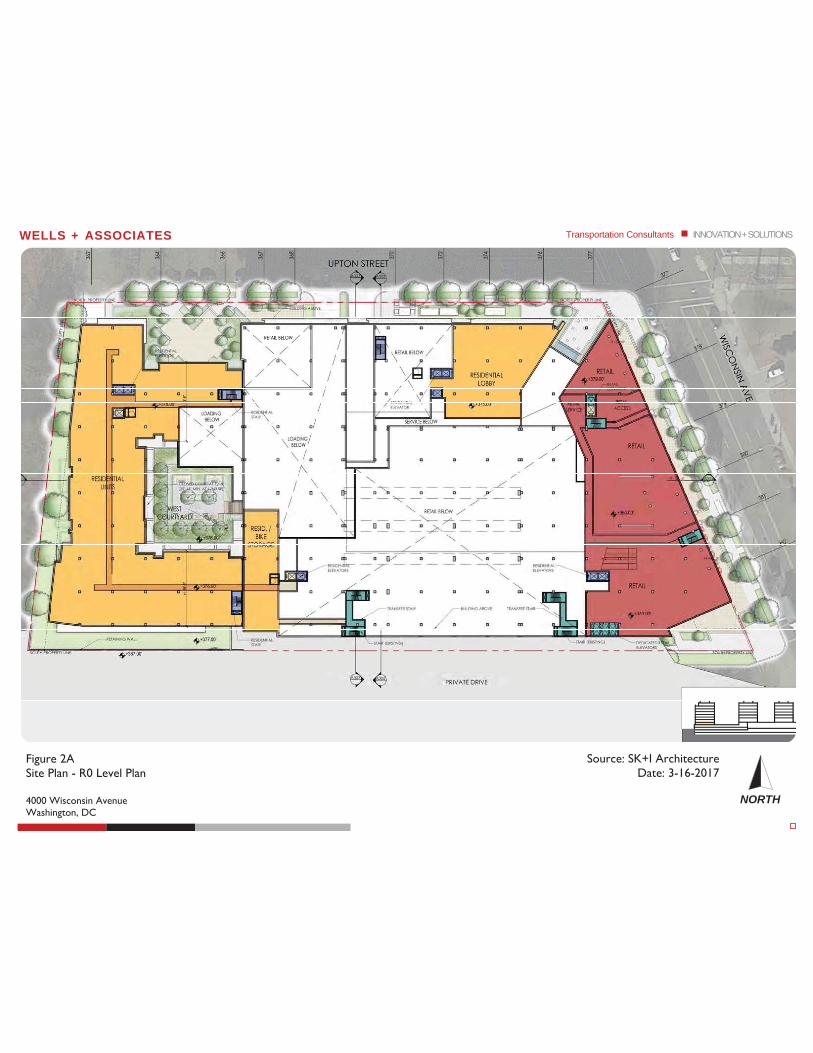
Figure 2A Site Plan - R0 Level Plan 4000 Wisconsin Avenue Washington, DC
Transportation Consultants INNOVATION + SOLUTIONS
NORTH
Source: SK+I Architecture Date: 3-16-2017
WELLS + ASSOCIATES
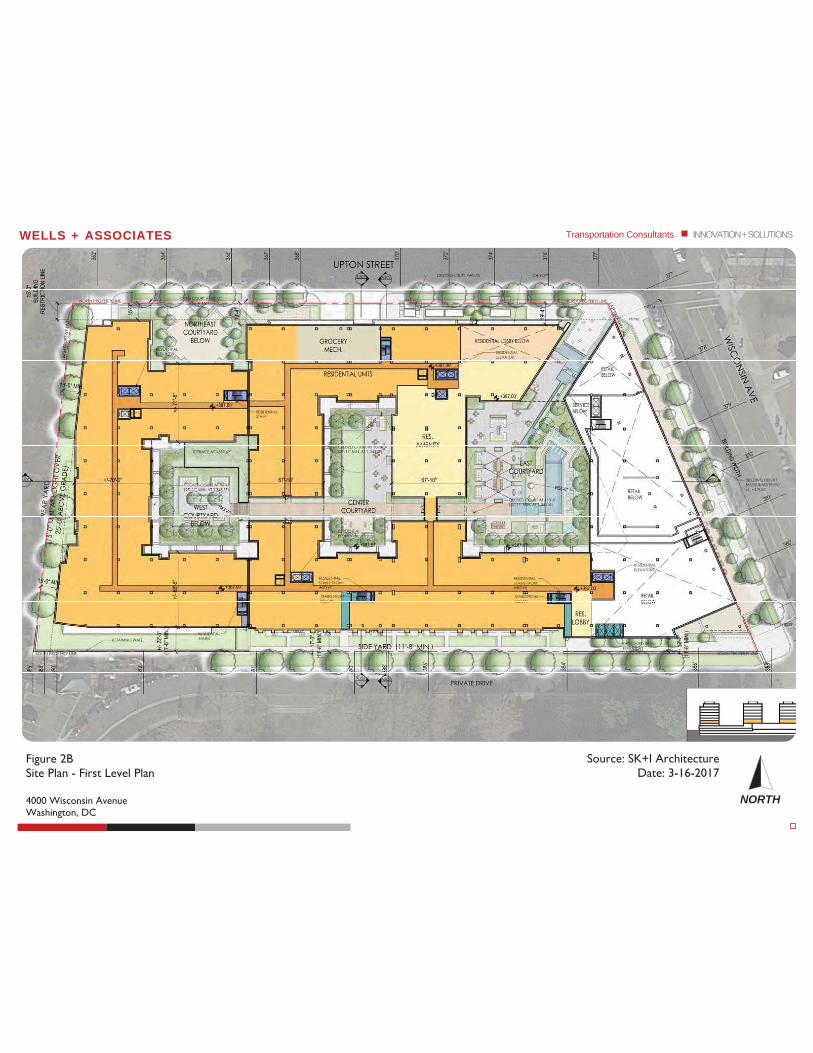
Figure 2B Site Plan - First Level Plan 4000 Wisconsin Avenue Washington, DC
WELLS + ASSOCIATES Transportation Consultants INNOVATION + SOLUTIONS
NORTH
Source: SK+I Architecture Date: 3-16-2017

30N 30S 31 33 96 H2H3
30N 30S 31 33 96 H3 H4
Upton Street
Warren Street
Windom Place
Quebec Street
Rodman Street
38th Street
39th Street
37th Street
Veazey Street
H2
H4
14
1
Van Ness Street
Figure 3 Multi-modal Transportation Options 4000 Wisconsin Avenue Washington, DC
WELLS + ASSOCIATES Transportation Consultants INNOVATION + SOLUTIONS
NORTH
SITE
43rd Street
# The number of cars at any given location change frequently. These numbers are accurate as of 2/72/17.
* In addition to the car sharing services shown, Car2Go has 500 cars in the District. Since Car2Go vehicles can be re-turned to any legal on-street parking space in the District or certain parking garages that are Car2Go approved, their locations could not be shown on this map.
M4 N2
M4 N2
37
37
Capital Bikeshare Locations (Number of Docks) #
# Zipcar Locations (Number of Zipcars) Bus Stops
Metrobus Route XX
MetroExtra Route XX
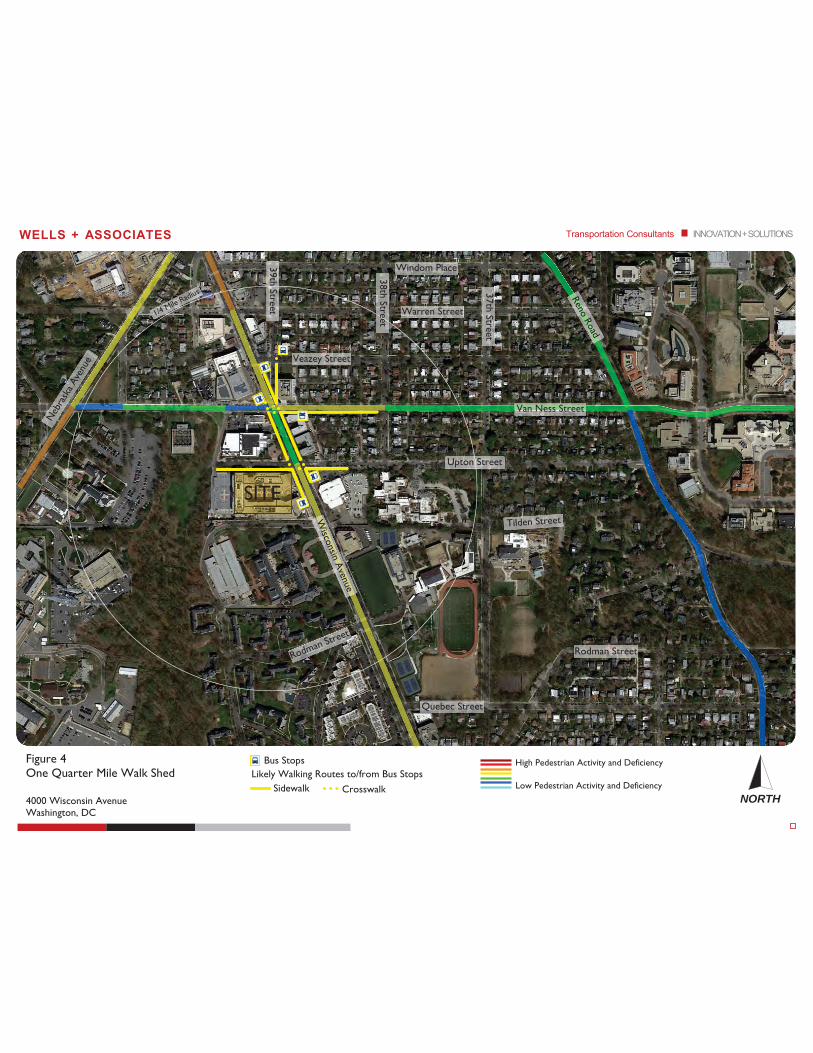
Bus Stops
Sidewalk Likely Walking Routes to/from Bus Stops
Crosswalk
High Pedestrian Activity and Deficiency
Low Pedestrian Activity and Deficiency
SITE
Upton Street
Warren Street
Windom Place
Quebec Street
Rodman Street
38th Street
39th Street
37th Street
Veazey Street
Van Ness Street
WELLS + ASSOCIATES Transportation Consultants INNOVATION + SOLUTIONS
NORTH
Figure 4 One Quarter Mile Walk Shed 4000 Wisconsin Avenue Washington, DC
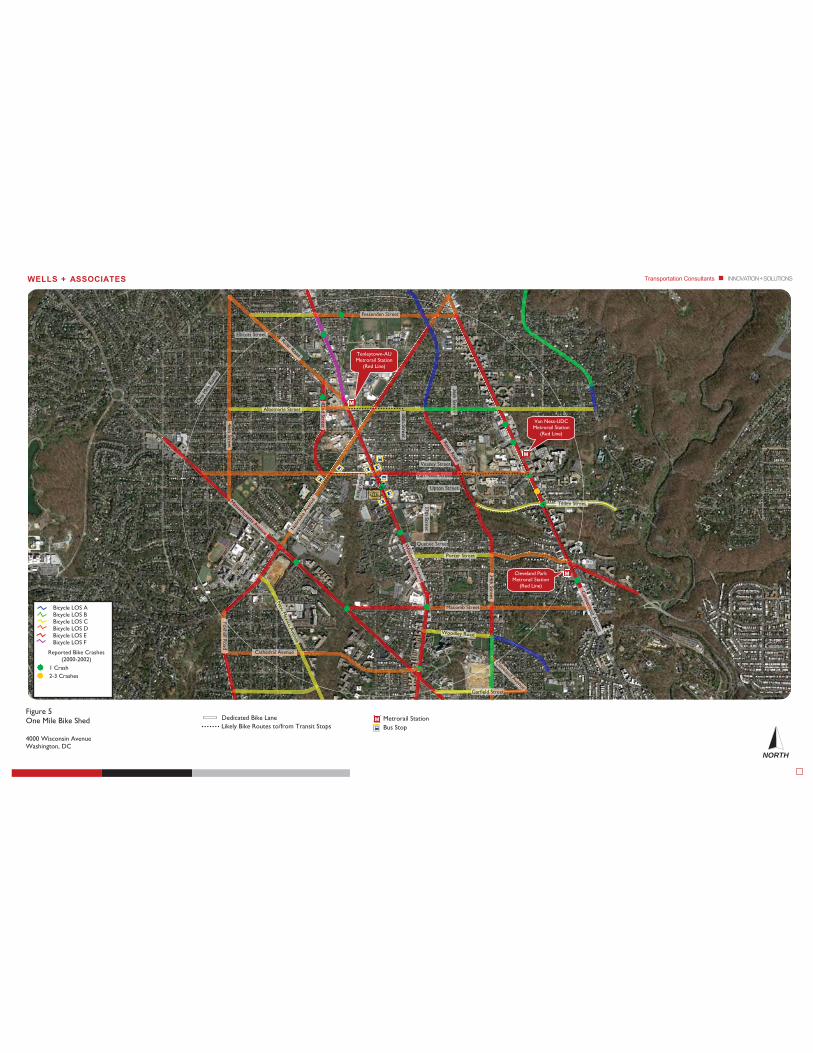
Quebec Street
37th Street
Veazey Street
Albemarle Street
Van Ness Street
36th Street
Porter Street
Macomb Street
34th Street
Cathedral Avenue
42nd Street
Fessenden Street
Ellicott Street
46th Street
Upton Street
38th Street
Tenleytown-AU Metrorail Station
(Red Line)
M
Van Ness-UDC Metrorail Station
(Red Line)
M
Cleveland Park Metrorail Station
(Red Line)
M
SITE SITE 22n
Van Ness Street
ee
Foxhall Road
Tilden Street
Dedicated Bike Lane Likely Bike Routes to/from Transit Stops Bus Stop
Metrorail Station M
Bicycle LOS A Bicycle LOS B Bicycle LOS C Bicycle LOS D Bicycle LOS E Bicycle LOS F
Reported Bike Crashes (2000-2002)
1 Crash 2-3 Crashes
Garfield Street
WELLS + ASSOCIATES Transportation Consultants INNOVATION + SOLUTIONS
Figure 5 One Mile Bike Shed 4000 Wisconsin Avenue Washington, DC
NORTH
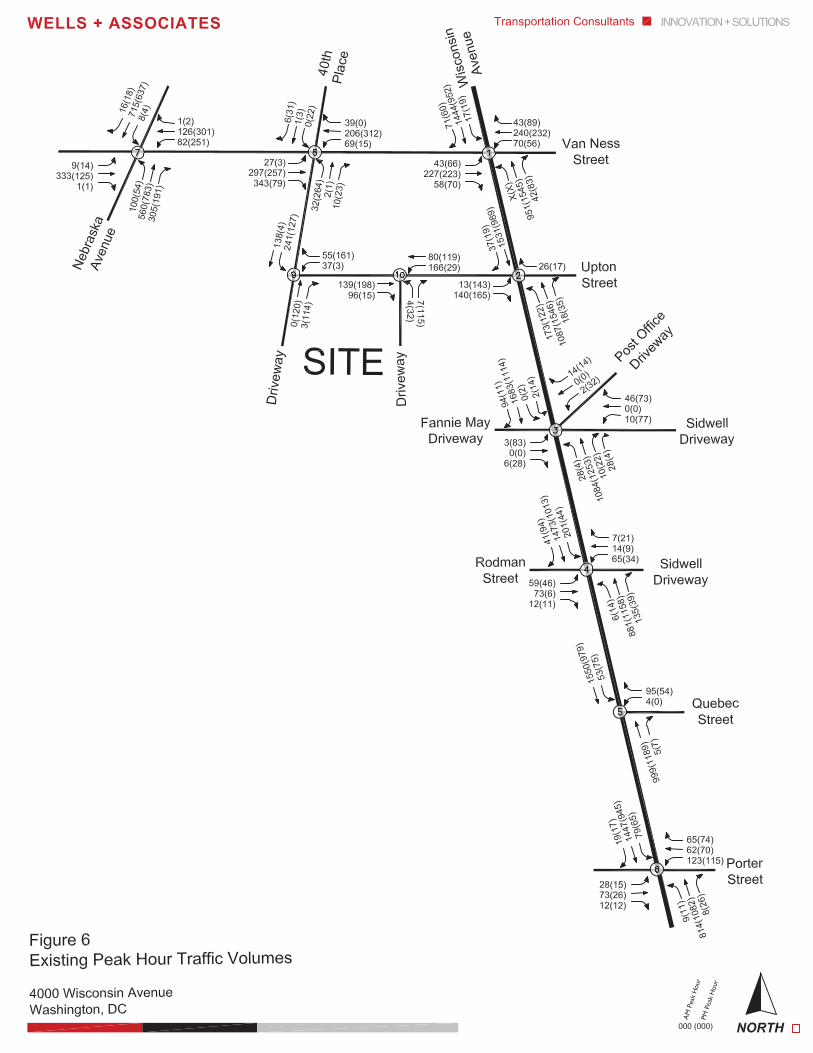

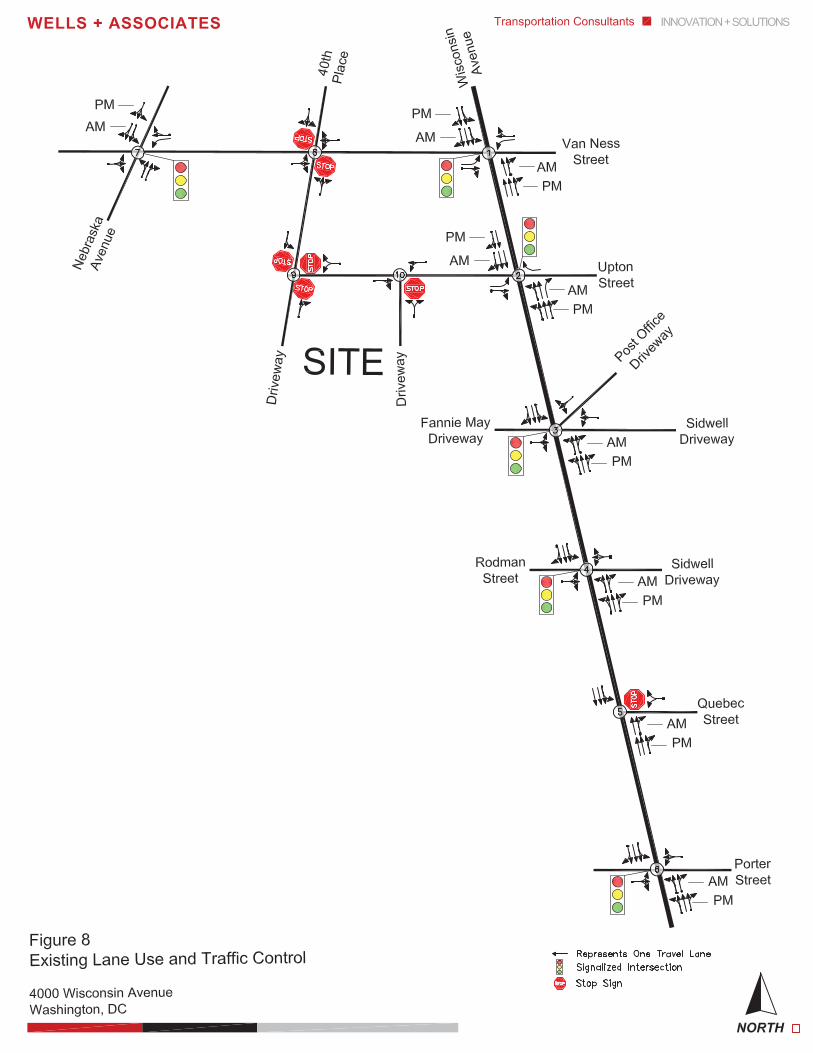

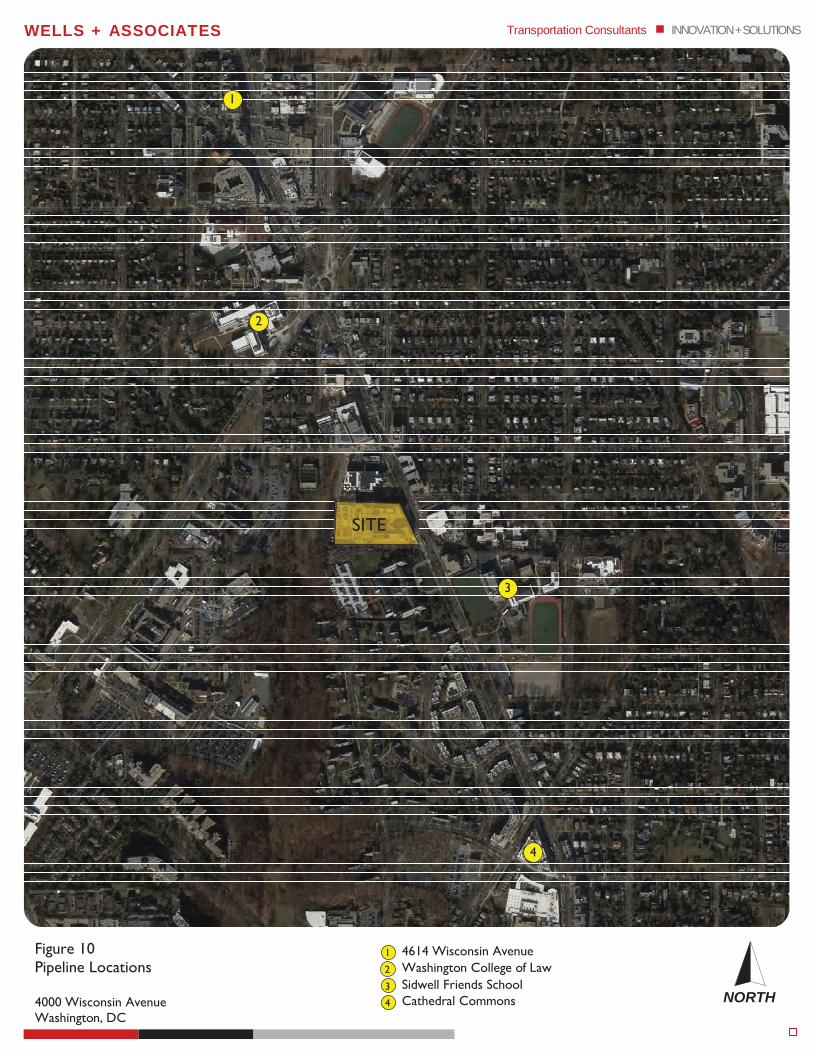
WELLS + ASSOCIATES Transportation Consultants INNOVATION + SOLUTIONS
NORTH
Figure 10 Pipeline Locations 4000 Wisconsin Avenue Washington, DC
1
SITE
2
3
4
4614 Wisconsin Avenue
4
Washington College of Law Sidwell Friends School Cathedral Commons
3
2
1


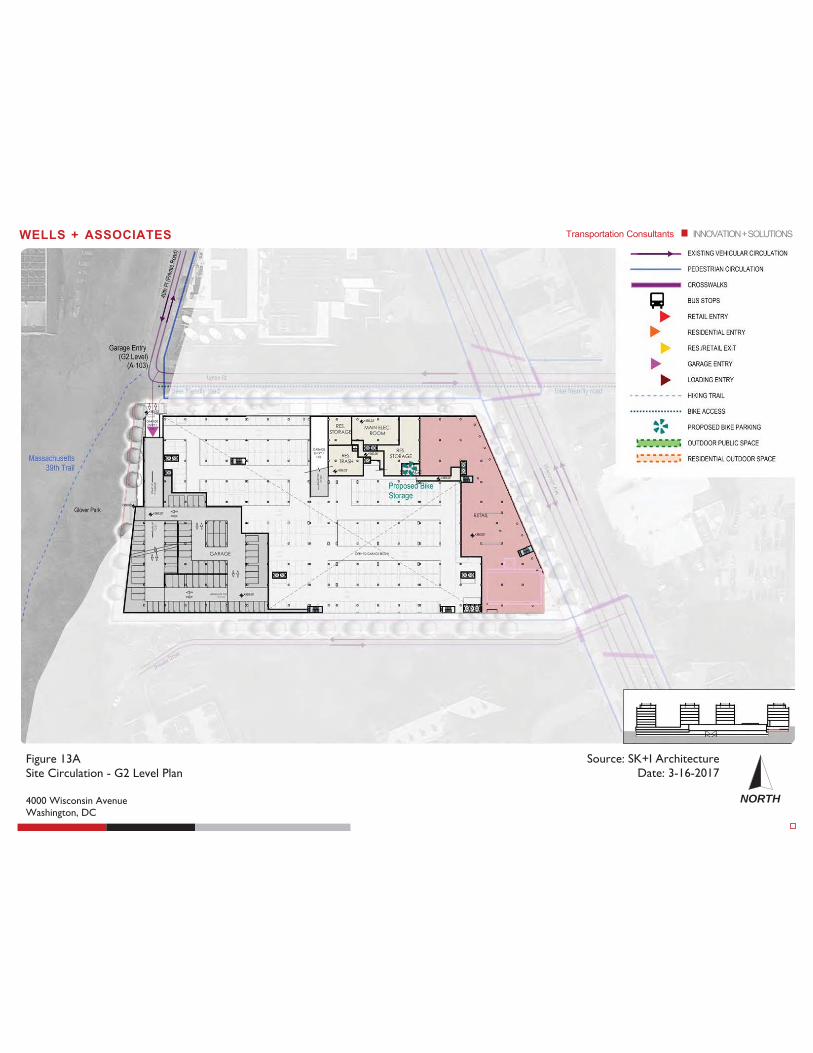
Figure 13A Site Circulation - G2 Level Plan 4000 Wisconsin Avenue Washington, DC
WELLS + ASSOCIATES Transportation Consultants INNOVATION + SOLUTIONS
NORTH
Source: SK+I Architecture Date: 3-16-2017
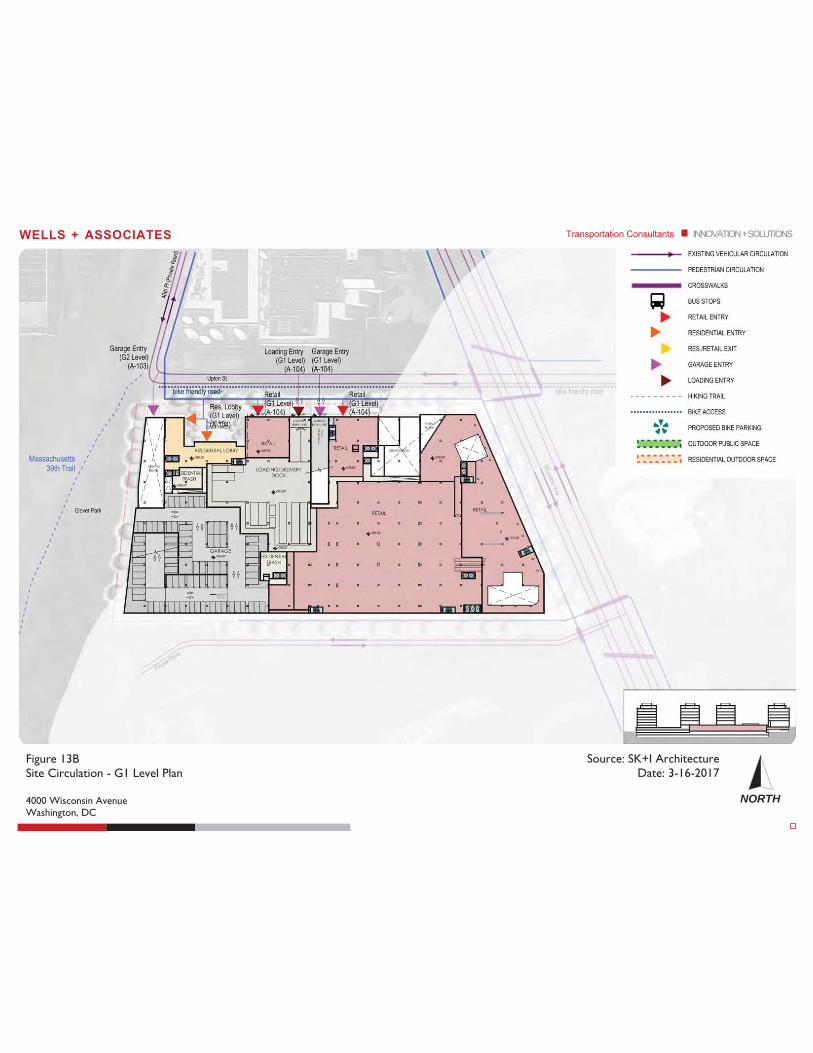
Figure 13B Site Circulation - G1 Level Plan 4000 Wisconsin Avenue Washington, DC
WELLS + ASSOCIATES Transportation Consultants INNOVATION + SOLUTIONS
NORTH
Source: SK+I Architecture Date: 3-16-2017
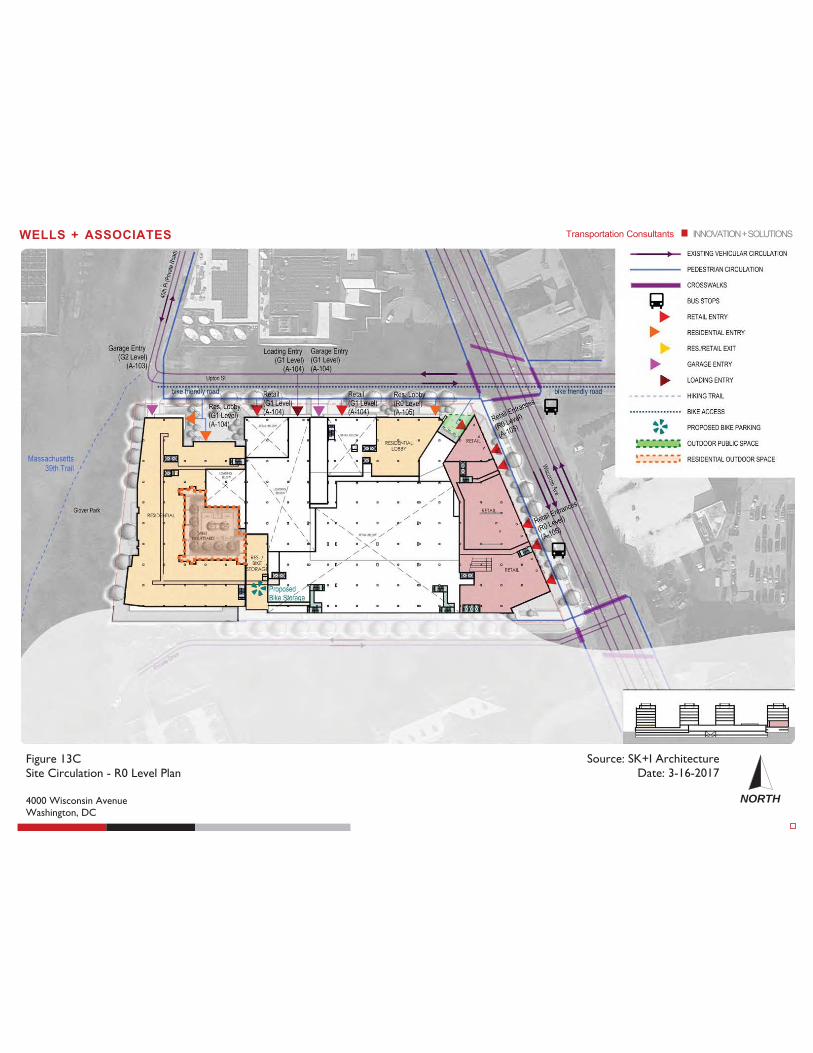
Figure 13C Site Circulation - R0 Level Plan 4000 Wisconsin Avenue Washington, DC
WELLS + ASSOCIATES Transportation Consultants INNOVATION + SOLUTIONS
NORTH
Source: SK+I Architecture Date: 3-16-2017
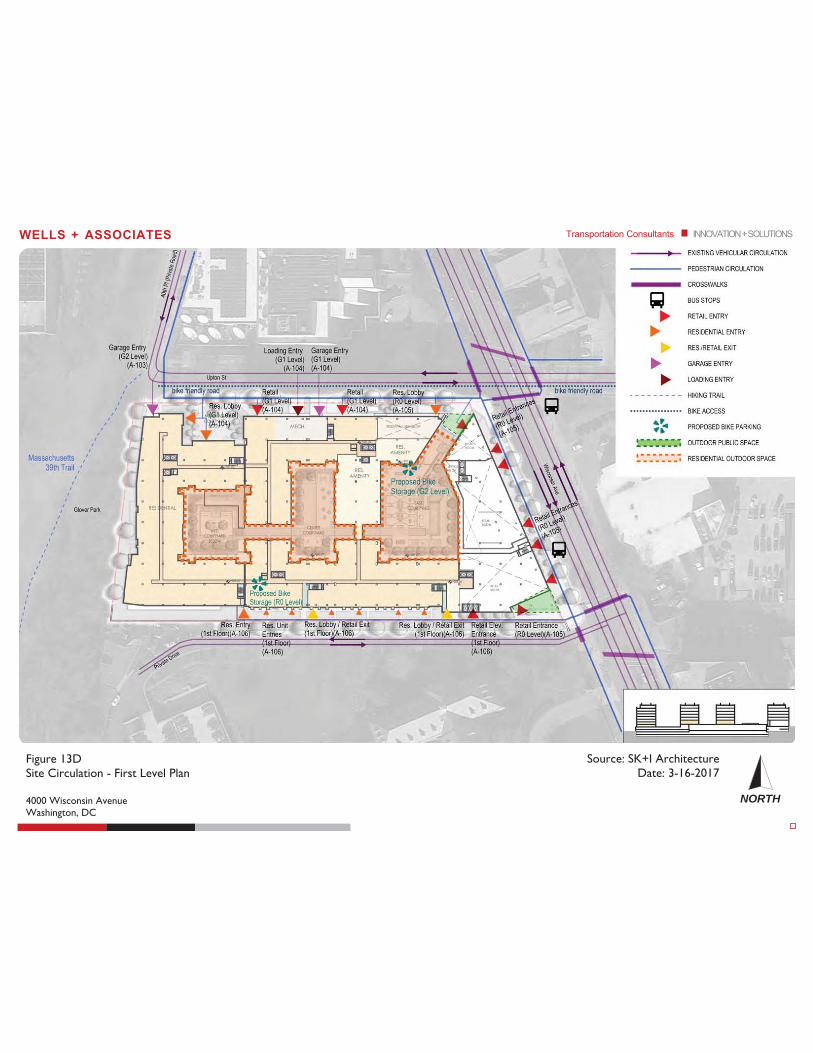
Figure 13D Site Circulation - First Level Plan 4000 Wisconsin Avenue Washington, DC
WELLS + ASSOCIATES Transportation Consultants INNOVATION + SOLUTIONS
NORTH
Source: SK+I Architecture Date: 3-16-2017