4 vaterite and its morphology - universiteit utrecht · pdf file4 vaterite and its morphology...
TRANSCRIPT

VATERITE AND IST MORPHOLOGY
41
4 Vaterite and its Morphology
4.1 Introduction
The existence of the CaCO3 polymorph vaterite (see 3.3.4) was first observed in
laboratory precipitation experiments conducted at high degrees of supersaturation,
under which conditions it spontaneously precipitates. Vaterite is not stable in
aqueous solution under Earth surface conditions, and transforms within a short
period of time into calcite or aragonite (depending on temperature) (Ogino et al.,
1987). This is one reason why vaterite is rare in the natural environment. Vaterite is
reported to be present in some biological systems, for example, in the static body of
mysid shrimp (Wittmann and Ariani, 1996), gallstones (Sutor and Wooley, 1968),
fresh water pearls (Ma and Lee, 2006), otoliths of some fish (Gauldie, 1996; Lenaz
and Miletic, 2000), and egg shells (Tullett et al., 1976). Furthermore, vaterite has
been reported to form naturally in some sediments, and during oilfield drilling
(Friedman and Schultz, 1995; Giralt et al., 2001; Lenaz and Miletic, 2000).
The fact that vaterite forms and persists in a number of natural systems seems
to contradict its thermodynamic instability. Therefore, some mechanism must prevent
vaterite from transforming. The observation that vaterite forms naturally raises the
question whether vaterite can serve as a precursor phase of aragonite and calcite in
natural systems, as observed in laboratory experiments. Many experiments have
been conducted on the precipitation of vaterite (Dickinson et al., 2002; Euvrard et al.,
2000; Kralj et al., 1990; Kralj et al., 1994), its transformation (Baitalow et al., 1998;
Bischoff, 1968; Kralj et al., 1997; Ogino et al., 1987; Rock and Gordon, 1976; Spanos
and Koutsoukos, 1998; Wolf et al., 2000), and the effects of inorganic solutes
Chapter 4 published as:Nehrke, G., Van Cappellen, P., and van der Weijden, C.H., 2006. Framboidal vaterite aggregates andtheir transformation into calcite: A morphological study. J. Cryst. Growth 287, 528 - 530.

CHAPTER 4
42
(Baitalow et al., 1998; Brečević et al., 1996; Katsifaras and Spanos, 1999; Noethig-
Laslo and Brecevic, 1998; Noethig-Laslo and Brecevic, 2000; Tsuno et al., 2001;
Tsuno et al., 2002; Wada et al., 1995), amino acids (Manoli et al., 2002), and
inorganic or organic substrates (Kanakis and Dala, 2000; Manoli et al., 1997).
Even though numerous experiments have been conducted on vaterite, few have
focused on the characteristics of the solid itself. A review of the literature on vaterite
and its transformation reveals that detailed descriptions of the morphology of vaterite
are rare. Table 4.1 presents a compilation of experimental studies in which vaterite
was synthesized and described. Even though the publications in this compilation are
from the time vaterite was unambiguously identified (1925) until recent (2001),
descriptions of the solid remain quite vague. Frequently, descriptions like “particles of
some spherical shape, with an average diameter of 10–40 µm” are the only
information given. In a few cases additional detail is given. Kralj et al. (1994)
described the surface as “irregular and rough”, while Vecht and Irelend (2000) and
Euvrard et al. (2000) mention that the spheres are possibly built up of smaller
spheres. This information is in so far of interest that an estimation of the surface area
would depend on a good knowledge of the surface morphology and the size of the
elementary particles. Plummer and Busenberg (1982), for example, gives a surface
area of 7.2 m2 g-1 for crystals having diameters in the range 4–6 µm. As shown later
these values are not internally consistent. In many of the published experiments, the
amount of material produced is too small to allow direct measurements of the specific
surface area, for instance, using the BET adsorption method. The only possible way
to an assessment of the specific surface are depends strongly on whether or not the
spherical vaterite particles consist of smaller crystals.

VATERITE AND IST MORPHOLOGY
43
Table 4.1: Information about vaterite crystals in selected publications, published from 1925 until 2001.
Ref. (Year)
Preparation method XRD size (µm) Remarks
a (1925)
method of Heide (1924) (not exactly described)
yes 10–15 first comparison with µ-CaCO3
b (1957)
20 ml 1 M Ca(NO3)2 + 0.1 M Na2CO3 and 1 M
Na2CO3 + 0.1 Ca(NO3)2
yes 5–20 relation observed between crystal size and ion
concentration in stock solution
c (1968)
50 ml NH4OH + 1 l CaCl2 solution through which
CO2 gas is bubbled
no ? identified by optical microscopy (spherulites)
d (1971)
no information no ? vaterite mentioned but no further information given
e (1982)
1 M CaCl2 + 2 M NH3 CO2 bubbling
no 4–6 surface area of 7.2 m2/g (method not mentioned)
f (1990)
no information yes 3.2–<5 no information
g (1994)
5 mM CaCl2 + 5 mM Na2CO3
sample dried at 105°C
yes 2.7–4.6 sonifier with microtip used during precipitation; surface described as “irregular” and rough; size of spheroids on
the photograph shown seem to be 6 µm, dried at 105°C
h (1999)
No information yes (≈5) size taken from picture, not mentioned in text
I (2000)
CO2 bubbled through 0.11 M CaCl2, when saturated (pH ≈ 2.5)
ammonia added
yes 2 - 5 spheroidal aggregates composed of small 50 nm to
100 nm particles
j (2000)
Electro-crystallization yes > 1–14 poorly described but photograph indicates spherical aggregates
k (2001)
natural vaterite yes 125–250 microbial biscuits containing vaterite fibers
l (2001)
5 mM CaCl2 (pH 10, (NaOH) + 5 mM Na2CO3
(pH 10, HCl)
yes ? washed with water, then dried at 100°C (1 h)
a) (Gibson et al., 1925), b) (Wray and Daniels, 1957), c) (Bischoff, 1968), d) (Albright, 1971), e) (Plummer and Busenberg, 1982), f) (Kralj et al., 1990), g) (Kralj et al., 1994), h) (Hobbs and Reardon, 1999), i) (Vecht and Ireland, 2000), j) (Euvrard et al., 2000), k) (Giralt et al., 2001), l) (Dickinson and Mcgrath, 2001)
CHAPTER 4
44
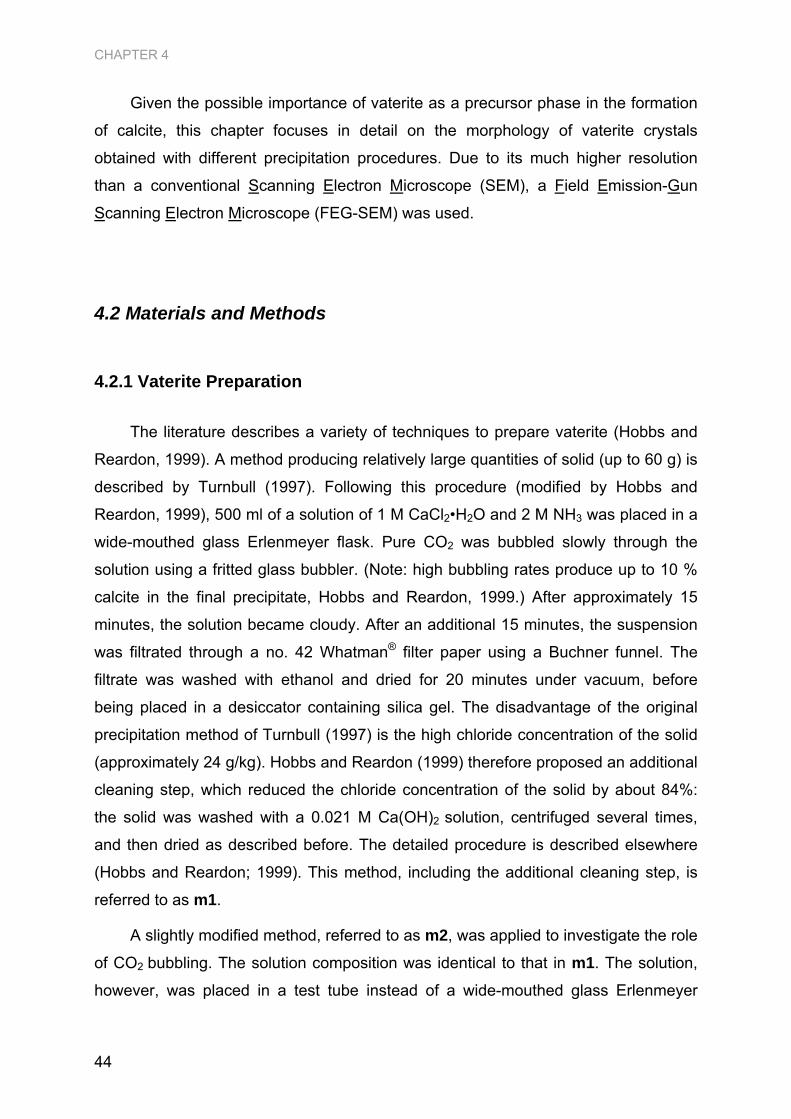
Given the possible importance of vaterite as a precursor phase in the formation
of calcite, this chapter focuses in detail on the morphology of vaterite crystals
obtained with different precipitation procedures. Due to its much higher resolution
than a conventional Scanning Electron Microscope (SEM), a Field Emission-Gun
Scanning Electron Microscope (FEG-SEM) was used.
4.2 Materials and Methods
4.2.1 Vaterite Preparation
The literature describes a variety of techniques to prepare vaterite (Hobbs and
Reardon, 1999). A method producing relatively large quantities of solid (up to 60 g) is
described by Turnbull (1997). Following this procedure (modified by Hobbs and
Reardon, 1999), 500 ml of a solution of 1 M CaCl2•H2O and 2 M NH3 was placed in a
wide-mouthed glass Erlenmeyer flask. Pure CO2 was bubbled slowly through the
solution using a fritted glass bubbler. (Note: high bubbling rates produce up to 10 %
calcite in the final precipitate, Hobbs and Reardon, 1999.) After approximately 15
minutes, the solution became cloudy. After an additional 15 minutes, the suspension
was filtrated through a no. 42 Whatman® filter paper using a Buchner funnel. The
filtrate was washed with ethanol and dried for 20 minutes under vacuum, before
being placed in a desiccator containing silica gel. The disadvantage of the original
precipitation method of Turnbull (1997) is the high chloride concentration of the solid
(approximately 24 g/kg). Hobbs and Reardon (1999) therefore proposed an additional
cleaning step, which reduced the chloride concentration of the solid by about 84%:
the solid was washed with a 0.021 M Ca(OH)2 solution, centrifuged several times,
and then dried as described before. The detailed procedure is described elsewhere
(Hobbs and Reardon; 1999). This method, including the additional cleaning step, is
referred to as m1.
A slightly modified method, referred to as m2, was applied to investigate the role
of CO2 bubbling. The solution composition was identical to that in m1. The solution,
however, was placed in a test tube instead of a wide-mouthed glass Erlenmeyer
VATERITE AND IST MORPHOLOGY
45
flask. CO2 was slowly bubbled into the solution via a glass tube, producing much
bigger bubbles than the fritted glass bubbler. The solid was dried and stored as
described in m1, but without applying the washing procedure. The amount of solid
produced with m2 was about 1 g. A third method, referred to as m3, was used based
on an experimental procedure described by Wray and Daniels (1957). A 1 M CaCl2
solution was added to a 0.1 M Na2CO3 solution (proportion 50 : 50). The precipitate
was dried and stored as described for m1. All chemicals were of pro analysis quality
(Merck®), and double distilled water was used for the preparation of all solutions.
In this study fourteen different solids (S1–S14) were produced (Table 4.2),
according to methods m1, m2 and m3. Two drying methods where used: either the
freshly precipitated vaterite was dried in an oven (between 60°C and 105°C), or it
was washed witheethanol and dried under vacuum. The drying methods for the
different solid are listed in Table 4.2.
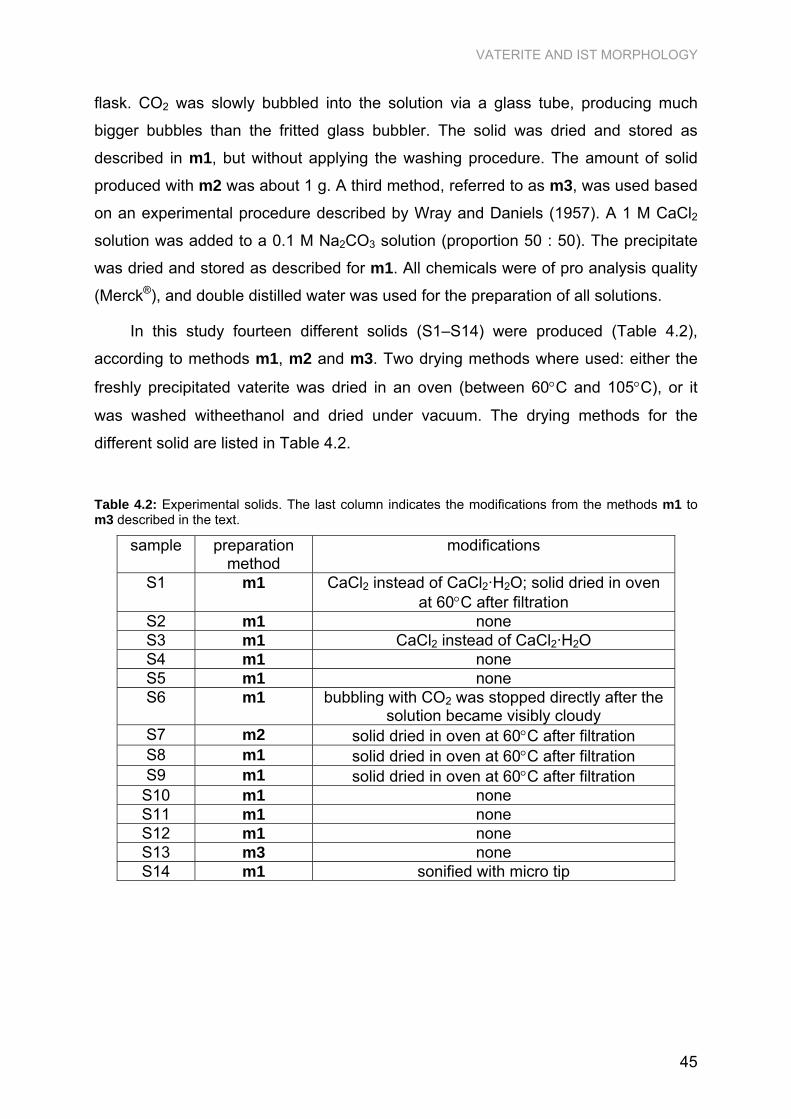
Table 4.2: Experimental solids. The last column indicates the modifications from the methods m1 to m3 described in the text.
sample preparation method
modifications
S1 m1 CaCl2 instead of CaCl2·H2O; solid dried in oven at 60°C after filtration
S2 m1 none S3 m1 CaCl2 instead of CaCl2·H2O S4 m1 none S5 m1 none S6 m1 bubbling with CO2 was stopped directly after the
solution became visibly cloudy S7 m2 solid dried in oven at 60°C after filtration S8 m1 solid dried in oven at 60°C after filtration S9 m1 solid dried in oven at 60°C after filtration
S10 m1 none S11 m1 none S12 m1 none S13 m3 none S14 m1 sonified with micro tip

CHAPTER 4
46
4.2.2 Characterization of Solids
The solids were characterized by means of powder X-ray diffractometry (XRD),
on a Philips PW 1700. The samples were measured at 40 kV and 30 mA using Cu-
Kα radiation at a scanning speed of 0.02° 2θ s-1 and a time constant of 1 s. The
abundance of the two polymorphs vaterite and calcite was calculated from the areas
of the main diffraction peaks (Figure 4.1) of vaterite (at 27.0° 2θ) and calcite (at 29.4°
2θ), using the computer program Xfit (Cheary and Coelho, 1996).
The calibration was performed by means of five standards (pure vaterite, pure
calcite, and mixtures of vaterite and calcite in 2:3, 1:1 and 3:2 mass ratios). The pure
vaterite sample was prepared as described in section 4.2.1. Pure calcite was
prepared by adding vaterite to a solution of bi-distilled water. XRD confirmed that
after > 24 hours all vaterite was transformed into calcite.
Figure 4.1: XRD patterns of pure vaterite, with a peak at 27.0° 2θ, and pure calcite obtained after complete transformation of vaterite. (The number of total counts for the diffractograms differs as can be seen from the higher background of the vaterite-scan.)

VATERITE AND IST MORPHOLOGY
47
The morphology of the solids was characterized by means of a High Resolution
Scanning Electron Microscope equipped with a Field Emission Gun filament (SFEG-
SEM, XL30 Philips/FEI®). Samples were fixed with double sided carbon tape on
aluminum stubs and coated with 6 nm Platinum/Palladium using a Cressington®
208HR sputter coater combined with a Cressinton® mtm20 thickness controller. The
“through the lens detector” (TLD) was used when operating in high–resolution mode.
The particle sizes of the different solids were determined by means of the image
analysis computer program analySIS® (Soft Imaging Systems). Since the same
software was used to record the picture, the instrument settings of the SEM
apparatus were stored within the picture and used for size calibration. Therewith it
was possible to define a line across the selected sphere and to measure its exact
size. The pictures used for this work were all taken at the same magnification, to
ensure comparable results. A rectangle of 10 by 10 particles was defined on the SEM
picture of the appropriate solid. Afterwards all 100 particles within this area where
measured. The choice of the exact position of the measuring line drawn on the
particles is up to the operator performing this task. However, a test wherein six
different people analyzed the same picture showed that the results differed by less
than 5%.
4.3 Results and Discussion
Fourteen solids (S1–S14) were individually prepared (see Table 4.2) over a time
span of two years. Samples of the freshly prepared solids were characterized directly
after drying by means of XRD and SFEG-SEM. After two years, all solids were
reexamined by XRD and SFEG-SEM.
4.3.1 XRD Characterization
As described in Section 4.2.2, a set of standards was prepared for calibration of
the XRD measurements. The calibration curve is presented in Figure 4.2. The
CHAPTER 4
48
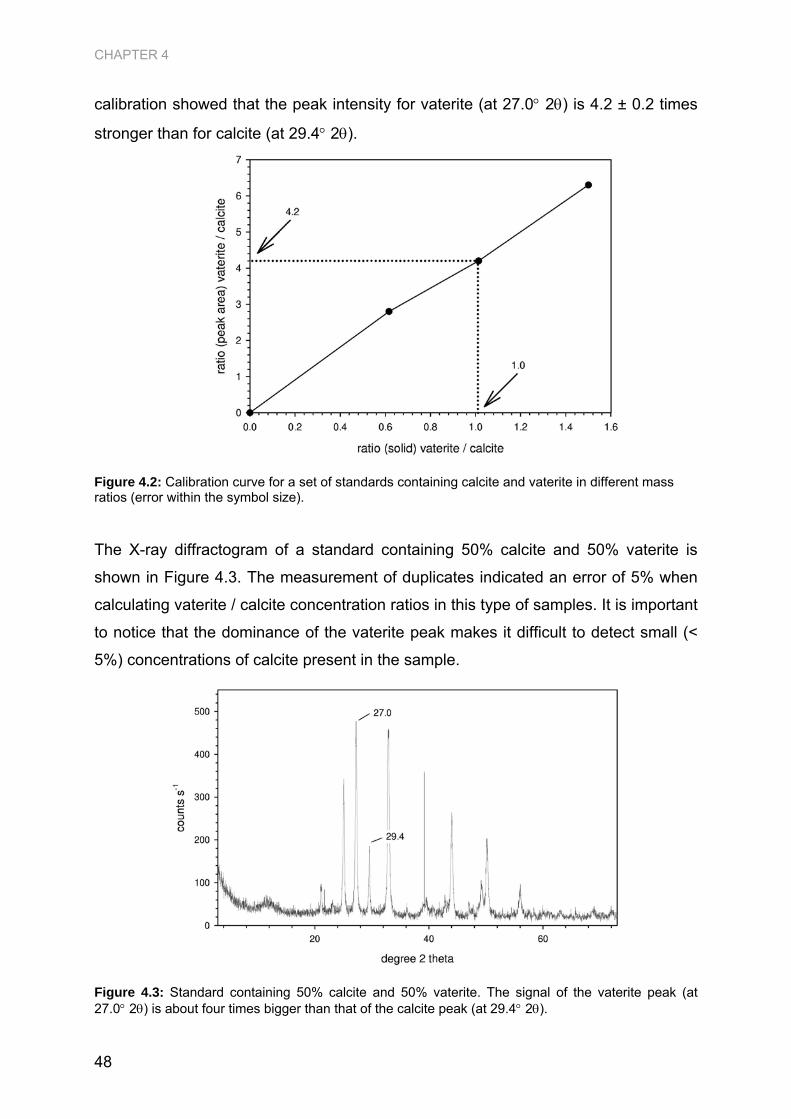
calibration showed that the peak intensity for vaterite (at 27.0° 2θ) is 4.2 ± 0.2 times
stronger than for calcite (at 29.4° 2θ).
Figure 4.2: Calibration curve for a set of standards containing calcite and vaterite in different mass ratios (error within the symbol size).
The X-ray diffractogram of a standard containing 50% calcite and 50% vaterite is
shown in Figure 4.3. The measurement of duplicates indicated an error of 5% when
calculating vaterite / calcite concentration ratios in this type of samples. It is important
to notice that the dominance of the vaterite peak makes it difficult to detect small (<
5%) concentrations of calcite present in the sample.
Figure 4.3: Standard containing 50% calcite and 50% vaterite. The signal of the vaterite peak (at 27.0° 2θ) is about four times bigger than that of the calcite peak (at 29.4° 2θ).

VATERITE AND IST MORPHOLOGY
49
The percentages calcite in the 14 solids (S1–S14) are presented in Table 4.3.
As already mentioned, all samples were analyzed directly after precipitation and at
the end of the two year experimental period. A lowercase e is added to the sample
label to identify the 2–year old samples. In all samples the non–calcite phase was
vaterite. No other phases were detected by means of XRD. The XRD pattern of
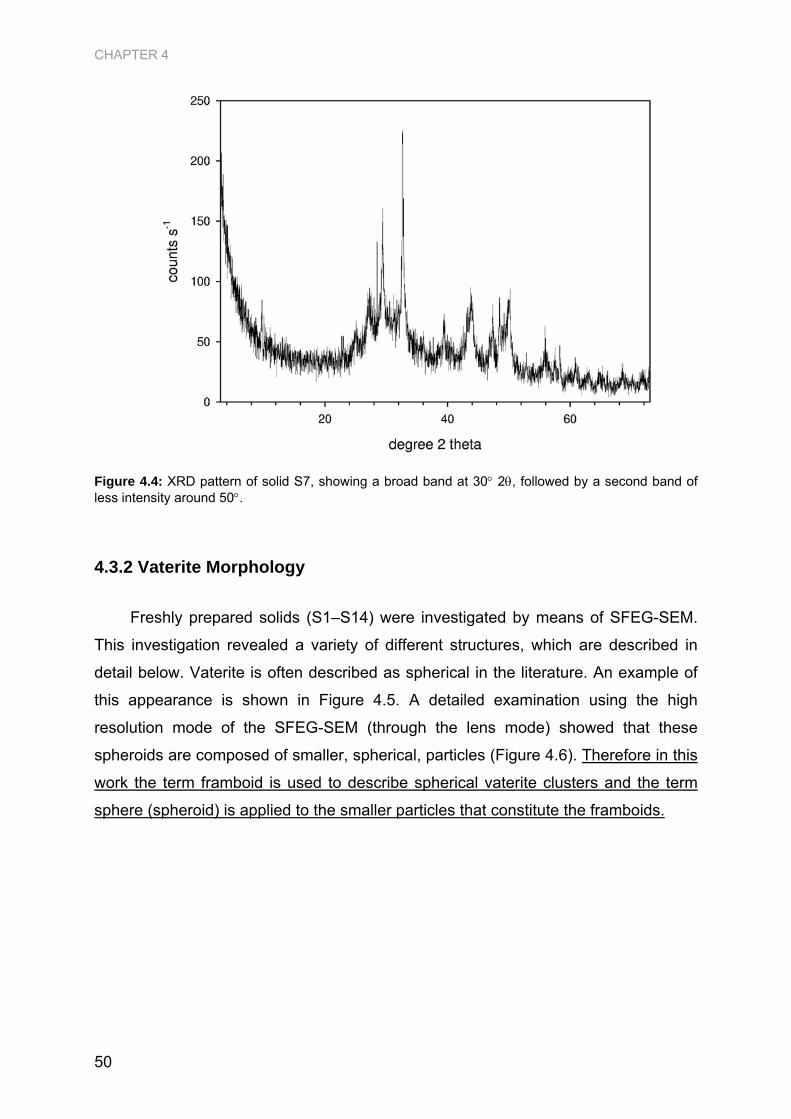
sample S7 (Figure 4.4) deviated from the other diffractograms. This sample still
contained a significant amount of water, as seen from the broad band around
2θ=30°. This band, with a second band of less intensity towards 50°, is typical for the
presence of water (van der Gaans, 2003). This was not observed in any of the other
samples. Therefore it can be assumed that the other samples were properly dried
before storage.
Table 4.3: Amount of calcite (measured by means of XRD) in the solids directly upon precipitation after being dried (SX) and after storage in a desiccator for two years (SXe).
sample % calcite sample % calcite
S1 S1e 84.63 S2 5.56 S2e ---* S3 4.01 S3e 40.64 S4 10.88 S4e 98.47 S5 24.43 S5e 27.21 S6 37.16 S6e 49.69
S7 unusable XRD-
pattern** S7e 99.92 S8 11.31 S8e 7.77 S9 5 S9e 6.99 S10 36.34 S10e 99.96 S11 31.65 S11e 99.99 S12 1.16 S12e 10.92 S13 99.7 S13e 99.46 S14 1.1 S14e 1.21
* solid used up before the end of the two year period ** probably contained too much water when measured (Figure 4.4)
CHAPTER 4
50
Figure 4.4: XRD pattern of solid S7, showing a broad band at 30° 2θ, followed by a second band of less intensity around 50°.
4.3.2 Vaterite Morphology
Freshly prepared solids (S1–S14) were investigated by means of SFEG-SEM.
This investigation revealed a variety of different structures, which are described in
detail below. Vaterite is often described as spherical in the literature. An example of
this appearance is shown in Figure 4.5. A detailed examination using the high
resolution mode of the SFEG-SEM (through the lens mode) showed that these
spheroids are composed of smaller, spherical, particles (Figure 4.6). Therefore in this
work the term framboid is used to describe spherical vaterite clusters and the term
sphere (spheroid) is applied to the smaller particles that constitute the framboids.

VATERITE AND IST MORPHOLOGY
51
Figure 4.5: SEM picture of solid S9 with typical vaterite aggregates (framboids).
Figure 4.6: Magnification of a particle seen in Figure 4.5 (largest particle in the upper left corner) showing that the framboid is built up by smaller particles (spheres).
The vaterite morphology of the different solids varies significantly. Figure 4.7
and Figure 4.8 show examples of two other possible vaterite aggregate
morphologies. In both samples vaterite spheres build bigger clusters of more

CHAPTER 4
52
irregular, sponge like shapes. The term “irregular aggregate” will be used to
distinguish the irregular shaped morphologies from the previously described spherical
ones, named framboids.
Figure 4.7: Irregular aggregates of vaterite in sample S5.
Figure 4.8: Irregular aggregates vaterite in sample S12.

VATERITE AND IST MORPHOLOGY
53
Two types of how the particles are packed can be distinguished on framboidal
structures. The first type is characterized by very densely packed spherical particles,
resulting in little pore space and a smooth surface of the framboid. An aggregation of
this type is shown in Figure 4.9. A second type is characterized by a more open
structure with larger pore spaces between the spheres (Figure 4.10).
Figure 4.9: Surface of a densely packed framboid in sample S3.
Figure 4.10: Surface of a more loosely-packed vaterite framboid in sample S12.
CHAPTER 4
54
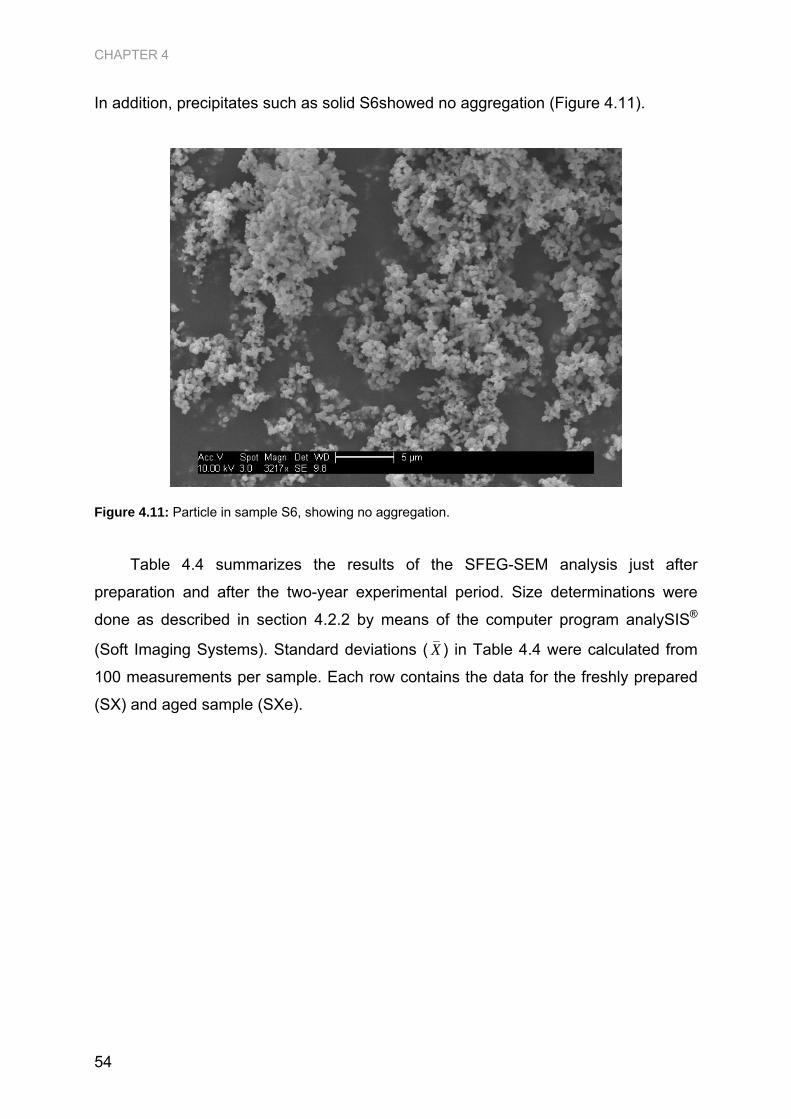
In addition, precipitates such as solid S6showed no aggregation (Figure 4.11).
Figure 4.11: Particle in sample S6, showing no aggregation.
Table 4.4 summarizes the results of the SFEG-SEM analysis just after
preparation and after the two-year experimental period. Size determinations were
done as described in section 4.2.2 by means of the computer program analySIS®
(Soft Imaging Systems). Standard deviations ( X ) in Table 4.4 were calculated from
100 measurements per sample. Each row contains the data for the freshly prepared
(SX) and aged sample (SXe).

VATERITE AND IST MORPHOLOGY
55
Table 4.4: Morphology and size of the precipitated solids (investigated by means on SFEG-SEM) upon precipitation (SX) and after storage in a desiccator for two years (SXe). Abbreviation n.d. denotes “not determined” and n.p. “not present” in the sample.
solid spheres
framboids
cubes
size distribution
spheres (nm)
size average
( X ) spheres
(nm)
size distribution framboids (cubes)
(µm)
size average
( X ) framboids (cubes)
(µm) S1
S1e yes yes
yes yes
no no
n.d. 75–300
--- 150 ± 37
n.d. 2.4–5.4
--- 3.9 ± 1.1
S2 S2e
n.d. yes
n.d. yes
n.d. no
n.d. 38–121
--- 67 ± 13
--- ---
--- ---
S3 S3e
n.d. yes
n.d. yes
n.d. no
n.d. 37–84
--- 63 ± 10
n.d. ----
--- ---
S4 S4e
n.d. no
n.d. no
n.d. yes
n.d. n.p.
--- ---
n.d. ≈15 50
--- n.d.
S5 S5e
n.d. yes
n.d. yes
n.d. no
n.d. 65–207
--- 111 ± 20
n.d. 2.3–6.5
--- 3.9 ± 1.3
S6 S6e
yes yes
no no
no no
108–496 32–139
262 ± 66 64 ± 17
n.p. n.p.
--- ---
S7 S7e
yes no
no no
no yes
124–540 n.d.
283 ± 112 ---
n.p. 62–300
--- 132 ± 40
S8
S8e
yes
yes
yes
no
no
no
56–178
51–156
115 ± 26
92 ± 18
(1.3) not real framb.
n.p.
n.d.
--- S9
S9e yes yes
yes yes
no no
74–300 74–300
150 ± 37 150 ± 37
3.5–6.5 3.5–6.5
5 5
S10 S10e
n.d. no
n.d. no
n.d. yes
n.d. n.d.
--- ---
n.d. 1.6–10
---- 4.8 ± 1.7
S11 S11e
n.d. no
n.d. no
n.d. yes
n.d. n.p.
--- ---
n.d. 5–90
--- 10 ± 2.5
S12 S12e
n.d. yes
n.d. yes
n.d. no
n.d. 44–137
--- 75 ± 16
n.d. 0.6–5.2
--- 2.2 ± 1
S13 S13e
yes yes
no no
no no
22–245 26–245
75 ± 43 82 ± 44
10 - 20 0.25 - 2.5
n.d. n.d.
S14 S14e
yes yes
yes yes
no no
20–60 20–60
38 ± 9 36 ± 8
0.7–4 1–4
2.2 ± 0.8 2.6 ± 0.8
When calcite was present in the samples, cubic crystals could be observed in
between the framboids. For samples of pure calcite, framboids and spheres were no
longer observed (Figure 4.12). The exception was solid S13. XRD analysis showed
that this solid consisted of 100 % calcite (Table 4.3), yet mainly spherical particles
were observed by means of SFEG-SEM (Figure 4.13). Two additional, otherwise very
rarely occurring, morphologies were found in this sample: needle-like structures
(Figure 4.13), as well as bigger spherical aggregates with diameters on the order of

CHAPTER 4
56
10 µm (Figure 4.14). These bigger spheres were different from the previously
described framboids, in that they were not built up of smaller spheres. Rather, these
spheres were more massive, with plate-like sub-crystals.
Figure 4.12: SEM photograph of sample S7e. This sample consists of 100% calcite and no framboids/spheres are present.
VATERITE AND IST MORPHOLOGY
57
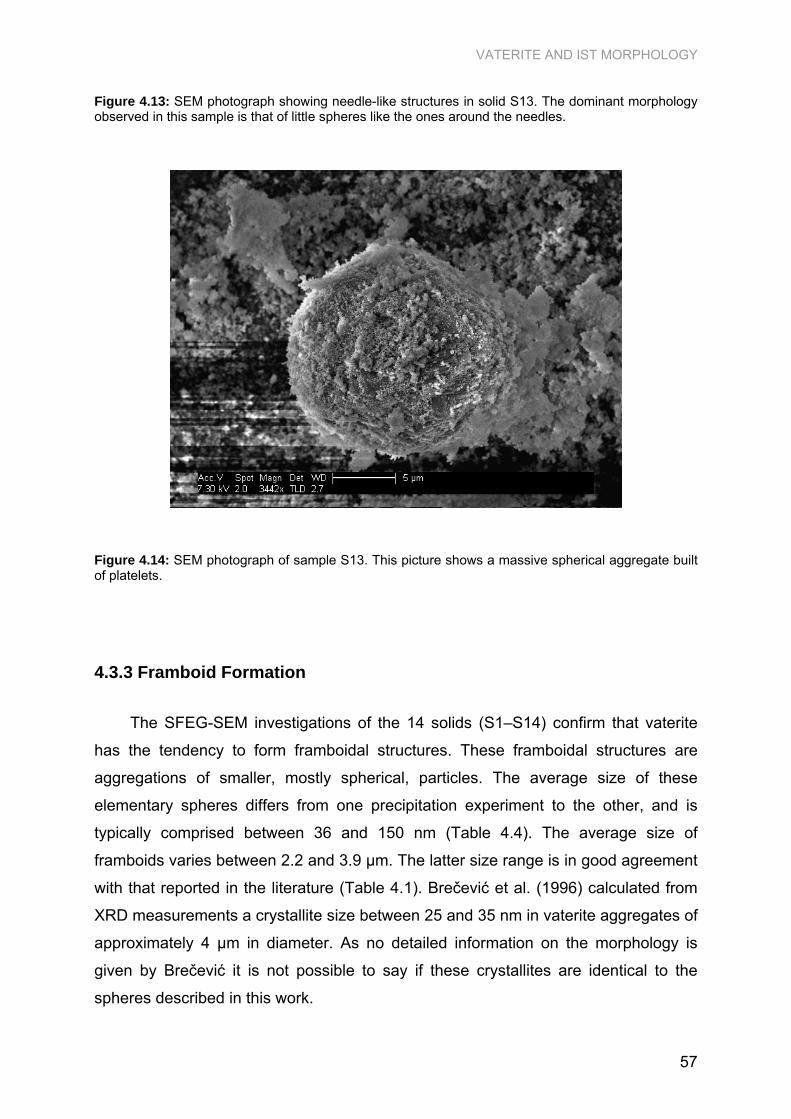
Figure 4.13: SEM photograph showing needle-like structures in solid S13. The dominant morphology observed in this sample is that of little spheres like the ones around the needles.
Figure 4.14: SEM photograph of sample S13. This picture shows a massive spherical aggregate built of platelets.
4.3.3 Framboid Formation
The SFEG-SEM investigations of the 14 solids (S1–S14) confirm that vaterite
has the tendency to form framboidal structures. These framboidal structures are
aggregations of smaller, mostly spherical, particles. The average size of these
elementary spheres differs from one precipitation experiment to the other, and is
typically comprised between 36 and 150 nm (Table 4.4). The average size of
framboids varies between 2.2 and 3.9 µm. The latter size range is in good agreement
with that reported in the literature (Table 4.1). Brečević et al. (1996) calculated from
XRD measurements a crystallite size between 25 and 35 nm in vaterite aggregates of
approximately 4 µm in diameter. As no detailed information on the morphology is
given by Brečević it is not possible to say if these crystallites are identical to the
spheres described in this work.

CHAPTER 4
58
The observations raise the question why and when the observed framboidal
structures form. The first part of this question, why do framboidal structures form, is
difficult to answer. Little is known about the mechanisms leading to the formation of
framboidal structures. Framboid formation is also known for other mineral systems.
For example, Butler and Rickard (2000) describe framboidal pyrite formation, and
Wolthers (2003) discusses framboidal pyrite structures (Figure 4.15).
Figure 4.15: Pyrite framboids (from Wolthers, 2003)).
Butler and Rickard (2000) proposes a mechanism where nucleation of new
crystals occurs on the surface of the framboids, in systems with high degrees of
supersaturation (S). However, even if pyrite framboids show remarkable similarities
with the structures observed for vaterite, the data presented here suggest a different
mechanism of formation.
We propose the mechanism illustrated in Figure 4.16, where the first CaCO3
nuclei form at the interface between the solution and a CO2 gas bubble (A). At the
interface, OH- diffusing from the solution reacts with CO2 to form HCO3- ions. The
latter then combine with Ca++ ions to form CaCO3. The overall reaction can be written
as Ca2+(aq) + CO2 (g) + 2 OH-
(aq) CaCO3(s) + H2O(l). A fast growth of the spherical
crystals will lead to a depletion of the solution around the crystallites and the
crystallites will stop to grow. The formation of spherical structures is typical for
transport-controlled reactions (Lasaga, 1998). If the reaction is halted at this early
stage, then only individual spheres are formed. This is consistent with the
observations on solid S6 (Figure 4.11). Experiment S6 was terminated as soon as
VATERITE AND IST MORPHOLOGY
59
the solution became cloudy and, indeed, no framboidal aggregates formed (the
typical small spheres are present, however).
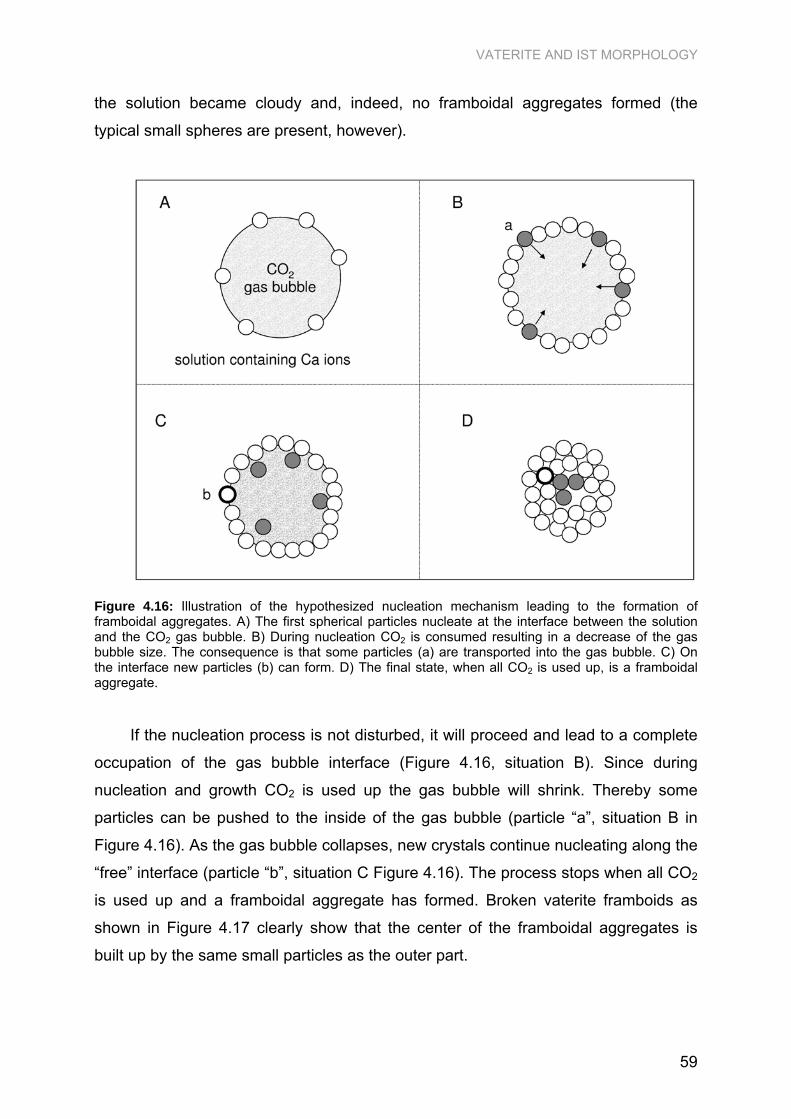
Figure 4.16: Illustration of the hypothesized nucleation mechanism leading to the formation of framboidal aggregates. A) The first spherical particles nucleate at the interface between the solution and the CO2 gas bubble. B) During nucleation CO2 is consumed resulting in a decrease of the gas bubble size. The consequence is that some particles (a) are transported into the gas bubble. C) On the interface new particles (b) can form. D) The final state, when all CO2 is used up, is a framboidal aggregate.
If the nucleation process is not disturbed, it will proceed and lead to a complete
occupation of the gas bubble interface (Figure 4.16, situation B). Since during
nucleation and growth CO2 is used up the gas bubble will shrink. Thereby some
particles can be pushed to the inside of the gas bubble (particle “a”, situation B in
Figure 4.16). As the gas bubble collapses, new crystals continue nucleating along the
“free” interface (particle “b”, situation C Figure 4.16). The process stops when all CO2
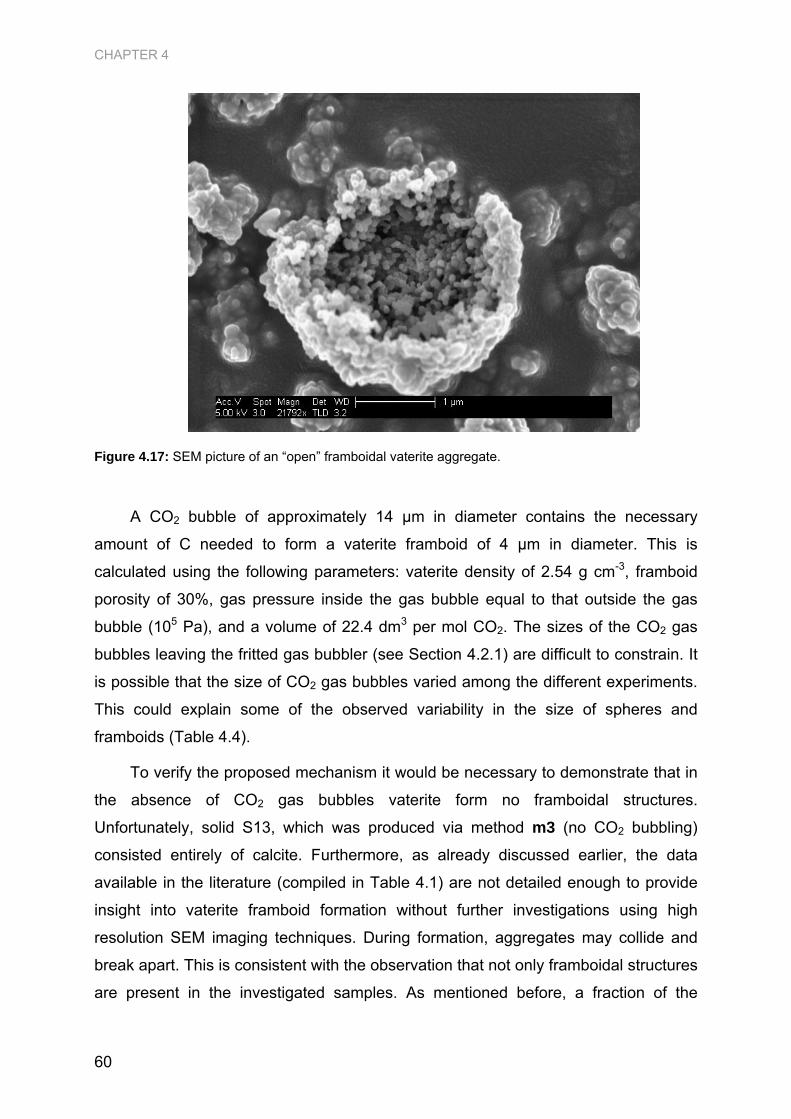
is used up and a framboidal aggregate has formed. Broken vaterite framboids as
shown in Figure 4.17 clearly show that the center of the framboidal aggregates is
built up by the same small particles as the outer part.
CHAPTER 4
60
Figure 4.17: SEM picture of an “open” framboidal vaterite aggregate.
A CO2 bubble of approximately 14 µm in diameter contains the necessary
amount of C needed to form a vaterite framboid of 4 µm in diameter. This is
calculated using the following parameters: vaterite density of 2.54 g cm-3, framboid
porosity of 30%, gas pressure inside the gas bubble equal to that outside the gas
bubble (105 Pa), and a volume of 22.4 dm3 per mol CO2. The sizes of the CO2 gas
bubbles leaving the fritted gas bubbler (see Section 4.2.1) are difficult to constrain. It
is possible that the size of CO2 gas bubbles varied among the different experiments.
This could explain some of the observed variability in the size of spheres and
framboids (Table 4.4).
To verify the proposed mechanism it would be necessary to demonstrate that in
the absence of CO2 gas bubbles vaterite form no framboidal structures.
Unfortunately, solid S13, which was produced via method m3 (no CO2 bubbling)
consisted entirely of calcite. Furthermore, as already discussed earlier, the data
available in the literature (compiled in Table 4.1) are not detailed enough to provide
insight into vaterite framboid formation without further investigations using high
resolution SEM imaging techniques. During formation, aggregates may collide and
break apart. This is consistent with the observation that not only framboidal structures
are present in the investigated samples. As mentioned before, a fraction of the

VATERITE AND IST MORPHOLOGY
61
samples is always present in form of non-aggregated spherical particles (e.g. Figure
4.5).
Table 4.45 shows that the size ratio between the framboids and the spheres that
constitute them is constant. Only solid S14 (precipitated while the tip of a sonifier was
submerged into the solution) exhibited a smaller size ratio. The constant size ratio
observed could imply that the number of nucleation sites per gas bubble is constant.
As mentioned earlier on, a detailed investigation of the reactions at the gas-liquid
interface would be required to get a better understanding of the processes leading to
framboid formation. Based on the observations gathered in this study it appears that
a regulation of the CO2 bubble size may be crucial in this respect. Although not fully
explained, it is an intriguing observation that the size ratio between the spheres and
the framboids that constitute them seems to be constant.
Table 4.5: Ratio between the sphere size and the size of the framboidal structure.
Spherical and cubic morphologies were not the only ones observed. Figure 4.13
shows an example of needle like structures. This morphology has never been
described for vaterite or calcite precipitates, but is typical for aragonite. That
aragonite was not detected using XRD is most likely due to its low concentrations in
the solid.
solid Size ratio spheres : framboid
S1 1 : 25
S3 1 : 25
S5 1 : 28
S9 1 : 28
S12 1 : 28
S14 1 : 60

CHAPTER 4
62
4.3.4 Particle Size and Surface Area
Kinetics of mineral transformation processes depend on the specific surface
area of the solids involved. A variety of different methods exist to measure the
specific surface area of solids. Depending on the characteristics of the solid, the
surface area measured can vary significantly depending on the method used. For a
detailed account on this issue the reader is referred to (Allen, 1999). As most
methods require at least one gram of solid it was not possible to directly measure the
surface area of the precipitates synthesized in this study. However, since the vaterite
framboids described are built up of nearly spherical particles, it is possible to estimate
the geometric specific surface area of the solids. Assuming that the solid consists of
spheres of uniform size, the specific (geometric) surface area ( solA ) of the solid can
be derived from the solid density (2.54 g cm-3 for vaterite):
2
3
1
*42
2
⎛ ⎞ρ= π⎜ ⎟⎛ ⎞ ⎝ ⎠4
π⎜ ⎟3 ⎝ ⎠
sphsol
sph
dA
d (4.1)
where solA is the specific surface in m2 g-1, ρ the density of the solid in g cm-3, and
sphd the diameter of the spheres in µm.
Surface roughness and porosity may significantly contribute to the effective
surface area of a solid. As Equation 4.1 does not take into account these effects, the
values obtained are expected to be lower than those measured by, for example, BET
surface measurements. However, for the solids described in this work, SEM analyses
show that the smallest particles are of similar size and morphology (see Figures 4.6,
4.8, 4.9, and 4.10), Equation 4.1 can still be used to illustrate relative differences in
surface area. Figure 4.18 indicates that below a diameter of 0.1 µm a small decrease
in particle size leads to an exponential increase in specific surface area.
Unfortunately, few measured values of the specific surface area of vaterite are
available. A value for the specific surface area of vaterite is given in only one of the
references cited in Table 4.1. In this publication, solA = 7.2 m2 g-1 is reported for
spherical vaterite particles with sizes between 4 and 6 µm (Plummer and Busenberg,

VATERITE AND IST MORPHOLOGY
63
1982). A specific surface area of 7.2 m2 g-1, however, corresponds theoretically to a
spherical diameter of 0.32 µm. This value (0.32 µm) is of the same order of
magnitude as the particle sizes of the elementary spheres obtained in this study
(Table 4.4). Thus, the particle sizes reported in Plummer and Busenberg (1982)
correspond most likely to aggregates (framboids).
Figure 4.18: Theoretical specific surface area of spherical particles (in m2 g-1) with a density of 2.54 g cm-3 (vaterite), calculated with Equation 4.1.
For the solids used in this study (S1–S14), the calculated solA values are
between 15 m2 g-1 (solid S1) and 85 m2 g-1 (solid S14). For three of the samples (S1,
S2, and S14) the predicted specific surface areas are illustrated in Figure 4.19. The
error bars indicated correspond to the errors in size determination as given in Table
4.4.

CHAPTER 4
64
Figure 4.19: Calculated specific surface areas for three of the precipitated solids.
4.4 Synthesis
Vaterite crystals described in this work show a tendency to form framboidal
aggregates built of small “spheres”. Geometric surface areas estimated from the
sizes of the elementary spheres are between 15 m2 g-1 and 85 m2 g-1. One of the
solids (S13) exhibited the morphology of small spheres but was identified as calcite
by XRD analysis. This finding demonstrates that is not always possible to distinguish
between vaterite and calcite solely based the particle morphology.
A mechanism leading to the formation of framboidal vaterite aggregates,
based on a nucleation process starting at the gas-liquid interface of a CO2 gas
bubble, is proposed. The use of CO2 to precipitate vaterite may be the key element in
the formation of vaterite framboids. Since CO2 gas is often used in laboratory studies
of vaterite formation and its subsequent transformation to calcite, the next chapter will
focus on how the framboidal morphology influences the vaterite to calcite
transformation kinetics.
Furthermore, SEM micrographs of one solid (S13) revealed the presence of
small amounts of needle like crystals, even though XRD measurements only
detected calcite. The needle like crystals are most likely aragonite. This observation

VATERITE AND IST MORPHOLOGY
65
is in of interest since it demonstrates that within the same precipitation vessel
different phases can form simultaneously. This contradicts with the general
assumption that under a given set of physico-chemical conditions only one
polymorph is formed.

66