4 social and family context - survey of health, ageing and ... · 163 * 4 social and family context...
TRANSCRIPT

163
*4 Social and Family Context Ed. Johannes Siegrist
4.1 Family Structure, Proximity and Contact 164Martin Kohli, Harald Künemund, and Jörg Lüdicke
4.2 Family Support 171Claudine Attias-Donfut, Jim Ogg, and François-Charles Wolff
4.3 Financial Transfers 179Claudine Attias-Donfut, Jim Ogg, and François-Charles Wolff
4.4 Gifts, Inheritances and Bequest Expectations 186Hendrik Jürges
4.5 Quality of Employment and Well-Being 192Johannes Siegrist, Olaf von dem Knesebeck, and Morten Wahrendorf
4.6 Quality of Life and Well-Being 199Olaf von dem Knesebeck, Martin Hyde, Paul Higgs, Alexandra Kupfer, and Johannes Siegrist
Appendix Tables 204

164
Social and Family Context
4.1 Family Structure, Proximity and ContactMartin Kohli, Harald Künemund, and Jörg Lüdicke
Current societal dynamics are putting family relations, especially those along the gen-erational lineage, squarely on the political and scientific agenda (cf. Kohli 2004; Kohli and Künemund 2005). Contemporary ageing societies are age-graded and to a large extent age-segregated societies. Their institutions tend to be age-homogeneous (Uhlenberg and Riley 2000). Exchange and support among generations is critical for maintaining age in-tegration. In this respect the family plays a special role—it is the prototypical institution of age-heterogeneity. The family links lives far beyond the co-residing nuclear unit, most prominently along the generational lineage. Moreover, the demographics of ageing soci-eties—especially the increasing longevity and proportions of elderly people—address new demands to the family and its functions, e.g., in terms of support and care for the elderly. For societal welfare and welfare policy it becomes vital to assess the current state of the family and its likely evolution.
Common Themes and National DifferencesFamilies in Europe today present many features common to all countries as well as
massive differences among them. As to commonalties, we expect to find a weakening of marriage with increasing age but stability of intergenerational bonds. As to differences, we expect to find patterns of “weak” and “strong” family regimes.
Research on these themes is sometimes like fighting against windmills: raising em-pirical arguments against myths that seem to remain untouched by them. It is widely assumed that the modern welfare state has undermined family solidarity and the family itself. Increasing childlessness and fewer births, decreasing marriage and increasing divorce rates, increasing numbers of singles and the decrease of multigenerational co-residence—to name just a few widely known facts—may indeed indicate a weakening of the family and its functions. But despite the high intuitive plausibility of such interpretations in which large parts of the social sciences meet with common sense, it may turn out that the family has in fact changed but not diminished its role (cf. Künemund and Rein 1999).
Speculation about the future of the family has been a regular feature of modernisation, mostly with the assumption of a general decline of family bonds. This restrictive view was first transcended by research on the emotional and support relations between adult family generations. But it is only during the last decade that we have discovered again the full extent of the family as a kinship and especially a generational system beyond the nuclear household (Bengtson 2001) which ranges across several different types of “solidarity”: spa-tial and emotional closeness, frequent contact, personal and instrumental support as well as massive flows of money and goods (cf. Contributions 4.2 and 4.3). SHARE provides the first possibility to chart the family generations on a European level.
The Ambivalence of MarriageWe first examine to what extent elderly Europeans are living together in bonds of mar-
riage. In recent decades, the institution of marriage has been weakened by diminishing rates of ever getting married and increasing rates of divorce. Our findings show that the current elderly have not yet been strongly touched by this evolution (Figure 1 and Table 4A.8 in the Appendix to this chapter). Among the 50-59-year-olds 76 percent of the men and 71 percent of the women live as a married couple. There is a rise of divorce in the

165
Family Structure, Proximity and Contact
younger cohorts but with ten percent of the 50-59-year-olds currently divorced it is still far below the levels of those now in their 30’s or 40’s. Some of them may remarry in the future, so that the proportion of, e.g., divorced 60-69-year olds ten years from now can-not be predicted solely on the basis of the evolution of divorce rates. There is also a rising proportion of never-married men, while among women the opposite patterns holds, with the oldest group having the largest proportion of never-married (12 percent), mainly due to the specific historical constellation of WWII and its aftermath.
But the most drastic pattern is that associated with the death of the marriage part-ner. The higher longevity of women—for life expectancy at birth it is currently about 7 years—and the fact that men in couples are on average about 3-4 years older than their wives translate into highly divergent trajectories for the two sexes as they grow older. The proportion of widowed men increases from 2 percent (50-59) to 30 percent (80 and older), that of widowed women from 8 to 69 percent. As a result, 63 percent of men but only 16 percent of women over 80 still live with a (married or registered) spouse. In some countries this loss of the marital bond is even more marked; among the women over 80 in Greece almost nine tenths are widowed, and only one tenth still live in marriage.
The Power of GenerationsThe family nucleus thus loses its impact with increasing age, especially among women.
This is not the case, however, for the generational structure (Figure 2 and Table 4A.9). Even after several decades of low fertility most European elderly still have a family that spans several generations. Only 11 percent have no other generation alive. The propor-tion rises somewhat in the older groups, but is below 15 percent except for the women above 80 where—due to the specific burdens mentioned above—it rises to 25 percent. The most frequent constellation—between 50 percent in Germany and 59 percent in Spain—is that of three generations. Four-generation families have a share of 16 percent, while five-
Figure 1 Marital status (percentages by age and gender)
������� �������� �������������
������������������������������������
���������������������
��������������������������������������
��� �����
�
��
��
��
��
���
������������������������������������

166
Social and Family Context
generation families remain at a fraction of a percent. Even among the youngest group, the mean number of living children in all countries remains above or close to 2; Germany has the lowest number with 1.68 (Table 4A.10). The ‘second demographic transition’ to low fertility in Europe thus has not yet left its mark on parenthood among our cohorts. It does show in grandparenthood, with very low numbers among the youngest age group in some countries such as Greece, Spain, and Italy, even though it is unclear how many of
the ‘missing’ grandchildren will still be born.How does this translate into actual exchange and support? The first question here is
about co-residence with and geographical proximity to these other generations. This is the one piece of evidence that seems to support the ‘modernisation’ claim: In all Western societies, co-residence among adult family generations has decreased massively. Today, among the Europeans above 70 who have at least one living child, only 15 percent live to-gether with a child in the same household (Table 4A.11). But by extending the boundaries of „togetherness“ the situation turns out to be very different. If one includes parents and children living not only in the same household but also in the same house, the proportion rises from 15 to 29 percent, and by including the neighbourhood less than 1 km away, to 49 percent. 84 percent have a child living not farther away than 25 km. The preference now seems to be for ‘intimacy at a (small) distance’, small enough so that relations of ex-change and support may function easily across the boundaries of the separate households (cf. Kohli et al. 2000). Thus, even the living arrangements are not very good evidence for the claim of a dissociation between parents and adult children. A similar result applies to the frequency of contact (Table 4A.12).
Weak and Strong Family CountriesIn these dimensions, however, it is the variation among countries that comes into focus.
At the European level, there are considerable differences between Scandinavia, Central
Figure 2 Generational constellations (percentage by country)
������������ �������������
������������� ���������������
�
��
��
��
��
���
�������������������������
��

167
Family Structure, Proximity and Contact
and Western Continental countries, and those of the Mediterranean. The latter are often grouped together as ‘strong family countries’, and contrasted with the ‘weak family coun-tries’ of the Centre and North of Europe and of North America (Reher 1998). The strength or weakness refers to cultural patterns of family loyalties, allegiances, and authority but also to demographic patterns of co-residence with adult children and older family mem-bers and to organising support for the latter. The ‘strong family countries’ have had high fertility in the past but today, paradoxically, are those with the lowest fertility (Kohler et al. 2002), a state of affairs that is directly linked to the strength of their family tradition. While they have evolved, in conjunction with the other advanced countries, towards higher gen-der equity in education and the labour market, gender equity in the family and in public provisions for the family remains low. The dominant model, both culturally and in terms of welfare state incentives, is still that of the male breadwinner. The ensuing cultural lag in gender equity between the ‘individual-centred’ and the ‘family-centred’ worlds increasingly
turns women away from motherhood (McDonald 2000).As mentioned above, these trends have mostly not yet directly affected the SHARE co-
horts. For them—and therefore also for the elderly in the near future—the pattern remains one of comparatively high marriage rates and low rates of childlessness. But they are af-fected in an indirect way, through the decreasing prevalence of marriage and childbearing among their children.
Our data demonstrate that there is not only a ‘weak’-‘strong’ dichotomy but a North-South gradient, with the Scandinavian countries generally having the least traditional fam-ily structure, the Mediterranean countries (Spain and Italy more so than Greece) the most traditional one, and the other continental countries lying somewhere in-between. This already shows for the variation in marital status, e.g., divorce (Table 4A.8). Denmark and Sweden are at the top with 13 and 12 percent currently divorced, followed by Germany, Austria, France and Switzerland with 9 percent, the Netherlands with 6 percent, Greece
Figure 3 Proximity to nearest living child (percentages by country)
�������� ��������� �������
�������������� ������������� ��������������
�
��
��
��
��
���
�������������������������

168
Social and Family Context
with 4 percent, and Italy and Spain with 2 percent. Massive differences occur with respect to co-residence (Figure 3 and Table 4A.11). The Mediterranean countries are characterised by very late (and increasing) ages of leaving the parental home among adult children. This is often interpreted solely as an effect of opportunity structures (employment and housing markets), but the variation among countries may also be explained by a cultural tendency towards closer intergenerational ties. While we are not able at this point to differentiate be-tween those who have never left the parental home and those who have moved back later or have had their parents moving closer (cf. Attias-Donfut & Renaut 1994), the overall proportions are striking. In Denmark and Sweden, 13 and 15 percent of our respondents who have at least one living child live with a child in the same household, in the ‘centre’ countries this amounts to between 20 and 27 percent, but in Italy and Spain to 49 and 52 percent. Moving beyond the boundaries of the household yields a similar picture. Among the 50-59-year-old Mediterraneans, more than three quarters still have a child living at home with them. Among the oldest age group, the proportions are smaller but the differ-ences between countries even larger: only 1 percent of the oldest Swedes and 4 percent of Danes live with a child, compared to 23 percent of Italians and 34 percent of Spaniards.
As in all such comparisons, differences should of course not be examined at the level of nation states only; there are important regional differences as well. In Italy and Spain, differences between North and South in terms of variables such as co-residence may be equally large as between countries, to the point where, e.g., northern Italy demographi-cally may have more in common with other Western European countries than with the mezzogiorno. Another case in point are differences between native and migrant popula-tions. In Germany, the mean number of grandchildren for our respondents is 2.05 among those who on November 1, 1989, lived in West Germany, 2.96 among those who lived in the GDR, and 3.78 among those who lived abroad and have migrated to Germany since then.
Figure 4 Frequency of contact to most contacted child (percentages by country)
����� �������������������������
���������������������������
��������������������
�����
�
��
��
��
��
���
�������������������������

169
Family Structure, Proximity and Contact
Similar results as for proximity obtain for frequency of contact with children and par-ents. As a whole, they show that the adult generations in the family, even in countries with comparatively weaker family traditions and larger geographical distance, remain closely linked. Contact to the most contacted child (Figure 4 and Table 4A.12) is daily for 42 and 45 percent in Denmark and Sweden, respectively, and for between 47 and 55 percent in the central countries; the Mediterranean countries stand out with between 84 and 86 per-cent. In all countries 70 percent or more have contact at least several times a week; in the Mediterranean countries, it is 95 percent or more. There are those who have no contact at all to their living child or children but in no country do they make up more than one percent. In the older age groups contact is less frequent, but even among those over 80 at least three fifths (in Switzerland), and more than nine tenths (in the Mediterranean coun-tries) are in contact with a child daily or several times a week.
Contact with parents (Figure 5) is somewhat less frequent, partly because there are of-ten several children of which only one lives close to their parents (cf. Konrad et al. 2002) and remains in close contact. There may also be some tendency to overreport contact with children and/or underreport contact with parents—a response pattern associated with the often-observed difference in the ‘developmental stake’ of parents and children (Giar-russo et al. 1995). It should be noted that the numbers here are restricted to own parents (parents-in-law are included only where they live in the same household). As to differences between countries, the Mediterranean countries again stand out, while there is no notice-able gap between Scandinavia and the Continent. Switzerland has the lowest proportion of contact with parents at least several times a week—corresponding to the fact that parents here most often live farther away as a result of international migration.
Figure 5 Frequency of contact to most contacted parent (percentages by country)
����� �������������������������
���������������������������
��������������������
�����
�
��
��
��
��
���
�������������������������

170
Social and Family Context
What Is To Be Concluded?In conclusion, we emphasise four points:
• For present elderly Europeans the family has remained a strong provider of institu-tional and everyday integration. The historical decline of marriage has not yet reached them directly.
• The marriage bond weakens however with increasing age, and dramatically so for women.
• On the other hand, the multi-generational structure of the family remains stable. Even though co-residence of the elderly with their adult children has decreased, geographi-cal proximity—and thus the potential for everyday support—is high. There are more-over high rates of frequent contact with each other.
• While this is true for Western Europe as a whole, there are important differences among the ‘strong family countries’ in the South and the ‘weak family countries’ in the North. The North-South gradient is especially noticeable with respect to rates of co-residence and frequency of contact among adult family generations.
ReferencesAttias-Donfut, C., and S. Renaut. 1994. Vieillir avec ses enfants - Corésidence de toujours et recohabitation.
Communications 59:29-53.
Bengtson, V. L. 2001. Beyond the nuclear family: The increasing importance of multigenerational bonds. Jour-
nal of Marriage and the Family 63:1-16.
Giarrusso, R., V. L. Bengtson, and M. Stallings. 1994. The “intergenerational stake” hypothesis revisited. Par-
ent-child differences in perceptions of relationships 20 years later. In Adult intergenerational relations, eds. V.
L. Bengston, K. W. Schaie, and L. M. Burton, 227-263. New York: Springer.
Kohler, H.-P., F. C. Billari, and J. A.O Ortega. 2002. The emergence of lowest-low fertility in Europe during
the 1990s. Population and Development Review 28:641-680.
Kohli, M. 2004. Intergenerational transfers and inheritance: A comparative view. In Intergenerational relations
across time and place (Annual Review of Gerontology and Geriatrics, Vol. 24), ed. M. Silverstein, 266-289.
New York: Springer.
Kohli, M., and H. Künemund. 2005. The middle generation in the family: Patterns of exchange and support. In
Middle adulthood: A lifespan perspective, eds. S. L. Willis and M. Martin. Thousand Oaks, CA: Sage.
Kohli, M., H. Künemund, A.Motel, and M. Szydlik. 2000. Generationenbeziehungen. In Die zweite Leben-
shälfte. Gesellschaftliche Lage und Partizipation im Spiegel des Alters-Survey, eds. M. Kohli and H. Künemund,
176-211. Opladen: Leske + Budrich.
Konrad, K. A., H. Künemund, K. E. Lommerud, and J. R. Robredo. 2002. Geography of the family. American
Economic Review 92:981-998.
Künemund, H., and M. Rein. 1999. There is more to receiving than needing: Theoretical arguments and em-
pirical explorations of crowding in and crowding out. Ageing and Society 19:93-121.
McDonald, P. 2000. Gender equity, social institutions and the future of fertility. Journal of Population Research
17:1-16.
Reher, D. S. 1998. Family ties in Western Europe: Persistent contrasts. Population and Development Review
24:203-234.
Uhlenberg, P., and M. W. Riley. 2000. Essays on age integration. The Gerontologist 40:261-308.

171
Family Support
4.2 Family SupportClaudine Attias-Donfut, Jim Ogg, and François-Charles Wolff
IntroductionOlder Europeans give and receive practical help to other family members in many ways.
Some of the most important forms of help include caring activities such as helping a disabled family member with personal care or looking after grandchildren. Family help is not simply a private affair. Social policies that are adapted to the needs of families are vital for well functioning economies and more generally for promoting social cohesion. As Gosta Esping-Andersen notes, the building of successful welfare states for the twenty first century needs both to acknowledge changing family structures and to support the family (Esping-Andersen 2003). Much of what is known about family support at the European level is confined to transfers that take place within households. However, it is increasingly recognised that the contemporary family is no longer confined to a single household and that support between households is an important component of family help. For the first time, the SHARE data can address the question of how older Europeans give and receive support both within and between different households.
This contribution addresses three crucial areas of family support. The first is looking after grandchildren. In many countries, this task has been a traditional role of women. However, the changing pattern of women’s labour force participation and the availability of alternative forms of childcare for parents strongly influence whether grandmothers look after their young grandchildren regularly. To what extent are European grandmothers implicated in the care of their grandchildren and how is this task combined with paid work? The second question addressed is the personal care that older people with health or disability problems receive from within and outside the family. As shown in the previ-ous contribution, the different living arrangements of European countries determine the availability of intra-household support. Are older people with care needs who live alone disadvantaged in terms of accessing family support? The final question addressed in this contribution is the role of carers—in particular where one member of a couple is helping his or her partner or where an adult child is giving personal care to a parent. Under what conditions is care given and do these conditions differ between countries? And is there a time in the life course when individuals are caught between the dual tasks of caring for an elderly parent and looking after grandchildren?
Grandmothers Largely Involved in Looking After Grandchildren from the North to the South
Grandparents in SHARE were asked whether they had regularly or occasionally looked after their grandchildren without the presence of the parents during the past 12 months. The proportion of men and women who reported looking after grandchildren is identi-cal—43% in both cases. Here, we focus exclusively on grandmothers. As shown in Figure 1, a prominent finding is that grandchild care is mostly uniform across all countries, with around one half of grandmothers having looked after their grandchildren regularly or oc-casionally within the past 12 months. Moreover, these rates are slightly higher in Sweden, Denmark, the Netherlands and France, where family ties are traditionally weaker than in the Mediterranean countries (cf. Contribution 4.1) and more alternative sources of child care provision are available. Some of this extra involvement by northern grandmothers may be explained by a higher proportion of the grandchildren’s parents who are single or

172
Social and Family Context
separated. Grandmothers in Denmark for example, are much more likely to have children who are single parents than in the continental and southern countries. However, this is not the case in the Netherlands, where rates of looking after grandchildren are the highest. The most likely explanation for this high level in the northern countries is that grandmoth-ers—who themselves often are in paid employment—are helping the grandchild’s mother to combine both work and family commitments.
Although there is little variation between the countries in the rates of grandchild care, when the regularity of this task is examined a different story is told. This is shown in Fig-ure 2, where it can be clearly seen that a gradient from low to high frequencies of weekly grandchild care runs from the northern to the southern countries. Among grandmothers involved in weekly grandchild care, Italian, Greek—and interestingly Swiss—grandmothers are more than twice as likely to be heavily involved in grandchild care.
Figure 1 Percentage of grandmothers who have looked after their grandchildren regularly or occasionally during the past 12 months
What can explain these striking differences in the intensity of grandmothers being in-volved? Although cultural patterns are likely to be present (for example more ‘familism’ in Mediterranean countries) patterns of supply and demand such as the availability of grand-mothers and the need for young parents to solicit their parents for childcare are likely to
Figure 2 Percentage of grandmothers reporting looking after their grandchildren at least weekly, and percentage of grandmo-thers who are in paid employment. (Base: grandmothers aged <65 having looked after grandchild in the past 12 months)
0 %
10 %
20 %
30 %
40 %
50 %
60 %
70 %
GRITESCHATDEFRNLDKSE
workingat least weekly
0 %
20 %
40 %
60 %
80 %
100 %
GRITESCHATDEFRNLDKSE

173
Family Support
be important factors. As shown in Figure 2, more than half of the grandmothers below the age of 65 in Sweden and Denmark are in some form of paid employment compared to only one in ten grandmothers in the Mediterranean countries. In countries with high rates of women in the labour force, intensive grandchild care rates are low, whereas in countries where grandmothers are mostly not in paid employment, rates of intensive grandchild care are high. The lack of alternative sources of childcare other than the family in the southern countries (and to a certain degree in the continental countries) also influences patterns of grandchild care. Different residential patterns of parents and children may also explain these differences—in the southern countries, where there are high rates of close geographi-cal proximity between older parents and their adult children (especially among lower social class groups), grandparents looking after grandchildren is a much cheaper alternative than other sources. In summary, country differences in rates of looking after grandchildren are due to a combination of the supply side factors (availability of grandparents and childcare resources outside the family) and demand factors (the need for young mothers to ask for help, which is dependent on whether they are in paid employment).
Living Arrangements Strongly Influence Patterns of Family Care-GivingAs shown in Contribution 3.1, the prevalence of health problems for older Europeans
rises steeply with age. This fact implies a greater need for help among the oldest age groups with personal care tasks such as getting dressed, washing and bathing and getting to the toilet. As demonstrated in Figure 3, after the age of 50 the proportion of respondents who have received some form of personal care such as dressing, bathing or showering, eating, getting in or out of bed, or using the toilet during the past 12 months rises gradually up to the age of 75 and steeply thereafter. At every age, rates of having received personal care are higher than rates of disability (having severe limitations), with differences becoming larger with increasing age. After the age of 80, more than two-thirds of respondents have been given some help for their personal care and the SHARE data show clearly that this task is provided first and foremost by other family members.
Helping an individual with personal care is often a heavy, not to mention intimate load for family members. Who are these givers of personal care and how do the differ-ent patterns of living arrangements in Europe shape the pattern of care giving? Figure 4
Figure 3 Proportion of respondents who receive help with personal care and who are severely limited
0 %
20 %
40 %
60 %
80 %
100 %
severely limitedreceive help
777471686562595653
50 80 92898683

174
Social and Family Context
shows that the network of care-givers within the household for respondents indicating that they have received personal care follows closely the pattern of intergenerational co-habitation outlined in the previous contribution. In Denmark for example, personal care within households is almost uniquely undertaken by spouses, whereas in Spain children and other family members are more involved than spouses. As well as reflecting household composition, this pattern of care-giving may also be influenced by the different cultural expectations concerning the roles of spouses and children—in the Mediterranean countries the expectations placed on co-resident daughters to provide personal care may be higher than those placed on spouses, especially where personal care is given to an elderly father.
Living arrangements therefore shape patterns of care-giving. So given that a much high-er proportion of older people live alone in the northern and continental countries, to what extent might they be isolated from their family or other forms of social support? This is
an important question for social policy, as the heat wave that affected the lives of many older people living alone in France during the summer of 2003 clearly demonstrated. The SHARE data show that considering all forms of help, older people living alone are more likely to receive help than those living with others. For example, one-third of the respon-dents living alone received help with personal care or practical tasks during the past 12 months, although these rates were significantly lower in Spain, Italy and Switzerland (but interestingly, not in Greece). It would seem that the strong dimension of family support that is manifest in Spain and Italy is weakened when older people are living alone and that these two countries may not have the infrastructure in place that facilitates solo living in old age. This finding supports the ‘complementarity’ thesis, whereby a mixture of public, voluntary and other forms of civic support does not erode family support (Kunemund and Rein 1999). Instead, family members are ‘freed’ from the more arduous tasks of intensive personal care (undertaken by professional services) and are able to devote more time to other family relationships (Daatland and Herlofson 2003). Living alone in countries where service levels are low appears to be a more risky living arrangement than in the northern and continental countries (with the exception of Switzerland). The question of whether older Europeans living alone are isolated from their family or more generally socially ex-cluded is an important social policy question that can be addressed by further analysis of
Figure 4 Network of people who help with personal care within the household
0 %
20 %
40 %
60 %
80 %
100 %
other familynon-familychildspouse
GRITESCHATDEFRNLDKSE

175
Family Support
the SHARE data on intergenerational transfers.Further evidence of the impact of living arrangements on social support is shown in
Figure 5. Here, sources of help outside the household that are non-family are presented for respondents living alone. The SHARE data show that although in all countries the main source of support are children, this is supplemented in the northern countries by non-family sources of support including an array of professional services as well as friends and neighbours. Moreover, older people in the northern European countries (whether living alone or not) are more likely to have received help from someone outside the household (including professional services) than in the southern countries. However, support in the northern countries to older people living alone is more likely to be provided occasionally rather than frequently. These inter-country differences clearly reflect a mix of cultural and institutional differences as well as pointing to the importance of social networks for older people living alone.
Giving Help Decreases with Age, but Care-Giving Remains ConstantThe final question addressed in this contribution is the flip side of receiving care—care-
giving. With increased life expectancy, the probability that adult children will encounter a time when their elderly parents need help is also increasing. However, this moment may arise when individuals have a number of competing obligations, such helping their own children to achieve independence, looking after grandchildren and for many European women doing some form of paid work. About one in ten respondents indicate that they have given some form of personal care to a family member during the past 12 months and about one in three respondents have given some form of help (personal care within or outside the household, practical help outside the household) during the past 12 months. Figure 6 shows that while rates of giving general forms of help and personal care to a parent decrease significantly with increasing age, levels of giving personal care remain constant with age—between the age of 50 and 65 individuals are involved in personal care mainly with their elderly parents, and thereafter with their spouses. Figure 6 also shows that between the ages of 50 and 65, individuals face a particularly busy time as far as family support is concerned.
The Pivot Generation Is More Prominent in Northern CountriesThe pressures that care-givers below statutory retirement face with competing demands
from different family members is commonly invoked as being the burden of the baby-
Figure 5 Proportion of respondents living alone who receive non-family help with personal care of practical tasks
0 %
5 %
10 %
15 %
20 %
25 %
30 %
35 %
40 %
GRITESCHATDEFRNLDKSE

176
Social and Family Context
boomer generation. For the first time, the SHARE data is able to determine precisely in a European context what several commentators have referred to as the ‘sandwich’ or ‘pivot’ (Attias-Donfut 1995) generation. This generation is commonly defined in demographic terms as being situated between an ascending generation (elderly parents) and descending
generations (adult children and grandchildren). More accurately, the ‘pivot’ generation represents those individuals who are undertaking tasks for their elderly parents as well as helping their adult children in the early stages of their family life—notably with looking after grandchildren. The pivot generation is numerically very high at the present time and this has given rise to concerns about their ability to combine multiple family tasks whilst at the same time staying longer in the labour-market.
The SHARE data show that despite the relative high numbers of individuals belonging to the pivot generation (having at least one parent and one adult child alive) about one in
Figure 6 Percentage of respondents who give help
Figure 7 The ‘pivot’ generation by age and country groups
0 %
10 %
20 %
30 %
40 %
Gives personal care
Gives help to someoneGives help to a parent
Age
50 %
50 55 60 65 70 75 80 85 90
0 %
5 %
10 %
15 %
20 %
southerncontinental northern
49 54 59 64 69 74 79 84
Age

177
Family Support
five individuals belong to what we term the ‘active’ pivot generation—the time in the life stage when both elderly parents and adult children need support. This is evident in Figure 7, which shows the rates of individuals who report having given some form of help to a parent during the past 12 months and who look after grandchildren at least weekly. The data have been grouped by countries to show both different rates of the existence of the active pivot generation and the age at which individuals are most likely to belong to it. In-dividuals in the northern countries are more likely to be active pivot family members than in other countries, and this difference is in part due to the fertility and mortality character-istics of the specific birth cohorts within countries. But in all countries, individuals in their sixties are most likely to be active pivot family members, with a slight tendency for this to arise in the early sixties in continental countries, mid-sixties in the northern countries and late sixties in the Mediterranean countries.
The finding that the active pivot generation is situated in age groups that are tradition-ally associated with statutory retirement has important social policy implications. Do these individuals exercise choice in becoming more involved in these family activities when they retire or do the demands made upon them by family members in need coincide with the cessation of paid work? By examining in detail the interaction between these factors—un-paid work within the family, the health and disability status of elderly parents and retire-ment decisions among care-givers—the longitudinal dimension of the SHARE data will throw important light on how comprehensive social policies can enable family members to combine private and public lives.
ConclusionIn all the European countries in SHARE, older people are at the centre of a complex ex-
change network within the family where they both give and receive support. Roles change over the life course. For instance between the age of 50 and 65 individuals are involved in personal care mainly with their elderly parents, and thereafter with their spouses. But in all countries, individuals in their sixties are most likely to be active pivot family members. However patterns of support differ between countries, revealing a strong North/South European divide: a higher proportion of older people are involved in family support in the northern and continental countries, whereas in the southern countries help and sup-port tends to be confined to a few individuals within the immediate family who are more intensely involved as either the givers or receivers of care. As a consequence, older people living alone are more likely to be given support in the northern countries. These country differences can be explained by three main factors:
• In the southern countries, rates of cohabitation and the geographical closeness be-tween older parents and their adult children is much higher than in other countries. So family support is focussed around this immediate kin group. In the northern countries, where intergenerational cohabitation is rare, family support tends to revolve around different households.
• Few women aged between 50 and 65 in 2004 in the southern countries are in paid employment, so they are currently available to undertake heavy family tasks.
• The ‘welfare mix’ of services, much more developed in northern countries, releases family members from the heavy duties of family support for close kin (such as personal

178
Social and Family Context
care of a parent or looking after grandchildren). Older people therefore have more op-portunity to devote their time to other types of social contact that are less arduous but arguably equally important for intergenerational solidarity. Families are therefore not weakened if other sources take on some of the roles of caring. This is an important finding that is made possible only by comparable data such as in SHARE. Further work in this area will be able to address some of the key policy implications concerning the mix of welfare services within countries.
These explanations need to be tested against the evidence from longitudinal data. Will family support, both by and for older people, continue to evolve in the same way as we have outlined in this contribution? How does caring evolve in the life course of individuals and changing family structures? What kinds of events may alter patterns of family sup-port? And perhaps most important of all, how does reciprocity—the key to all systems of family support—operate under conditions of rapid social and demographic change? The first wave of SHARE data provides the building blocks to begin these analyses and future waves will provide critical insights into this important aspect of ageing.
ReferencesAttias-Donfut C. Ed. 1995 Les solidarités entre générations : vieillesse, familles, État, Paris, Nathan, collection
Essais et Recherche, Série Sciences Sociales.
Daatland, S. O. and K. Herlofson. 2003. Lost Solidarity or Changed Solidarity: A comparative European view
of normative family solidarity. Ageing and Society 235:537-560.
Esping-Andersen, G. 2003. A welfare state for the 21st century. In The Global Third Way Debate, ed. A. Gid-
dens,. 134-56, Polity: Oxford.
Künemund, H. and M. Rein. 1999. There is More to Receiving Than Needing: Theoretical Arguments and
Empirical Explorations of Crowding In and Crowding Out. Ageing and Society 19:93-121.

179
Financial Transfers
4.3 Financial TransfersClaudine Attias-Donfut, Jim Ogg, and François-Charles Wolff
IntroductionCurrent debates on the growing numbers of older people sometimes portray this demo-
graphic trend as a financial burden for society. Older people are seen as a drain on resources, particularly in terms of state pensions and health care. But this negative perception ignores the role that older people have in helping their children through difficult financial periods or the potential for the downward transfer of wealth within families. Previous research has shown the importance of financial intergenerational transfers within the family and their consequences for capital accumulation and wealth inequality (Arrondel and Masson 2001). This research has begun to show that the bulk of private money transfers between the generations occurs inter vivos—in other words from living family members and not in the form of inheritance wealth. Determining whether older Europeans give and/or receive financial help from their family and social network is therefore a central task for designing social policy that promote intergenerational solidarity (Bengtson and Achenbaum 1993).
In the previous contribution, it was shown that practical help can take many forms. The same is true for financial transfers by older Europeans. Such transfers can be made directly by cash or in the form of gifts and in these cases the value of the transfer can be ascertained or estimated. In other cases, financial transfers are indirect with the donors often paying a third party on behalf of the recipient (an example would be a parent paying for the univer-sity fees of a child, or an adult child paying for the residential care fees of an elderly parent). The SHARE survey is designed to capture both of these types of financial transfers. In this contribution we focus on financial transfers that have occurred during the past 12 months. SHARE respondents were asked ‘Not counting any shared housing or shared food, have you or your husband/wife/partner given or received any financial or material gift or sup-port to any person inside or outside this household amounting to 250 euros or more?’ The interviewer was given instructions to include the giving and receiving of money, material gifts and indirect transfers such as payments for medical care or insurance, schooling or a down payment for a home (loans were not included). For each transfer, the respondent provided information about the donor and recipient, the value, and the motive.
Patterns of financial family transfers are characterised by their direction (who gives to whom, and who receives from whom), their amount and their motives. We first compare the direction of transfers across countries, then examine the motives according to the di-rection of transfers. Finally, we examine differences in the value of the transfers by taking into account both the direction and motives.
Financial Transfers Flow Mainly from Parents to ChildrenFigure 1 shows that about 28% of the SHARE respondents reported having given a
financial or material gift worth €250 or more within the last 12 months to their family or other members of their social network (ranging from 11% in Spain to 37% in Sweden). Older Europeans were much less likely to receive a financial gift than to give one. In all countries, rates decreased significantly with increased age. On average, only 6% received money (ranging from 3% in the Netherlands to 12% in Greece). Although these rates of financial transfers at first sight appear to be rather low, it should be remembered that the threshold of €250 excludes multiple transfers of lesser sums whilst at the same time cap-turing more important transfers.

180
Social and Family Context
At first glance, it is not easy to interpret these differences. They do not follow a specific pattern, such as a grouping of different systems of welfare (social democratic, liberal or family-corporate) or a geographical north-continental-Mediterranean divide reflecting dif-ferent cultures. Greek respondents were just as likely to give a gift as Swedish respondents, and more likely to give a gift than Swiss or German respondents, while rates of financial transfers were particularly low in Spain. Danish respondents were much less likely to have given financial support than their Swedish neighbours. The general trend therefore, is that older Europeans are much more likely to give financial gifts than receive them, and that financial transfers are predominantly directed to descending generations—children and grandchildren. This pattern applies to all the SHARE countries, with some differences ap-pearing only in the likelihood of giving and receiving and the amount.
Although country differences in the rates of giving and receiving a financial or mate-rial gift do not follow any clear pattern, important North/South divides are found in the composition of the donors and recipients. Figure 2 shows the clear trend in all countries of downward flowing transfers, where children (and to a lesser extent grandchildren) are the main recipients. The age at which older Europeans are most likely to make a financial transfer is around 60, with rates decreasing steadily thereafter. But with increasing age, older Europeans are more likely to make financial transfers to their grandchildren—around 8% of the recipients of transfers made by respondents below the age of 75 are grandchil-dren compared to 28% when the respondent is aged above 75.
When older Europeans give important gifts, children and grandchildren are therefore the main beneficiaries. But when older Europeans receive gifts, the network of donors is more diverse, as can be seen in Figure 3. On the one hand, in the Mediterranean coun-tries, and especially in Spain and Italy, children are much more likely to make a financial transfer to a parent than in the continental and northern countries. On the other hand, parents are important donors in these latter countries. These differences clearly reflect demographic and institutional influences at work. SHARE respondents in the northern countries are more likely to have a parent alive than in the Mediterranean countries. At
Figure 1 Percentage of respondents who have given or received €250 during the past 12 months
0 %
5 %
10 %
15 %
20 %
25 %
30 %
35 %
40 %
ReceiveGive
GRITESCHATDEFRNLDKSE
45 %

181
Financial Transfers
the same time, in countries with developed pensions systems and high per capita wealth, SHARE respondents are more likely to receive a gift from a parent who benefits from a high pension (mostly built up during the periods of full employment immediately after the Second World War). In southern countries, where there are more people with a low level of pensions, financial help from their children is an important family transfer.
Motives and Determinants for Financial TransfersMost donors of financial gifts tended to report general motives for having made a gift,
such as meeting basic needs, a major family event or for no particular reason. However, the motives differed according to who received the gift. On the one hand, when the recipi-ents were parents or non-family members such as friends and acquaintances, financial gifts
Figure 2 Network of recipients of financial transfers (to whom do older respondents give €250 or more?)
Figure 3 Network of donors of financial transfers (who gives to respondents?)
0 %
20 %
40 %
60 %
80 %
100 %
non-familyother familygrandchildchild
GRITESCHATDEFRNLDKSE
0 %
10 %
20 %
30 %
40 %
50 %
60 %
70 %
80 %
90 %
100 %
GRITESCHATDEFRNLDKSE
other parent child

182
Social and Family Context
seem to be made for basic needs, suggesting that the income and wealth of these recipients is low. On the other hand, when older Europeans made a gift to a child or grandchild, the range of motives was much more diverse and included reasons such as ‘for study’, ‘hous-ing’ or ‘a large item or expenditure’. These reasons have less to do with poverty than promoting human capital and economic investment (in this case the life chances of de-scendants). However, whether older Europeans make a gift because someone is in need or to promote their life chances, it is likely that the gift is made in the context of a reciprocal and symbolic pattern of exchange among close family members who have strong affective ties. This central question of the reciprocity of family gifts will form a key part of future analyses of the SHARE data.
Since family financial transfers flow mostly from parents to children, we now focus on some of the characteristics of both the parents (respondents) and their children in order to explain these transfers. Several explanations have been suggested concerning the motives for such transfers, and this issue has important implications for the effectiveness of public transfers. The two main models are altruism and exchange. According to the altruistic explanation, the donor cares primarily about the well-being of the recipient. Thus transfers flow from the least to the most financially needy generation independent of any present or future reciprocating help. In the exchange model, financial transfers from one genera-tion reflect the payment of services and visits provided by the other generation. Services and their financial counterpart are embedded in current or future obligations of reciproc-ity. Recent theoretical studies have reached different conclusions concerning these two hypotheses and at the present time, it is not clear whether family motives are driven by altruism or exchange.
The analyses are made both on aggregate data and for each country. To summarise the preliminary results, parents seem motivated to give money to their children for two reasons, although elements of both are present in each type of transfer. The first one deals with human capital considerations. Children who are helped financially by their parents appear to be following further education and therefore not to have attained financial in-dependence. They are helped on the road to independence, no doubt by the expectations of their parents who want to see their children succeed. This is confirmed by the evidence that parents are more likely to give money to children who live far away from them than to children who live nearby. This finding is not in line with exchange explanations for the motives of transfers, which presupposes that children living close to their parents are more likely to receive money. On the one hand, geographic proximity strongly reduces the cost of providing time-related resources and services to parents (the ‘exchange’ service for the money received). On the other hand, the finding that higher proportions of more distant children received money from their parents could be explained by the parent’s wish to further the chances of their children—for instance, parents who pay for the rent or home for an adult child who has recently completed higher education.
The second reason concerns more altruistic transfers, directed towards less well off children such as those who are unemployed. At the same time, these same parents may also be motivated in helping their children to get established in a career and adult inde-pendence. These two primary motivations to financially help children exist in all SHARE countries. However, there appears to be a greater emphasis on human capital investment in Nordic countries. There is also a larger gender difference in the Netherlands, with daughters receiving preferential treatment. The same tendency exists in other countries, but without statistical significance. This is most likely to be related to country differences

183
Financial Transfers
in the higher education and labour market participation rates of women, as well as paren-tal commitment to help change the traditional role of women.
Value of Gifts Given and ReceivedThe amount of inter-vivos gifts is strongly correlated with the identity of the recipients.
Financial transfers are not only infrequently made to elderly parents, they also have a lower value. As we have seen above, children are the most likely recipients of gifts, and the mean value per child is about 50 per cent higher than for a parent. In fact, the greater the gen-erational distance, the lower the value of the transfer, since respondents tend to give their grandchildren gifts of low value. Respondents who are grandparents would certainly think that the financial responsibility of the youngest generation (their grandchildren) should be born by the parents of these grandchildren, and therefore it is possible that gifts made by respondents to their children (where these children are themselves parents) are also indirect gifts to grandchildren. Where respondents give gifts to other family members, the values are about the same as those gifts given to non-family members.
Figure 4 Network of donors and recipients of financial transfers (who gives to respondents and who receives from respon-dents?)
Figure 5 Motives for financial transfers (who gives to respondents and who receives from respondents?)
Given
0
1000
2000
3000
4000
5000
Received
Non-familyOther familyGrandchildrenChildrenParents
Identity of donors and recipients
MEA
N (E
URO
)
Given
0
1000
2000
3000
4000
5000
6000
7000
Received
majo
r fam
ily
even
tothe
r
expe
nditu
res
hous
e
purch
ase
basic
need
s
Reason for gift
MEA
N (E
URO
)

184
Social and Family Context
The value of gifts given by respondents is also correlated with the living standards of the recipients. Low transfers amount are directed towards less well-off recipients, either to meet basic needs or because they are unemployed. Gifts made for family events also have a low value. Conversely, transfers related to investment in human capital are significantly higher than those for basic needs—for example well off parents are more likely to make a gift to their children for educational purposes. A similar finding is observed for transfers related to the purchase of a dwelling. Buying a house requires much more resources for the buyers, and respondents therefore tend to make larger gifts.
ConclusionEuropean data on family financial transfers before SHARE are almost exclusively from
single country surveys and it has not been clear to what extent they reflect particularities of the social and economic context or are aspects of institutional structures such as taxa-tion. For the first time, the SHARE data provide simultaneous information on inter-vivos transfers from countries with very different taxation and financial market structures. This enables transfer patterns to be seen that are either specific to some countries or general to most countries. Among the major findings of this contribution are:
• Confirmation that intergenerational transfers clearly flow downwards. This is undoubt-edly due to the fact that all countries have in place minimum systems of retirement pensions. Older Europeans are for the most part financially independent and so they are able to pass on some of their wealth to their children and grandchildren.
• Older Europeans are most likely to make financial transfers around the age of 60 and when they are making the transition to retirement.
• Older Europeans give mainly to their children, but, with increasing age they give more to grandchildren.
• The North/South country variation exists in the composition of the networks of re-cipients : younger respondents receive more from parents in the North, older respon-dents recipients from children in the South. This means that differences in the levels of welfare systems still influence the direction of transfers, older needy people in the weak welfare regime being still partially at the charge of the children. Moreover, older people with great financial difficulties receive a little more often and larger amounts of money, but except in this difficult situation, they receive smaller amounts on aver-age than the younger who receive from their parents. Cash gifts from parents to their children are mainly directed towards children who are currently completing their edu-cation and to a lesser extent to those who are unemployed. This suggests that there is some intergenerational redistribution of resources within the family.
Longitudinal data will help especially to look for the consequences of the transfers in different respects (inequality, social mobility, consumption levels, etc.) They also will cap-ture the interplay between private and public transfers. Current changes in welfare policy both create and respond to new patterns of family solidarity. By following the impact of new welfare measures and pension system reforms in specific countries, the continuation of the SHARE data would enable accurate empirical tools to be developed to address the

185
Financial Transfers
important question of the complementarity or substitution of family support with public and other forms of help external to the family (Attias-Donfut and Wolff 2000). The cur-rent SHARE data allow a glimpse of these complex processes, but the full story can only be told by following the course of individuals and their families over time as they interact with the rapid social change of European societies.
ReferencesArrondel L. and A. Masson. 2001. Family Transfers Involving Three Generations. Scandinavian Journal of
Economics 103:415-443.
Attias-Donfut, C. and F. C. Wolff. 2000. Complimentarity between private and public transfers. In The Myth of
Generational Conflict: The Family and State in Ageing Societies, eds. S. Arber and C. Attias-Donfut, 47-68.
London: Routledge Kegan and Paul.
Bengtson V. L. and W. A. Achenbaum. Eds. 1993. The Changing Contract across Generations. Hawthorne,
New York: Aldine de Gruyter
Cox, D. and G. Jakubson,. 1995. The connection between public transfers and private interfamily transfers.
Journal of Public Economics 57:129-67.
Kohli M. and H. Künemund. 2003. Intergenerational transfers in the family. What motivates giving?. In Global
Aging and challenges to families, eds. Bengston and Lowenstein, 123-42. New York: Aldine de Gruyter.
186
Social and Family Context
4.4 Gifts, Inheritances and Bequest ExpectationsHendrik Jürges
IntroductionThis contribution describes the prevalence of inheritances and bequests and their role
in asset accumulation among Europe’s elderly. The SHARE data is the first data set that allows to characterise and compare inheritances and bequests across Europe. Most people receive bequests from parents and other relatives when they are between 45 and 64, i.e. in the years before they leave the labour market (see Table 4A.1 in the Appendix to this chapter). For those who inherit, intergenerational transfers are potentially a major eco-nomic resource during retirement. However, this very fact raises concerns and makes be-quests and inheritances an important issue for public policy. First, bequests raise concerns about wealth inequality and intergenerational wealth mobility. If bequests are distributed unequally and predominantly benefit households who are already wealthy, bequests, they tend to increase the society’s economic inequality. Large gifts and bequests also raise ef-ficiency concerns because non-labour income will affect individual labour supply decisions. Again, if the wealth receive the largest transfers, it is also likely that more productive indi-viduals retire relatively early.
It is shown that on aggregate, private transfers play a significant role in wealth forma-tion. About one third of all SHARE households have reported to have received gifts or inheritances worth more than €5,000 at least once (often in the form of housing), mostly from parents and parents-in-law, but also from aunts and uncles. Again, we find consider-able differences in the prevalence and distribution of inheritances across SHARE coun-tries. Future analyses of our data will link these differences to cross-national differences in inheritance and bequest laws and taxation to study the effect of different policies on the intergenerational transmission of wealth.
The contribution also describes expectations concerning future inheritances and be-quests and their relation to current household wealth. Many households, particularly among the wealthy, expect to leave sizeable bequests to their heirs. Wealthy individuals have also higher expectation of (further) inheritances.
Types and Amounts of Gifts and InheritancesSHARE respondents were asked whether they (or their spouses) ever received an inheri-
tance worth more than €5,000, in the form of money, goods, or property. Since large gifts and bequest can often serve as substitutes (Poterba 2001), we also asked them to include large gifts (exceeding €5,000). For each such gift or bequest, we asked in which year it was received and what it was worth at that time. This information is used to calculate the pres-ent value of all large gifts and inheritances (using country-specific nominal interest rates). A sizeable percentage of respondents did not report owner-occupied housing that was inherited or received as a gift in this question. In these cases I added the amount that the respondents thought they would get if they sold their house or apartment to the present value of other reported inheritances.

187
Gifts, Inheritances and Bequest Expectations
Figure 1 Distribution of received gifts and inheritances, by country
Figure 1 shows the distribution of gifts and inheritances by SHARE country (the numbers illustrated in the figures are also shown in Tables 4A.4 to 4A.7 in the Ap-pendix). country (the numbers illustrated in the figures are also shown in Tables 4A.4 to 4A.7 in the Appendix). The overall prevalence of gifts and inheritances is 30.6%, i.e. a little less than one third of all households have ever received such a transfer. Switzerland is the country with the largest prevalence (48.1%), followed by Sweden, and Denmark (about 40%). Spain, the Netherlands, and Austria are the countries with the lowest prevalence (below 25%). The distribution of transfer amounts varies much across SHARE countries. Small inheritances (between €5,000 and €50,000) are predominant in Sweden and Den-mark. About one fifth of all households have received such small inheritances, and only about 10% have received inheritances larger than €150,000. Although the prevalence of inheritances is high in both countries, the average amount is thus comparatively small. Large inheritances are predominantly found in Switzerland, Germany, and also Italy. Over-all inequality in inherited amounts is largest in Greece, where the top 10% of households received 90.5% of all inheritances, and smallest in Switzerland, where the top 10% received 71.4% of all inheritances (see Table 4A.2 in the Appendix).
One can think of at least two important reasons for large cross-national differences in bequests. The first reason might be cross-national differences in gifts and inheritance taxes, which affect actual behaviour and possibly also what respondents are willing to report in a survey interview. Allowances and tax rates vary greatly across Europe. For instance, in Austria, the allowance for a direct heir is €2,200, while it is €46,000 in France and €205,000 in Germany. Effective average tax rates for a „typical“ wealth portfolio worth €340,000 (including housing) passed on to a child are highest in Sweden (21.5%) and low-est in Germany (0.3%, see Scheffler & Spengel 2004).
The second reason for large cross-national differences in bequest amounts might be cross-national differences in the bequest of property. The proportion of households who live in housing that is either inherited or purchased with the help of the family is much higher in Southern and Western European countries than in the Netherlands or the Scan-dinavian countries (see Contribution 2.3 in this volume). Because owner-occupied housing is the largest part of total household wealth (see Contribution 6.3 in this volume), inheri-tance of housing also constitutes an important part of private transfers received.
We also asked the respondents who gave them a large gift or from whom households
PRO
PORT
ION
0.0
0.1
0.2
0.3
0.4
0.5
0.6
more than EUR 150k EUR 50-150k less than EUR 50k
ATNLESITFRGRDEDKSECH

188
Social and Family Context
have inherited. Expectedly, a large proportion of gifts and inheritances was received from the parents and parents-in-law, respectively (84.2%). Parents’ siblings are the next largest group of donors, accounting for 8.2% of all large gifts and inheritances. Other relatives, including own siblings, grandparents and children account for about 5.8%, and non-rela-tives for about 1.8% of all gifts and inheritances.
The Contribution of Gifts and Inheritances to Total WealthHow much of total household wealth is inherited and how much is saved from earned
income (life-cycle wealth)? Much of the available evidence, based on the decomposition of micro-data on household wealth into inherited wealth and life-cycle wealth, comes from the U.S. (see Davies and Shorrocks 2000, for an overview). Evidence from other countries can thus prove to be particularly interesting. However, due to space constraints, we will only give a broad indication. Since our data allows to sum up past inheritances, we are able to decompose total household wealth in two parts: the sum of past life-cycle saving and the sum of past (capitalised) inheritances. However, the figures presented below must be interpreted with some care. As in other studies, inheritances and gifts are likely to be under-reported, so that the reported ratio of inherited to total wealth is probably just some lower bound.
Figure 2 shows the mean present value of all inheritances and the mean total wealth by wealth quintile (all countries pooled). The poorest 20% of all households (i.e. those in the first wealth quintile) hold an average wealth of €4,100 but have received an average inheritance of €21,800. Thus it seems as if the poorest households have used their inheri-tances mostly for consumption. In the other four wealth groups, average total wealth is larger than average inherited wealth, i.e. the households must hold at least some life-cycle wealth. The ratio of average inherited to average total wealth drops from 93.8% in the second quintile to 30.5% in the fifth quintile. Although the richest households are those who also receive the largest inheritances (the average is €200,000), a major part of their wealth appears to be saved from earned income.
Figure 2 Average inherited and total wealth, by total wealth quintile
1000
EU
R
Average Total Wealth
0
100
200
300
400
500
600
700
5th Quintile4th Quintile3rd Quintile2nd Quintile1st Quintile
Average Inherited Wealth

189
Gifts, Inheritances and Bequest Expectations
Inheritance and Bequest ExpectationsAlthough a sizeable proportion of all SHARE households has already received a large
gift or inheritance, particularly younger respondents whose parents are still alive will ex-pect to receive (further) inheritances in the future. To learn about the respondents expecta-tions of future transfers, we asked for the chances of receiving any (further) inheritances within the next 10 years. Figure 3 shows the proportion of respondents who say that there is at least a 50% chance of receiving any inheritance and an inheritance worth more than €50,000, respectively, by household wealth. Percentages are shown separately for those who never inherited and those who have inherited at least once. The sample was restricted to respondents with at least one living parent or parent-in-law. Inheritance expectations among respondents without living parents are generally much lower than those shown in Figure 3.
Figure 3 Inheritance expectations, by household wealth (includes only respondents with at least one living parent or parent-in-law)
Figure 3 illustrates two noteworthy points. First, there is a clear positive relationship between current household wealth and reported inheritance expectations. Individuals in wealthy households expect inheritances more often than poor households. Second, indi-viduals in households who have already inherited also have higher expectations of future inheritances. Of those who never inherited and with current wealth of less than €5,000, 20% report a chance of 50% or larger of receiving any inheritance and only 10% report a positive probability of receiving an inheritance worth more than €50,000. Of those re-spondents who never inherited and with current household wealth larger than €250,000, 27% report a 50% chance or larger of any inheritance and 21% attach such chance to an inheritance larger than €50,000. It is interesting to note that households who already have inherited at least once also have higher expectations of future inheritances. In households who already have inherited, the wealth gradient in expectations continues to exist, but the percentages are 5 to 10 percentage points higher nearly everywhere. The findings in Figure 3 are in accordance with the view that inheritances predominantly benefit those who are already wealthy and they suggest that the intergenerational wealth mobility tends to be low.
Until this point we have looked at households as beneficiaries of large private transfers such as gifts and inheritances. But many households will of eventually become donors
PRO
PORT
ION
RES
PON
DEN
TS
0
10
20
30
40
50
60
Expecting inheritance > 50,000 EURExpecting any inheritance
>250k
50-2
50k
5-50
k<5k
>250k
50-2
50k
5-50
k<5k
NEVER INHERITED INHERITED AT LEAST ONCE
190
Social and Family Context
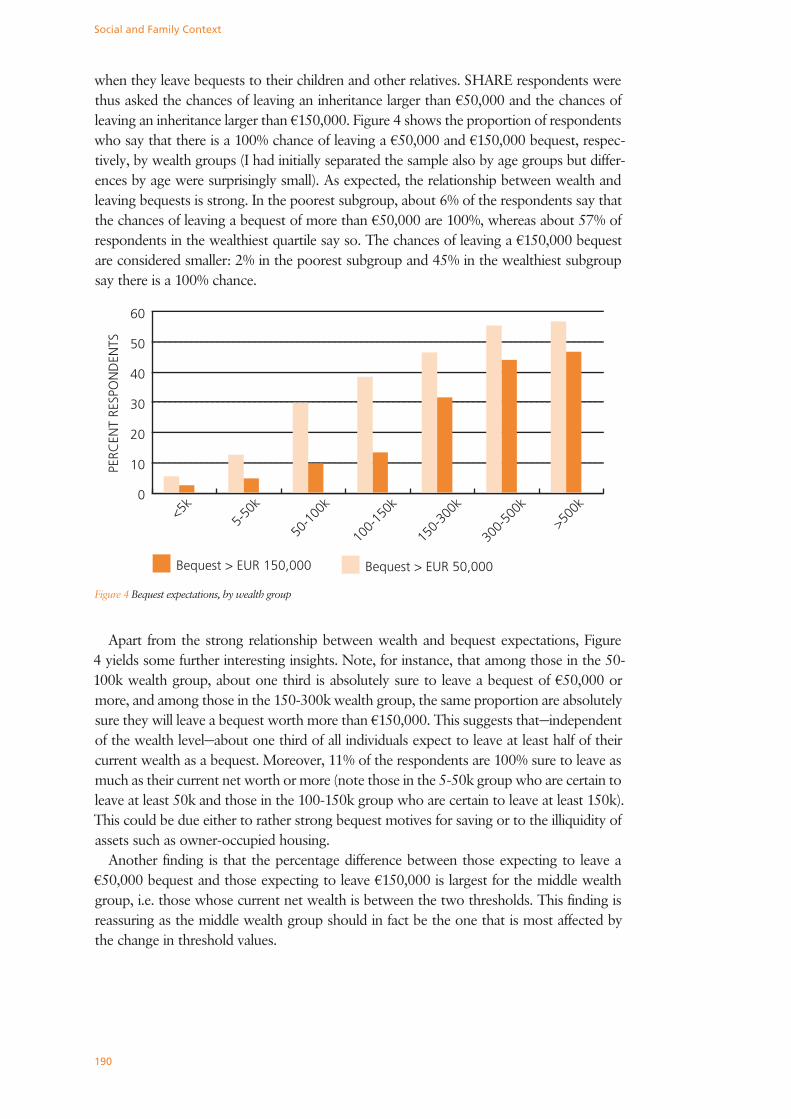
when they leave bequests to their children and other relatives. SHARE respondents were thus asked the chances of leaving an inheritance larger than €50,000 and the chances of leaving an inheritance larger than €150,000. Figure 4 shows the proportion of respondents who say that there is a 100% chance of leaving a €50,000 and €150,000 bequest, respec-tively, by wealth groups (I had initially separated the sample also by age groups but differ-ences by age were surprisingly small). As expected, the relationship between wealth and leaving bequests is strong. In the poorest subgroup, about 6% of the respondents say that the chances of leaving a bequest of more than €50,000 are 100%, whereas about 57% of respondents in the wealthiest quartile say so. The chances of leaving a €150,000 bequest are considered smaller: 2% in the poorest subgroup and 45% in the wealthiest subgroup say there is a 100% chance.
Figure 4 Bequest expectations, by wealth group
Apart from the strong relationship between wealth and bequest expectations, Figure 4 yields some further interesting insights. Note, for instance, that among those in the 50-100k wealth group, about one third is absolutely sure to leave a bequest of €50,000 or more, and among those in the 150-300k wealth group, the same proportion are absolutely sure they will leave a bequest worth more than €150,000. This suggests that—independent of the wealth level—about one third of all individuals expect to leave at least half of their current wealth as a bequest. Moreover, 11% of the respondents are 100% sure to leave as much as their current net worth or more (note those in the 5-50k group who are certain to leave at least 50k and those in the 100-150k group who are certain to leave at least 150k). This could be due either to rather strong bequest motives for saving or to the illiquidity of assets such as owner-occupied housing.
Another finding is that the percentage difference between those expecting to leave a €50,000 bequest and those expecting to leave €150,000 is largest for the middle wealth group, i.e. those whose current net wealth is between the two thresholds. This finding is reassuring as the middle wealth group should in fact be the one that is most affected by the change in threshold values.
PERC
ENT
RESP
ON
DEN
TS
0
10
20
30
40
50
60
Bequest > EUR 150,000 Bequest > EUR 50,000
>500k
300-
500k
150-
300k
100-
150k
50-1
00k
5-50
k<5k

191
Gifts, Inheritances and Bequest Expectations
SummaryThere are two ways to acquire wealth: accumulation of savings from earned income
and receiving gifts or bequests. In this contribution we have described the prevalence of in-tergenerational transfers in SHARE countries and their importance for household wealth formation. The main results are:
• Intergenerational transfers are a major source of household wealth. Across all coun-tries, about 30 percent of all households have ever received a large gift or inheritance larger than €5,000.
• The distribution of inheritances is very unequal. Only one third of all households have ever received an inheritance larger than €5,000. In terms of amounts inherited, the top 5% of households have received about two thirds of all inheritances.
• Wealthier households expect to inherit more than poorer households, which suggest that intergenerational mobility of wealth tends to be low
• Many households expect to bequeath a substantial proportion of their current wealth, which implies that they find themselves either unwilling or unable to liquidate their assets.
ReferencesDavies, J. and A. Shorrocks. 2000. The distribution of wealth. In Handbook of Income Distribution, eds. A.B.
Atkinson and F. Bourguignon, 605-75. Amsterdam: Elsevier.
Hurd, M. and J. Smith. 2001. Anticipated and Actual Bequests. In Themes in the Economics of Aging, ed. D. A.
Wise, 357-389. Chicago: University of Chicago Press.
Poterba, J. 2001. Estate and gift taxes and incentives for inter vivos giving in the US. Journal of Public Econo-
mics 79:237-264.
Spengel, C. and W. Scheffler. 2004. Erbschaftsteuerbelastung im internationalen Vergleich [International com-
parison of the inheritance tax burden]. Betriebs-Berater 59:967-974.

192
Social and Family Context
4.5 Quality of Employment and Well-BeingJohannes Siegrist, Olaf von dem Knesebeck, and Morten Wahrendorf
The Policy ChallengeEarly retirement from regular employment provides a major challenge to social and
health policy in European countries (Brugiavini 2001). As people over 60 years old will comprise up to one third of the population in several European countries in the next two decades, a shrinking number of economically active people will have to support a growing number of economically dependent elderly people. Currently, large variations in workforce participation rates are observed across European countries, e.g. in the age group 55-59. In recent years, this rate has fallen to below 20 per cent in Belgium, Italy, France and the Netherlands, to about 35 per cent in Germany and to 40 per cent in Spain, whereas this percentage is much higher in countries like Switzerland, Norway, Japan and the United States.
Therefore, a major policy challenge consists in increasing the number of regularly em-ployed people at older age by influencing the determinants of early retirement. At least three types of determinants have been identified. First, financial incentives, often in com-bination with economic pressure from employers, pension schemes with extended eligi-bility and alternative income options need to be mentioned. National policies vary quite substantially with respect to these regulations. Secondly, poor health, chronic illness and disability are important determinants of early exit from the labour market. This holds par-ticularly true for occupations where working conditions cannot be modified or adjusted to a reduced work ability of employees. Poor quality of work and employment is a third determinant of premature departure from working life. Today, this is not only the case for jobs with high ergonomic exposures and high physical work load. Rather, stressful work-ing conditions, e.g. in terms of high work pressure, monotonous jobs, poor incentives and elevated job instability influence employees‘ decision to depart from jobs as early as they can (Mein et al. 2000).
Importantly, these stressful working conditions also contribute to poor health and to the development of chronic illness, i.e. to conditions that in turn influence early retirement (Ostry et al. 2003, Schnall et al. 2000). Thus, poor quality of employment exerts both direct and indirect effects on premature retirement. Given its importance, quality of work and employment seems to be a prominent target of policy interventions as its improvement may result in increased work ability and longer maintenance of regular employment.
Although poor quality of work has been monitored across Europe in a previous panel survey (Paoli and Merllié 2001) no investigation has yet compared this topic in terms of two major theoretical concepts of health-related stressful employment, the demand-control model (Karasek et al. 1998), and the effort-reward imbalance model (Siegrist et al. 2004). The former model identifies stressful work by job task profiles characterised by high demand in combination with low control (low decision latitude), whereas the latter model claims that an imbalance between high efforts spent and low rewards received in turn (money, esteem, career prospects, job security) adversely affects health. Moreover, no comparative data so far exist on associations between stressful work and the health. In both instances, the SHARE investigation is the first one to explore these topics at an European level.
In this contribution we therefore present release 0 data from SHARE to answer the following questions:

193
Quality of Employment and Well-Being
• What is the prevalence of poor quality of employment – in terms of the two theoretical models – in the ten European countries? Can we observe a specific pattern of distribu-tion, e.g. in terms of a North-South gradient?
• To what extent does poor quality of work vary according to major socio-demographic and socio-economic factors?
• Is poor quality of work and employment associated with reduced well-being, as mea-sured by poor self-rated health and depression?
Quality of Employment Across Europe: The North-South GradientTo measure health-related stressful work a short battery of items derived from the job
content questionnaire measuring the demand-control model (Karasek et al. 1998) and from the questionnaire measuring the effort-reward imbalance model (Siegrist et al. 2004) was included in the SHARE interview. Items were selected on the basis of factor loadings on respective original scales. With regard to the first model, we restricted the measurement to the control dimension as this dimension proofed to be of particularly high predictive power in a number of studies (Karasek et al. 1998, Ostry et al. 2003, Schnall et al. 2000). Low control at work and high effort at work were measured by two items each whereas low reward was measured by five items. In this study, low quality of work in terms of low task control was defined by scoring high on the two respective Likert-scaled items (mean score > 4.5; range 2 to 8), whereas medium quality of work was defined by mean scores ranging from 4.0 to 4.5. Scores below 4.0 indicate a high degree of control at work. For within-countries analyses upper tertiles of scores were calculated for each country sepa-rately where low control at work was defined by scores in the upper tertile.
Effort-reward imbalance at work was defined by a ratio of the sum score of ‚effort‘ items in the nominator and of the adjusted sum score of ‚reward‘ items in the denomina-tor. Values greater than 1.0 were defined as indicating an imbalance between high effort and low reward, whereas values equal to or lower than 1.0 were defined as indicating a balanced state, i.e. no stressful work experience in terms of this model. Countries with more than 50% of all respondents exhibiting effort-reward imbalance (>1.0) were consid-ered as exposing workers to very poor quality of employment. Similarly, if the percentage ranged between 40 and 50, quality of work was considered to be poor. In countries with a percentage of imbalance ranging from 30 to 40 the quality of work was considered to be medium or fair whereas countries with a prevalence below 30 per cent were considered as exposing people to an overall high quality of work.
The data of this analysis are restricted to the subgroup of the SHARE baseline sam-ple who was still in regular employment or self-employed at the time of the interview (n=6,727). The age range of respondents was 50 to 65.

194
Social and Family Context
The prevalence of levels of quality of work cross the ten European countries is given in Figures 1 and 2. Figure 1 indicates country-specific levels of quality of work in terms of the effort-reward imbalance model. Very poor quality of employment is present in Greece and in Italy. In Spain, Germany and Austria, overall quality of work is still rather poor, whereas it is fair in France, Denmark and Sweden. Two countries show high overall quality of work, Netherlands and Switzerland.
A similar, although not identical picture emerges from Figure 2 where the core dimen-sion of the demand-control model, task control, is analysed. Lowest overall levels of task control at work are found in Greece and in Spain, a medium or fair level of control is ob-
Figure 1 Prevalence of low quality of work (percentage effort-reward ratio > 1.0) in ten European countries
��������������������������
���������������������������
�����������
���������������������������������

195
Quality of Employment and Well-Being
served in Italy, France, Germany and Austria, and relatively highest prevalence of work-re-lated control is obvious from data in Sweden, Denmark, the Netherlands and Switzerland.
Taken together these two indicators give some evidence of a North-South gradient of quality of employment in Europe with highest quality in northern countries (Denmark, Sweden, Netherlands) and in Switzerland, medium quality in western countries, especially France, Germany and Austria, and poorest quality in Greece, Italy and Spain.
Answers to the second question are given in Tables 4A.17 and 4A.18 (see the Appen-dix to this chapter) where the prevalence of low quality of work is stratified according to gender, age and socio-economic status (level of education) for each country. With regard to effort-reward imbalance, low quality of work is significantly more prevalent among em-ployees with low education in some, but not all countries (Sweden, Italy, Greece, Spain).
Figure 2 Quality of work in ten European countries (mean score of control at work)
��������������������������
������������������������������
�������������������������

196
Social and Family Context
No consistent gender differences are found, and differences between the three age groups (< 55, 55 – 59, ≥ 60) are not consistent either. However, this latter finding may be mainly due to the fact that the oldest group exhibits higher quality of work compared to the two younger groups (significant differences in three countries). This latter observation can be explained by a ‚healthy worker‘ effect, indicating a higher probability of continued employment up to pension age among people who are employed in more privileged jobs (see Table 4A.17).
When comparing these differences in quality of work with respect to task control, a slightly different situation appears (Table 4A.18). In this case, low education is associated with low quality of employment in a much more consistent way, if compared to the former model. Here, significant differences are found in all ten countries. On the other hand, the ‚healthy worker effect‘ is less obvious as no significant difference in the expected direction is found. To the contrary, the prevalence of low job control is significantly higher among the oldest group in at least one country (Denmark). With regard to gender, there is a slight tendency of poorer quality of work among women, compared to men (see Table 4A.18).
Given these variations between countries it is unlikely that the overall North-South gra-dient in quality of work is explained to a substantial degree by the socio-demographic and socio-economic variables under study. Yet, multivariate analyses will give a quantitative estimate of their contribution.
Strong Association Between Quality of Employment and Well-BeingThe third question concerns the frequency and strength of associations between quality
of employment and well-being, as measured by level of self-rated health and presence/ab-sence of depression. Self-rated health was assessed by a widely used Likert-scaled one item indicator measuring one‘s overall current state of health. Answers were dichotomised into good health (good or better) and poor health (less than good). The definition of depres-sion was based on a clinically validated score of the EURO-D scale of depression. Again dichotomised information (depression present versus absent) (for details see Contribution 3.5).
As indicated in Tables 4A.19 and 4A.20 (see Appendix to this chapter), strong associa-tions are evident between quality of employment and the two indicators of well-being. For instance, among employed and self-employed people with poor health, a higher percent-age is characterised by an imbalance between high effort and low reward, compared to people with good health. This difference is statistically significant in all ten countries. A similar, but somewhat weaker trend is found for low control at work (statistically signifi-cant differences in eight countries). With respect to depression, significant differences in the expected direction are observed for both indicators of poor quality of employment in five countries. Largest differences in percentage of low quality of work between those with and without depression (>20%) are evident from Germany, Denmark, Switzerland and France (Tables 4A.19 and 4A.20).
In summary, in a majority of European countries under study significant associations do exist between reported poor quality of employment, as measured by effort-reward imbal-ance and low work control, and reduced well-being, as measured by poor self-rated health and depression. These results are consistent with an impressive body of empirical findings from single countries where additional statistical adjustments for confounder control were made (for review Marmot and Siegrist 2004). Despite their robustness any interpretation of the current findings must take into account the cross-sectional study design from which

197
Quality of Employment and Well-Being
they originate. Both types of measures were based on self-reports and were assessed at one single occasion, the comprehensive SHARE baseline interview. Therefore, it cannot be excluded that part of the reported association is due to ‚common method variance‘.
This is one of the strong arguments in favour of conducting a follow-up study of the SHARE sample. A prospective study design would enable us to test a causal association between quality of work at baseline and reduced well-being at follow-up. Moreover, the direct and indirect effects of low quality of employment and poor health on early retire-ment could be estimated in a follow-up study as substantial number of employees of this age group is expected to retire during a observation period of several years. In view of the policy implications of such findings which would be available for the first time at the European level, a longitudinal analysis of SHARE is considered a high priority task.
ConclusionsIn this contribution, release 0 data from the baseline SHARE investigation were used
to answer three questions that are relevant for an improved understanding of the reasons of early retirement from work in European countries. First, as poor quality of employment has been found to influence premature departure from working life, it was of interest to know how large the proportion of employed and self-employed people in different coun-tries is that is characterised by low quality of employment. We used two theory-based indicators of quality of employment, the degree of task control and the mismatch between high efforts spent and low rewards received in turn. Substantial variations were found across Europe, with clear indication of a North-South gradient where quality of work was higher in northern and lower in southern European countries. Although it is premature to explain this gradient it might well be that, overall, occupational health and safety standards are more developed and more often applied in northern European countries and that qual-ity of work has become a topic of explicit policy concern more often there.
Secondly, we were interested in knowing to what extent poor quality of employment varies according to major socio-demographic and socio-economic factors across the ten countries under study where gender, age and level of education were explored. In almost all countries low level of education was found to be associated with poor quality of work. Similar findings resulted from analysis based on additional socio-economic indicators, in-come and occupational position (not reported in detail). Associations with age and gender were less consistent. Although results of multivariate analyses are not yet available it is unlikely that socio-demographic and socio-economic factors can explain the reported North-South gradient in quality of work to a substantial extent.
The third question concerned the link between quality of employment and well-be-ing. Respective evidence is important in view of the direct and indirect effects on early retirement produced by stressful working conditions. In fact, substantial associations were found in a majority of countries for both indicators of reduced well-being, poor self-rated health and depression.
In conclusion, the essential findings are as follows:
• Quality of employment (low control at work, mismatch between high effort and low reward) varies considerably across European countries, with a clear North-South gra-dient (relatively high in Nordic countries, Switzerland and Netherlands; relatively low in Spain, Italy and Greece).

198
Social and Family Context
• Quality of employment is strongly associated with socio-economic status (educational degree) in almost all European countries: better quality of employment goes along with better education.
• Quality of employment is strongly associated with well-being in all European coun-tries: lower quality of employment goes along with higher prevalence of poor self-rated health and depression.
Although further evidence derived from longitudinal data is warranted these first re-sults support the conclusion that policy efforts at country level and at the European level need to be strengthened that aim at improving the quality of employment. This aim can be reached by enlarging the amount of control and autonomy at work and by matching efforts required from working people with rewards provided to them. In this latter case, measures include non-monetary gratifications as well as improved opportunities of job promotion, qualification and job security. Creating a healthy older work force in Europe remains a policy goal of high priority.
ReferencesBrugiavini, A. 2001. Early retirement in Europe. European Review 9:501-515.
Karasek, R., C. Brisson, N. Kawakami, I. Houtman, P. Bongers, and B. Amick. 1998. The job content question-
naire ( JCQ): an instrument for internationally comparative assessment of psychosocial job characteristics.
Journal of Occupational Health Psychology 3:322-355.
Marmot, M. and J. Siegrist. 2004. Health inequalities and the psychosocial environment – two scientific chal-
lenges. Social Science & Medicine 58:1461-1574.
Mein, G., P. Martikainen, S. A. Stansfeld, E. J. Brunner, R. Fuhrer, and M. Marmot. 2000. Predictors of early
retirement in British civil servants. Age and Ageing 29:529-536.
Ostry, A.S., S. Kelly, P. A. Demers, C. Mustard, and C. Hertzman. 2003. A comparison between the effort-
reward imbalance and demand-control models. BMC Public Health 3:10-27.
Paoli, P. and D. Merllié. 2001. Third European Survey on Working Conditions 2000. Luxemburg: European
Foundation for the Improvement of Living and Working Conditions.
Schnall, P.L., K. Belkic, P. Landsbergis, and D. Baker. 2000. The workplace and cardiovascular disease.
Occupational Medicine. State of the Art Reviews 15:1-374.
Siegrist, J., D. Starke, T. Chandola, I. Godin, M. Marmot, I. Niedhammer, and R. Peter. 2004. The measurement
of effort-reward imbalance at work: European comparisons. Social Science & Medicine 58:1483-1499.

199
Quality of Life and Well-Being
4.6 Quality of Life and Well-BeingOlaf von dem Knesebeck, Martin Hyde, Paul Higgs, Alexandra Kupfer, and Johannes Siegrist
Why Measuring Quality of Life in Early Old Age?One of the innovations of SHARE is the inclusion of a newly developed measure of
quality of life in early old age. This innovation is important because the majority of people living in the so called third age are in good health and capable of participating in a variety of activities. It has been repeated again and again that adding life to years is as important as adding years to life. Thus, a measure is needed that identifies and quantifies those aspects of quality of life in early old age that are specific to a stage in the life course characterised by transition from work to retirement, by an increase of personal freedom and by new options of social participation.
In several studies, quality of life was shown to improve health and to promote active ageing. Yet, the degree of this quality critically depends on people’s socio-economic cir-cumstances above and beyond their health status. Poverty, deprivation and chronic social stress go along with poor quality of life, and, thus, reduce the chances of experiencing its beneficial effects (Marmot et al. 2003, Motel-Klingebiel et al. 2004). In this contribution, the following questions are addressed:
• What is the prevalence of the different levels of quality of life in early old age in Euro-pean countries under study? Can we identify a specific pattern of distribution across countries, e.g. in terms of a North-South gradient?
• How strong is the association between quality of life in early old age on the one hand and socio-demographic and socio-economic conditions on the other hand? In particu-lar, are there differences according to age, education and income? Do these associa-tions vary across countries?
• How strong is the association between quality of life in early old age and health? Does it vary across countries?
Answers to these questions are important because respective information may draw our attention to country-specific or other (socio-economic, health-related) obstacles against successful and sustainable implementation or strategies of active ageing across Europe.
Before answering these questions we explain how quality of life in early old age has been measured. Our approach assumes that quality of life should be assessed as the degree to which human needs are satisfied. In this stage of the life course the following domains of need seem to be particularly relevant: control, autonomy, self-realisation, and pleasure. Control is understood as the ability to actively intervene in one’s environment (Patrick et al. 1993). Autonomy is defined as the right of an individual to be free from the unwanted interference of others (Patrick et al. 1993). Self-realisation and pleasure aim to capture the active and reflexive processes of being human (Turner 1995). Following Doyal and Gough (1991), our approach treats these four domains as equal rather than hierarchically organised.
The operationalisation of these concepts was performed in a measurement approach termed CASP-19 (C=control, A=autonomy, S=self-realisation, P=pleasure; and 19 refers to the sum of 19 Likert-scaled items measuring these concepts on uni-dimensional scales).

200
Social and Family Context
The measurement approach is described in detail elsewhere (Hyde et al. 2003). In sum-mary, the measure displays satisfying internal consistency of the scales, reasonable inter-correlations and high second order factor loadings.
In response to a request for a quality of life measure for consideration for SHARE an abridged version of the CASP-19 was designed. To do so the statistical analysis used to produce the original scale were replicated. Internal consistency analyses revealed those items with the lowest item whole correlations within each of the domains. By removing the item with the lowest value for the Control domain and the two items with the lowest values for each of the other domains we were able to reduce each of the domains to three items each without too great a loss to their internal reliability (Cronbach’s alpha varying from 0.56 to 0.76). A second order factor analysis confirmed quality of life as a single latent factor. The CASP-12 correlated highly with the CASP-19 and the Life Satisfaction Index, a measure of concurrent validity (Blane et al. 1999) which was also included in the original study mentioned above.
CASP-12 has been incorporated in the self-completion questionnaire. Respondents were asked, how often they experience certain feelings and situations on a 4-point scale ranging from ‘never’ to ‘often’. For the total score of CASP-12 values range from 12 to 48, with higher scores indicating better quality of life. These scores are subsequently classified into four levels of quality of life (QL), where 39-41 indicates very high QL, 37-39 high QL, 35-37 moderate QL and values below 35 low QL.
North-South Gradient of Quality of LifeAn answer to the first question of whether a specific pattern of distribution of qual-
ity of life can be identified is given in Figure 1. As can be seen, quality of life scores are comparatively low in Greece, Italy, and Spain and comparatively high in Switzerland, the Netherlands and Denmark. Differences between countries are highly significant (p< 0.001) according to the Kruskal-Wallis Test. Thus, there is evidence of a North-South gradient in degree of quality of life across the European countries under study.
This general pattern is also obvious for the mean scores of the four sub-domains men-tioned above. Respective figures are given in Table 4A.21 (see Appendix).
As can be seen in Table 4A.22 (see Appendix), gender differences in quality of life are small in most countries. These differences are significant (p<0.01) only in Italy, Spain and Greece. However, consistent age differences are obvious and significant in all countries.
In the SHARE study, we were interested in generational differences of quality of life, in particular in the question of whether these differences between the youngest and the old-est age group of participants follow a specific pattern across Europe. Figure 2 shows that, in fact, these differences are largest in southern European countries (mean difference > 3) and smaller in northern and Central European countries (mean difference < 2). In other words, age is associated differentially with quality of life across Europe, with particularly low levels in the oldest age groups in southern Europe. The North-South gradient is less pronounced in younger old age. It is tempting to interpret this finding with respect to the way of how quality of life has been conceptualised in this study. As mentioned above, a special focus is put on needs of autonomy, self-realisation and control, norms that are in accordance with modernisation and individualisation of life and that may be less frequent among older people in southern countries where traditional ways of life (family and com-munity structures) still prevail.

201
Quality of Life and Well-Being
Figure 1 Quality of Life (QL) in nine European countries (CASP-12: means)
������������������ ������������������� ������������������
Figure 2 Mean differences in Quality of Life (QL) between youngest and oldest age groups in nine European countries
������������
������������������
����������������� �������������

202
Social and Family Context
Differences According to Socio-Economic and Health StatusIn the second question we were not only interested in age differences, but equally so in
socio-economic differences in quality of life across Europe. To this end, Table 4A.23 (see Appendix) shows the quality of life mean scores by education and equivalence household income. As can be seen, people with high education (upper secondary or tertiary accord-ing to the International Standard Classification ISCED-97) report a better quality of life in most countries compared to those with low education (primary or lower secondary). These differences are statistically significant except for Switzerland. Furthermore, we ob-serve a strong income gradient of quality of life. Differences between the three income groups are significant in all countries.
To explore the third question, that is the relationship between quality of life and health, the following five indicators of health and well-being were analysed: Limitations in ac-tivities of daily living (ADL), self-rated health, number of chronic diseases, number of symptoms, and depression defined according to the EURO-D scale (see Contribution 3.5). Figure 3 shows for every health indicator a significant difference in quality of life: Better health is consistently associated with better quality of life. Importantly, this holds true for all nine countries.
ConclusionsThis contribution presents results of a new measure of quality of life in older age based
on release 0 data from the baseline SHARE investigation. Although evidence is currently restricted to cross-sectional data several robust findings emerge that are relevant both to science and policy:
Figure 3 CASP-12 for different health indicators (all countries: means)
��
��
��
��
��
��
��
��
��
��
��
��������������������������������
���������������
������������������
�����������������
�������������
����� ��� ����� �� �� ��� �� ���

203
Quality of Life and Well-Being
• We observe cross national variations in quality of life that are consistent with North-South gradient across Europe (relatively low levels of quality of life in GR, ES and IT; relatively high levels in CH, NE and DK)
• The differences in quality of life between youngest and oldest age groups (lower qual-ity of life with older age) are relatively large in southern European countries.
• Quality of life is consistently associated with socio-economic status (educational de-gree and income).
• Quality of life is clearly related to indicators of health: better health goes along with better quality of life in all European countries under study.
It will be an important aim to follow the SHARE cohort prospectively in order to test to what extend these associations are causal. This latter evidence will be important to develop and direct measures of active ageing policies across Europe.
ReferencesBlane, D.B., L. R. Berney, G. D. Smith, D. J. Gunnel, and P. Holland. 1999. Reconstructing the Lifecourse;
Health During Early Old Age in a Follow Up Study Based on the Boyd Orr Cohort. Public Health, 113:117-
124.
Doyal, L., and I. Gough. 1991. A Theory of Human Need. Hong Kong: Macmillan.
Hyde, M., R. D. Wiggins, P. Higgs, and D. B. Blane. 2003. A Measure of Quality of Life in Early Old Age: The
Theory, Development and Properties of a Needs Satisfaction Model (CASP-19). Aging and Mental Health,
7:186–194.
Marmot, M., J. Banks, R. Blundell, C. Lessof, and J. Nazroo,. 2003: Health, Wealth and Lifestyles of the Older
Population in England: The 2002 English Longitudinal Study of Ageing. London: The Institute for Fiscal
Studies.
Motel-Klingebiel, A., H. J. von Kondratowitz, and C. Tesch-Römer. 2004. Social Inequality in the Later Life:
Cross-National Comparison of Quality of Life. European Journal of Ageing, published online 6 November
2004.
Patrick, B.C., E. U. Skinner, and J. P. Connell. 1993. What Motivates Children’s Behaviour and Emotion in the
Academic Domain? Journal of Personality and Social Psychology, 65:781-791.
Turner, B. 1995. Aging and Identity. Some Reflections on the Somatisation of the Self. In Images of Aging, ed.
M. Featherstone, A. Wernick, 245-260. London: Routledge.

APPENDIXTables on Social and Family Context
Table 4A.1 Age at Receipt of Inheritance, by Country (in percent) Age group Country <25 25-34 35-44 45-54 55-64 65-74 75-89 N SE 1.84 7.82 17.81 34.19 27.27 7.66 3.40 775 DK 1.94 6.34 14.44 39.84 27.70 8.38 1.38 521 DE 4.79 9.77 18.05 35.12 25.42 5.29 1.57 719 NL 2.92 6.82 22.87 35.73 23.84 5.99 1.82 618 FR 2.00 8.67 13.32 32.62 24.69 15.69 3.00 310 CH 2.10 8.88 16.05 36.06 26.61 7.77 2.53 436 AT 8.30 16.60 20.00 27.92 18.11 7.55 1.51 279 IT 3.13 6.78 24.67 33.39 23.65 7.27 1.10 373 ES 3.54 7.19 27.82 36.63 18.03 4.99 1.81 295 GR 5.78 17.04 28.12 28.42 14.71 5.73 0.20 439 Note: N is the number of inheritances
Table 4A.2 Percentage of Inherited Amounts of the Top 10%, 5%, and 1% of All Households, by Country
Country Top 10% Top 5% Top 1% N SE 79.4 65.2 32.4 1,423 DK 78.8 62.2 30.9 1,134 DE 73.2 56.6 26.2 1,554 NL 83.4 67.0 28.3 1,465 FR 87.3 72.4 33.1 1,012 CH 71.4 52.0 24.2 705 AT 85.5 70.6 34.5 1,459 IT 83.2 66.3 32.2 1,369 ES 88.7 76.7 39.5 964 GR 90.5 76.3 32.3 1,475
Table 4A.3 Distribution of Donors, by Country (in percent)Country Parents Parents’
siblingsOther relatives Non-relatives N
SE 78.20 11.23 8.56 2.01 775 DK 82.82 7.91 7.54 1.73 521 DE 81.80 9.32 6.27 2.62 719 NL 78.84 12.40 7.06 1.70 618 FR 87.07 6.15 4.84 1.94 310 CH 84.19 7.26 6.47 2.07 436 AT 79.35 8.50 8.50 3.64 279 IT 86.00 8.41 4.90 0.69 373 ES 92.45 3.71 3.83 0.00 295 GR 87.46 6.42 5.13 1.00 439 Note: N is the number of inheritances

Table 4A.4 Distribution of Received Gifts and Inheritances, by CountryCountry €5-€50k €50-€150k More than €150k Any
Inheritance >€5k CH 12.6 13.2 22.3 48.1 SE 19.3 10.3 11.5 41.1 DK 18.4 10.2 10.4 39.0 DE 9.0 8.3 15.5 32.8 GR 8.4 9.7 12.9 31.0 FR 9.4 7.3 11.4 28.1 IT 7.5 6.0 14.1 27.7 ES 8.5 7.4 9.1 24.9 NL 11.0 7.1 6.2 24.4 AT 4.7 7.7 11.7 24.1
Table 4A.5 Average Inherited and Total Wealth, by Total Wealth QuintileHousehold wealth quintile
Average Inherited Wealth (in €1,000)
Average Total Wealth (in €1,000)
1st Quintile 21.8 4.1 2nd Quintile 46.6 49.7 3rd Quintile 82.2 130.4 4th Quintile 110.3 240.6 5th Quintile 200.6 660.5
Table 4A.6 Proportion of Respondents with at Least 50% Chance of Receiving an Inheritance, by Household Wealth (only respondents with living parent or parent-in-law)
Never inherited Inherited at least once Total household wealth (in €1,000)
Expecting any inheritance
Expectinginheritance> €50,000
Expecting any inheritance
Expectinginheritance> €50,000
<5 20.1 9.8 38.1 18.1 5-50 30.8 12.1 30.7 19.6 50-250 30.0 15.8 39.6 21.3 >250 36.7 20.7 48.2 28.3
Table 4A.7 Proportion of Respondents with 100% Chance of Leaving a Bequest, by Household Wealth (only respondents with living parent or parent-in-law)
Total household Proportion of respondents reporting 100% chance of leaving: Wealth (in €1,000) Bequest > €50,000 Bequest > €150,000 <5 5.4 2.4 5-50 12.5 4.7 50-100 29.7 9.6 100-150 38.3 13.3 150-300 46.4 31.5 300-500 55.3 43.9 >500 56.6 46.6

Tab
le 4
A.8
M
arita
l Sta
tus (
perc
enta
ges)
Tota
l
50-5
9
60
-69
70-7
9
80
+M
en
Wom
enTo
tal
M
en
Wom
enTo
tal
M
en
Wom
enTo
tal
M
en
Wom
enTo
tal
M
en
Wom
en
Tota
l
Swed
en
Mar
ried,
livi
ng w
ith sp
ouse
65
.0
48.8
56
.3
63.5
58
.1
60.8
72
.6
61.2
66
.7
67.8
42
.5
53.4
49
.8
18.0
29
.8
R
egis
tere
d pa
rtner
ship
10
.1
5.7
7.7
15.6
9.
2 12
.4
9.8
7.3
8.5
5.2
2.5
3.6
1.4
.0
.5
M
arrie
d, se
para
ted
f. sp
ouse
1.
2 .5
.8
1.
2 .6
.9
.9
.0
.4
1.
8 .3
1.
0 1.
4 1.
1 1.
2
Nev
er m
arrie
d 7.
0 6.
8 6.
9 8.
8 9.
0 8.
9 5.
2 5.
2 5.
2 5.
4 2.
7 3.
9 5.
7 10
.3
8.6
D
ivor
ced
8.8
14.4
11
.8
9.9
19.8
14
.9
8.7
13.6
11
.2
7.8
11.9
10
.1
5.7
8.7
7.6
W
idow
ed
7.8
23.9
16
.5
1.0
3.2
2.1
2.9
12.8
8.
0 12
.1
40.2
28
.1
35.9
61
.9
52.2
Den
mar
k
Mar
ried,
livi
ng w
ith sp
ouse
68
.2
53.0
60
.0
67.7
65
.1
66.3
72
.2
62.8
67
.4
68.0
43
.0
54.2
50
.8
14.4
26
.0
R
egis
tere
d pa
rtner
ship
.3
.4
.4
.4
.8
.6
.4
.0
.2
.0
.0
.0
.0
.0
.0
Mar
ried,
sepa
rate
d f.
spou
se
1.7
1.3
1.5
1.0
2.0
1.5
.9
.4
.6
2.6
2.3
2.4
7.5
.0
2.4
N
ever
mar
ried
8.4
5.7
7.0
13.3
9.
3 11
.2
5.2
1.2
3.2
6.6
4.7
5.6
.0
6.5
4.4
D
ivor
ced
12.6
14
.0
13.3
15
.5
16.9
16
.2
12.3
17
.2
14.8
8.
5 8.
8 8.
6 7.
7 7.
1 7.
3
Wid
owed
8.
8 25
.6
17.8
2.
1 6.
0 4.
1 9.
0 18
.4
13.8
14
.3
41.2
29
.2
34.0
72
.0
59.9
Ger
man
y
Mar
ried,
livi
ng w
ith sp
ouse
73
.4
52.7
62
.0
71.4
66
.7
69.1
74
.0
64.5
69
.0
76.9
44
.4
57.4
73
.4
9.8
24.9
Reg
iste
red
partn
ersh
ip
.1
.3
.2
.0
.2
.1
.0
.4
.2
.4
.2
.3
.0
.6
.4
M
arrie
d, se
para
ted
f. sp
ouse
1.
0 1.
6 1.
4 1.
6 3.
5 2.
5 1.
1 1.
4 1.
2 .0
.7
.4
.0
.0
.0
Nev
er m
arrie
d 8.
7 6.
1 7.
3 10
.9
6.1
8.6
10.1
4.
7 7.
3 4.
3 8.
1 6.
6 .0
6.
1 4.
7
Div
orce
d 8.
8 9.
8 9.
3 14
.4
15.4
14
.9
7.3
9.5
8.5
1.5
6.2
4.3
1.3
3.5
3.0
W
idow
ed
7.9
29.5
19
.8
1.7
8.1
4.8
7.5
19.5
13
.8
16.8
40
.4
31.0
25
.4
80.0
67
.1
Net
herla
nds
M
arrie
d, li
ving
with
spou
se
75.6
55
.9
64.9
76
.6
71.2
73
.8
80.6
62
.6
71.3
75
.3
42.6
56
.7
50.9
21
.4
29.8
Reg
iste
red
partn
ersh
ip
3.6
2.6
3.0
6.2
5.2
5.7
2.5
2.0
2.2
.9
.0
.4
.0
.0
.0
Mar
ried,
sepa
rate
d f.
spou
se
1.1
1.6
1.4
1.2
.9
1.0
.6
2.3
1.4
.5
2.1
1.4
2.1
1.2
1.4
N
ever
mar
ried
6.4
6.8
6.6
8.0
6.8
7.4
5.8
5.3
5.5
3.3
7.5
5.7
5.2
9.3
8.1
D
ivor
ced
4.6
7.4
6.1
5.8
9.4
7.6
4.4
9.0
6.8
1.9
5.3
3.8
2.1
1.2
1.4
W
idow
ed
8.8
25.6
18
.0
2.3
6.6
4.5
6.1
18.8
12
.7
18.1
42
.5
31.9
39
.7
67.0
59
.2

Tab
le 4
A.8
(con
t.)M
arita
l Sta
tus
Tota
l
50-5
9
60
-69
70-7
9
80
+ M
en
Wom
enTo
tal
M
en
Wom
enTo
tal
M
en
Wom
enTo
tal
M
en
Wom
enTo
tal
M
en
Wom
en
Tota
l
Fran
ce
Mar
ried,
livi
ng w
ith sp
ouse
77
.5
56.6
66
.1
80.5
68
.3
73.9
76
.1
64.3
70
.0
78.7
50
.0
62.8
63
.6
18.8
34
.6
R
egis
tere
d pa
rtner
ship
.0
.0
.0
.0
.0
.0
.0
.0
.0
.0
.0
.0
.0
.0
.0
Mar
ried,
sepa
rate
d f.
spou
se
1.5
1.0
1.2
.8
1.7
1.3
3.0
.9
1.9
.0
.0
.0
3.6
1.0
1.9
N
ever
mar
ried
7.5
7.4
7.4
8.0
8.6
8.3
5.6
5.6
5.6
10.3
5.
7 7.
8 5.
5 9.
9 8.
3
Div
orce
d 8.
4 9.
0 8.
7 10
.3
13.4
12
.0
12.2
9.
4 10
.7
1.9
4.7
3.5
3.6
4.0
3.8
W
idow
ed
5.1
26.1
16
.6
.4
7.9
4.4
3.0
19.7
11
.7
9.0
39.6
25
.9
23.6
66
.3
51.3
Switz
erla
nd
Mar
ried,
livi
ng w
ith sp
ouse
76
.3
56.6
65
.7
76.9
68
.1
72.5
82
.0
58.0
69
.4
73.7
51
.0
61.0
64
.5
28.6
40
.9
R
egis
tere
d pa
rtner
ship
1.
5 .4
.9
2.
6 .6
1.
6 .8
.8
.8
1.
1 .0
.5
.0
.0
.0
Mar
ried,
sepa
rate
d f.
spou
se
1.9
2.7
2.3
3.5
5.1
4.3
.8
2.2
1.6
.0
1.0
.6
2.6
.0
.9
N
ever
mar
ried
6.0
6.0
6.0
7.0
5.4
6.2
4.0
8.0
6.1
6.4
3.0
4.5
5.1
7.1
6.4
D
ivor
ced
7.7
10.1
9.
0 8.
4 14
.2
11.3
9.
2 9.
7 9.
5 4.
1 8.
5 6.
6 2.
4 1.
7 1.
9
Wid
owed
6.
5 24
.3
16.0
1.
6 6.
6 4.
1 3.
2 21
.3
12.7
14
.7
36.5
26
.9
25.4
62
.6
49.8
Aus
tria
M
arrie
d, li
ving
with
spou
se
75.4
46
.0
59.1
75
.0
62.9
68
.6
81.7
51
.3
65.5
71
.0
30.4
47
.7
52.2
9.
6 21
.8
R
egis
tere
d pa
rtner
ship
.0
.0
.0
.0
.0
.0
.0
.0
.0
.0
.0
.0
.0
.0
.0
Mar
ried,
sepa
rate
d f.
spou
se
2.1
2.1
2.1
2.2
2.7
2.4
1.9
3.0
2.5
2.5
.4
1.3
.0
.8
.6
N
ever
mar
ried
7.5
9.5
8.6
10.9
11
.4
11.1
5.
9 8.
3 7.
1 4.
9 8.
3 6.
9 8.
7 11
.2
10.5
Div
orce
d 6.
2 10
.5
8.6
9.1
14.1
11
.7
5.3
13.0
9.
4 3.
7 5.
4 4.
7 2.
2 4.
0 3.
5
Wid
owed
8.
8 31
.9
21.6
2.
9 9.
0 6.
1 5.
3 24
.5
15.5
17
.9
55.4
39
.5
37.0
74
.4
63.6
Italy
M
arrie
d, li
ving
with
spou
se
80.8
54
.5
66.2
79
.6
78.7
79
.2
86.2
60
.7
71.8
80
.4
36.8
55
.1
64.4
18
.5
32.3
Reg
iste
red
partn
ersh
ip
1.4
.5
.9
1.6
1.7
1.6
1.3
.0
.6
1.0
.0
.4
2.2
.0
.6
Mar
ried,
sepa
rate
d f.
spou
se
1.9
1.4
1.6
2.6
3.2
2.9
2.7
1.3
2.0
.1
.0
.0
.0
.0
.0
N
ever
mar
ried
5.7
10.7
8.
5 8.
3 6.
6 7.
4 5.
5 5.
4 5.
4 3.
5 12
.2
8.6
.4
29.4
20
.7
D
ivor
ced
2.1
2.1
2.1
3.1
1.2
2.2
1.7
3.3
2.6
1.3
1.3
1.3
.0
2.9
2.0
W
idow
ed
8.2
30.8
20
.8
4.8
8.6
6.7
2.6
29.3
17
.6
13.7
49
.6
34.5
33
.1
49.2
44
.4

Tab
le 4
A.8
(con
t.)M
arita
l Sta
tus
Tota
l
50-5
9
60
-69
70-7
9
80
+ M
en
Wom
enTo
tal
M
en
Wom
enTo
tal
M
en
Wom
enTo
tal
M
en
Wom
enTo
tal
M
en
Wom
en
Tota
l
Spai
n
Mar
ried,
livi
ng w
ith sp
ouse
75
.8
57.8
65
.4
74.7
78
.4
76.6
84
.9
67.2
75
.0
77.1
48
.3
60.1
53
.2
17.3
27
.8
R
egis
tere
d pa
rtner
ship
1.
3 .4
.8
3.
3 .8
2.
0 .0
.0
.0
.0
.5
.3
.0
.0
.0
Mar
ried,
sepa
rate
d f.
spou
se
1.5
2.3
2.0
1.0
2.1
1.6
.3
4.2
2.5
2.9
1.5
2.1
3.7
.9
1.7
N
ever
mar
ried
11.0
7.
1 8.
8 15
.2
7.3
11.0
9.
5 5.
2 7.
1 5.
5 6.
4 6.
0 13
.9
11.3
12
.0
D
ivor
ced
2.1
1.9
2.0
2.8
4.4
3.7
.0
1.9
1.0
2.5
.0
1.0
.0
.0
.0
W
idow
ed
8.3
30.5
21
.2
2.9
7.0
5.1
5.2
21.5
14
.3
12.1
43
.2
30.4
29
.2
70.5
58
.4
Gre
ece
M
arrie
d, li
ving
with
spou
se
83.2
52
.0
66.2
88
.3
75.3
81
.6
82.7
51
.5
66.1
83
.9
39.4
58
.5
60.8
9.
5 28
.0
R
egis
tere
d pa
rtner
ship
.1
.0
.0
.0
.0
.0
.0
.0
.0
.5
.0
.2
.0
.0
.0
Mar
ried,
sepa
rate
d f.
spou
se
.7
1.3
1.1
.9
2.1
1.5
1.0
1.5
1.2
.0
.3
.2
1.3
.9
1.1
N
ever
mar
ried
4.6
4.7
4.7
6.5
5.5
6.0
5.6
5.7
5.6
1.6
4.2
3.1
.0
1.6
1.0
D
ivor
ced
3.6
4.3
4.0
4.3
5.9
5.1
4.4
6.2
5.4
.9
1.7
1.4
1.0
.0
.4
W
idow
ed
7.7
37.7
24
.0
.0
11.2
5.
7 6.
2 35
.2
21.6
13
.0
54.4
36
.6
36.9
87
.9
69.6
Tota
l
Mar
ried,
livi
ng w
ith sp
ouse
76
.1
54.3
64
.0
75.7
71
.1
73.4
78
.9
62.6
70
.2
77.6
43
.6
57.8
62
.3
15.4
29
.2
R
egis
tere
d pa
rtner
ship
1.
1 .6
.8
1.
8 1.
2 1.
5 .7
.5
.6
.6
.2
.4
.5
.2
.3
Mar
ried,
sepa
rate
d f.
spou
se
1.4
1.6
1.5
1.6
2.6
2.1
1.6
1.7
1.6
.6
.6
.6
1.7
.4
.8
N
ever
mar
ried
7.7
7.5
7.6
9.9
7.1
8.5
7.5
5.2
6.3
5.3
7.9
6.8
4.2
12.4
10
.0
D
ivor
ced
6.1
6.9
6.5
8.7
10.2
9.
5 6.
0 7.
5 6.
8 2.
1 4.
0 3.
2 1.
7 2.
9 2.
6
Wid
owed
7.
6 29
.1
19.5
2.
3 7.
8 5.
1 5.
3 22
.5
14.5
13
.8
43.7
31
.1
29.5
68
.7
57.1
Note:
Sur
vey
of H
ealth
, Age
ing
and
Ret
irem
ent 2
004.
Rel
ease
0, w
eigh
ted

Tab
le 4
A.9
N
umbe
r of
Liv
ing
Gen
erat
ions
(per
cent
ages
)
Tota
l
50-5
9
60
-69
70-7
9
80
+ M
en
Wom
enTo
tal
M
en
Wom
enTo
tal
M
en
Wom
enTo
tal
M
en
Wom
enTo
tal
M
en
Wom
en
Tota
l
Swed
en
Five
gen
erat
ions
.2
.2
.2
.5
.0
.2
.0
.7
.4
.0
.0
.0
.0
.0
.0
Fo
ur g
ener
atio
ns
19.4
29
.9
25.0
21
.3
30.2
25
.8
14.8
19
.7
17.3
14
.7
23.6
19
.8
31.5
52
.2
44.5
Th
ree
gene
ratio
ns
57.4
48
.8
52.8
49
.3
44.3
46
.8
63.5
62
.2
62.8
69
.0
57.5
62
.5
52.7
25
.8
35.9
Tw
o ge
nera
tions
16
.6
12.4
14
.3
24.3
22
.1
23.2
15
.7
10.5
13
.0
7.6
6.4
6.9
5.7
3.8
4.6
O
ne g
ener
atio
n 6.
4 8.
7 7.
7 4.
7 3.
3 4.
0 6.
0 6.
9 6.
4 8.
6 12
.5
10.8
10
.0
18.1
15
.1
Den
mar
k
Five
gen
erat
ions
.1
.2
.2
.0
.0
.0
.5
.4
.4
.0
.4
.2
.0
.0
.0
Four
gen
erat
ions
18
.1
25.2
21
.9
20.6
26
.6
23.7
14
.1
13.8
14
.0
11.0
19
.2
15.5
39
.8
52.1
48
.2
Th
ree
gene
ratio
ns
57.0
53
.6
55.2
47
.6
51.5
49
.5
65.8
68
.1
66.9
67
.1
61.2
63
.9
47.8
22
.4
30.5
Tw
o ge
nera
tions
16
.6
13.3
14
.8
25.2
18
.2
21.6
12
.2
12.3
12
.2
8.2
7.0
7.6
5.0
8.4
7.3
O
ne g
ener
atio
n 8.
3 7.
7 8.
0 6.
7 3.
7 5.
2 7.
5 5.
3 6.
4 13
.6
12.2
12
.8
7.4
17.1
14
.0
Ger
man
y
Five
gen
erat
ions
.1
.5
.3
.0
.2
.1
.2
.4
.3
.0
1.
2 .7
.0
.0
.0
Fo
ur g
ener
atio
ns
11.0
22
.4
17.3
13
.2
21.7
17
.3
7.3
11.4
9.
5 9.
7 22
.7
17.5
24
.1
48.2
42
.4
Th
ree
gene
ratio
ns
51.3
48
.6
49.8
39
.3
46.4
42
.8
54.6
58
.6
56.7
68
.6
50.8
57
.9
57.5
27
.7
34.8
Tw
o ge
nera
tions
25
.9
16.9
20
.9
38.9
26
.1
32.7
22
.4
18.8
20
.5
11.4
8.
6 9.
7 5.
7 6.
1 6.
0
One
gen
erat
ion
11.8
11
.6
11.7
8.
6 5.
5 7.
1 15
.5
10.8
13
.0
10.3
16
.7
14.1
12
.7
18.0
16
.7
Net
herla
nds
Fi
ve g
ener
atio
ns
.1
.1
.1
.0
.0
.0
.0
.3
.1
.5
.0
.2
.0
.4
.3
Four
gen
erat
ions
12
.0
17.7
15
.1
11.5
14
.9
13.2
9.
6 13
.7
11.7
12
.2
10.8
11
.4
28.2
45
.0
40.1
Th
ree
gene
ratio
ns
55.7
56
.1
55.9
44
.3
49.9
47
.2
64.1
66
.6
65.3
74
.3
69.8
71
.7
45.6
33
.0
36.7
Tw
o ge
nera
tions
23
.3
16.9
19
.8
33.1
30
.2
31.6
19
.2
10.1
14
.5
7.0
8.4
7.8
15.7
3.
0 6.
7
One
gen
erat
ion
8.9
9.1
9.0
11.1
5.
0 8.
0 7.
1 9.
3 8.
3 6.
1 11
.0
8.9
10.5
18
.6
16.2
Fran
ce
Five
gen
erat
ions
.1
.7
.5
.0
.0
.0
.5
.0
.2
.0
1.
0 .6
.0
4.
0 2.
6
Four
gen
erat
ions
17
.7
26.1
22
.3
19.1
30
.7
25.3
20
.0
20.0
20
.0
9.0
18.7
14
.4
29.1
40
.0
36.1
Thre
e ge
nera
tions
56
.8
51.7
54
.0
54.3
47
.1
50.4
56
.0
63.3
59
.8
66.0
57
.6
61.3
45
.5
28.0
34
.2
Two
gene
ratio
ns
15.2
12
.7
13.8
22
.6
18.8
20
.6
14.0
10
.2
12.0
7.
1 9.
1 8.
2 5.
5 8.
0 7.
1
One
gen
erat
ion
10.1
8.
7 9.
4 4.
0 3.
4 3.
7 9.
5 6.
5 7.
9 18
.0
13.6
15
.5
20.0
20
.0
20.0

Tab
le 4
A.9
(con
t.)
Num
ber
ofL
ivin
g G
ener
atio
ns
Tota
l
50-5
9
60
-69
70-7
9
80
+ M
en
Wom
enTo
tal
M
en
Wom
enTo
tal
M
en
Wom
enTo
tal
M
en
Wom
enTo
tal
M
en
Wom
en
Tota
l
Switz
erla
nd
Five
gen
erat
ions
.3
.1
.2
.7
.0
.3
.0
.0
.0
.0
.0
.0
.0
.9
.6
Fo
ur g
ener
atio
ns
9.5
13.0
11
.4
7.8
13.6
10
.7
13.5
11
.3
12.3
2.
7 4.
9 3.
9 22
.7
27.9
26
.1
Thre
e ge
nera
tions
53
.6
55.8
54
.8
47.0
53
.2
50.1
48
.2
53.8
51
.2
76.3
73
.3
74.6
53
.4
38.4
43
.5
Two
gene
ratio
ns
26.2
21
.1
23.4
36
.7
26.4
31
.5
22.4
22
.0
22.2
12
.9
13.4
13
.2
11.3
16
.0
14.4
One
gen
erat
ion
10.4
10
.0
10.2
7.
9 6.
8 7.
4 15
.9
12.9
14
.3
8.1
8.4
8.3
12.7
16
.8
15.4
Aus
tria
Fi
ve g
ener
atio
ns
.0
.3
.1
.0
.0
.0
.0
.2
.1
.0
.4
.2
.0
.8
.6
Fo
ur g
ener
atio
ns
15.2
18
.6
17.1
20
.5
22.6
21
.6
10.8
11
.1
11.0
15
.5
15.7
15
.6
10.9
36
.3
28.9
Thre
e ge
nera
tions
52
.0
53.3
52
.7
41.4
46
.7
44.1
55
.6
60.6
58
.3
63.4
62
.4
62.8
54
.3
29.8
36
.9
Two
gene
ratio
ns
22.1
14
.9
18.1
31
.7
22.3
26
.8
21.3
14
.9
17.9
11
.2
8.3
9.5
6.5
8.1
7.6
O
ne g
ener
atio
n 10
.7
12.9
12
.0
6.5
8.4
7.5
12.3
13
.1
12.8
9.
9 13
.2
11.8
28
.3
25.0
25
.9
Italy
Fi
ve g
ener
atio
ns
.5
.5
.5
1.2
.4
.8
.0
.0
.0
.0
.0
.0
.0
3.0
2.1
Fo
ur g
ener
atio
ns
10.4
10
.9
10.7
14
.0
11.7
12
.8
7.1
7.9
7.6
1.7
8.0
5.4
33.7
21
.3
25.1
Thre
e ge
nera
tions
54
.2
55.6
55
.0
45.5
51
.7
48.6
52
.1
60.8
57
.0
72.4
71
.2
71.7
47
.2
22.6
30
.0
Two
gene
ratio
ns
27.4
17
.2
21.7
34
.0
29.9
32
.0
31.8
18
.4
24.2
17
.5
6.7
11.2
7.
4 5.
3 5.
9
One
gen
erat
ion
7.5
15.8
12
.2
5.3
6.4
5.8
9.0
12.9
11
.2
8.3
14.1
11
.7
11.6
47
.8
36.9
Spai
n
Five
gen
erat
ions
.3
.6
.5
.0
.0
.0
.0
.3
.2
.0
.6
.4
3.
1 2.
3 2.
5
Four
gen
erat
ions
9.
0 16
.3
13.2
9.
0 16
.6
13.0
9.
6 13
.0
11.5
7.
9 13
.2
11.1
10
.4
24.6
20
.3
Thre
e ge
nera
tions
60
.9
57.9
59
.2
47.4
49
.9
48.7
65
.7
69.9
68
.1
74.2
66
.0
69.4
65
.2
43.0
49
.6
Two
gene
ratio
ns
17.9
15
.4
16.5
32
.8
29.2
30
.9
13.6
10
.9
12.1
7.
0 7.
6 7.
3 .0
7.
7 5.
4
One
gen
erat
ion
11.9
9.
8 10
.7
10.9
4.
3 7.
4 11
.0
5.8
8.1
10.9
12
.6
11.9
21
.4
22.5
22
.2
Gre
ece
Fi
ve g
ener
atio
ns
.1
.2
.2
.3
.0
.1
.0
.0
.0
.0
.5
.3
.0
.8
.5
Fo
ur g
ener
atio
ns
7.9
14.1
11
.2
7.6
11.0
9.
3 9.
3 11
.3
10.3
3.
2 11
.4
7.9
15.1
37
.2
29.3
Thre
e ge
nera
tions
54
.8
59.0
57
.1
49.4
52
.6
51.0
45
.7
57.2
51
.8
73.5
73
.5
73.5
68
.9
51.8
58
.0
Two
gene
ratio
ns
30.7
18
.5
24.1
38
.9
29.9
34
.3
37.4
21
.6
29.0
14
.4
6.2
9.7
7.2
2.0
3.9
O
ne g
ener
atio
n 6.
5 8.
2 7.
4 3.
8 6.
5 5.
2 7.
6 9.
9 8.
8 8.
8 8.
4 8.
6 8.
7 8.
1 8.
3

Tab
le 4
A.9
(con
t.)
Num
ber
ofL
ivin
g G
ener
atio
ns
Tota
l
50-5
9
60
-69
70-7
9
80
+ M
en
Wom
enTo
tal
M
en
Wom
enTo
tal
M
en
Wom
enTo
tal
M
en
Wom
enTo
tal
M
en
Wom
en
Tota
l
Tota
l
Five
gen
erat
ions
.2
.5
.4
.3
.1
.2
.2
.2
.2
.0
.6
.4
.5
1.
6 1.
3
Four
gen
erat
ions
12
.2
19.2
16
.1
13.9
20
.0
17.0
10
.3
12.4
11
.4
7.6
15.8
12
.4
25.1
37
.0
33.5
Th
ree
gene
ratio
ns
54.7
53
.0
53.8
45
.4
48.7
47
.1
56.0
61
.6
59.0
70
.3
61.6
65
.2
53.6
30
.3
37.2
Tw
o ge
nera
tions
22
.9
16.0
19
.1
33.2
26
.0
29.5
22
.0
15.9
18
.8
11.1
8.
0 9.
3 5.
8 6.
4 6.
2
One
gen
erat
ion
10.0
11
.3
10.7
7.
2 5.
2 6.
2 11
.6
9.9
10.7
11
.0
14.0
12
.7
15.0
24
.7
21.8
Note:
Sur
vey
of H
ealth
, Age
ing
and
Ret
irem
ent 2
004.
Rel
ease
0, w
eigh
ted.

Tab
le 4
A.1
0 N
umbe
r of
Liv
ing
Kin
(mea
ns)
Tota
l
50-5
9
60
-69
70-7
9
80
+ M
en
Wom
enTo
tal
M
en
Wom
enTo
tal
M
en
Wom
enTo
tal
M
en
Wom
enTo
tal
M
en
Wom
en
Tota
l
Swed
en
Pare
nts
.37
.31
.34
.80
.73
.76
.19
.22
.20
.03
.03
.03
.01
.00
.01
B
roth
ers
1.00
.8
7 .9
3 1.
11
1.10
1.
11
1.04
1.
01
1.02
.9
7 .7
2 .8
3 .5
6 .3
9 .4
5
Sist
ers
1.02
.9
8 1.
00
1.09
1.
11
1.10
1.
04
1.06
1.
05
1.04
.9
6 .9
9 .7
2 .6
2 .6
6
Chi
ldre
n 2.
39
2.19
2.
28
2.38
2.
31
2.34
2.
46
2.30
2.
38
2.36
2.
04
2.18
2.
27
1.98
2.
09
G
rand
child
ren
2.87
3.
42
3.16
1.
17
1.97
1.
57
3.20
3.
58
3.40
4.
57
4.36
4.
45
4.93
5.
12
5.04
Den
mar
k
Pare
nts
.38
.30
.33
.73
.66
.69
.19
.15
.17
.01
.01
.01
.00
.00
.00
B
roth
ers
1.05
.9
3 .9
9 1.
22
1.10
1.
16
1.06
.9
7 1.
01
.82
.76
.79
.67
.64
.65
Si
ster
s 1.
05
1.08
1.
07
1.14
1.
17
1.15
1.
11
1.18
1.
15
.90
.93
.92
.69
.86
.81
C
hild
ren
2.20
2.
23
2.22
2.
07
2.11
2.
09
2.32
2.
42
2.37
2.
20
2.27
2.
24
2.50
2.
13
2.25
Gra
ndch
ildre
n 2.
83
3.49
3.
19
1.29
1.
89
1.60
3.
42
4.13
3.
78
4.09
4.
73
4.45
5.
80
5.24
5.
43
Ger
man
y
Pare
nts
.31
.28
.29
.66
.74
.70
.13
.16
.15
.00
.03
.02
.03
.02
.02
B
roth
ers
.86
.69
.76
1.06
.9
3 1.
00
.87
.70
.78
.60
.62
.61
.24
.25
.25
Si
ster
s .8
6 .8
1 .8
3 .8
2 .8
4 .8
3 .9
4 .8
8 .9
1 .9
0 .7
9 .8
3 .4
8 .5
9 .5
6
Chi
ldre
n 1.
78
1.87
1.
83
1.61
1.
76
1.68
1.
81
1.94
1.
88
2.03
2.
00
2.01
1.
95
1.71
1.
77
G
rand
child
ren
1.99
2.
51
2.28
.7
8 1.
14
.97
2.16
2.
55
2.37
3.
41
3.64
3.
55
3.34
3.
62
3.55
Net
herla
nds
Pa
rent
s .3
0 .2
8 .2
9 .5
5 .6
0 .5
8 .1
6 .1
6 .1
6 .0
1 .0
2 .0
2 .0
2 .0
0 .0
1
Bro
ther
s 1.
63
1.50
1.
56
1.90
1.
74
1.82
1.
76
1.74
1.
75
1.16
1.
34
1.26
.6
8 .6
5 .6
6
Sist
ers
1.63
1.
63
1.63
1.
73
1.75
1.
74
1.76
1.
72
1.74
1.
39
1.70
1.
57
1.07
1.
03
1.04
Chi
ldre
n 2.
32
2.38
2.
35
2.05
2.
06
2.05
2.
36
2.57
2.
47
2.85
2.
60
2.71
2.
52
2.58
2.
56
G
rand
child
ren
2.62
3.
43
3.06
.8
0 1.
28
1.05
2.
92
3.70
3.
32
5.31
5.
47
5.40
4.
47
6.07
5.
58
Fran
ce
Pare
nts
.36
.39
.38
.74
.84
.80
.26
.26
.26
.01
.05
.03
.00
.05
.03
B
roth
ers
1.31
1.
20
1.25
1.
61
1.62
1.
61
1.47
1.
27
1.37
.9
1 .8
7 .8
9 .4
6 .4
3 .4
4
Sist
ers
1.26
1.
30
1.28
1.
48
1.65
1.
57
1.38
1.
38
1.38
1.
01
1.03
1.
02
.56
.63
.60
C
hild
ren
2.28
2.
30
2.29
2.
18
2.26
2.
22
2.52
2.
39
2.45
2.
16
2.33
2.
25
2.27
2.
15
2.19
Gra
ndch
ildre
n 3.
01
3.66
3.
37
.95
1.75
1.
38
3.54
4.
08
3.82
4.
99
5.36
5.
20
5.93
5.
43
5.61

Tab
le 4
A.1
0 (c
ont.)
Num
ber
of L
ivin
g K
in (m
eans
)
Tota
l
50-5
9
60
-69
70-7
9
80
+ M
en
Wom
enTo
tal
M
en
Wom
enTo
tal
M
en
Wom
enTo
tal
M
en
Wom
enTo
tal
M
en
Wom
en
Tota
l
Switz
erla
nd
Pare
nts
.36
.35
.35
.69
.75
.72
.19
.20
.20
.01
.00
.00
.05
.06
.06
B
roth
ers
1.24
1.
12
1.18
1.
41
1.31
1.
36
1.29
1.
06
1.17
1.
01
1.17
1.
10
.68
.65
.66
Si
ster
s 1.
29
1.27
1.
28
1.43
1.
32
1.38
1.
19
1.23
1.
21
1.28
1.
40
1.35
.9
5 1.
02
.99
C
hild
ren
2.08
2.
08
2.08
2.
06
2.02
2.
04
1.91
2.
05
1.98
2.
37
2.23
2.
29
2.10
2.
08
2.09
Gra
ndch
ildre
n 2.
23
2.52
2.
39
1.02
.7
9 .9
1 2.
37
2.85
2.
62
3.70
4.
05
3.90
4.
24
4.07
4.
13
Aus
tria
Pa
rent
s .2
9 .2
4 .2
6 .6
7 .5
7 .6
2 .1
4 .1
7 .1
6 .0
1 .0
1 .0
1 .0
0 .0
4 .0
3
Bro
ther
s .9
0 .7
4 .8
1 1.
11
.92
1.01
.8
5 .8
4 .8
4 .7
7 .5
7 .6
5 .4
3 .3
0 .3
4
Sist
ers
.81
.85
.84
.96
1.02
.9
9 .8
0 .8
6 .8
4 .7
5 .7
9 .7
7 .2
6 .4
9 .4
3
Chi
ldre
n 1.
96
1.87
1.
91
2.00
1.
89
1.94
1.
94
1.89
1.
91
2.04
1.
97
2.00
1.
59
1.54
1.
55
G
rand
child
ren
2.26
2.
70
2.50
1.
29
1.78
1.
55
2.32
2.
70
2.52
3.
34
3.63
3.
51
3.76
3.
47
3.55
Italy
Pa
rent
s .3
1 .2
4 .2
7 .6
4 .5
6 .6
0 .1
7 .1
6 .1
6 .0
3 .0
4 .0
3 .0
3 .0
6 .0
5
Bro
ther
s 1.
17
1.05
1.
10
1.28
1.
28
1.28
1.
30
1.11
1.
19
.98
1.08
1.
04
.66
.33
.43
Si
ster
s 1.
15
1.24
1.
20
1.18
1.
44
1.31
1.
25
1.21
1.
23
1.09
1.
16
1.13
.8
1 1.
01
.95
C
hild
ren
1.96
1.
93
1.94
1.
86
1.96
1.
91
1.97
1.
93
1.95
2.
00
2.22
2.
13
2.28
1.
32
1.61
Gra
ndch
ildre
n 1.
91
2.55
2.
26
.80
1.14
.9
7 1.
73
2.18
1.
98
2.92
4.
08
3.58
5.
23
4.61
4.
87
Spai
n
Pare
nts
.30
.29
.29
.67
.71
.69
.15
.20
.18
.01
.03
.02
.04
.03
.04
B
roth
ers
1.37
1.
18
1.26
1.
50
1.37
1.
43
1.57
1.
37
1.46
1.
16
1.08
1.
11
.78
.67
.70
Si
ster
s 1.
20
1.28
1.
25
1.08
1.
33
1.21
1.
43
1.45
1.
44
1.15
1.
27
1.22
1.
14
.92
.99
C
hild
ren
2.38
2.
54
2.47
1.
98
2.29
2.
14
2.66
2.
79
2.73
2.
70
2.70
2.
70
2.41
2.
35
2.37
Gra
ndch
ildre
n 2.
46
3.46
3.
04
.42
.78
.62
2.34
3.
57
3.04
4.
39
4.98
4.
74
5.76
6.
58
6.32
Gre
ece
Pa
rent
s .3
7 .2
9 .3
3 .7
7 .6
7 .7
2 .2
3 .2
0 .2
1 .0
3 .0
3 .0
3 .0
0 .0
3 .0
2
Bro
ther
s 1.
11
.99
1.04
1.
09
.97
1.03
1.
21
1.07
1.
13
1.04
1.
06
1.05
.9
3 .6
8 .7
7
Sist
ers
1.10
1.
14
1.12
1.
02
1.03
1.
02
1.25
1.
27
1.26
1.
09
1.28
1.
20
.83
.80
.81
C
hild
ren
1.96
1.
95
1.95
1.
93
1.78
1.
86
1.87
1.
88
1.88
1.
98
2.06
2.
03
2.38
2.
41
2.40
Gra
ndch
ildre
n 1.
63
2.59
2.
15
.25
.68
.46
1.51
2.
58
2.08
3.
15
3.89
3.
58
4.56
5.
16
4.95

Tab
le 4
A.1
0 (c
ont.)
Num
ber
of L
ivin
g K
in (m
eans
)
Tota
l
50-5
9
60
-69
70-7
9
80
+ M
en
Wom
enTo
tal
M
en
Wom
enTo
tal
M
en
Wom
enTo
tal
M
en
Wom
enTo
tal
M
en
Wom
en
Tota
l
Tota
l
Pare
nts
.32
.29
.31
.67
.70
.69
.17
.18
.18
.02
.03
.03
.02
.03
.03
B
roth
ers
1.13
.9
8 1.
05
1.31
1.
25
1.28
1.
19
1.04
1.
11
.89
.90
.90
.55
.42
.45
Si
ster
s 1.
10
1.12
1.
11
1.13
1.
27
1.20
1.
18
1.16
1.
17
1.04
1.
06
1.05
.7
4 .7
7 .7
6
Chi
ldre
n 2.
05
2.09
2.
07
1.90
2.
01
1.96
2.
10
2.15
2.
13
2.20
2.
24
2.23
2.
22
1.89
1.
99
G
rand
child
ren
2.28
2.
94
2.65
.7
9 1.
25
1.03
2.
39
2.94
2.
69
3.84
4.
36
4.14
4.
84
4.80
4.
81
Note:
Sur
vey
of H
ealth
, Age
ing
and
Ret
irem
ent 2
004.
Rel
ease
0, w
eigh
ted.

Tab
le 4
A.1
1 Pr
oxim
ity to
Nea
rest
Liv
ing
Chi
ld (p
erce
ntag
es)
Tota
l
50-5
9
60
-69
70-7
9
80
+ M
en
Wom
enTo
tal
M
en
Wom
enTo
tal
M
en
Wom
enTo
tal
M
en
Wom
enTo
tal
M
en
Wom
en
Tota
l
Swed
en
Sam
e ho
useh
old
18.7
12
.3
15.3
40
.2
30.0
35
.0
8.7
2.1
5.3
.5
1.6
1.1
.5
1.9
1.3
Sa
me
build
ing
1.3
1.3
1.3
1.6
.9
1.2
.9
1.3
1.1
1.9
1.2
1.5
.0
2.7
1.6
Le
ss th
an 1
km
13
.2
17.0
15
.2
7.9
12.6
10
.3
11.8
17
.4
14.6
19
.3
22.2
20
.9
24.9
20
.4
22.2
1
- 25
km
44.0
44
.8
44.4
32
.0
34.9
33
.5
54.2
49
.8
52.0
49
.6
50.9
50
.3
48.9
51
.1
50.2
25 –
100
km
12
.0
12.4
12
.2
8.4
10.4
9.
4 13
.0
15.5
14
.3
16.5
13
.6
14.9
14
.5
10.2
11
.9
> 10
0 km
10
.9
12.1
11
.6
9.9
11.2
10
.6
11.5
13
.8
12.7
12
.2
10.7
11
.4
11.2
13
.6
12.7
Den
mar
k
Sam
e ho
useh
old
16.8
10
.5
13.4
30
.7
18.5
24
.4
6.2
5.4
5.8
3.0
1.5
2.2
.0
5.6
3.7
Sa
me
build
ing
3.4
1.5
2.4
5.6
1.6
3.5
1.7
1.3
1.5
1.0
1.9
1.5
4.3
1.4
2.4
Le
ss th
an 1
km
11
.9
16.6
14
.4
5.5
11.0
8.
4 17
.8
21.6
19
.7
17.9
20
.8
19.5
12
.3
17.6
15
.8
1 - 2
5 km
44
.5
49.1
47
.0
38.6
45
.6
42.3
50
.7
52.0
51
.3
51.4
52
.0
51.7
46
.3
52.1
50
.1
25
– 1
00 k
m
16.1
14
.8
15.4
14
.8
15.4
15
.1
13.8
14
.1
14.0
20
.0
14.9
17
.2
22.2
15
.4
17.7
>
100
km
7.3
7.4
7.4
4.7
7.9
6.4
9.7
5.6
7.7
6.7
8.9
8.0
14.9
7.
9 10
.3
Ger
man
y
Sam
e ho
useh
old
22.0
17
.8
19.7
43
.9
34.2
38
.9
12.5
10
.2
11.3
4.
6 11
.1
8.4
5.8
10.6
9.
4
Sam
e bu
ildin
g 12
.6
15.3
14
.1
9.0
9.6
9.3
13.2
15
.9
14.6
15
.9
17.0
16
.5
20.4
24
.1
23.2
Le
ss th
an 1
km
12
.2
13.3
12
.9
6.9
7.7
7.3
14.9
11
.5
13.1
18
.1
18.5
18
.3
8.8
22.5
19
.0
1
- 25
km
32.1
36
.1
34.3
20
.0
29.2
24
.8
39.2
43
.5
41.5
40
.0
38.0
38
.9
35.7
30
.1
31.5
25 –
100
km
10
.1
7.6
8.7
8.1
8.4
8.3
10.4
9.
0 9.
6 11
.2
7.5
9.1
16.2
2.
9 6.
3
> 10
0 km
10
.9
9.9
10.3
12
.0
10.8
11
.4
9.8
9.9
9.9
10.1
7.
9 8.
8 13
.1
9.8
10.6
Net
herla
nds
Sa
me
hous
ehol
d 27
.5
17.4
22
.0
50.2
32
.3
40.8
13
.9
11.5
12
.6
5.0
3.5
4.2
.0
4.2
2.9
Sa
me
build
ing
1.0
.9
.9
.9
.6
.8
.9
1.1
1.0
1.5
2.0
1.8
.0
.0
.0
Le
ss th
an 1
km
18
.5
19.5
19
.0
8.3
13.3
10
.9
25.7
25
.5
25.6
28
.9
24.0
26
.2
22.4
18
.4
19.7
1 - 2
5 km
42
.2
48.5
45
.6
32.3
40
.1
36.4
46
.2
51.6
49
.0
53.5
55
.6
54.7
61
.0
59.7
60
.1
25
– 1
00 k
m
7.3
9.2
8.4
6.5
8.9
7.8
8.4
6.7
7.6
6.6
11.0
9.
0 10
.6
11.8
11
.4
> 10
0 km
3.
6 4.
3 4.
0 1.
8 4.
8 3.
4 4.
8 3.
6 4.
2 4.
4 3.
9 4.
2 5.
9 5.
9 5.
9

Tab
le 4
A.1
1 (c
ont.)
Prox
imity
to N
eare
st L
ivin
g C
hild
Tota
l
50-5
9
60
-69
70-7
9
80
+ M
en
Wom
enTo
tal
M
en
Wom
enTo
tal
M
en
Wom
enTo
tal
M
en
Wom
enTo
tal
M
en
Wom
en
Tota
l
Fran
ce
Sam
e ho
useh
old
25.4
21
.3
23.1
47
.4
40.7
43
.8
15.5
10
.8
13.1
3.
2 5.
9 4.
7 4.
5 10
.1
8.1
Sa
me
build
ing
1.4
2.4
1.9
.0
.4
.2
1.1
2.1
1.6
2.4
4.1
3.4
6.8
6.3
6.5
Le
ss th
an 1
km
14
.0
14.7
14
.4
7.4
10.0
8.
8 17
.2
20.0
18
.7
22.0
14
.2
17.5
13
.6
20.2
17
.9
1
- 25
km
31.7
37
.0
34.6
24
.8
27.8
26
.4
30.0
37
.0
33.6
44
.1
46.8
45
.6
43.2
49
.4
47.2
25 –
100
km
12
.9
10.7
11
.7
8.3
7.8
8.0
17.2
12
.8
14.9
15
.0
16.0
15
.5
15.9
5.
1 8.
9
> 10
0 km
14
.6
13.9
14
.2
12.2
13
.3
12.8
18
.9
17.4
18
.1
13.4
13
.0
13.2
15
.9
8.9
11.4
Switz
erla
nd
Sam
e ho
useh
old
31.1
22
.7
26.6
53
.7
39.2
46
.4
15.9
16
.2
16.1
8.
9 4.
9 6.
6 5.
9 14
.1
11.2
Sa
me
build
ing
5.2
8.6
7.1
2.5
4.8
3.7
5.3
6.3
5.9
10.0
16
.8
13.9
8.
8 10
.9
10.1
Less
than
1 k
m
11.6
13
.8
12.8
10
.2
8.6
9.4
12.5
19
.4
16.1
14
.2
19.0
16
.9
12.7
8.
6 10
.0
1
- 25
km
36.9
37
.6
37.3
23
.5
33.1
28
.4
50.4
47
.4
48.8
48
.6
36.7
41
.8
41.9
36
.4
38.3
25 –
100
km
10
.1
9.7
9.9
7.4
8.1
7.8
9.0
6.2
7.5
13.6
13
.0
13.3
17
.6
15.2
16
.0
>
100
km
5.0
7.5
6.4
2.6
6.1
4.4
6.8
4.5
5.6
4.7
9.6
7.5
13.1
14
.9
14.3
Aus
tria
Sa
me
hous
ehol
d 24
.2
20.8
22
.3
41.8
29
.7
35.4
17
.1
18.8
18
.0
11.1
11
.4
11.3
15
.6
19.4
18
.3
Sam
e bu
ildin
g 13
.2
16.5
15
.0
10.8
14
.7
12.8
13
.5
15.4
14
.5
13.9
20
.5
17.6
21
.9
18.3
19
.3
Le
ss th
an 1
km
12
.7
15.1
14
.1
8.6
12.6
10
.7
14.9
14
.5
14.7
15
.3
17.1
16
.3
12.5
22
.6
19.8
1 - 2
5 km
32
.6
33.3
33
.0
28.4
30
.8
29.7
33
.1
34.2
33
.7
38.2
38
.6
38.4
34
.4
25.8
28
.2
25
– 1
00 k
m
8.8
7.5
8.1
5.6
5.9
5.8
9.6
7.8
8.7
11.8
9.
5 10
.5
12.5
6.
5 8.
1
> 10
0 km
8.
5 6.
7 7.
5 4.
7 6.
3 5.
6 11
.7
9.3
10.4
9.
7 2.
9 5.
8 3.
1 7.
5 6.
3
Italy
Sa
me
hous
ehol
d 52
.2
46.7
49
.3
81.1
77
.1
79.1
46
.7
36.2
40
.9
23.1
26
.8
25.2
12
.0
31.4
23
.2
Sam
e bu
ildin
g 8.
5 15
.0
12.0
.9
4.
0 2.
4 9.
5 14
.1
12.1
17
.2
28.0
23
.4
17.8
20
.1
19.1
Le
ss th
an 1
km
10
.4
12.1
11
.3
2.5
7.4
4.9
13.7
13
.0
13.3
16
.9
14.7
15
.7
19.4
17
.6
18.3
1 - 2
5 km
21
.4
20.4
20
.9
11.1
9.
5 10
.3
23.4
28
.0
26.0
30
.4
23.7
26
.6
40.9
24
.6
31.5
25 –
100
km
3.
0 3.
0 3.
0 .9
.2
.6
3.
1 3.
3 3.
2 4.
6 4.
9 4.
8 9.
2 6.
3 7.
5
> 10
0 km
4.
3 2.
8 3.
5 3.
6 1.
8 2.
7 3.
6 5.
4 4.
6 7.
7 1.
9 4.
4 .8
.0
.3

Tab
le 4
A.1
1 (c
ont.)
Prox
imity
to N
eare
st L
ivin
g C
hild
Tota
l
50-5
9
60
-69
70-7
9
80
+ M
en
Wom
enTo
tal
M
en
Wom
enTo
tal
M
en
Wom
enTo
tal
M
en
Wom
enTo
tal
M
en
Wom
en
Tota
l
Spai
n
Sam
e ho
useh
old
55.6
49
.8
52.2
81
.0
74.2
77
.3
52.0
45
.5
48.3
30
.6
30.1
30
.3
31.3
35
.0
33.9
Sa
me
build
ing
4.3
5.6
5.0
.7
3.2
2.0
5.8
7.2
6.6
6.1
7.0
6.6
9.3
5.9
6.9
Le
ss th
an 1
km
22
.0
25.2
23
.8
7.7
9.9
8.9
24.2
26
.4
25.4
35
.8
37.7
36
.9
35.5
36
.4
36.1
1 - 2
5 km
14
.2
14.0
14
.1
8.5
9.7
9.2
15.6
15
.2
15.4
18
.5
17.1
17
.7
21.5
16
.8
18.2
25 –
100
km
1.
4 2.
4 2.
0 .8
1.
0 .9
1.
5 3.
6 2.
7 2.
5 3.
3 3.
0 .0
1.
9 1.
3
> 10
0 km
2.
6 3.
1 2.
9 1.
3 2.
1 1.
7 .9
2.
1 1.
6 6.
5 4.
8 5.
5 2.
3 4.
1 3.
5
Gre
ece
Sa
me
hous
ehol
d 50
.8
38.5
44
.1
78.6
72
.0
75.3
49
.5
31.1
39
.8
21.2
14
.6
17.4
5.
1 12
.2
9.7
Sa
me
build
ing
11.8
16
.4
14.3
4.
3 6.
0 5.
2 11
.6
16.3
14
.1
20.5
25
.6
23.5
25
.5
25.5
25
.5
Le
ss th
an 1
km
13
.2
16.1
14
.8
3.3
7.5
5.4
15.4
21
.5
18.7
22
.8
20.9
21
.7
25.8
16
.6
19.9
1 - 2
5 km
15
.1
19.3
17
.3
6.7
8.9
7.8
16.7
20
.1
18.5
22
.1
25.7
24
.2
26.8
33
.7
31.3
25 –
100
km
2.
6 2.
7 2.
7 1.
0 1.
5 1.
3 2.
3 1.
9 2.
1 4.
9 4.
3 4.
6 3.
9 4.
8 4.
5
> 10
0 km
6.
6 7.
1 6.
8 6.
2 4.
0 5.
1 4.
5 9.
0 6.
9 8.
5 8.
8 8.
7 12
.8
7.2
9.2
Tota
l
Sam
e ho
useh
old
34.5
29
.1
31.5
58
.3
49.9
53
.9
25.5
20
.9
23.1
13
.0
15.8
14
.6
10.0
16
.8
14.6
Sa
me
build
ing
7.4
10.2
9.
0 3.
6 4.
8 4.
2 8.
3 10
.9
9.7
11.1
14
.9
13.3
13
.1
14.7
14
.2
Less
than
1 k
m
13.7
15
.6
14.8
6.
2 9.
1 7.
7 16
.5
16.5
16
.5
21.6
20
.3
20.8
18
.5
22.7
21
.4
1
- 25
km
28.4
30
.7
29.6
19
.0
23.2
21
.2
32.4
35
.5
34.0
36
.1
34.1
35
.0
38.2
33
.4
34.9
25 –
100
km
7.
7 6.
7 7.
2 5.
5 5.
7 5.
6 8.
7 7.
5 8.
1 9.
0 8.
2 8.
5 11
.4
5.1
7.2
>
100
km
8.3
7.7
7.9
7.4
7.4
7.4
8.6
8.7
8.7
9.1
6.8
7.8
8.7
7.3
7.8
Note:
Sur
vey
of H
ealth
, Age
ing
and
Ret
irem
ent 2
004.
Rel
ease
0, w
eigh
ted.

Tab
le 4
A.1
2 Fr
eque
ncy
of C
onta
ct to
Mos
t Con
tact
ed C
hild
(per
cent
ages
)
Tota
l
50-5
9
60
-69
70-7
9
80
+ M
en
Wom
enTo
tal
M
en
Wom
enTo
tal
M
en
Wom
enTo
tal
M
en
Wom
enTo
tal
M
en
Wom
en
Tota
l
Swed
en
Dai
ly
44.9
44
.4
44.6
60
.2
57.8
59
.0
39.3
38
.8
39.0
31
.1
34.3
32
.9
30.2
35
.0
33.1
Seve
ral t
imes
a w
eek
35.9
38
.1
37.1
28
.2
30.8
29
.5
39.6
43
.7
41.7
38
.7
43.1
41
.2
49.0
40
.1
43.7
Onc
e a
wee
k or
eve
ry tw
o w
eeks
16.5
16
.5
16.5
9.
8 10
.0
9.9
18.6
16
.5
17.5
26
.5
21.8
23
.9
16.1
24
.9
21.3
Onc
e a
mon
th o
r les
s ofte
n 2.
0 .8
1.
4 1.
3 1.
3 1.
3 1.
9 .8
1.
3 1.
9 .8
1.
3 4.
8 .0
1.
9
Nev
er
.7
.2
.4
.5
.2
.3
.6
.3
.4
1.9
.0
.8
.0
.0
.0
Den
mar
k
Dai
ly
44.0
39
.3
41.5
57
.8
44.7
51
.0
33.2
31
.6
32.4
28
.9
36.6
33
.2
38.1
39
.7
39.1
Seve
ral t
imes
a w
eek
30.7
37
.3
34.2
25
.0
38.3
31
.9
40.1
43
.4
41.8
30
.7
35.3
33
.3
30.2
26
.5
27.8
Onc
e a
wee
k or
eve
ry tw
o w
eeks
21.1
21
.3
21.2
13
.5
15.3
14
.5
21.2
24
.0
22.6
36
.2
24.1
29
.5
28.4
30
.5
29.7
Onc
e a
mon
th o
r les
s ofte
n 3.
0 1.
9 2.
4 2.
2 1.
7 1.
9 4.
8 .9
2.
9 2.
8 2.
9 2.
9 1.
6 3.
4 2.
8
Nev
er
1.2
.2
.7
1.5
.0
.7
.6
.0
.3
1.3
1.1
1.2
1.6
.0
.6
Ger
man
y
Dai
ly
50.2
50
.7
50.5
60
.4
54.3
57
.3
47.6
47
.2
47.4
38
.6
47.0
43
.5
42.3
57
.3
53.6
Seve
ral t
imes
a w
eek
25.2
28
.8
27.2
15
.8
25.7
20
.9
29.4
29
.6
29.5
32
.3
31.2
31
.6
32.2
29
.7
30.4
Onc
e a
wee
k or
eve
ry tw
o w
eeks
17.5
15
.8
16.5
15
.2
15.5
15
.3
16.4
17
.8
17.1
21
.5
16.6
18
.7
25.5
9.
9 13
.8
O
nce
a m
onth
or l
ess o
ften
5.0
4.2
4.6
5.0
4.0
4.5
4.7
4.4
4.5
7.0
4.8
5.7
.0
3.0
2.3
N
ever
2.
1 .6
1.
2 3.
6 .5
2.
0 1.
8 1.
0 1.
4 .6
.4
.5
.0
.0
.0
Net
herla
nds
D
aily
50
.9
46.8
48
.7
64.7
57
.8
61.1
51
.1
46.7
48
.9
30.4
33
.7
32.2
17
.3
34.4
29
.1
Se
vera
l tim
es a
wee
k 32
.8
36.3
34
.7
25.4
31
.4
28.5
33
.9
34.3
34
.1
40.0
44
.4
42.5
57
.9
42.8
47
.4
O
nce
a w
eek
or e
very
two
wee
ks 13
.6
14.8
14
.3
7.6
9.9
8.8
13.9
15
.9
14.9
25
.5
17.9
21
.3
16.5
22
.1
20.4
Onc
e a
mon
th o
r les
s ofte
n 2.
0 1.
7 1.
9 1.
2 .8
1.
0 1.
2 2.
0 1.
6 3.
0 3.
9 3.
5 8.
3 .7
3.
1
Nev
er
.7
.4
.5
1.2
.2
.7
.0
1.1
.6
1.0
.0
.4
.0
.0
.0
Fran
ce
Dai
ly
50.1
48
.7
49.3
62
.6
57.4
59
.8
41.1
42
.0
41.6
40
.1
37.9
38
.8
43.2
55
.7
51.2
Seve
ral t
imes
a w
eek
27.9
29
.5
28.8
23
.0
25.2
24
.2
32.8
35
.9
34.4
29
.9
33.1
31
.8
31.8
22
.8
26.0
Onc
e a
wee
k or
eve
ry tw
o w
eeks
16.7
17
.9
17.4
10
.0
12.6
11
.4
19.5
17
.4
18.4
24
.4
27.2
26
.0
20.5
17
.7
18.7
Onc
e a
mon
th o
r les
s ofte
n 4.
9 3.
5 4.
1 4.
4 4.
4 4.
4 5.
5 3.
6 4.
5 5.
5 1.
8 3.
4 4.
5 3.
8 4.
1
Nev
er
.3
.4
.4
.0
.4
.2
1.1
1.0
1.1
.0
.0
.0
.0
.0
.0

Tab
le 4
A.1
2 (c
ont.)
Freq
uenc
y of
Con
tact
to M
ost C
onta
cted
Chi
ld
Tota
l
50-5
9
60
-69
70-7
9
80
+ M
en
Wom
enTo
tal
M
en
Wom
enTo
tal
M
en
Wom
enTo
tal
M
en
Wom
enTo
tal
M
en
Wom
en
Tota
l
Switz
erla
nd
Dai
ly
46.3
46
.6
46.5
65
.3
57.8
61
.5
33.9
46
.1
40.3
27
.8
29.9
29
.0
25.0
41
.1
35.4
Seve
ral t
imes
a w
eek
24.0
25
.8
24.9
12
.2
19.3
15
.8
32.6
28
.2
30.3
36
.1
37.8
37
.1
32.6
20
.4
24.7
Onc
e a
wee
k or
eve
ry tw
o w
eeks
22.5
23
.3
22.9
17
.3
18.2
17
.7
26.2
23
.9
25.0
26
.7
28.0
27
.5
32.3
30
.1
30.9
Onc
e a
mon
th o
r les
s ofte
n 6.
3 3.
2 4.
6 4.
1 3.
8 4.
0 7.
3 .9
3.
9 7.
0 4.
4 5.
5 10
.1
4.3
6.4
N
ever
1.
0 1.
1 1.
0 1.
1 1.
0 1.
1 .0
.9
.5
2.
3 .0
1.
0 .0
4.
1 2.
6
Aus
tria
D
aily
53
.1
56.5
55
.0
66.4
61
.2
63.6
46
.6
53.3
50
.2
43.8
51
.9
48.4
56
.3
61.3
59
.9
Se
vera
l tim
es a
wee
k 24
.2
23.4
23
.7
18.5
22
.4
20.6
27
.4
23.5
25
.3
27.1
25
.7
26.3
21
.9
23.7
23
.2
O
nce
a w
eek
or e
very
two
wee
ks 15
.9
16.1
16
.0
9.5
12.6
11
.1
19.2
19
.1
19.2
20
.1
17.6
18
.7
15.6
11
.8
12.9
Onc
e a
mon
th o
r les
s ofte
n 5.
6 3.
6 4.
5 5.
2 3.
1 4.
1 4.
6 3.
5 4.
0 9.
0 4.
8 6.
6 3.
1 3.
2 3.
2
Nev
er
1.2
.4
.8
.4
.7
.6
2.1
.6
1.3
.0
.0
.0
3.1
.0
.9
Italy
D
aily
85
.0
86.3
85
.7
91.7
91
.5
91.6
83
.5
83.5
83
.5
78.3
84
.7
81.9
76
.3
81.5
79
.3
Se
vera
l tim
es a
wee
k 11
.0
9.6
10.2
6.
1 6.
3 6.
2 11
.8
11.8
11
.8
16.9
11
.3
13.7
15
.0
9.5
11.8
Onc
e a
wee
k or
eve
ry tw
o w
eeks
2.5
2.
5 2.
5 2.
0 .7
1.
4 .6
3.
4 2.
2 4.
3 3.
0 3.
5 6.
9 5.
0 5.
8
Onc
e a
mon
th o
r les
s ofte
n .9
.8
.9
.1
.0
.1
2.
6 .5
1.
4 .5
1.
1 .8
.0
4.
0 2.
3
Nev
er
.6
.7
.7
.1
1.5
.8
1.5
.7
1.1
.0
.0
.0
1.7
.0
.7
Spai
n
Dai
ly
85.2
85
.3
85.3
92
.1
92.4
92
.3
88.2
84
.8
86.3
74
.8
77.8
76
.6
76.4
82
.9
80.9
Seve
ral t
imes
a w
eek
9.7
10.2
10
.0
4.1
3.8
3.9
10.0
10
.9
10.5
13
.7
15.2
14
.6
21.2
14
.7
16.7
Onc
e a
wee
k or
eve
ry tw
o w
eeks
3.2
4.
1 3.
7 1.
2 3.
8 2.
6 1.
8 3.
8 3.
0 8.
0 6.
6 7.
2 2.
4 1.
1 1.
5
Onc
e a
mon
th o
r les
s ofte
n 1.
4 .2
.7
1.
4 .0
.6
.0
.4
.2
3.
5 .4
1.
7 .0
.0
.0
N
ever
.5
.2
.3
1.
3 .0
.6
.0
.0
.0
.0
.0
.0
.0
1.
4 1.
0
Gre
ece
D
aily
86
.1
82.6
84
.2
91.8
91
.7
91.8
86
.5
82.8
84
.6
79.3
73
.8
76.1
75
.4
74.1
74
.6
Se
vera
l tim
es a
wee
k 10
.9
12.6
11
.9
6.1
7.1
6.6
12.2
12
.8
12.5
14
.8
17.2
16
.2
17.5
18
.7
18.3
Onc
e a
wee
k or
eve
ry tw
o w
eeks
3.0
4.
3 3.
7 2.
1 .9
1.
5 1.
3 3.
6 2.
5 6.
0 9.
0 7.
7 7.
1 6.
2 6.
5
Onc
e a
mon
th o
r les
s ofte
n .0
.3
.2
.0
.0
.0
.0
.7
.4
.0
.0
.0
.0
1.
0 .6
Nev
er
.0
.1
.1
.0
.3
.2
.0
.0
.0
.0
.0
.0
.0
.0
.0

Tab
le 4
A.1
2 (c
ont.)
Freq
uenc
y of
Con
tact
to M
ost C
onta
cted
Chi
ld
Tota
l
50-5
9
60
-69
70-7
9
80
+ M
en
Wom
enTo
tal
M
en
Wom
enTo
tal
M
en
Wom
enTo
tal
M
en
Wom
enTo
tal
M
en
Wom
en
Tota
l
Tota
l
Dai
ly
62.9
62
.8
62.9
72
.9
69.0
70
.8
59.0
59
.7
59.3
53
.7
58.1
56
.2
53.7
62
.1
59.4
Seve
ral t
imes
a w
eek
21.1
22
.6
21.9
14
.5
18.8
16
.7
24.5
24
.6
24.5
25
.6
25.2
25
.4
28.4
23
.9
25.4
Onc
e a
wee
k or
eve
ry tw
o w
eeks
11.8
11
.7
11.7
8.
6 9.
4 9.
0 11
.9
12.6
12
.3
16.3
14
.1
15.0
15
.5
11.2
12
.6
O
nce
a m
onth
or l
ess o
ften
3.2
2.4
2.8
2.7
2.2
2.5
3.5
2.4
2.9
4.1
2.4
3.1
1.9
2.5
2.3
N
ever
1.
0 .5
.7
1.
4 .6
1.
0 1.
2 .7
.9
.4
.1
.2
.4
.3
.4
Note:
Sur
vey
of H
ealth
, Age
ing
and
Ret
irem
ent 2
004.
Rel
ease
0, w
eigh
ted.

Tab
le 4
A.1
3 L
ivin
g N
atur
al P
aren
ts (p
erce
ntag
es)
Tota
l
50-5
9
60
-69
70-7
9
80
+ M
en
Wom
enTo
tal
M
en
Wom
enTo
tal
M
en
Wom
enTo
tal
M
en
Wom
enTo
tal
M
en
Wom
en
Tota
l
Swed
en
Mot
her a
nd F
athe
r 7.
7 5.
9 6.
7 18
.6
16.0
17
.3
.9
1.2
1.1
.3
.0
.1
.0
.0
.0
M
othe
r onl
y 18
.7
17.1
17
.8
35.1
35
.1
35.1
15
.2
15.4
15
.3
2.2
3.4
2.9
.0
.0
.0
Fa
ther
onl
y 4.
0 3.
1 3.
5 7.
6 5.
8 6.
7 1.
7 3.
7 2.
7 .0
.0
.0
1.
5 .0
.5
Den
mar
k
Mot
her a
nd F
athe
r 7.
5 4.
9 6.
1 16
.0
11.4
13
.7
1.0
1.5
1.3
.0
.0
.0
.0
.0
.0
M
othe
r onl
y 19
.3
17.3
18
.2
32.5
36
.2
34.4
15
.1
11.6
13
.3
1.2
.9
1.0
.0
.0
.0
Fa
ther
onl
y 4.
6 2.
9 3.
7 8.
9 6.
5 7.
6 1.
7 .8
1.
2 .0
.0
.0
.0
.0
.0
Ger
man
y
Mot
her a
nd F
athe
r 5.
1 5.
3 5.
2 12
.1
16.9
14
.4
.8
.4
.6
.0
.2
.1
1.3
.0
.3
M
othe
r onl
y 18
.6
16.1
17
.2
36.7
34
.1
35.5
11
.7
14.8
13
.3
.0
2.8
1.7
.0
2.1
1.6
Fa
ther
onl
y 2.
0 1.
9 2.
0 4.
9 5.
8 5.
3 .0
.3
.1
.4
.0
.2
.0
.0
.0
Net
herla
nds
M
othe
r and
Fat
her
4.8
6.0
5.4
9.6
13.4
11
.6
1.1
1.8
1.5
.0
.0
.0
.0
.0
.0
M
othe
r onl
y 17
.5
13.8
15
.5
29.0
26
.8
27.9
11
.4
11.4
11
.4
1.4
1.7
1.6
2.1
.4
.9
Fa
ther
onl
y 3.
7 3.
0 3.
3 6.
9 6.
7 6.
8 2.
2 .8
1.
5 .0
.3
.2
.0
.0
.0
Fran
ce
Mot
her a
nd F
athe
r 6.
8 8.
4 7.
7 15
.4
20.4
18
.1
2.6
3.3
3.0
.0
.0
.0
.0
.0
.0
M
othe
r onl
y 20
.3
20.5
20
.4
37.2
36
.5
36.8
18
.4
19.0
18
.7
1.3
5.2
3.5
.0
5.0
3.2
Fa
ther
onl
y 3.
0 2.
5 2.
8 6.
1 7.
0 6.
6 2.
5 .0
1.
2 .0
.0
.0
.0
.0
.0
Switz
erla
nd
Mot
her a
nd F
athe
r 8.
7 8.
3 8.
5 18
.6
17.1
17
.9
.0
2.2
1.2
.0
.0
.0
2.6
1.8
2.1
M
othe
r onl
y 16
.0
16.3
16
.2
24.4
32
.3
28.4
16
.8
13.5
15
.1
.5
.0
.2
.0
2.8
1.8
Fa
ther
onl
y 3.
9 3.
8 3.
8 7.
5 8.
4 8.
0 2.
4 2.
2 2.
3 .0
.0
.0
.0
.0
.0
Aus
tria
M
othe
r and
Fat
her
5.5
3.8
4.6
16.1
11
.2
13.5
.0
1.
3 .7
.0
.0
.0
.0
.0
.0
Mot
her o
nly
15.3
14
.8
15.0
29
.7
30.9
30
.3
12.7
12
.3
12.5
.6
1.
3 1.
0 .0
4.
0 2.
9
Fath
er o
nly
2.5
2.0
2.2
5.1
3.6
4.3
1.6
1.8
1.7
.0
.0
.0
.0
.0
.0

Tab
le 4
A.1
3 (c
ont.)
Liv
ing
Nat
ural
Par
ents
Tota
l
50-5
9
60
-69
70-7
9
80
+ M
en
Wom
enTo
tal
M
en
Wom
enTo
tal
M
en
Wom
enTo
tal
M
en
Wom
enTo
tal
M
en
Wom
en
Tota
l
Italy
M
othe
r and
Fat
her
4.8
4.1
4.4
11.8
11
.5
11.6
.0
1.
7 1.
0 .0
.0
.0
.0
.0
.0
Mot
her o
nly
18.7
13
.2
15.6
33
.3
27.2
30
.3
15.1
10
.7
12.6
3.
1 3.
4 3.
3 .0
5.
7 4.
0
Fath
er o
nly
3.8
2.5
3.1
7.6
5.9
6.8
1.8
2.0
1.9
.2
.2
.2
3.2
.0
1.0
Spai
n
Mot
her a
nd F
athe
r 5.
3 5.
1 5.
2 13
.9
14.2
14
.0
.0
2.1
1.2
.3
.2
.3
.0
.4
.3
M
othe
r onl
y 15
.7
15.1
15
.3
31.4
35
.7
33.7
13
.2
10.2
11
.5
.4
2.1
1.4
.0
2.7
1.9
Fa
ther
onl
y 4.
2 3.
6 3.
9 7.
8 6.
9 7.
3 1.
5 5.
3 3.
6 .0
.0
.0
4.
3 .0
1.
3
Gre
ece
M
othe
r and
Fat
her
7.0
5.8
6.4
17.5
14
.1
15.7
1.
9 2.
6 2.
3 .0
.0
.0
.0
.0
.0
Mot
her o
nly
19.3
16
.4
17.7
35
.3
35.1
35
.2
15.3
12
.3
13.7
2.
8 2.
6 2.
7 .0
2.
5 1.
6
Fath
er o
nly
3.7
2.2
2.9
6.7
4.2
5.4
3.7
2.4
3.0
.0
.4
.2
.0
.0
.0
Tota
l
Mot
her a
nd F
athe
r 5.
7 5.
6 5.
6 13
.4
15.4
14
.4
.9
1.6
1.2
.1
.1
.1
.4
.1
.2
M
othe
r onl
y 18
.4
15.9
17
.0
34.3
32
.9
33.6
14
.0
13.6
13
.8
1.3
3.0
2.3
.1
3.2
2.3
Fa
ther
onl
y 3.
1 2.
5 2.
8 6.
4 6.
2 6.
3 1.
3 1.
5 1.
4 .2
.1
.1
1.
4 .0
.4
Note:
Sur
vey
of H
ealth
, Age
ing
and
Ret
irem
ent 2
004.
Rel
ease
0, w
eigh
ted.

Tab
le 4
A.1
4 Si
blin
gs(p
erce
ntag
es)
Tota
l
50-5
9
60
-69
70-7
9
80
+ M
en
Wom
enTo
tal
M
en
Wom
enTo
tal
M
en
Wom
enTo
tal
M
en
Wom
enTo
tal
M
en
Wom
en
Tota
l
“Hav
e yo
u ev
er h
ad a
ny si
blin
gs?”
Swed
en90
.9
89.8
90
.3
91.0
90
.2
90.6
88
.2
90.9
89
.6
93.6
87
.0
89.9
92
.1
90.8
91
.3
Den
mar
k90
.9
91.8
91
.4
91.4
92
.7
92.0
90
.8
88.5
89
.6
87.4
91
.2
89.5
94
.9
97.1
96
.4
Ger
man
y81
.8
81.8
81
.8
79.5
79
.7
79.6
80
.9
80.2
80
.5
90.0
83
.7
86.2
77
.5
87.5
85
.1
Net
herla
nds
95.3
95
.0
95.2
95
.6
95.8
95
.7
95.0
95
.2
95.1
96
.2
95.1
95
.6
90.6
91
.9
91.5
Fr
ance
88
.7
90.4
89
.6
91.2
94
.5
93.0
89
.8
92.0
90
.9
85.2
87
.0
86.2
81
.5
81.0
81
.2
Switz
erla
nd91
.9
92.1
92
.0
93.3
90
.8
92.0
91
.2
91.4
91
.3
89.4
91
.7
90.7
94
.9
96.4
95
.9A
ustri
a75
.5
76.8
76
.2
80.4
78
.1
79.2
73
.3
77.1
75
.3
72.8
73
.2
73.1
69
.6
77.4
75
.1
Italy
88.9
90
.6
89.8
88
.6
93.4
91
.0
89.9
89
.6
89.7
85
.7
94.0
90
.5
97.4
79
.7
85.0
Sp
ain
95
.1
96.2
95
.7
91.7
95
.7
93.9
97
.6
95.7
96
.5
95.4
96
.3
95.9
10
0.0
97.5
98
.2
Gre
ece
92.3
91
.7
92.0
91
.4
89.5
90
.4
93.6
94
.1
93.9
92
.1
93.2
92
.8
92.6
89
.0
90.3
To
tal
87
.7
88.6
88
.2
87.2
89
.4
88.3
87
.4
87.6
87
.5
89.0
89
.4
89.2
88
.7
87.2
87
.7
Num
ber o
f liv
ing
brot
hers
Swed
en
Non
e 43
.9
44.6
44
.3
39.3
31
.5
35.4
40
.2
36.2
38
.2
45.1
53
.5
49.9
67
.1
72.4
70
.4
O
ne
29.8
35
.5
32.8
32
.4
43.1
37
.8
30.2
40
.5
35.5
31
.3
30.7
31
.0
16.4
18
.4
17.6
Two
15.3
12
.6
13.9
15
.0
15.5
15
.3
19.2
14
.9
17.0
12
.0
9.3
10.5
11
.5
7.6
9.1
Th
ree
or m
ore
11.0
7.
3 9.
0 13
.3
9.9
11.6
10
.4
8.4
9.3
11.6
6.
4 8.
6 5.
0 1.
6 2.
9
Den
mar
k
Non
e 38
.6
42.7
40
.8
33.1
31
.2
32.1
35
.8
44.4
40
.2
47.0
52
.4
50.0
59
.9
57.0
57
.9
O
ne
34.3
34
.2
34.3
32
.0
41.1
36
.7
38.3
31
.1
34.6
35
.4
26.9
30
.6
25.3
31
.2
29.3
Two
17.2
15
.3
16.2
23
.4
20.4
21
.9
15.8
13
.9
14.8
9.
8 14
.8
12.6
8.
7 6.
0 6.
8
Thre
e or
mor
e 9.
9 7.
7 8.
7 11
.5
7.3
9.4
10.1
10
.6
10.4
7.
9 6.
0 6.
8 6.
1 5.
9 6.
0
Ger
man
y
Non
e 46
.7
54.1
50
.8
37.5
41
.2
39.3
46
.1
50.7
48
.5
57.4
60
.9
59.5
78
.4
78.7
78
.6
O
ne
32.8
30
.3
31.4
33
.7
36.4
35
.0
34.6
33
.0
33.8
31
.7
25.5
28
.0
19.1
17
.6
18.0
Two
14.5
11
.1
12.6
19
.8
14.9
17
.4
14.5
13
.8
14.1
7.
3 7.
1 7.
2 2.
5 3.
0 2.
9
Thre
e or
mor
e 6.
0 4.
6 5.
2 9.
0 7.
4 8.
3 4.
8 2.
5 3.
6 3.
6 6.
5 5.
3 .0
.6
.4

Tab
le 4
A.1
4 (c
ont.)
Sibl
ings
Tota
l
50-5
9
60
-69
70-7
9
80
+ M
en
Wom
enTo
tal
M
en
Wom
enTo
tal
M
en
Wom
enTo
tal
M
en
Wom
enTo
tal
M
en
Wom
en
Tota
l
Net
herla
nds
N
one
29.8
29
.9
29.8
24
.7
22.2
23
.4
25.0
23
.3
24.1
38
.8
30.9
34
.3
58.5
64
.1
62.5
One
27
.5
28.4
28
.0
28.2
30
.2
29.2
25
.3
28.2
26
.8
30.9
30
.4
30.6
23
.7
19.7
20
.8
Tw
o 18
.4
19.5
19
.0
18.2
21
.3
19.8
21
.1
20.3
20
.6
17.6
20
.8
19.5
9.
4 9.
8 9.
7
Thre
e or
mor
e 24
.4
22.2
23
.2
28.9
26
.4
27.6
28
.6
28.2
28
.4
12.7
17
.8
15.6
8.
4 6.
4 6.
9
Fran
ce
Non
e 36
.5
39.4
38
.1
27.7
23
.1
25.2
30
.4
35.7
33
.2
47.8
52
.1
50.2
72
.2
72.0
72
.1
O
ne
30.3
29
.5
29.9
29
.0
34.1
31
.7
36.6
32
.9
34.6
29
.0
25.8
27
.2
14.8
18
.0
16.9
Two
17.9
15
.4
16.5
24
.4
20.4
22
.3
14.9
14
.1
14.5
14
.2
12.6
13
.3
7.4
8.0
7.8
Th
ree
or m
ore
15.3
15
.6
15.5
18
.9
22.4
20
.8
18.1
17
.4
17.7
9.
0 9.
5 9.
3 5.
6 2.
0 3.
2
Switz
erla
nd
Non
e 33
.8
36.3
35
.2
26.4
31
.3
28.9
27
.6
36.1
32
.1
49.1
32
.9
40.0
59
.2
58.1
58
.5
O
ne
35.4
34
.5
34.9
37
.2
34.2
35
.7
40.2
38
.1
39.1
27
.0
35.2
31
.6
24.1
24
.0
24.0
Two
17.9
17
.6
17.7
21
.9
18.0
20
.0
18.8
18
.1
18.4
13
.4
19.9
17
.1
9.0
12.5
11
.3
Th
ree
or m
ore
12.9
11
.6
12.2
14
.5
16.5
15
.5
13.4
7.
8 10
.4
10.6
12
.0
11.4
7.
7 5.
4 6.
2
Aus
tria
N
one
48.8
53
.6
51.5
38
.5
46.5
42
.7
51.2
47
.2
49.1
56
.2
61.1
59
.0
69.6
78
.2
75.7
One
27
.1
29.0
28
.2
32.0
27
.3
29.5
26
.7
34.7
30
.9
22.2
28
.0
25.6
17
.4
16.1
16
.5
Tw
o 15
.0
11.8
13
.2
17.8
20
.1
19.0
14
.3
11.1
12
.6
11.7
6.
3 8.
6 13
.0
3.2
6.1
Th
ree
or m
ore
9.0
5.6
7.1
11.6
6.
0 8.
7 7.
8 7.
0 7.
4 9.
9 4.
6 6.
9 .0
2.
4 1.
7
Italy
N
one
40.2
41
.1
40.7
38
.4
29.2
33
.8
31.1
36
.7
34.2
47
.1
42.8
44
.6
67.8
75
.6
73.3
One
31
.3
30.6
30
.9
29.0
34
.9
31.9
36
.4
37.2
36
.9
30.7
24
.2
26.9
19
.2
18.1
18
.4
Tw
o 13
.5
17.3
15
.6
15.9
23
.1
19.5
15
.1
14.8
14
.9
11.2
19
.9
16.3
3.
2 4.
3 4.
0
Thre
e or
mor
e 15
.0
11.0
12
.7
16.7
12
.8
14.8
17
.4
11.3
14
.0
11.1
13
.1
12.3
9.
8 1.
9 4.
3

Tab
le 4
A.1
4 (c
ont.)
Sibl
ings
Tota
l
50-5
9
60
-69
70-7
9
80
+ M
en
Wom
enTo
tal
M
en
Wom
enTo
tal
M
en
Wom
enTo
tal
M
en
Wom
enTo
tal
M
en
Wom
en
Tota
l
Spai
n
Non
e 32
.5
35.1
34
.0
24.6
24
.4
24.5
27
.1
27.1
27
.1
44.0
42
.2
43.0
51
.7
58.8
56
.6
O
ne
29.7
34
.1
32.2
34
.6
42.6
38
.8
30.6
37
.3
34.3
23
.4
27.5
25
.8
25.5
23
.3
23.9
Two
18.8
17
.1
17.8
20
.2
18.7
19
.4
18.4
16
.1
17.2
16
.9
16.7
16
.8
16.1
13
.3
14.1
Thre
e or
mor
e 19
.0
13.8
15
.9
20.7
14
.4
17.3
23
.8
19.5
21
.4
15.7
13
.5
14.4
6.
8 4.
6 5.
3
Gre
ece
N
one
36.3
39
.6
38.1
34
.7
35.3
35
.0
31.2
34
.4
32.9
43
.3
43.6
43
.5
44.3
58
.0
53.1
One
35
.9
36.7
36
.3
36.3
42
.5
39.5
39
.2
40.4
39
.8
31.3
28
.4
29.7
33
.1
27.9
29
.8
Tw
o 15
.9
13.8
14
.8
18.2
14
.5
16.3
15
.5
15.6
15
.6
12.5
13
.5
13.1
15
.2
6.7
9.7
Th
ree
or m
ore
12.0
9.
8 10
.8
10.8
7.
6 9.
2 14
.1
9.6
11.7
12
.8
14.5
13
.8
7.4
7.4
7.4
Tota
l
Non
e 40
.1
43.7
42
.1
33.4
31
.3
32.3
36
.6
39.9
38
.3
49.2
49
.6
49.4
66
.7
71.5
70
.0
O
ne
31.4
31
.2
31.3
31
.8
36.4
34
.2
34.3
34
.8
34.6
29
.5
26.4
27
.7
20.3
19
.5
19.7
Two
15.8
14
.7
15.2
19
.5
18.7
19
.1
15.7
14
.7
15.2
11
.9
13.6
12
.9
7.6
6.5
6.9
Th
ree
or m
ore
12.7
10
.4
11.4
15
.2
13.5
14
.4
13.4
10
.5
11.9
9.
4 10
.4
10.0
5.
4 2.
5 3.
4
Num
ber o
f liv
ing
Sist
ers
Swed
en
Non
e 40
.3
43.4
42
.0
38.3
36
.8
37.5
37
.1
39.6
38
.4
41.6
42
.6
42.1
55
.2
63.2
60
.2
O
ne
34.1
31
.5
32.7
35
.0
35.2
35
.1
36.5
31
.0
33.7
33
.1
32.1
32
.5
24.1
23
.8
23.9
Two
15.9
15
.0
15.4
15
.6
16.3
16
.0
17.8
18
.8
18.3
13
.7
14.9
14
.4
16.5
7.
6 10
.9
Th
ree
or m
ore
9.7
10.1
9.
9 11
.0
11.7
11
.4
8.6
10.5
9.
6 11
.6
10.5
11
.0
4.3
5.4
5.0
Den
mar
k
Non
e 40
.6
40.1
40
.3
36.3
35
.6
35.9
42
.0
37.5
39
.7
44.5
43
.5
43.9
58
.2
52.1
54
.0
O
ne
32.3
30
.1
31.1
36
.5
32.6
34
.5
25.2
31
.5
28.5
33
.2
28.7
30
.7
25.1
23
.1
23.7
Two
16.3
19
.4
17.9
15
.2
19.9
17
.6
19.9
18
.1
19.0
13
.7
21.9
18
.3
12.3
17
.1
15.6
Thre
e or
mor
e 10
.8
10.4
10
.6
12.0
11
.9
12.0
12
.9
12.9
12
.9
8.6
5.9
7.1
4.5
7.7
6.7

Tab
le 4
A.1
4 (c
ont.)
Sibl
ings
Tota
l
50-5
9
60
-69
70-7
9
80
+ M
en
Wom
enTo
tal
M
en
Wom
enTo
tal
M
en
Wom
enTo
tal
M
en
Wom
enTo
tal
M
en
Wom
en
Tota
l
Ger
man
y
Non
e 48
.8
49.1
49
.0
51.5
49
.1
50.3
45
.8
44.8
45
.3
45.1
50
.0
48.0
59
.9
58.7
59
.0
O
ne
33.2
32
.3
32.7
31
.8
31.3
31
.6
34.7
35
.0
34.9
33
.6
30.8
31
.9
32.5
30
.0
30.6
Two
10.5
11
.9
11.2
8.
6 11
.7
10.1
11
.6
13.6
12
.7
13.1
12
.5
12.7
7.
6 6.
9 7.
0
Thre
e or
mor
e 7.
6 6.
7 7.
1 8.
0 7.
9 8.
0 7.
9 6.
6 7.
2 8.
3 6.
8 7.
4 .0
4.
5 3.
4
Net
herla
nds
N
one
26.1
27
.7
26.9
23
.4
22.4
22
.8
21.3
23
.8
22.6
32
.1
27.1
29
.2
44.9
50
.8
49.1
One
29
.3
29.2
29
.3
27.3
31
.2
29.3
32
.1
31.3
31
.7
31.1
28
.5
29.6
23
.7
22.6
22
.9
Tw
o 20
.6
19.3
19
.9
23.7
21
.1
22.4
20
.8
19.7
20
.2
15.5
21
.9
19.1
15
.7
9.3
11.1
Thre
e or
mor
e 24
.0
23.8
23
.9
25.7
25
.3
25.5
25
.8
25.2
25
.5
21.4
22
.6
22.1
15
.7
17.4
16
.9
Fran
ce
Non
e 34
.1
36.4
35
.4
28.8
24
.8
26.7
29
.7
31.5
30
.6
38.7
44
.2
41.7
63
.0
68.0
66
.2
O
ne
32.0
28
.9
30.3
31
.6
30.7
31
.1
32.8
32
.4
32.6
35
.5
28.4
31
.6
22.2
16
.0
18.2
Two
19.2
17
.0
18.0
19
.6
20.3
20
.0
22.6
16
.4
19.4
16
.8
17.4
17
.1
13.0
8.
0 9.
7
Thre
e or
mor
e 14
.6
17.6
16
.3
20.0
24
.1
22.2
14
.9
19.7
17
.4
9.0
10.0
9.
5 1.
9 8.
0 5.
8
Switz
erla
nd
Non
e 31
.8
32.6
32
.3
27.5
26
.6
27.0
37
.3
35.3
36
.3
30.7
33
.0
32.0
39
.3
44.8
42
.9
O
ne
37.0
34
.6
35.7
38
.8
38.5
38
.6
33.5
35
.3
34.4
36
.8
30.4
33
.2
38.9
31
.1
33.8
Two
15.4
16
.3
15.9
16
.3
19.0
17
.7
14.7
14
.7
14.7
16
.6
17.7
17
.2
11.6
7.
0 8.
6
Thre
e or
mor
e 15
.7
16.5
16
.1
17.4
15
.9
16.7
14
.5
14.7
14
.6
16.0
18
.9
17.6
10
.3
17.0
14
.7
Aus
tria
N
one
51.3
48
.7
49.9
46
.9
39.8
43
.2
51.6
46
.2
48.7
51
.9
55.2
53
.8
76.1
70
.2
71.9
One
28
.4
31.3
30
.0
27.3
36
.2
32.0
29
.5
34.2
32
.0
30.2
25
.1
27.3
21
.7
17.7
18
.9
Tw
o 12
.6
12.5
12
.5
16.4
13
.5
14.8
11
.2
13.1
12
.2
11.1
11
.7
11.5
2.
2 9.
7 7.
5
Thre
e or
mor
e 7.
7 7.
5 7.
6 9.
5 10
.5
10.0
7.
8 6.
5 7.
1 6.
8 7.
9 7.
5 .0
2.
4 1.
7

Tab
le 4
A.1
4 (c
ont.)
Sibl
ings
Tota
l
50-5
9
60
-69
70-7
9
80
+ M
en
Wom
enTo
tal
M
en
Wom
enTo
tal
M
en
Wom
enTo
tal
M
en
Wom
enTo
tal
M
en
Wom
en
Tota
l
Italy
N
one
37.9
36
.0
36.9
37
.1
28.1
32
.6
34.0
33
.5
33.7
38
.1
37.2
37
.6
59.1
58
.0
58.3
One
30
.9
32.0
31
.5
31.7
34
.4
33.0
30
.3
36.5
33
.8
32.9
31
.5
32.1
18
.1
17.0
17
.3
Tw
o 17
.3
17.2
17
.2
17.2
17
.7
17.5
21
.1
16.0
18
.2
15.2
18
.4
17.1
10
.4
16.8
14
.9
Th
ree
or m
ore
13.9
14
.8
14.4
13
.9
19.8
16
.9
14.7
14
.0
14.3
13
.8
12.9
13
.3
12.5
8.
3 9.
5
Spai
n
Non
e 34
.0
34.0
34
.0
38.5
29
.2
33.6
24
.5
29.6
27
.4
37.1
36
.0
36.4
37
.7
46.3
43
.8
O
ne
32.5
30
.9
31.6
33
.8
33.1
33
.4
36.2
31
.1
33.4
27
.4
29.4
28
.6
31.3
29
.2
29.8
Two
19.9
19
.5
19.7
15
.2
22.4
19
.1
23.0
18
.6
20.5
21
.9
19.6
20
.5
25.0
15
.2
18.1
Thre
e or
mor
e 13
.5
15.6
14
.7
12.5
15
.2
14.0
16
.2
20.7
18
.7
13.6
15
.0
14.5
5.
9 9.
3 8.
3
Gre
ece
N
one
36.8
34
.8
35.7
37
.3
36.7
37
.0
32.9
29
.4
31.0
35
.7
31.0
33
.0
57.3
53
.0
54.6
One
34
.9
36.4
35
.7
37.8
36
.6
37.2
37
.2
41.3
39
.4
31.0
33
.6
32.5
19
.7
26.6
24
.1
Tw
o 15
.9
15.9
15
.9
14.8
17
.4
16.1
13
.0
13.1
13
.1
24.6
19
.5
21.7
11
.8
13.4
12
.8
Th
ree
or m
ore
12.4
12
.9
12.7
10
.0
9.3
9.7
17.0
16
.1
16.5
8.
7 15
.9
12.8
11
.2
7.0
8.5
Tota
l
Non
e 39
.8
39.9
39
.9
39.6
34
.3
36.9
36
.7
36.6
36
.7
40.0
41
.7
41.0
55
.3
57.3
56
.7
O
ne
32.3
31
.5
31.8
32
.3
32.7
32
.5
33.4
34
.4
33.9
32
.6
30.2
31
.2
25.8
24
.2
24.7
Two
15.7
15
.7
15.7
14
.8
17.2
16
.1
17.2
15
.6
16.3
16
.1
16.7
16
.4
13.1
10
.9
11.6
Thre
e or
mor
e 12
.2
12.9
12
.6
13.3
15
.7
14.5
12
.7
13.4
13
.0
11.3
11
.4
11.3
5.
7 7.
6 7.
0
Note:
Sur
vey
of H
ealth
, Age
ing
and
Ret
irem
ent 2
004.
Rel
ease
0, w
eigh
ted.

Tab
le 4
A.1
5 N
umbe
r of
Liv
ing
Chi
ldre
n (p
erce
ntag
es)
Tota
l
50-5
9
60
-69
70-7
9
80
+ M
en
Wom
enTo
tal
M
en
Wom
enTo
tal
M
en
Wom
enTo
tal
M
en
Wom
enTo
tal
M
en
Wom
en
Tota
l
Swed
en
Non
e 9.
2 10
.3
9.8
9.5
7.6
8.5
7.4
7.1
7.3
9.3
12.8
11
.3
10.0
18
.1
15.1
One
12
.6
17.8
15
.4
10.8
17
.9
14.4
12
.0
15.9
14
.0
13.4
17
.7
15.8
17
.6
21.3
19
.9
Tw
o 39
.8
36.7
38
.2
39.5
35
.8
37.6
41
.0
37.5
39
.2
38.6
41
.9
40.5
40
.8
30.3
34
.2
Th
ree
or m
ore
38.4
35
.2
36.7
40
.1
38.8
39
.5
39.6
39
.5
39.5
38
.7
27.7
32
.4
31.5
30
.3
30.7
Den
mar
k
Non
e 11
.2
10.3
10
.8
13.4
8.
8 11
.1
7.9
6.7
7.3
13.6
12
.6
13.0
7.
4 17
.1
14.0
O
ne
13.2
14
.7
14.0
15
.3
15.3
15
.3
11.4
11
.7
11.5
13
.8
18.2
16
.3
6.9
15.0
12
.4
Tw
o 40
.2
39.7
39
.9
39.3
45
.7
42.5
42
.7
40.0
41
.3
36.0
33
.4
34.6
44
.2
30.6
35
.0
Th
ree
or m
ore
35.3
35
.3
35.3
32
.0
30.2
31
.1
38.0
41
.7
39.9
36
.6
35.8
36
.1
41.5
37
.3
38.6
Ger
man
y
Non
e 18
.1
14.6
16
.2
23.1
13
.9
18.6
17
.3
12.1
14
.6
10.3
16
.8
14.2
12
.7
18.0
16
.7
O
ne
22.0
25
.4
23.9
21
.7
24.8
23
.2
21.1
23
.5
22.4
25
.3
23.8
24
.4
18.4
32
.5
29.1
Two
35.9
33
.5
34.6
35
.1
39.3
37
.2
37.1
35
.6
36.3
32
.8
29.6
30
.9
45.3
23
.5
28.7
Thre
e or
mor
e 24
.0
26.4
25
.4
20.2
21
.9
21.0
24
.5
28.8
26
.7
31.6
29
.7
30.4
23
.5
26.0
25
.4
Net
herla
nds
N
one
12.6
12
.4
12.5
17
.0
12.6
14
.7
9.1
9.8
9.5
6.1
11.7
9.
3 10
.5
18.2
16
.0
O
ne
10.6
12
.1
11.4
9.
0 14
.9
12.0
11
.8
9.4
10.6
10
.3
13.3
12
.0
18.8
6.
4 10
.0
Tw
o 41
.8
36.6
39
.0
43.5
43
.8
43.7
46
.2
38.3
42
.2
31.9
27
.3
29.3
40
.8
27.5
31
.3
Th
ree
or m
ore
35.0
39
.0
37.2
30
.4
28.8
29
.6
32.9
42
.5
37.8
51
.7
47.8
49
.4
30.0
47
.9
42.7
Fran
ce
Non
e 12
.7
11.3
11
.9
8.3
7.9
8.1
10.1
9.
2 9.
7 19
.1
14.2
16
.4
21.4
20
.2
20.6
One
17
.6
21.3
19
.6
17.4
23
.4
20.6
17
.7
19.4
18
.6
16.6
20
.3
18.6
23
.2
20.2
21
.3
Tw
o 31
.8
29.7
30
.7
38.4
33
.1
35.5
32
.3
32.4
32
.4
27.4
25
.9
26.5
16
.1
21.2
19
.3
Th
ree
or m
ore
37.9
37
.8
37.8
35
.9
35.5
35
.7
39.9
38
.9
39.4
36
.9
39.6
38
.4
39.3
38
.4
38.7

Tab
le 4
A.1
5 (c
ont.)
Num
ber
of L
ivin
g C
hild
ren
Tota
l50
-59
60-6
970
-79
80+
Men
W
omen
Tota
l
Men
W
omen
Tota
l
Men
W
omen
Tota
l
Men
W
omen
Tota
l
Men
W
omen
To
tal
Switz
erla
nd
Non
e 13
.8
13.5
13
.6
14.1
13
.1
13.6
17
.4
16.1
16
.7
8.1
8.4
8.3
12.7
16
.8
15.4
One
13
.7
17.6
15
.8
9.2
12.1
10
.7
13.4
15
.5
14.5
17
.0
24.6
21
.3
26.7
25
.1
25.6
Two
41.1
37
.4
39.1
48
.3
47.7
48
.0
42.1
37
.6
39.8
31
.2
29.2
30
.1
20.4
24
.2
22.9
Thre
e or
mor
e 31
.4
31.5
31
.5
28.4
27
.1
27.8
27
.0
30.7
28
.9
43.7
37
.8
40.4
40
.3
34.0
36
.1
Aus
tria
N
one
14.5
15
.1
14.9
16
.5
14.3
15
.4
13.3
14
.3
13.8
9.
9 13
.2
11.8
28
.3
24.8
25
.8
O
ne
20.8
24
.5
22.9
18
.0
22.4
20
.3
19.8
25
.7
22.9
27
.2
25.6
26
.3
21.7
25
.6
24.5
Two
36.6
34
.9
35.6
36
.0
39.4
37
.8
40.7
34
.3
37.3
31
.5
31.8
31
.7
28.3
31
.2
30.4
Thre
e or
mor
e 28
.1
25.5
26
.6
29.5
23
.9
26.6
26
.2
25.7
25
.9
31.5
29
.3
30.2
21
.7
18.4
19
.4
Italy
N
one
10.9
17
.6
14.7
12
.2
11.5
11
.9
10.3
13
.6
12.1
9.
5 14
.1
12.2
11
.6
47.5
36
.7
O
ne
23.4
18
.9
20.9
23
.6
18.3
21
.0
22.8
22
.3
22.5
23
.7
20.4
21
.7
18.2
10
.0
12.4
Two
41.0
36
.3
38.4
41
.8
47.7
44
.8
42.6
34
.8
38.2
42
.9
35.5
38
.6
27.0
15
.5
19.0
Thre
e or
mor
e 24
.7
27.1
26
.0
22.3
22
.5
22.4
24
.3
29.4
27
.2
24.0
30
.0
27.5
43
.2
27.0
31
.9
Spai
n
Non
e 15
.0
13.0
13
.8
18.8
12
.4
15.4
11
.4
8.5
9.8
10.8
12
.6
11.8
21
.4
22.6
22
.2
O
ne
13.4
12
.3
12.8
15
.1
11.7
13
.3
9.7
10.6
10
.2
13.0
10
.7
11.7
14
.4
19.3
17
.8
Tw
o 30
.1
31.5
30
.9
35.3
36
.0
35.7
27
.7
32.4
30
.3
28.6
32
.5
30.9
21
.6
18.5
19
.4
Th
ree
or m
ore
41.6
43
.2
42.5
30
.8
39.9
35
.7
51.2
48
.6
49.7
47
.6
44.2
45
.6
42.7
39
.7
40.6
Gre
ece
N
one
10.0
10
.5
10.3
9.
7 11
.2
10.5
11
.3
12.5
12
.0
9.3
8.4
8.8
8.7
8.1
8.3
O
ne
14.4
17
.5
16.1
11
.5
19.5
15
.6
15.5
17
.5
16.6
18
.6
17.7
18
.1
10.2
12
.5
11.7
Two
53.9
48
.6
51.0
59
.6
51.7
55
.6
53.3
48
.0
50.4
47
.7
47.1
47
.3
45.8
41
.7
43.1
Thre
e or
mor
e 21
.6
23.3
22
.5
19.3
17
.6
18.4
19
.9
22.0
21
.0
24.4
26
.8
25.8
35
.3
37.7
36
.8
Tota
l
Non
e 14
.1
14.0
14
.0
16.0
11
.7
13.8
13
.0
11.4
12
.1
11.5
14
.2
13.0
15
.2
24.7
21
.9
O
ne
18.8
20
.0
19.5
18
.4
19.9
19
.2
18.3
19
.8
19.1
19
.9
19.6
19
.7
18.3
21
.1
20.3
Two
37.0
34
.3
35.5
39
.1
40.5
39
.8
38.1
35
.4
36.6
34
.2
31.8
32
.8
30.9
22
.2
24.8
Thre
e or
mor
e 30
.1
31.7
31
.0
26.4
28
.0
27.2
30
.6
33.4
32
.1
34.4
34
.4
34.4
35
.5
32.0
33
.1
Note:
Sur
vey
of H
ealth
, Age
ing
and
Ret
irem
ent 2
004.
Rel
ease
0, w
eigh
ted.

Tab
le 4
A.1
6 N
umbe
r of
Liv
ing
Gra
ndch
ildre
n (p
erce
ntag
es)
Tota
l
50-5
9
60
-69
70-7
9
80
+ M
en
Wom
enTo
tal
M
en
Wom
enTo
tal
M
en
Wom
enTo
tal
M
en
Wom
enTo
tal
M
en
Wom
en
Tota
l
Swed
en
Non
e 30
.9
21.1
25
.7
58.4
43
.8
51.0
18
.2
11.6
14
.8
8.1
6.2
7.0
8.0
4.7
6.0
O
ne
9.8
8.8
9.3
12.4
9.
3 10
.8
10.1
12
.6
11.4
5.
2 6.
7 6.
0 6.
4 2.
7 4.
1
Two
13.7
15
.2
14.5
9.
8 15
.2
12.5
16
.6
16.1
16
.3
15.6
13
.2
14.3
16
.5
17.2
16
.9
Thre
e or
mor
e 45
.7
54.9
50
.6
19.4
31
.7
25.7
55
.1
59.7
57
.4
71.1
73
.9
72.7
69
.2
75.4
72
.9
Den
mar
k
Non
e 30
.8
21.2
25
.6
53.4
38
.2
45.5
15
.2
12.8
14
.0
9.5
7.4
8.4
3.5
5.9
5.1
O
ne
10.5
9.
5 10
.0
11.8
15
.6
13.8
13
.9
7.8
10.8
6.
0 3.
9 4.
8 2.
5 2.
0 2.
2
Two
14.5
14
.9
14.7
12
.5
16.3
14
.5
16.4
13
.1
14.7
20
.1
17.3
18
.6
8.3
11.2
10
.2
Th
ree
or m
ore
44.2
54
.3
49.6
22
.3
29.9
26
.3
54.5
66
.3
60.5
64
.3
71.4
68
.2
85.6
80
.8
82.5
Ger
man
y
Non
e 36
.4
26.9
31
.1
62.6
50
.9
56.6
28
.9
24.4
26
.5
12.2
9.
3 10
.6
6.5
7.0
6.9
O
ne
15.0
13
.9
14.4
15
.6
17.5
16
.6
16.4
13
.2
14.7
8.
9 12
.0
10.7
21
.9
11.2
13
.9
Tw
o 18
.0
19.5
18
.9
10.6
17
.3
14.1
20
.2
19.5
19
.8
26.0
22
.6
24.0
22
.5
19.4
20
.2
Th
ree
or m
ore
30.6
39
.6
35.7
11
.1
14.2
12
.7
34.5
42
.8
39.0
52
.8
56.0
54
.7
49.0
62
.4
59.0
Net
herla
nds
N
one
38.2
28
.0
32.6
65
.8
53.9
59
.5
23.0
13
.7
18.3
7.
0 9.
1 8.
2 14
.3
3.7
7.0
O
ne
11.1
10
.8
11.0
13
.6
14.5
14
.1
13.1
13
.7
13.4
5.
5 5.
5 5.
5 4.
8 1.
5 2.
5
Two
13.4
13
.9
13.7
10
.4
14.9
12
.8
18.2
13
.2
15.6
12
.4
14.1
13
.4
16.7
14
.0
14.8
Thre
e or
mor
e 37
.3
47.3
42
.7
10.1
16
.8
13.7
45
.8
59.4
52
.7
75.0
71
.3
72.9
64
.1
80.8
75
.7
Fran
ce
Non
e 30
.8
23.0
26
.5
58.2
43
.5
50.3
16
.3
12.2
14
.2
7.9
9.5
8.8
6.8
6.3
6.5
O
ne
14.3
13
.0
13.6
18
.5
18.0
18
.2
14.6
12
.8
13.6
8.
7 7.
7 8.
1 6.
8 7.
6 7.
3
Two
12.1
12
.7
12.4
9.
9 12
.8
11.4
16
.3
14.3
15
.2
8.6
11.2
10
.1
15.9
12
.7
13.8
Thre
e or
mor
e 42
.8
51.3
47
.5
13.3
25
.8
20.0
52
.8
60.7
56
.9
74.8
71
.6
73.0
70
.5
73.4
72
.4
Switz
erla
nd
Non
e 45
.2
38.9
41
.8
74.2
66
.4
70.3
30
.5
27.2
28
.8
13.4
14
.6
14.1
12
.9
19.3
17
.0
O
ne
9.1
10.1
9.
6 7.
7 15
.7
11.7
12
.6
8.3
10.4
10
.4
8.5
9.4
2.9
2.2
2.4
Tw
o 14
.4
13.1
13
.7
6.5
6.6
6.6
19.6
18
.2
18.8
18
.8
17.9
18
.3
29.4
15
.2
20.2
Thre
e or
mor
e 31
.3
37.9
34
.9
11.6
11
.3
11.4
37
.3
46.3
42
.0
57.3
58
.9
58.2
54
.8
63.4
60
.4

Tab
le 4
A.1
6 (c
ont.)
Num
ber
of L
ivin
g G
rand
child
ren
Tota
l
50-5
9
60
-69
70-7
9
80
+ M
en
Wom
enTo
tal
M
en
Wom
enTo
tal
M
en
Wom
enTo
tal
M
en
Wom
enTo
tal
M
en
Wom
en
Tota
l
Aus
tria
N
one
30.7
23
.3
26.6
49
.1
40.1
44
.3
27.4
20
.2
23.6
12
.4
9.5
10.8
9.
1 11
.8
11.1
One
15
.2
16.2
15
.7
16.8
16
.4
16.6
16
.4
17.1
16
.7
11.7
14
.3
13.2
6.
1 15
.1
12.5
Two
18.2
17
.5
17.8
14
.2
16.0
15
.2
19.2
18
.2
18.7
22
.8
19.5
20
.9
18.2
15
.1
15.9
Thre
e or
mor
e 35
.9
43.0
39
.8
19.8
27
.5
23.9
37
.0
44.5
41
.0
53.1
56
.7
55.1
66
.7
58.1
60
.5
Italy
N
one
44.2
31
.2
37.2
65
.2
58.3
61
.7
43.8
27
.5
34.7
19
.1
8.7
13.2
10
.2
10.2
10
.2
O
ne
14.7
13
.7
14.2
17
.7
16.2
17
.0
11.6
12
.9
12.3
16
.0
13.6
14
.6
10.0
7.
8 8.
7
Two
15.0
19
.5
17.4
10
.4
10.6
10
.5
17.8
27
.8
23.4
20
.3
23.4
22
.1
12.6
9.
4 10
.7
Th
ree
or m
ore
26.0
35
.6
31.2
6.
7 14
.8
10.8
26
.8
31.8
29
.6
44.6
54
.4
50.2
67
.2
72.6
70
.3
Spai
n
Non
e 35
.9
25.2
29
.7
76.0
60
.3
67.4
20
.9
11.7
15
.7
6.2
6.2
6.2
1.4
5.4
4.2
O
ne
12.9
12
.3
12.6
15
.4
20.0
17
.9
18.8
12
.6
15.3
6.
4 8.
1 7.
4 2.
7 .5
1.
2
Two
15.5
14
.7
15.0
6.
0 10
.4
8.4
22.8
22
.8
22.8
20
.7
13.0
16
.1
17.2
13
.1
14.3
Thre
e or
mor
e 35
.7
47.8
42
.8
2.6
9.3
6.3
37.6
52
.9
46.3
66
.7
72.7
70
.3
78.6
81
.0
80.3
Gre
ece
N
one
52.5
33
.6
42.2
87
.0
70.2
78
.5
47.6
26
.8
36.6
16
.1
6.7
10.7
6.
4 2.
2 3.
7
One
9.
5 9.
6 9.
6 7.
3 12
.2
9.8
13.9
12
.7
13.3
8.
5 5.
8 7.
0 4.
0 2.
3 2.
9
Two
11.9
14
.0
13.0
3.
6 9.
2 6.
4 15
.7
15.4
15
.6
17.5
19
.9
18.9
18
.6
12.1
14
.4
Th
ree
or m
ore
26.2
42
.8
35.2
2.
2 8.
4 5.
3 22
.8
45.1
34
.6
58.0
67
.6
63.5
70
.9
83.4
78
.9
Tota
l
Non
e 37
.6
27.1
31
.8
64.8
52
.7
58.5
28
.9
20.7
24
.5
12.0
8.
6 10
.0
7.3
7.0
7.1
O
ne
13.7
12
.9
13.2
15
.7
16.8
16
.3
14.8
12
.9
13.8
9.
9 10
.2
10.1
10
.0
6.9
7.9
Tw
o 15
.3
16.8
16
.1
9.6
13.4
11
.6
18.8
20
.1
19.5
19
.4
18.4
18
.8
17.4
14
.9
15.8
Thre
e or
mor
e 33
.5
43.3
38
.9
9.9
17.0
13
.6
37.5
46
.3
42.2
58
.8
62.7
61
.1
65.3
71
.2
69.3
Note:
Sur
vey
of H
ealth
, Age
ing
and
Ret
irem
ent 2
004.
Rel
ease
0, w
eigh
ted.

Table 4A.17 Prevalence (%) of Low Quality of Work (effort-reward ratio > 1.0) in 10 European Countries According to Socio-Demographic
and Socio-Economic Characteristics AT CH DE DK ES GR IT NL SE FR N 485 494 986 698 407 607 543 924 955 423 Gender Male 49.0 32.8 48.6 36.7 43.0 53.5 56.2 31.0 36.1 39.9 Female 39.6 24.1 39.2 43.4 44.1 52.6 47.0 26.2 41.2 39.0 Age < 55 48.3 25.7 48.0 40.3 38.8 50.5 62.3 29.3 44.1 41.4 55-59 42.6 28.8 47.5 47.7 53.3 52.7 39.4 31.1 37.3 40.2 > 60 40.6 33.1 32.3 27.4 38.8 58.9 53.8 21.2 33.1 19.3 Education Low 52.7 33.4 44.3 40.5 50.0 73.5 59.4 31.7 46.2 39.7 High 43.4 25.9 44.2 39.8 29.8 39.2 46.8 27.1 33.4 39.4
Table 4A.18 Prevalence (%) of Low Quality of Work (low control: upper tertile of scoresa) in 10 European Countries According to Socio-Demographic
and Socio-Economic Characteristics AT CH DE DK ES GR IT NL SE FR N 489 513 1030 718 412 644 543 956 979 443 Gender Male 19.5 28.1 35.8 29.6 21.9 23.6 22.7 24.0 19.8 38.3 Female 25.7 36.1 41.0 30.6 28.2 26.9 16.7 31.1 31.0 49.8 Age < 55 23.7 27.5 39.4 23.4 20.5 26.8 24.4 28.7 22.9 40.0 55-59 20.4 30.5 37.6 34.2 28.3 22.5 17.9 26.2 27.4 51.2 > 60 22.1 37.2 35.9 36.7 28.2 22.9 17.1 22.3 25.6 44.1 Education Low 35.2 40.7 57.9 39.2 29.5 32.3 27.2 33.9 33.7 56.5 High 19.9 24.5 36.0 28.7 14.1 18.9 15.2 22.1 19.2 38.8 Note: a tertiles calculated for each country separately
Table 4A.19 Prevalence (%) of Low Quality of Work (effort-reward ratio > 1.0) in 10 European Countries According to Two Indicators of Well-Being
AT CH DE DK ES GR IT NL SE FR N 485 494 986 698 407 607 543 924 955 423 EURO-D Yes 50.2 29.2 66.8 56.0 49.1 60.8 62.5 39.7 49.4 46.4 No 43.8 29.0 41.4 36.9 41.8 52.2 49.8 26.7 37.1 36.7 SRH a Good 39.5 25.8 42.5 38.1 39.3 51.5 48.5 26.3 35.4 33.4 Bad 63.1 51.9 51.0 48.0 55.2 63.2 62.0 42.3 49.9 59.7 Note: a SRH: Self-rated health (Good: good or better / Bad: less than good)
Table 4A.20 Prevalence (%) of Low Quality of Work (low control: upper tertile of scoresa)in 10 European Countries According to Two Indicators of Well-Being
AT CH DE DK ES GR IT NL SE FR N 489 513 1030 718 412 644 543 956 979 443 EURO-D Yes 28.9 49.1 51.0 39.0 31.1 31.8 21.4 35.1 30.4 56.3 No 21.1 28.6 36.5 28.6 22.4 23.6 20.2 25.5 24.4 37.7 SRH b Good 20.6 29.0 35.6 27.4 21.5 23.7 15.6 24.0 23.2 38.4 Bad 28.0 49.8 46.6 43.1 32.9 30.1 31.0 41.8 32.3 64.7 Note: a tertiles calculated for each country separately. b SRH: Self-rated health (Good: good or better / Bad: less than good)

Table 4A.21 Quality of Life in Nine European Countries (CASP-12: means of domains and sum score)
Country N Control Autonomy Self-realisation Pleasure CASP
(sum score) SE 1478 8.54 9.29 9.65 11.14 38.70 DK 666 8.80 9.55 10.12 11.22 39.76DE 1809 9.05 9.05 9.02 10.56 37.71 NL 1909 9.27 9.18 9.77 10.81 39.07 CH 669 9.44 9.41 10.33 11.20 40.47 AT 1663 9.01 8.97 9.42 10.86 38.33 IT 1133 8.44 7.77 8.71 9.35 34.26 ES 1149 8.54 8.22 8.57 9.90 35.20 GR 1827 7.79 7.73 8.41 9.50 33.43 Total 12303 8.78 8.63 9.02 10.24 36.66
Table 4A.22 CASP-12 (mean sum score) by Demographic CharacteristicsCountry Male Female 50-64 years 65-74 years > 75 years SE 38.99 38.45 39.39 38.86 36.77 DK 39.61 39.89 40.16 39.81 37.97 DE 37.94 37.52 38.49 37.60 35.71 NL 39.13 39.03 39.59 38.66 37.88 CH 40.50 40.44 40.56 40.89 39.71 AT 38.71 38.01 39.41 37.86 35.30 IT 34.93 33.70 35.14 33.57 32.45 ES 36.58 34.20 36.88 34.22 32.77 GR 34.63 32.41 34.92 32.76 29.64 Total 37.19 36.23 37.61 36.13 34.66
Table 4A.23 CASP-12 (mean sum score) by Socio-Economic Status Country Education Equivalence Income Primary or
lower sec. Upper sec. or
tertiary Lower tertile Middle Upper tertile
SE 38.10 39.37 37.51 38.80 39.89 DK 39.08 39.96 38.39 39.33 41.20 DE 35.34 38.21 35.68 37.86 39.48 NL 38.36 39.92 37.79 39.21 40.18 CH 40.07 40.89 39.83 40.59 40.93 AT 36.51 39.08 37.08 38.45 39.39 IT 33.43 36.16 33.64 34.33 34.78 ES 34.51 39.27 34.47 34.32 37.01 GR 32.15 35.76 32.37 33.02 34.99 Total 34.85 38.21 35.35 36.61 37.98