4 q14 vf
TRANSCRIPT

March 31, 2015
4Q14 AND 2014 EARNINGS RELEASE

Highlights | Corporate
2
The only Brazil’s mixed market player that features exposure and expansion capacity
in the segments of Retail, Hospital & Specialties and Distribution;
Strategic partnership with AmerisourceBergen, the world’s largest player in the
pharmaceutical specialties, resulting in the creation of the company Profarma
Specialty;
The Company carried out four acquisitions over the last three years, including its
entry into the Retail pharmaceutical segment, and the attainment of a market position
as one of the major players within this segment in the state of Rio de Janeiro;
Proven capacity to integrate acquisitions, combining all group companies in the SAP
plataform.

Highlights | 2014
3
CONSOLIDATED
• Consolidated EBITDA rose by 9.6% to R$ 87.3 million, with
EBITDA margin of 2.2% vs. 2013;
• Operating expenses fell by 0.5 p.p. year-over-year in 2014;
• Gross revenues climbed by 4.4% from 2013.
RETAIL • Drogasmil’s and Tamoio’s sales rose respectively by 15.6% and
12.5% year-over-year;
• Drogasmil’s EBITDA shot up by 72.0% and Tamoio’s by 62.2% in relation to 2013;
• Average monthly sales per store climbed by 23.0% at Drogasmil and by 11.1% at Tamoio against 2013;
• Drogasmil’s same stores sales (SSS) increased by 26.2% and Tamoio’s by 13.0% in relation to 2013;
• Four new Drogasmil stores were opened in 4Q14, totaling 14 new stores in 2014.
SPECIALTIES
• Specialty retail sales climbed by 18.0% in relation to 2013;
• Oncologicals sales up 26.7% in comparison to 2013.
PHARMACEUTICAL DISTRIBUTION
• Sales increased by 3.6% in relation to 2013 and by 10.5% in the
second half of 2014;
• • Operating expenses slid by 0.4 p.p., from 8.5% to 8.1%,
compared with 2013;
• The Independent customers segment grew by 6.9%;
• Sales of the OTC and Branded categories rose respectively by
11.8% and 5.1% vs. 2013.

Specialties
2013 2014 (**)
621.7
74.8
60.5
14.3
608.8
69.9
62.4
5.9
Retail (*)
2013 2014
586.9
168.2
185.5
-17.2
667.5
206.7
188.2
18.0
Consolidado (*)(**)
2013 2014
4,258.5
576.6
491.2
79.7
4,446.4
591.6
493.0
87.3
Pharmaceutical
Distribution
2013 2014
3,363.0
334.3
245.6
82.1
3,483.7
315.1
242.4
63.4
Highlights | Breakdown by Division – 2014
4
Gross Revenues
Gross Profit
SGA
Ebitda
(*) Pro-forma figures: 100% of revenues from Tamoio and Drogasmil / Farmalife.
(**) Pro-forma figures: 100% of revenues from Profarma Specialty.

CONSOLIDATED PERFORMANCE

Consolidated Performance
6
Gross Revenues Evolution (R$ million)
Pharmaceutical Distribution
Specialties
Retail
Sales increased by 3.6% in relation to
2013 and by 10.5% in the second half
of 2014.
Specialty retail sales climbed by
18.0% in relation to 2013.
Drogasmil’s and Tamoio’s sales rose
respectively by 15.6% and 12.5%
year-over-year. Accounting Consolidated Gross Revenues
Pro-forma Consolidated Gross Revenues: 100% of revenues from
Tamoio, Drogasmil / Farmalife and Profarma Specialty
4Q13 2014
985.2
3,974.1
56.2
472.3
1,041.4
4,446.4
4Q14
1,000.9
181.1
1,182.0
2013
3,997.5
261.0
4,258.5
-0.6%
1.6%

Performance by Division
Pharmaceutical Distribution
4Q13 4Q14
816.4
925.3
Specialties
4Q13 4Q14
156.0 151.3
Retail(*)
4Q13 4Q14
66.1
7
Gross Revenues Evolution (R$ million)
95.2 104.0
73.9
161.3 177.9
Accounting Gross Revenues
Pro-forma additional Gross
Revenues
(*) Pro-forma figures: 100% of revenues from Tamoio and Drogasmil / Farmalife
(**) Pro-forma figures: 100% of revenues from Profarma Specialty
2013 2014
3,363.0
3,483.7
2013 2014
621.7 608.8
2013 2014
229.4
357.5
402.3
265.2
586.9
667.5
3.6% -2.1% 13.7%
13.3% -3.0% 10.3%
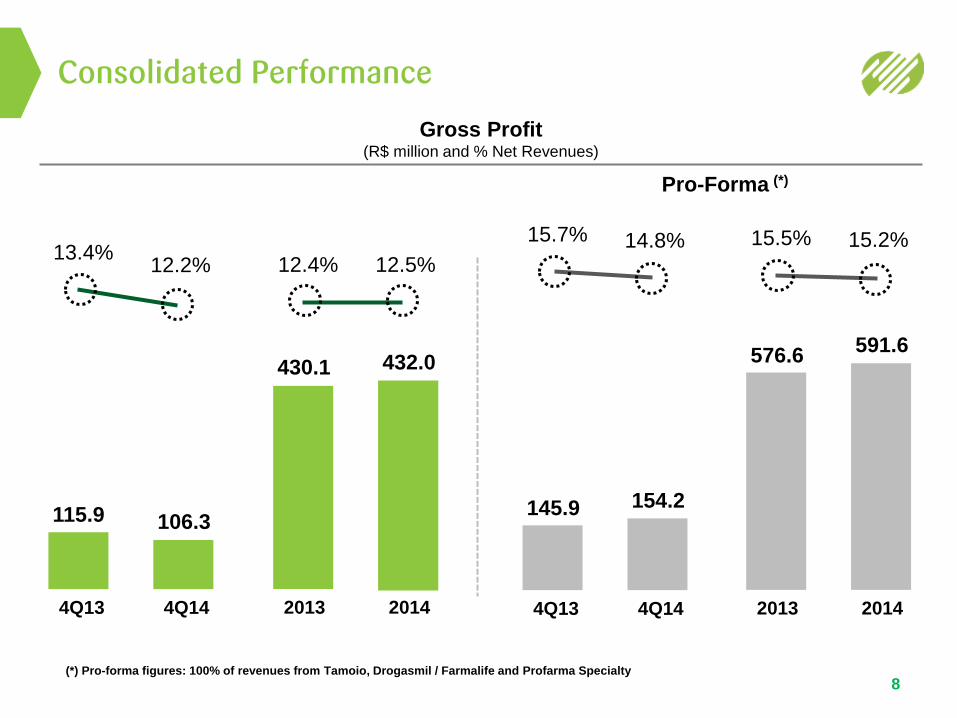
Consolidated Performance
8
Pro-Forma (*)
Gross Profit (R$ million and % Net Revenues)
(*) Pro-forma figures: 100% of revenues from Tamoio, Drogasmil / Farmalife and Profarma Specialty
4Q13
15.7%
145.9
4Q14
14.8%
154.2
2013
15.5%
576.6
2014
15.2%
591.6
4Q13
13.4%
115.9
4Q14
12.2%
106.3
2013
12.4%
430.1
2014
12.5%
432.0

Consolidated Performance
9
Operating Expenses – SGA (R$ million and % Net Revenues)
Pro-Forma (*)
(*) Pro-forma figures: 100% of revenues from Tamoio, Drogasmil / Farmalife and Profarma Specialty
4Q13
12.3%
105.7
4Q14
10.4%
90.9
2013
333.2
2014
363.7
9.6% 10.5%
2013
13.2%
491.2
2014
12.7%
493.0
4Q13
14.1%
130.5
4Q14
12.5%
130.3

Consolidated Performance
10
Adjusted EBITDA and Adjusted EBITDA Margin (R$ million and % Net Revenues)
Pro-Forma (*)
4Q13
1.7%
14.8
4Q14
1.6%
2013
95.8
2014
2.8% 1.9%
2013
2.1%
79.7
2014
2.2%
87.3
4Q13
2.1%
18.3
4Q14
2.0%
(*) Pro-forma figures: 100% of revenues from Tamoio, Drogasmil / Farmalife and Profarma Specialty
21.2
65.6
14.2

Consolidated Performance
11
Net Profit (R$ million and % Net Revenues)
(*) Pro-forma figures: 100% of revenues from Tamoio, Drogasmil / Farmalife and Profarma Specialty
Pro-Forma (*)
Net Profit
Adjusted Net Profit
Pro-Forma Net Profit
Pro-Forma Adjusted Net Profit
(4.6)
-0.5% -2.3%
4Q14
(20.2)
(4.3) (0.1)
-0.5% 0.0%
2013
20.4
2014
(52.1)
31.5
(13.1)
-1.5%
0.9% -0.4%
4Q13
(2.9)
-0.3% -1.8%
4Q14
(19.1)
(2.6)
2.4
-0.3% 0.2%
(14.7)
2014
(49.6)
(3.6) (5.6)
-0.4% -1.3%
-0.1% -0.2%
0.6%
2013 4Q13

Consolidated Performance
Cash Flow (R$ million)
Cash Cycle - Days*
Accounts Receivable ¹
Inventories ²
Accounts Payable³
Cash Cycle (Days)
Cash Flow Generated /
Used) in Operating Activities
Internal Cash Generation
Operating Assets Variation
Cash Flow (Used)
in Investing Activities
Cash Flow Generated /
(Used) by Financing Activities
Net Increase /
(Decrease) in Cash
12
Consolidated Consolidated
Pharma PFS. Retail
Proforma
2014
58.9
11.2
47.7
(11.8)
67.5
114.5
2013
(90.0)
68.1
(158.2)
(101.7)
202.0
10.3
4Q14
41.6
55.1
59.3
37.3
4Q13
54.7
45.8
56.8
47.5
4Q14
17.5
73.4
42.9
48.1
4Q14
34.2
52.9
50.8
69.4
4Q14
32.1
43.8
49.5
61.3
* Average
(1) Average of Gross Revenues in the Quarter
(2) Average of COGS in the Quarter
(3) Average of COGS in the Quarter

Consolidated Performance
13
Capex (R$ million)
Indebtedness: Net Debt and Net Debt /
EBITDA (R$ million)
4Q13
458.5
4.8x
4Q14
219.3
3.3x
26.5 6.3
4.0
13.4
Capex
2014 Others IT
Machinery and
Equipment
2.8
Remodeling
of Stores
PHARMACEUTICAL DISTRIBUTION

Pharmaceutical Distribution
Financial Data (R$ million and % Net Revenues)
EBITDA Margin
(%)
2.1
2013 2014
2.8
Op. Exp. SG&A
(%)
8.1
2013 2014
8.5
Gross Margin
(%)
10.5
2013 2014
11.5
Gross Revenues
(R$ million)
3,483.7
2013 2014
3,363.0
Operating expenses slid by
0.4 p.p., from 8.5% to 8.1%,
compared with 2013.
Sales of the OTC and
Branded categories rose
respectively by 11.8% and
5.1% vs. 2013 and
Independent customers
segment grew by 6.9%;
Sales increased by 3.6% in
relation to 2013 and by
10.5% in the second half of
2014;
15

SPECIALTIES

17
1.1
2013 2014
2.6
11.3
2013 2014
10.9
12.6
2013 2014
13.5
608.8
2013 2014
621.7
Specialties
Specialty retail sales
climbed by 18.0% in relation
to 2013;
Oncologicals sales up 26.7%
in comparison to 2013
Financial Data (R$ million and % Net Revenues)
EBITDA Margin
(%)
Op. Exp. SG&A
(%)
Gross Margin
(%)
Gross Revenues
(R$ million)

RETAIL

19
6.8
2013 2014
4.8
24.2
2013 2014
25.0
31.0
2013 2014
29.8
402.3
2013 2014
357.5
Retail | Tamoio
Tamoio’s sales up 12.5%
from 2013;
Average monthly sales per
store up 11.1%, from R$
502.7 thousand in 2013 to
R$ 558.7 thousand in 2014;
EBITDA margin up 2.0 p.p. in
relation to 2013
Financial Data (R$ million and % Net Revenues)
EBITDA Margin
(%)
Op. Exp. SG&A
(%)
Gross Margin
(%)
Gross Revenues
(R$ million)

Retail | Tamoio
20
558.7 576.6
537.8
92.4
402.3
103.8 86.0
365.2
93.8
502.7
355.9
334.9
11.1%
7.2% 12.3%
13.0%
9.1%
9.1%
2014 4Q14 4Q13 4Q13 2014 4Q14 4Q13 2014 4Q14 2013 2013 2013
SSS Mature Stores (R$ million)
Monthly Average Store's
Sales (R$ thousand)
Same Store Sales (R$ million)

Retail | Tamoio
21
1 Opening
0 Close-downs
0 Reformulated
50 Mature
2013
vs.
2014
4Q13
25.9
2014
28.0
4Q14
28.0
2013
25.7
8.4%
8.9%
4Q14
60
4Q13
59
1.7%
# of Stores (units)
Average Ticket (in reais)

22
-3.6
2013 2014
-14.9
34.3
2013 2014
41.9
30.9
2013 2014
26.9
265.2
2013 2014
229.4
Retail | Drogasmil/Farmalife
Average monthly sales per
store up 23.0%, from R$
285.3 thousand in 2013 to R$
350.8 thousand in 2014
Operating loss down 72.0%,
from R$ (34.1) million in
2013 to R$ (9.5) million in
2014.
Total gross margin up 4.0
p.p. year-over-year, totaling
30.9% in 2014;
Financial Data (R$ million and % Net Revenues)
EBITDA Margin
(%)
Op. Exp. SG&A
(%)
Gross Margin
(%)
Gross Revenues
(R$ million)

Retail | Drogasmil/Farmalife
SSS Mature Stores (R$ million)
Monthly Average Store's
Sales (R$ thousand)
23
Same Store Sales (R$ million)
2014 4Q14 4Q13 4Q13
56.4
2014
239.6
4Q14
66.1
4Q13
55.3
2014
252.0
4Q14
64.6
2013 2013
189.9
2013
187.7
17.3%
26.2%
16.9%
34.2%
350.8 399.1
333.0
285.3
23.0%
19.9%

Retail | Drogasmil/Farmalife
24
Average Ticket (in reais)
# of Stores (units)
14 Opening
15 Close-downs
15 Reformulated
49 Matures
2013
vs.
2014
4Q13
27.9
2014
32.6
4Q14
34.9
2013
27.7
25.1%
17.4%
4Q14
63
4Q13
65
-3.1%

ANALYST COVERAGE

Analyst Coverage
26
Company Analyst Telephone E-mail
Banco Fator Caio Moreira +55 (11) 3049-9478 [email protected]
Brasil Plural Guilherme Assis +55 (11) 3206 8285 [email protected]
BTG Pactual João Carlos dos Santos +55 (11) 3383-2384 [email protected]
HSBC Luciano Campos +55 (11) 3371 8194 [email protected]
BofA Merrill Lynch Mauricio Fernandes +55 (11) 2188 4236 [email protected]
Morgan Stanley Javier Martinez de Olcoz +55 (11) 3048 6088 [email protected]
Votorantim Andre Parize +55 (11) 5171 5870 [email protected]
J.P. Morgan Joseph Giordano +55 (11) 4950-3020 [email protected]

Max Fischer - CFO e IRO & Beatriz Diez - IRM
www.profarma.com.br/ir | Tel.: +55 (21) 4009-0276 | E-mail: [email protected]