4- mass lay - nebraska department of laborduring 2003, the mass layoff statistics (mls) program for...
TRANSCRIPT
TM
Mass LayoffStatistics
Nebraska’s # 1 Employment Resource
2003 Annual Report


MASS LAYOFF STATISTICS (MLS) ANNUAL REPORT
2003
Is a publication of
Nebraska Workforce Development,Department of Labor,
Labor Market Information Center
550 South 16th StreetLincoln, NE 68509-4600
Telephone: (402) 471-7079Fax: (402) 471-9867
This publication is available on the Internet at:www.NebraskaWorkforce.com
The Department of Labor accepts no liability for any actions taken or not taken as a result of the information contained in this report. Any information in this report may be
quoted or reproduced, provided an accurate citation is made.
PublishedMay 2004
A sincere thank you goes to those Nebraska businesses that took the time to explain the layoff event. Without their generous help, this publication would not have been possible.
Mike JohannsGovernor
Fernando Lecuona III Commissioner of Labor
Joan ModrellExecutive Director
Office of Workforce Services
Phillip BakerAdministrator
Labor Market Information CenterOffice of Workforce Services
The Research Team
Floyd ColonResearch Supervisor
Lisa SindelarResearch Analyst
Layout and Design
Cynthia NighPublic Information Officer
Kim JohannsMarketing and Communications Assistant

TABLE OF CONTENTS
Introduction ............................................................1
National Extended Mass Layoffs ............................2
Nebraska Extended Mass Layoffs
Nebraska Extended Mass Layoffs .......................3
Industry ...........................................................4-6
Quarterly Information ........................................7
Geography .......................................................8
Establishment Size ...........................................9
Employment Statistics .......................................9-10
Recall ..............................................................10
Reason ............................................................11
Initial Claims Claimant Characteristics ...............12-17
Final Payment Claimant Characteristics ..............18
Appendix
Industry Definitions ........................................... 19
Definitions of Regions ....................................... 20
Glossary .......................................................... 21


1
INTRODUCTION
SCOPEThe Nebraska Mass Layoff Statistics (MLS) program is a Nation-wide program that identifies major job cutbacks in Nebraska. The MLS program is a cooperative program between the Bureau of Labor Statistics (BLS) and state agencies that identifies, describes, and tracks the impact of major permanent job cutbacks. The program uses establishment information in conjunction with unemployment insurance claims data. Establishments are identified by industry classification and location. The unemployment insurance claimant information is extracted from Nebraska’s unemployment insurance database that provides demographic data about the claimant; such as, race, ethnicity, gender, veteran status, age, and residence’s address. The MLS program tracks unemployment insurance claimants through their entire duration of unemployment or until they exhaust their regular unemployment insurance benefits, whichever occurs first.
There are three types of layoffs identified by duration. A temporary layoff lasts less than thirty days. A permanent layoff lasts more than thirty days. Employees can be recalled with temporary and permanent layoffs. A closure indicates that an establishment has closed or plans to close permanently. The Bureau of Labor Statistics is interested in extended mass layoffs (permanent layoffs and permanent closures) in which the employer separated at least 50 workers for more than thirty days.
CRITERIAThe Mass Layoff Statistics (MLS) program is concerned with establishments with employment greater than or equal to twenty individuals. The state level for a mass layoff in Nebraska is twenty or more people who file an initial claim for unemployment insurance in a consecutive five-week period. A federal event occurs when there are fifty or more persons filing an initial claim for unemployment insurance in a consecutive five-week period. When a sufficient number of initial claims have been filed per establishment, the employer is contacted to confirm that there was an extended mass layoff.
SUPPLEMENTAL INFORMATIONEach week initial claims are analyzed creating a potential list of mass layoffs. Employer contacts are made in order to acquire additional information concerning the layoff event. When contacting the employer, information is obtained on how long the layoff will last in addition to the reason(s) for the layoff, expected recall, worksite status, pre-layoff employment, and the number of separations. Separations are the number of people who are affected by the layoff event. Employees who are separated may be recalled to work or be terminated. The information provided by the employer is confidential and voluntary.
The MLS program focuses primarily on the effects of a layoff on a company. The information provided by the program is useful in order to identify industry trends and displaced workers. The data provides a glimpse of Nebraska’s economy.

2
NATIONAL EXTENDED MASS LAYOFFS Nationally, the Bureau of Labor Statistics reported 7,245 extended mass layoff events in 2003, resulting in the separation of 1,546,976 workers. Initial Claims for Unemployment Insurance were filed by 89.2 percent of separated workers. These numbers are slightly lower than in 2002; however, the numbers are still high compared to the 1990s. By comparison in 2002 there were 7,295 mass layoffs affecting 1,546,976 workers. The average annual unemployment rate increased from 5.8 percent in 2002 to 6.0 percent in 2003.
Historical Mass Layoff Information National
Period Layoff Events Separations Initial Claims
1996 5,697 1,184,355 957,745
1997 5,683 1,146,115 1,041,907
1998 5,851 1,227,573 1,232,384
1999 5,675 1,149,267 972,244
2000 5,620 1,170,427 1,018,700
2001 8,349 1,751,368 1,615,522
2002 7,295 1,546,976 1,375,781
2003p 7,245 1,452,427 1,294,949
p-preliminary
Manufacturing is the largest of the goods-producing industries employing an annual average of 15,306,000 workers during 2003. Manufacturing comprises less than five percent of all establishments and approximately twelve percent of the total employment covered by unemployment insurance.
During 2003, manufacturing accounted for the largest percentage of extended mass layoffs. Thirty-one percent of the layoffs and 27 percent of the separations occurred in the manufacturing industry. Further breakdown of the manufacturing industry indicates that a majority of the separations occurred in food processing (76,071), and transportation equipment (50,744). Compared to 2002, the largest decline in separations occurred in computer and electronic devices (-39,295), and in apparel (-11,815). The largest over the year increase occurred in textile mills (+3,048).
The primary reason given by employers for layoffs was seasonality, which accounted for 32 percent of the events and 36 percent of the separations. This was unchanged from the previous year (2002).
Source: Extended Mass Layoffs in the Fourth Quarter of 2003 and Annual Averages for 2003

3
In 2003, a total of 10,035 employees were separated from their jobs as a result of 110 events. Slightly more than one percent (1.1%) of total employment was affected due to separations. This percentage was slightly lower than the national percentage (1.2%). Of all the separated workers, 63.8 percent filed initial claims for Unemployment Insurance during the calendar year.
Nearly fifty percent (46.6%) of the initial claims filed in Nebraska for unemployment insurance were filed in the Omaha region and the Lincoln Metropolitan Statistical Area (MSA). Both the Omaha Metropolitan Statistical Area (MSA) and the Lincoln Metropolitan Statistical Area (MSA) average annual unemployment rates increased from 2002 to 2003. The Omaha MSA increased by 0.7 tenths of one percentage point from 3.8% in 2002 to 4.5% in 2003, while the Lincoln MSA increased from 3.3% in 2002 to 4.0% in 2003. Statewide, the average annual unemployment rate remained the same. There is a difference between the number of people who are separated and the number of people filing initial claims for unemployment insurance, because not everyone separated will file an initial claim. Some people are not aware that they are eligible to receive unemployment insurance benefits, or simply choose not to file.
Historical Mass Layoff Information Nebraska
Period Layoff Events Separations Initial Claims
1996 3 309 575
1997 5 667 367
1998 10 1,892 1,208
1999 ** ** **
2000 15 1,664 1,093
2001 29 1,999 1,617
2002 110 9,420 6,648
2003p 110 10,035 6,398
p-preliminary
** data does not meet disclosure requirements
NEBRASKA EXTENDED MASS LAYOFFSDuring 2003, the Mass Layoff Statistics (MLS) program for Nebraska collected data on a total of eighty-nine state extended mass layoffs and on twenty-one Bureau of Labor Statistics (BLS) extended mass layoffs that met either state or BLS criteria. An extended mass layoff for a state event is a layoff in which twenty or more employees are separated for more than thirty days. A federal event occurs when fifty or more employees are separated from their jobs for more than thirty days. State and BLS events are combined in this report.
Statewide, there were seventeen permanent closures and ninety-three permanent layoffs. The largest percentage (52.9%) of the closures happened in the Manufacturing industry. In 2002, there were fourteen permanent closures and ninety-six permanent layoffs. Half of the closures occurred in the Professional and Business Services industries and the Manufacturing industry made up 35.7 percent of the closures for 2002.

4
The goods producing industries incurred more than half (57.3%) of the extended mass layoffs. An analysis of the goods producing industries indicates that 53 percent of the mass layoffs occurred in the Manufacturing industry. A total of 3,283 people were separated from their jobs for more than thirty days. The Construction industry ensued with 45 percent of the layoffs and 1,703 employees were separated from their jobs. Seasonality accounted for 92.9 percent of the mass layoff events in the Construction industry.
Separations and Initial Claims 2003
Industry Separations Initial Claims
Goods Producing Industries 5,046 3,690
Natural Resources and Mining 60 40
Construction 1,703 1,346
Manufacturing 3,283 2,304
Service Providing Industries 3,701 2,371
Trade, Transportation, and Utilities 832 649
Information 329 225
Financial Activities 290 211
Professional and Business Services 1,217 702
Education and Health Services 785 345
Leisure and Hospitality 221 212
Other Services 27 27
Public Administration (Government) 1,288 337
Percentage of Extended Mass Layoffs by Industry, 2003
Service Producing Industries 36%
Government 6%
Goods Producing Industries 58%
INDUSTRY

5
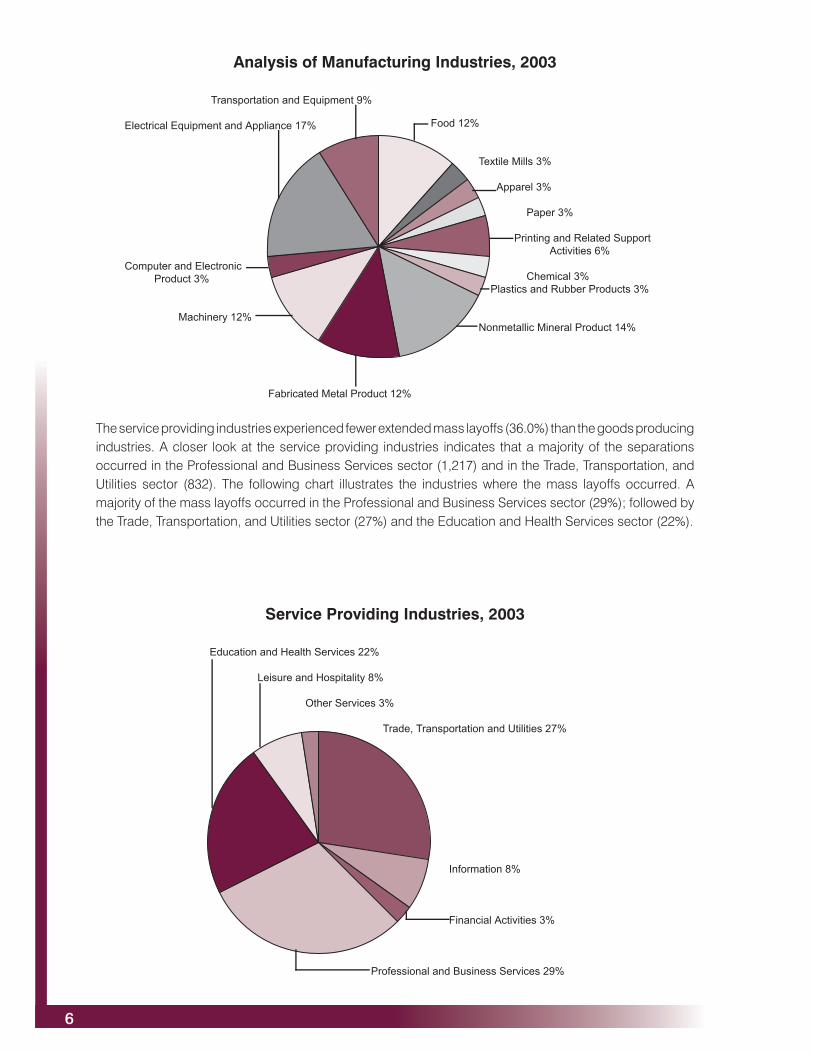
The Manufacturing industry experienced the largest number of extended mass layoffs in the goods producing industries in 2003. There were 34 extended mass layoffs in the Manufacturing industry in which 3,283 people were separated from their jobs for more than thirty days. This is an increase compared to the previous year. In 2002, there were 27 confirmed mass layoffs and 2,985 workers were separated from their jobs for more than thirty days. An in-depth look at the Manufacturing industry, indicates that a majority of the separations occurred in Machinery manufacturing (1,320), followed by Fabricated Metal Product manufacturing (507), Nonmetallic Mineral Product manufacturing (347), and Food manufacturing (325).
Goods Producing Industries, 2003
Manufacturing 53%
Natural Resources and Mining 2%
Construction 45%
The following chart illustrates that a majority of the layoffs occurred in Electrical Equipment and Application manufacturing (17.0%), followed by Nonmetallic Mineral Product manufacturing (14.0%), Food manufacturing (12.0%), Machinery manufacturing(12.0%), and Fabricated Metal Product manufacturing (12.0%).
During 2003, a large number of the manufacturing layoffs occurred because of seasonality (10); followed by the state of the economy (4) and the movement of production out of the state - domestic or overseas relocation (4) affecting a total of 774 people.
6
The service providing industries experienced fewer extended mass layoffs (36.0%) than the goods producing industries. A closer look at the service providing industries indicates that a majority of the separations occurred in the Professional and Business Services sector (1,217) and in the Trade, Transportation, and Utilities sector (832). The following chart illustrates the industries where the mass layoffs occurred. A majority of the mass layoffs occurred in the Professional and Business Services sector (29%); followed by the Trade, Transportation, and Utilities sector (27%) and the Education and Health Services sector (22%).
Service Providing Industries, 2003
Education and Health Services 22%
Leisure and Hospitality 8%
Other Services 3%
Trade, Transportation and Utilities 27%
Information 8%
Financial Activities 3%
Professional and Business Services 29%
Analysis of Manufacturing Industries, 2003
Food 12%
Textile Mills 3% Apparel 3% Paper 3%
Printing and Related Support Activities 6%
Chemical 3% Plastics and Rubber Products 3%
Nonmetallic Mineral Product 14%
Transportation and Equipment 9%
Electrical Equipment and Appliance 17%
Computer and Electronic Product 3%
Machinery 12%
Fabricated Metal Product 12%

7
QUARTERLY INFORMATIONA breakout of the information by quarter for the year 2003 indicates that the fourth quarter had the largest number of employees separated (4,203) from their jobs in addition to the largest number of initial claims filed for unemployment insurance (2,565). Generally, from the fourth quarter into the first quarter of the following year seasonal layoffs occur. The Construction industry lay off employees in the fall/winter when weather conditions deteriorate and rehire employees in the spring when weather conditions improve. Another industry which has seasonal layoffs is the manufacturing industry: the companies involved in the construction of roadways. The Retail industry hires people before the holiday rush and then will layoff employees after the Christmas/New Year season. These are not only the clothing stores, but catalog companies and the stores that show up the malls during the holiday season.
The third quarter of 2003, had the lowest number of people separated (1,467) from their jobs for more than thirty days and the lowest number of initial claims filed for unemployment insurance (1,075).
Generally, there are not a lot of mass layoffs occurring during the second quarter. There are some layoffs which occur from the schools and college dismissing for the summer. These are seasonal in nature and the employees are recalled in the fall when the schools resume.
Separations and Initial Claims Comparision By Quarter, 2003
0
500
1,000
1,500
2,000
2,500
3,000
3,500
4,000
4,500
QUARTER 1 QUARTER 2 QUARTER 3 QUARTER 4
Separations Initial Claims

8
GEOGRAPHYSeparations due to mass layoffs from establishments affected twenty-five counties in Nebraska. Geographically, a majority of the separation activity was located in Eastern Nebraska and along Interstate 80. The highest numbers of separations occurred in and near the Omaha region and the Lincoln Metropolitan Statistical Area (MSA). According to the 2000 Census, a majority of Nebraska’s population is concentrated in these areas. More than fifty percent (54.4%) of the establishments covered by unemployment insurance with a size-class more than twenty are located in the Omaha region and Lincoln MSA. These same businesses employ 63.8 percent of the workforce.
Source: Census Bureau www.census.gov
Source: Nebraska Workforce Development, Office of Workforce Services, Labor Market Information Center, Mass Layoff Statistics (MLS) program
State Population Per County
Number of People Separated by a Mass Layoff
Buffalo42259
Custer11793
Chase4068
Perkins3200
Dundy2292
Cheyenne9830
Kimball4089 Deuel
2098
Keith8875
Hitchcock3111
Furnas5324
Red Willow11448
Harlan3786
Frontier3099
Hayes1068
Lincoln34632
Gosper2143
Phelps9747
Dawson24365
Arthur444
Grant747
Banner819
Scotts Bluff36951
Garden2292
Morrill5440
Box Butte12158
Sioux1475
Dawes9060
Sheridan6198
Cherry6148
Hooker783
Logan774
McPherson533
Thomas729
Blaine583
Loup712
Brown3525
Keya Paha983
Rock1756
Sherman3318
Thayer6055
Kearney6882
Adams31151
Franklin3574
Webster4061
Nuckolls5057
Clay7039
Fillmore6634
Merrick8204
Hall53534
Howard6567
York14598
Hamilton9403
Polk5639
Saline13843
Gage22993Jefferson
8333 Pawnee3087
Richardson9531
Johnson4488
Nemaha7576
Saunders19830
Seward16496 Lancaster
250291
Butler8767
Otoe15396
Cass24334
Sarpy122595
Platte31662
Madison35226
Wheeler886
Valley4647
Garfield1902
Nance4038
Greeley2714
Boone6259
Holt11551
Boyd2438
Pierce7857Antelope
7452
Knox9374
Stanton6455
Dodge36160
Colfax10441
Cuming10203
Washington18780Douglas463585
Burt7791
Wayne9851
Cedar9615
Thurston7171
Dixon6339Dakota
20253
444 to 5000 5001 to 10000 10001 to 25000 25001 to 463585
0-19
20-99
100-499
500-999
1,000-2,712
Cherry 0 Holt
60
Custer 0
Sioux 0
Lincoln 34
Sheridan 0
Morrill 0
Garden 0
Knox 0
Keith 0
Dawes 27
Rock 0
Brown 0
Gage 255
Dundy 0
Chase 0
Buffalo 84
Grant 0
Clay 0
Kimball 0
Frontier 0
Dawson 85
Otoe 66
Hall 850
York 0
Cedar 101
Platte 250
Arthur 0
Burt 0
Perkins 0
Cheyenne 0
Hayes 0
Blaine 0
Loup 0
Box Butte 0
Cass 0
Boyd 0
Boone 0
Banner 0
Polk 35
Butler 0
Furnas 20
Hooker 0
Antelope 0
Saline 0
Pierce 0
Valley 0
Logan 0
Thomas 0
Lancaster 1663
Dixon 0
Harlan 0
Adams 341
Thayer 0
Dodge 106
Phelps 93
Saunders 42
McPherson 0
Deuel 0
Howard 0
Cuming 31
Seward 0
Greeley 0
Fillmore 0
Hitchcock 0
Garfield 0
Franklin 0
Keya Paha 0
Nance 0
Webster 0
Madison 0
Wheeler 0
Nuckolls 0
Merrick 0
Gosper 0
Scotts Bluff 347
Jefferson 65
Sherman 30
Red Willow 0
Wayne 0
Kearney 0
Hamilton 0
Stanton 0
Pawnee 0
Richardson 0
Nemaha 28
Johnson 0
Thurston 0
Colfax 0
Douglas 2712
Sarpy 29
Dakota 0
Washington 71

9
ESTABLISHMENT SIZEFor the year 2003, an establishment’s employment size was not a deciding factor whether or not an establishment would have a layoff event. The largest percentage (27.3%) of layoff events occurred with a business size of 0-99 employees. A vast majority (97.7%) of businesses located in Nebraska are of the size class 0-99 employees. When an event happens it is most likely to occur in the business size 0-99 employees. Information was not available on thirty-nine events.
Layoffs By Establishment Size Year 2003
Establishment Size Events SeparationsInitial
Claims
0-99 27.3% NA 14.3%
100-249 14.5% NA 16.0%
250-499 14.5% NA 15.0%
500-999 4.5% NA 13.3%
Over 999 3.6% NA 6.5%
Information Not Available 35.5% NA 34.9%NA = not available
Source: Nebraska Workforce Development, Office of Workforce Services, Labor Market Information Center, Mass Layoff Statistics (MLS) program
EMPLOYMENT STATISTICSThe Mass Layoff Statistics Program only collects data on those establishments with employment levels of twenty or more. In Nebraska, for 2003, there were 7,834 establishments covered by unemployment insurance reporting employment of 20 or more. This number represents only 14.2 percent of the total covered establishments in the state and yet establishments with 20 or more employees account for three fourths (75.3%) of the total covered employment statewide. A majority of the businesses in Nebraska employ between 0-19 workers; however, employment numbers are in the larger business sizes.
Nebraska Covered Employment By Size Class - 2nd Quarter 2003
Size Class
Number of Firms
Total Employment
Percent of Employment
0-19 47,158 219,331 24.7%
20-99 6,587 264,531 29.8%
100-249 880 131,698 14.8%
250-499 212 73,359 8.3%
500-999 95 63,882 7.2%
Over 999 60 135,346 15.2%Source: Nebraska Workforce Development, Office of Workforce Services, Labor Market Information Center, Mass Layoff Statistics (MLS) program

10
RECALLWhen contacting employers concerning a layoff, twelve percent did not know if they expected to recall workers separated by a mass layoff event. Thirty-two percent of employers expected a 100% recall. A large number of employers that have yearly seasonal layoffs expect a 100% recall of employees separated, because these layoffs are due to normal seasonal trends. A large percentage (31%) did not expect to recall any workers.
Covered Employment by County
The following map illustrates the number of establishments located in each county.
Recall of Workers, 2003
Source: Nebraska Workforce Development, Office of Workforce Services, Labor Market Information Center, Quarterly Census Employment and Wages (QCEW) program
50% to 100% Recall Expected 25%
Information Not Available 12%
No Recall Expected 31%
100% Recall Expected 32%
Cherry 282 Holt
467
Custer 426
Sioux 35
Lincoln 1091
Sheridan 241
Morrill 171 Garden
76
Knox 321
Keith 407
Dawes 336
Rock 84
Brown 153
Gage 734Dundy
82
Chase 171
Buffalo 1392
Grant 49
Clay 225
Kimball 171
Frontier 88
Dawson 748
Otoe 497
York 559
Cedar 293
Platte 1009
Arthur 17
Perkins 129
Cheyenne 362
Hayes 27
Blaine 27
Loup 15
Box Butte 401
Burt 243
Cass 528
Boyd 92
Boone 227Banner
16
Polk 164
Butler 217
Furnas 205
Hooker 43
Hall 1809
Antelope 261
Saline 328
Pierce 211
Valley 202
Logan 35
Thomas 43
Lancaster 7345
Dixon 137
Harlan 117
Adams 975
Thayer 228
Dodge 1066
Phelps 378
Saunders 505
McPherson 16
Deuel 77
Howard 171
Cuming 409
Seward 429
Greeley 107
Fillmore 258
Hitchcock 78
Garfield 98
Franklin 117
Keya Paha 27
Nance 128
Webster 113
Madison 1290
Wheeler 30
Nuckolls 194
Merrick 248
Colfax 290
Gosper 62
Scotts Bluff 1300
Jefferson 255
Sherman 99
Red Willow 456
Wayne 270
Kearney 214
Hamilton 274
Stanton 102
Pawnee 86
Richardson 291
Nemaha 222
Johnson 153
Thurston 148
Douglas 14742
Sarpy 2328
Dakota 506
Washington 539

11
Events By Reason 2003
Reason Events SeparationsInitial
Claims
Bankruptcy ** ** **
Business Ownership Change 3 450 132
Contract Cancellation ** ** **
Contract Completed 4 191 162
Domestic Relocation 3 643 257
Energy-Related ** ** **
Financial Difficulty ** ** **
Overseas Relocation 3 281 159
Product Line Discontinued ** ** **
Reorganization within the Company ** ** **
Seasonal 62 5,514 3,924
Slack Work 5 192 205
Other 16 859 667
Data Not Provided (Does Not Know) 14 1,905 892
** data does not meet disclosure requirements
Source: Nebraska Workforce Development, Office of Workforce Services, Labor Market Information Center, Mass Layoff Statistics (MLS) program
REASONLayoffs due to seasonality accounted for sixty-three (56.4%) of the extended layoff events resulting in the separation of 5,514 (54.9%) workers. The Construction industry had the largest number of seasonal layoffs. Twenty-six of the sixty-three seasonal events occurred in the Construction industry. The Construction industry is heavily influenced by weather conditions. A large number of construction companies layoff their employees during the fall/winter and then recall workers back in the spring when weather conditions improve. Second, in order of importance was ‘Other’ category, representing 14.5 percent of the layoffs. The ‘Other’ category is used when the reason for the layoff does not fit into another category. A comment is required for this category.

12
INITIAL CLAIMS CLAIMANT CHARACTERISTICSInitial claims for unemployment insurance were filed by 6,398 employees in eighty-five Nebraska counties. Initial Claims included only those claims associated with an extended mass layoff. A large percentage of claimants occurred in the Omaha region (28.7%) and the Lancaster MSA (15.4%). According to the 2000 Census, 51.4 percent of Nebraska’s population lives in the Omaha region and in the Lancaster MSA. As expected, a large number of initial claims occur where the population is centered.
Three hundred and thirty-one of the total initial claims for unemployment insurance were either commuter claimants or Nebraska liable claimants. A commuter claimant resides in a county bordering the state of Nebraska and commuted to Nebraska to work, while a Nebraska liable claimant lives in another state whose county does not border the state of Nebraska but who worked in Nebraska.
The following two charts provides additional information about the individual characteristics of the people that filed an initial claim for unemployment insurance.
Race/Ethnicity Initial Claims
CountyInitial
Claims WhiteAfrican
American Hispanic
Amer. Indian
or Alaskan Native
Asian or Pacific
Islander
Information Not
Available
ADAMS 91 70 0 4 0 0 17
ANTELOPE 20 16 0 0 0 0 4
ARTHUR 3 3 0 0 0 0 0
BANNER ** 0 0 0 0 0 0
BLAINE 0 0 0 0 0 0 0
BOONE 29 24 0 0 0 0 5
BOX BUTTE 12 8 0 3 0 0 **
BOYD 9 8 0 0 0 0 **
BROWN 3 0 0 0 0 0 3
BUFFALO 130 105 0 7 0 0 18
BURT 36 32 0 0 0 0 4
BUTLER 38 27 0 0 0 0 11
CASS 100 81 0 0 0 0 19
CEDAR 54 52 0 0 0 0 **
CHASE 0 0 0 0 0 0 0
CHERRY 11 9 0 0 0 0 **
CHEYENNE 13 12 0 0 0 0 **
CLAY 41 22 0 12 0 0 7
COLFAX 57 36 0 12 0 0 9
CUMING 20 17 0 0 0 0 3
CUSTER 18 14 0 0 0 0 4
DAKOTA 8 4 0 3 0 0 **
DAWES 31 26 0 0 0 0 5
DAWSON 71 49 0 9 0 0 13

13
CountyInitial
Claims WhiteAfrican
American Hispanic
Amer. Indian
or Alaskan Native
Asian or Pacific
Islander
Information Not
Available
DEUEL 5 5 0 0 0 0 0
DIXON 6 6 0 0 0 0 0
DODGE 96 79 0 3 0 0 14
DOUGLAS 1476 764 331 130 12 18 221
DUNDY 3 3 0 0 0 0 0
FILLMORE 15 12 0 0 0 0 3
FRANKLIN 8 7 0 0 0 0 **
FRONTIER 7 6 0 0 0 0 **
FURNAS 20 18 0 0 0 0 **
GAGE 179 150 0 0 0 4 25
GARDEN 8 6 0 0 0 0 **
GARFIELD 2 2 0 0 0 0 0
GOSPER 5 5 0 0 0 0 0
GRANT 0 0 0 0 0 0 0
GREELEY 14 14 0 0 0 0 0
HALL 627 572 0 20 3 3 29
HAMILTON 57 53 0 0 0 0 4
HARLAN 8 6 0 0 0 0 **
HAYES 0 0 0 0 0 0 0
HITCHCOCK 9 8 0 0 0 0 **
HOLT 44 31 0 6 0 0 7
HOOKER 3 3 0 0 0 0 0
HOWARD 67 63 0 0 0 0 4
JEFFERSON 43 41 0 0 0 0 **
JOHNSON 14 8 0 0 0 3 3
KEARNEY 7 7 0 0 0 0 0
KEITH 23 20 0 0 0 0 3
KEYA PAHA 0 0 0 0 0 0 0
KIMBALL 4 3 0 0 0 0 **
KNOX 34 32 0 0 0 0 **
LANCASTER 984 506 29 81 12 39 317
LINCOLN 126 102 0 7 0 0 17
LOGAN ** 0 0 0 0 0 0
LOUP 3 3 0 0 0 0 0
MC PHERSON 0 0 0 0 0 0 0
MADISON 74 39 0 25 0 0 10
MERRICK 45 44 0 0 0 0 **
MORRILL 22 12 0 5 0 0 5
NANCE 29 28 0 0 0 0 **

14
CountyInitial
Claims WhiteAfrican
American Hispanic
Amer. Indian
or Alaskan Native
Asian or Pacific Islande
Information Not
Available
NEMAHA 24 17 0 0 0 0 7
NUCKOLLS 11 8 0 0 0 0 3
OTOE 68 58 0 0 0 0 10
PAWNEE 5 5 0 0 0 0 0
PERKINS 0 0 0 0 0 0 0
PHELPS 19 19 0 0 0 0 0
PIERCE 11 9 0 0 0 0 **
PLATTE 233 170 0 24 0 0 39
POLK 20 16 0 0 0 0 4
RED WILLOW 21 17 0 0 0 0 4
RICHARDSON 17 13 0 0 0 0 4
ROCK 7 6 0 0 0 0 **
SALINE 63 33 0 18 0 0 12
SARPY 209 140 21 8 0 5 35
SAUNDERS 71 53 0 0 0 0 18
SCOTTS BLUFF 180 105 0 55 3 0 17
SEWARD 52 38 0 0 0 0 14
SHERIDAN 10 9 0 0 0 0 **
SHERMAN 14 12 0 0 0 0 **
SIOUX 6 5 0 0 0 0 **
STANTON 13 12 0 0 0 0 **
THAYER 10 9 0 0 0 0 **
THOMAS ** 0 0 0 0 0 0
THURSTON 6 5 0 0 0 0 **
VALLEY 10 9 0 0 0 0 **
WASHINGTON 57 46 0 0 0 0 11
WAYNE 25 21 0 0 0 0 4
WEBSTER 10 9 0 0 0 0 **
WHEELER 0 0 0 0 0 0 0
YORK 22 16 0 0 0 0 6
STATEWIDE 7 3 0 0 0 0 4
OUT OF STATE 331 227 13 15 0 0 76
TOTALS 6,394 4,363 394 447 30 72 1,052** data does not meet disclosure requirements
Source: Nebraska Workforce Development, Office of Workforce Services, Labor Market Information Center, Mass Layoff Statistics (MLS) program

15
Age and Gender Initial Claims
CountyInitial
Claims
Age Under
30Age
30-44Age
45-54Age 55+
Information Not
Available Male Female
ADAMS 91 9 29 35 17 ** 57 34
ANTELOPE 20 3 10 4 3 0 11 9
ARTHUR 3 0 0 0 0 3 ** **
BANNER ** 0 0 0 0 ** ** **
BLAINE 0 0 0 0 0 0 0 0
BOONE 29 7 5 7 10 0 19 10
BOX BUTTE 12 0 5 3 0 4 ** **
BOYD 9 0 0 4 0 5 ** **
BROWN 3 0 0 0 0 3 ** **
BUFFALO 130 21 47 41 21 0 81 49
BURT 36 8 8 16 4 0 30 6
BUTLER 38 8 8 13 9 0 22 16
CASS 100 21 27 24 28 0 81 19
CEDAR 54 8 13 21 12 0 26 28
CHASE 0 0 0 0 0 0 0 0
CHERRY 11 0 4 0 3 4 6 5
CHEYENNE 13 0 4 0 6 3 6 7
CLAY 41 7 17 13 4 0 31 10
COLFAX 57 16 16 17 8 0 29 28
CUMING 20 3 7 7 3 0 14 6
CUSTER 18 0 7 4 5 ** 15 3
DAKOTA 8 4 0 0 0 4 4 4
DAWES 31 4 9 10 8 0 11 20
DAWSON 71 8 27 18 18 0 60 11
DEUEL 5 0 0 4 0 ** ** **
DIXON 6 0 0 0 4 ** ** **
DODGE 96 8 34 31 23 0 46 50
DOUGLAS 1476 311 582 367 212 4 888 588
DUNDY 3 0 0 0 0 3 ** **
FILLMORE 15 3 5 0 5 ** 9 6
FRANKLIN 8 0 6 0 0 ** 5 3
FRONTIER 7 0 0 0 0 7 4 3
FURNAS 20 0 5 8 7 0 14 6
GAGE 179 26 61 55 37 0 85 94
GARDEN 8 0 0 5 0 3 ** **
GARFIELD ** 0 0 0 0 0 ** **
GOSPER 5 0 0 0 0 5 ** **
GRANT 0 0 0 0 0 0 0 0

16
CountyInitial
Claims
Age Under
30Age
30-44Age
45-54Age 55+
Information Not
Available Male Female
GREELEY 14 0 7 4 3 0 8 6
HALL 627 27 187 305 108 0 541 86
HAMILTON 57 4 18 26 9 0 49 8
HARLAN 8 0 0 4 0 4 5 3
HAYES 0 0 0 0 0 0 0 0
HITCHCOCK 9 3 0 5 0 ** ** **
HOLT 44 8 15 12 9 0 29 15
HOOKER 3 0 0 0 0 3 3 0
HOWARD 67 4 22 30 11 0 58 9
JEFFERSON 43 10 11 16 6 0 24 19
JOHNSON 14 3 0 5 4 ** 10 4
KEARNEY 7 0 0 3 3 ** 3 4
KEITH 23 5 10 3 5 0 20 3
KEYA PAHA 0 0 0 0 0 0 0 0
KIMBALL 4 0 0 0 0 4 0 4
KNOX 34 3 9 13 9 0 21 13
LANCASTER 984 165 355 289 173 ** 709 275
LINCOLN 126 25 37 34 29 ** 80 46
LOGAN ** 0 0 0 0 0 ** **
LOUP 3 0 0 0 0 3 ** **
MC PHERSON 0 0 0 0 0 0 0 0
MADISON 74 21 25 14 14 0 52 22
MERRICK 45 3 17 20 5 0 40 5
MORRILL 22 6 5 4 7 0 14 8
NANCE 29 0 0 20 6 3 14 15
NEMAHA 24 4 7 8 5 0 20 4
NUCKOLLS 11 0 3 3 3 ** ** **
OTOE 68 12 23 17 16 0 34 34
PAWNEE 5 0 0 0 2 3 5 0
PERKINS 0 0 0 0 0 0 0 0
PHELPS 19 0 7 5 5 ** 9 10
PIERCE 11 3 0 5 0 3 6 5
PLATTE 233 57 76 66 34 0 146 87
POLK 20 5 4 6 5 0 14 6
RED WILLOW 21 5 6 8 0 ** 11 10
RICHARDSON 17 4 6 5 0 ** 14 3
ROCK 7 0 0 3 0 4 ** **
SALINE 63 15 26 18 4 0 45 18
SARPY 209 32 79 54 44 0 130 79

17
CountyInitial
Claims
Age Under
30Age
30-44Age
45-54Age 55+
Information Not
Available Male Female
SAUNDERS 71 14 17 28 12 0 53 18
SCOTTS BLUFF 180 52 56 44 28 0 106 74
SEWARD 52 11 13 9 19 0 27 25
SHERIDAN 10 0 4 3 3 0 0 10
SHERMAN 14 0 9 3 0 ** 7 7
SIOUX 6 0 3 0 0 3 ** **
STANTON 13 0 4 3 4 ** 7 6
THAYER 10 0 4 0 4 ** 6 4
THOMAS ** 0 0 0 0 0 ** **
THURSTON 6 0 0 3 0 3 3 3
VALLEY 10 0 5 0 0 5 6 4
WASHINGTON 57 13 11 26 7 0 50 7
WAYNE 25 0 6 9 8 ** 11 14
WEBSTER 10 0 4 0 0 6 7 3
WHEELER 0 0 0 0 0 0 0 0
YORK 22 0 9 7 5 ** 15 7
STATEWIDE 7 0 6 0 0 ** ** **
OUT OF STATE 331 60 117 101 53 0 229 102
TOTALS 6,392 1,049 2,159 1,948 1,109 92 4,195 2,100** data does not meet disclosure requirements
Source: Nebraska Workforce Development, Office of Workforce Services, Labor Market Information Center, Mass Layoff Statistics (MLS) program

18
FINAL PAYMENT CLAIMANT CHARACTERISTICSDuring 2003, a total of 6,389 people filed initial claims for unemployment insurance and of that only 14 (0.2%) received final payments. This is a very low number meaning that people were recalled to work or found employment before exhausting the unemployment insurance benefits. There is the possibility of some people still drawing unemployment insurance in the year 2004 for extended mass layoffs that occurred at the end of year 2003.
Compared to the previous year, the number of final payments has decreased. For the year 2002, there were 26 people that exhausted their unemployment insurance benefits. This decrease indicates more people are being recalled back to work or are finding other employment before exhausting benefits.
The chart below provides additional information about the individual characteristics of the people that received a final payment.
Final Payment Characterisics 2003
Race/Ethnicity Percent
White/Non-Hispanic 60.0%
Black/Non-Hispanic 13.3%
Hispanic Orgin 13.3%
American Indian and Alaskan Native 0.0%
Asian or Pacific Islander 0.0%
Information Not Available 13.3%
Gender Percent
Male 80.0%
Female 20.0%
Age Percent
Under 30 33.3%
30 to 44 33.3%
45 to 54 13.3%
55 and Over 20.0%
Information Not Available 0.0%Source: Nebraska Workforce Development, Office of Workforce Services, Labor Market Information Center, Mass Layoff Statistics (MLS) program

19
INDUSTRY DEFINITIONS
Goods Producing
Natural Resources & MiningAgriculture, Forestry, Fishing and HuntingMining
ConstructionConstruction
ManufacturingManufacturing
Service Providing
Trade, Transportation, & UtilitiesWholesale TradeRetail TradeTransportation & WarehousingUtilities
InformationInformation
Financial ActivitiesFinance & InsuranceReal Estate & Rental & Leasing
Professional and Business ServicesProfessional, Scientific, and Technical ServicesManagement of Companies and EnterprisesAdministrative & Support & Waste Management & Remediation Services
Education and Health ServicesEducation ServicesHealth Care and Social Assistance
Leisure & HospitalityArts, Entertainment, & RecreationAccommodation & Food Services
Other ServicesOther services, except Public Administration
Public Administration (Government)
Public Administration (Government)
Unclassified
Unclassified

20
DEFINITION OF REGIONS
Omaha regionCassDouglasSarpyWashington
Lincoln Metropolitan Statistical Area (MSA)Lancaster
Balance of State(Omaha region less Lincoln MSA)
Omaha Metropolitan Statistical Area (MSA)CassDouglasSarpyWashingtonPottawatamie County, IA
Definition of Regions
Balance of State
Lincoln MSA
Omaha MSA

21
GLOSSARY
Continued ClaimA claim filed for unemployment insurance for more than one week of unemployment.
Commuter ClaimThe claimant resides in a county bordering the state of Nebraska and commutes to Nebraska to work.
Disclosure–SuppressionDisclosure-suppression assures the confidentiality of an establishment’s data. Data for an industry with fewer than three reporting units are kept confidential. In addition, if there are more than three reporting units, data is kept confidential if one of the units accounts for 80% or more of the employment in that industry.
EstablishmentAn establishment is defined as a single physical location where predominantly one type of economic activity is conducted.
ExhausteeAn exhaustee is a person who has used up all regular unemployment insurance benefits within one year.
Extended Mass Layoff / Permanent LayoffA state layoff occurs when twenty or more people have been separated from their jobs for more than thirty days. A federal layoff occurs when at least fifty workers have been separated from their jobs for more than thirty days.
Final PaymentA final payment is issued when a person has used up all their regular unemployment insurance benefits within one year.
Initial ClaimantThe claimant’s first notice of unemployment filed to request (1) a determination of entitlement to and eligibility for compensation, or (2) a subsequent period of unemployment within a benefit year or period of eligibility.
Mass Layoff Statistics (MLS) ProgramA Federal-State cooperative statistical program that identifies, describes, and tracks major job cutbacks.
Nebraska Liable ClaimantA claimant that lives in another state whose county does not border the state of Nebraska, but worked inNebraska.
SeparationsSeparations are the number of people affected by the layoff.
Temporary LayoffA temporary layoff lasts less than thirty days.

Equal Employment Opportunity Employer/Program. Auxiliary aids and services available upon request to individuals with disabilities.
TDD: 1.800.833.7352 • Lincoln: 402.471.2786
ows69104-04