4-4 graphing sine and cosine functions - moc-floyd … · 2015-01-21 · periods of both functions...
TRANSCRIPT

Describe how the graphs of f (x) and g (x) are related. Then find the amplitude of g (x), and sketch two periods of both functions on the same coordinate axes.
1. f (x) = sin x; g(x) = sin x
SOLUTION:
The graph of g(x) is the graph of f (x) compressed vertically. The amplitude of g(x) is or .
Create a table listing the coordinates of the x-intercepts and extrema for f (x) = sin x for one period, 2 , on the
interval [0, 2 ]. Then use the amplitude of g(x) to find corresponding points on its graph.
Sketch the curve through the indicated points for each function. Then repeat the pattern to complete a second period.
Functions x-intercept Maximum x-intercept Minimum x-intercept
f (x) = sin x (0, 0)
( , 0)
(2π, 0)
g(x) = sin x
(0, 0)
( , 0)
(2π, 0)
3. f (x) = cos x; g(x) = 6 cos x
SOLUTION:
The graph of g(x) is the graph of f (x) expanded vertically. The amplitude of g(x) is or 6.
Create a table listing the coordinates of the x-intercepts and extrema for f (x) = cos x for one period, 2 , on the
interval [0, 2 ]. Then use the amplitude of g(x) to find corresponding points on its graph.
Sketch the curve through the indicated points for each function. Then repeat the pattern to complete a second period.
Functions Maximum x-intercept Minimum x-intercept Maximum
f (x) = cos x
g(x) = 6 cos x
Describe how the graphs of f (x) and g (x) are related. Then find the period of g (x), and sketch at least oneperiod of both functions on the same coordinate axes.
5. f (x) = sin x; g(x) = sin 4x
SOLUTION:
The graph of g(x) is the graph of f (x) compressed horizontally. The period of g(x) is or . To find
corresponding points on the graph of g(x), change the x-coordinates of those key points on f (x) so that they range
from 0 to , increasing by increments of or .
Sketch the curve through the indicated points for each function. Then repeat the pattern to complete a second period.
Functions x-intercept Maximum x-intercept Minimum x-intercept
f (x) = sin x (0, 0)
(π, 0)
(2π, 0)
g(x) = sin 4x (0, 0)
7. f (x) = cos x; g(x) = cos 0.2x
SOLUTION:
The graph of g(x) is the graph of f (x) expanded horizontally. The period of g(x) is or . To find
corresponding points on the graph of g(x), change the x-coordinates of those key points on f (x) so that they range
from 0 to , increasing by increments of or .
Sketch the curve through the indicated points for each function. Then repeat the pattern to complete a second period.
Functions Maximum x-intercept Minimum x-intercept Maximum
f (x) = cos x (0, 1)
g(x) = cos x
(0, 1)
9. VOICES The contralto vocal type includes the deepest female singing voice. Some contraltos can sing as low as the E below middle C (E3), which has a frequency of 165 hertz. Write an equation for a sine function that models the initial behavior of the sound wave associated with E3 having an amplitude of 0.15.
SOLUTION:
The general form of the equation will be y = a sin bt, where t is the time in seconds. Because the amplitude is 0.15, a = 0.15. This means that a = ±0.15.
The period is the reciprocal of the frequency or . Use this value to find b.
Sample answer: One sine function that models the initial behavior is y = 0.15 sin 330 t.
Write a sine function that can be used to model the initial behavior of a sound wave with the frequency and amplitude given.
11. f = 932, a = 0.25
SOLUTION:
The general form of the equation is y = a sin bt, where t is the time in seconds. Because the amplitude is 0.25, =
0.25. This means that a = ±0.25.
The period is the reciprocal of the frequency or . Use this value to find b.
Using the positive values of a and b, one sine function that models the initial behavior is y = 0.25 sin 1864 t.
13. f = 623, a = 0.2
SOLUTION:
The general form of the equation is y = a sin bt, where t is the time in seconds. Because the amplitude is 0.2, =
0.2. This means that a = ±0.2.
The period is the reciprocal of the frequency or . Use this value to find b.
Using the positive values of a and b, one sine function that models the initial behavior is y = 0.2 sin 1246 t.
State the amplitude, period, frequency, phase shift, and vertical shift of each function. Then graph two periods of the function.
15.
SOLUTION:
In this function, a = 1, b = 1, c = , and d = 0. Because d = 0, there is no vertical shift.
Graph y = 3 cos x shifted units to the right.
17. y = sin 3x – 2
SOLUTION: In this function, a = 1, b = 3, c = 0, and d = –2.
Graph y = sin 3x shifted 2 units down.
19.
SOLUTION:
In this function, a = 1, b = 1, c = , and d = 4.
.
Graph y = sin x shifted units to the right and 4 units up.
21. TIDES The table shown below provides data for the first high and low tides of the day for a certain bay during oneday in June.
a. Determine the amplitude, period, phase shift, and vertical shift of a sinusoidal function that models the height of the tide. Let x represent the number of hours that the high or low tide occurred after midnight and y represent the height of the wave in feet. b. Write a sinusoidal function that models the data. c. According to your model, what was the height of the tide at 8:45 P.M. that night?
SOLUTION: a. Sample answer: Use a sinusoidal function of the form y = a cos (bx + c) + d to model the data. First, find the amplitude a, which is half of the distance between the heights of the high and low tides.
The vertical shift d is the average of the heights of the high and low tides.
A sinusoid completes half of a period in the time that it takes to go from its maximum to its minimum value. One
period is twice this time. The first high tide occurs at 4:25 A.M. or x = 4.417 and the first low tide occurs at 10:55
A.M. or x = 10.917.
Because the period of a sinusoidal function is you can write Therefore,
The maximum data value occurs when x ≈ 4.417. Since y = cos x attains its first maximum when x = 0, we must
apply a phase shift of 4.417 − 0 or 4.417 units. Use this value to find c.
b. Write a function using the values for a, b, c, and d. Use b =
c. To find the height of the water at 8:45 P.M. that night, evaluate the model for x = 20.75.
Therefore, the tide was about 7.28 feet high at 8:45 P.M. that night.
GRAPHING CALCULATOR Find the values of x in the interval – < x < that make each equation or inequality true. (Hint: Use the intersection function.)
23. –sin x = cos x
SOLUTION:
Graph y = −sin x and y = cos x on the same graphing calculator screen on (−π, π). Use the intersect feature under the CALC menu to determine where the two graphs intersect.
The graphs intersect at about −0.7854 or − and about 2.356 or . Therefore, on –π < x < π, –sin x = cos x
when x = − and .
25. sin x + cos x = 0
SOLUTION:
Graph y = sin x + cos x on (−π, π). Use the zero feature under the CALC menu to determine the zeros of the function.
There are zeros at about −0.785 or − or and about 2.356 or . Therefore, on – < x < , sin x + cos x = 0
when x =
27. sin x cos x > 1
SOLUTION:
Graph y = sin x cos x and y = 1 on (− , ). Use the intersect feature under the CALC menu to determine on what interval(s) sin x cos x > 1.
The graphs do not intersect. Therefore, y = sin x cos x is not greater than y = 1 for any values of x on – < x < .
29. CAROUSELS A wooden horse on a carousel moves up and down as the carousel spins. When the ride ends, the horse usually stops in a vertical position different from where it started. The position y of the horse after t seconds can be modeled by y = 1.5 sin (2t + c), where the phase shift c must be continuously adjusted to compensate for the
different starting positions. If during one ride the horse reached a maximum height after seconds, find the
equation that models the horse’s position.
SOLUTION: First, find the period of y = 1.5 sin (2t + c).
Since the period is π, the function will reach a maximum height at radians. The phase shift is the difference
between the horizontal position of the function at and radians, which is radians. Substitute and b into
the phase shift formula to find c.
Therefore, the equation is
Write an equation that corresponds to each graph.
31.
SOLUTION: Sample answer: There is an x-intercept at 0, so one equation that corresponds to this graph is y = a sin (bx + c) + d. Half of the distance from the maximum to the minimum value of the function is 3. So, the amplitude is 3. It appears that the function completes one period on [0, π]. Find b.
The midline appears to be at y = 0, so there does not appear to be any vertical shift. Therefore, one equation that corresponds to this graph is y = 3 sin (2x).
33.
SOLUTION: Sample answer: Because there is a y-intercept at 3, one equation that corresponds to this graph is y = a cos (bx + c)+ d. Half of the distance from the maximum to the minimum value of the function is 4 ÷ 2 or 2. So, the amplitude is 2.
It appears that the function completes one period on Find b.
The midline appears to be at y = 1, so there is a vertical shift 1 unit up. Therefore, one equation that corresponds to this graph is y = 2 cos 4x + 1.
Write an equation for a sinusoidal function with the given period and amplitude that passes through the given point.
35. period: ; amplitude: 5; point:
SOLUTION: Use the period to find b.
Sample answer: One sinusoidal function in which a = 5 and b = 2 is y = 5 cos 2x. Evaluate the function for
The function passes through . Therefore, a sinusoidal function with period π and amplitude 5 that passes
through the point is y = 5 cos 2x.
37. period: ; amplitude: ; point:
SOLUTION: Use the period to find b.
Sample answer: One sinusoidal function in which a = 1.5 and b = 4 is y = 1.5 cos 4x. Evaluate the function for
The function passes through . Therefore, a sinusoidal function with period and amplitude 1.5 that passes
through the point is y = 1.5 cos 4x.
39. MULTIPLE REPRESENTATIONS In this problem, you will investigate the change in the graph of a sinusoidal function of the form y = sin x or y = cos x when multiplied by a polynomial function. a. GRAPHICAL Use a graphing calculator to sketch the graphs of y = 2x, y = –2x, and y = 2x cos x on the same coordinate plane, on the interval [–20, 20]. b. VERBAL Describe the behavior of the graph of y = 2x cos x in relation to the graphs of y = 2x and y = –2x.
c. GRAPHICAL Use a graphing calculator to sketch the graphs of y = x2, y = –x
2, and y = x
2 sin x on the same
coordinate plane, on the interval [–20, 20].
d. VERBAL Describe the behavior of the graph of y = x2 sin x in relation to the graphs of y = x
2 and y = –x
2.
e. ANALYTICAL Make a conjecture as to the behavior of the graph of a sinusoidal function of the form y = sin x or y = cos x when multiplied by polynomial function of the form y = f (x).
SOLUTION: a.
b. The graph of y = 2x cos x oscillates between the graphs of y = 2x and y = –2x. c.
d. The graph of y = x
2 sin x oscillates between the graphs of y = x
2 and y = –x
2.
e . The graph of y = f (x) sin x or y = f (x) cos x will oscillate between the graphs of y = f (x) and y = –f (x).
REASONING Determine whether each statement is true or false . Explain your reasoning.
41. Every sine function of the form y = a sin (bx + c) + d can be written as a cosine function of the form y = a cos (bx + c) + d.
SOLUTION: True; sample answer: The graph of cosine is a horizontal translation of the sine graph. Therefore, a cosine function can be written from any sine function using the same amplitude and period by applying the necessary phase shift.
43. CHALLENGE How many zeros does y = cos 1500x have on the interval 0 ≤ x ≤ 2 ?
SOLUTION: Find the period of y = cos 1500x.
Graph y = cos 1500x on .
The graph of y = cos 1500x has two x-intercepts for one cycle, so the function has 2 zeros per cycle. Find the
number of cycles for y = cos 1500x on [0, 2 ].
So, the graph of y = cos 1500x will complete 1500 cycles on [0, 2 ]. Because there are two zeros per cycle, y =
cos 1500x will have 1500(2) or 3000 zeros on [0, 2 ].
45. Writing in Math The Power Tower ride in Sandusky, Ohio, is shown below. Along the side of each tower is a string of lights that send a continuous pulse of light up and down each tower at a constant rate. Explain why the distance d of this light from the ground over time t cannot be represented by a sinusoidal function.
SOLUTION: Sample answer: Although the pulse of light can be represented as a function with a period, it is not a sinusoidal function because the distance the pulse of light is from the ground changes at a constant rate. As a result, the graph of this function would resemble the graph below.
The given point lies on the terminal side of an angle θ in standard position. Find the values of the six
trigonometric functions of θ. 47. (8, −2)
SOLUTION: Use the values of x and y to find r.
Use x = 8, y = –2, and r = to write the six trigonometric ratios.
49. (4, 5)
SOLUTION: Use the values of x and y to find r.
Use x = 4, y = 5, and r = to write the six trigonometric ratios.
Write each degree measure in radians as a multiple of π and each radian measure in degrees.
51. −420°
SOLUTION:
To convert a degree measure to radians, multiply by
53.
SOLUTION:
To convert a radian measure to degrees, multiply by
State the number of possible real zeros and turning points of each function. Then determine all of the real zeros by factoring.
55. f (x) = x3 + 2x
2 – 8x
SOLUTION: The degree of f (x) is 3, so it will have at most three real zeros and two turning points.
So, the zeros are −4, 0, and 2.
57. f (x) = x5 + 2x
4 – 4x
3 – 8x
2
SOLUTION: The degree of f (x) is 5, so it will have at most five real zeros and four turning points.
So, the zeros are −2, 0, and 2.
Determine whether f has an inverse function. If it does, find the inverse function and state any restrictions on its domain.
59. f (x) = −x – 2
SOLUTION:
Graph f (x) = −x – 2.
The graph of f passes the horizontal line test. Therefore, f is a one-to-one function and has an inverse function. From
the graph, you can see that f has domain (– , ) and range (– , ). Now find f–1
.
Because f–1
and f are the same function, the domain and range of f are equal to the domain and range of f–1
,
respectively. Therefore, it is not necessary to restrict the domain of f–1
.
61. f (x) = (x – 3)2 – 7
SOLUTION:
Graph f (x) = (x – 3)2 – 7.
The graph of f does not pass the horizontal line test. Therefore, f is not a one-to-one function and does not have an inverse function.
63. SAT/ACT If x + y = 90° and x and y are both nonnegative angles, what is equal to ?
A 0
B
C 1
D
E Cannot be determined from the information given.
SOLUTION:
If x + y = 90º, then x = 90º – y , and can be rewritten as . Let y = 60º.
Try a second angle. Let y = 45º.
Therefore, = 1, and the correct answer is C.
65. Identify the equation represented by the graph.
A y = sin 4x
B y = sin 2x
C y = 2 sin 2x
D y = 4 sin x
SOLUTION:
From the graph, it appears that the amplitude is 2 and the period is π. Use the period to find b.
So, the sine function represented by the graph could be y = 2 sin 2x. Therefore, the correct answer is C.
eSolutions Manual - Powered by Cognero Page 1
4-4 Graphing Sine and Cosine Functions

Describe how the graphs of f (x) and g (x) are related. Then find the amplitude of g (x), and sketch two periods of both functions on the same coordinate axes.
1. f (x) = sin x; g(x) = sin x
SOLUTION:
The graph of g(x) is the graph of f (x) compressed vertically. The amplitude of g(x) is or .
Create a table listing the coordinates of the x-intercepts and extrema for f (x) = sin x for one period, 2 , on the
interval [0, 2 ]. Then use the amplitude of g(x) to find corresponding points on its graph.
Sketch the curve through the indicated points for each function. Then repeat the pattern to complete a second period.
Functions x-intercept Maximum x-intercept Minimum x-intercept
f (x) = sin x (0, 0)
( , 0)
(2π, 0)
g(x) = sin x
(0, 0)
( , 0)
(2π, 0)
3. f (x) = cos x; g(x) = 6 cos x
SOLUTION:
The graph of g(x) is the graph of f (x) expanded vertically. The amplitude of g(x) is or 6.
Create a table listing the coordinates of the x-intercepts and extrema for f (x) = cos x for one period, 2 , on the
interval [0, 2 ]. Then use the amplitude of g(x) to find corresponding points on its graph.
Sketch the curve through the indicated points for each function. Then repeat the pattern to complete a second period.
Functions Maximum x-intercept Minimum x-intercept Maximum
f (x) = cos x
g(x) = 6 cos x
Describe how the graphs of f (x) and g (x) are related. Then find the period of g (x), and sketch at least oneperiod of both functions on the same coordinate axes.
5. f (x) = sin x; g(x) = sin 4x
SOLUTION:
The graph of g(x) is the graph of f (x) compressed horizontally. The period of g(x) is or . To find
corresponding points on the graph of g(x), change the x-coordinates of those key points on f (x) so that they range
from 0 to , increasing by increments of or .
Sketch the curve through the indicated points for each function. Then repeat the pattern to complete a second period.
Functions x-intercept Maximum x-intercept Minimum x-intercept
f (x) = sin x (0, 0)
(π, 0)
(2π, 0)
g(x) = sin 4x (0, 0)
7. f (x) = cos x; g(x) = cos 0.2x
SOLUTION:
The graph of g(x) is the graph of f (x) expanded horizontally. The period of g(x) is or . To find
corresponding points on the graph of g(x), change the x-coordinates of those key points on f (x) so that they range
from 0 to , increasing by increments of or .
Sketch the curve through the indicated points for each function. Then repeat the pattern to complete a second period.
Functions Maximum x-intercept Minimum x-intercept Maximum
f (x) = cos x (0, 1)
g(x) = cos x
(0, 1)
9. VOICES The contralto vocal type includes the deepest female singing voice. Some contraltos can sing as low as the E below middle C (E3), which has a frequency of 165 hertz. Write an equation for a sine function that models the initial behavior of the sound wave associated with E3 having an amplitude of 0.15.
SOLUTION:
The general form of the equation will be y = a sin bt, where t is the time in seconds. Because the amplitude is 0.15, a = 0.15. This means that a = ±0.15.
The period is the reciprocal of the frequency or . Use this value to find b.
Sample answer: One sine function that models the initial behavior is y = 0.15 sin 330 t.
Write a sine function that can be used to model the initial behavior of a sound wave with the frequency and amplitude given.
11. f = 932, a = 0.25
SOLUTION:
The general form of the equation is y = a sin bt, where t is the time in seconds. Because the amplitude is 0.25, =
0.25. This means that a = ±0.25.
The period is the reciprocal of the frequency or . Use this value to find b.
Using the positive values of a and b, one sine function that models the initial behavior is y = 0.25 sin 1864 t.
13. f = 623, a = 0.2
SOLUTION:
The general form of the equation is y = a sin bt, where t is the time in seconds. Because the amplitude is 0.2, =
0.2. This means that a = ±0.2.
The period is the reciprocal of the frequency or . Use this value to find b.
Using the positive values of a and b, one sine function that models the initial behavior is y = 0.2 sin 1246 t.
State the amplitude, period, frequency, phase shift, and vertical shift of each function. Then graph two periods of the function.
15.
SOLUTION:
In this function, a = 1, b = 1, c = , and d = 0. Because d = 0, there is no vertical shift.
Graph y = 3 cos x shifted units to the right.
17. y = sin 3x – 2
SOLUTION: In this function, a = 1, b = 3, c = 0, and d = –2.
Graph y = sin 3x shifted 2 units down.
19.
SOLUTION:
In this function, a = 1, b = 1, c = , and d = 4.
.
Graph y = sin x shifted units to the right and 4 units up.
21. TIDES The table shown below provides data for the first high and low tides of the day for a certain bay during oneday in June.
a. Determine the amplitude, period, phase shift, and vertical shift of a sinusoidal function that models the height of the tide. Let x represent the number of hours that the high or low tide occurred after midnight and y represent the height of the wave in feet. b. Write a sinusoidal function that models the data. c. According to your model, what was the height of the tide at 8:45 P.M. that night?
SOLUTION: a. Sample answer: Use a sinusoidal function of the form y = a cos (bx + c) + d to model the data. First, find the amplitude a, which is half of the distance between the heights of the high and low tides.
The vertical shift d is the average of the heights of the high and low tides.
A sinusoid completes half of a period in the time that it takes to go from its maximum to its minimum value. One
period is twice this time. The first high tide occurs at 4:25 A.M. or x = 4.417 and the first low tide occurs at 10:55
A.M. or x = 10.917.
Because the period of a sinusoidal function is you can write Therefore,
The maximum data value occurs when x ≈ 4.417. Since y = cos x attains its first maximum when x = 0, we must
apply a phase shift of 4.417 − 0 or 4.417 units. Use this value to find c.
b. Write a function using the values for a, b, c, and d. Use b =
c. To find the height of the water at 8:45 P.M. that night, evaluate the model for x = 20.75.
Therefore, the tide was about 7.28 feet high at 8:45 P.M. that night.
GRAPHING CALCULATOR Find the values of x in the interval – < x < that make each equation or inequality true. (Hint: Use the intersection function.)
23. –sin x = cos x
SOLUTION:
Graph y = −sin x and y = cos x on the same graphing calculator screen on (−π, π). Use the intersect feature under the CALC menu to determine where the two graphs intersect.
The graphs intersect at about −0.7854 or − and about 2.356 or . Therefore, on –π < x < π, –sin x = cos x
when x = − and .
25. sin x + cos x = 0
SOLUTION:
Graph y = sin x + cos x on (−π, π). Use the zero feature under the CALC menu to determine the zeros of the function.
There are zeros at about −0.785 or − or and about 2.356 or . Therefore, on – < x < , sin x + cos x = 0
when x =
27. sin x cos x > 1
SOLUTION:
Graph y = sin x cos x and y = 1 on (− , ). Use the intersect feature under the CALC menu to determine on what interval(s) sin x cos x > 1.
The graphs do not intersect. Therefore, y = sin x cos x is not greater than y = 1 for any values of x on – < x < .
29. CAROUSELS A wooden horse on a carousel moves up and down as the carousel spins. When the ride ends, the horse usually stops in a vertical position different from where it started. The position y of the horse after t seconds can be modeled by y = 1.5 sin (2t + c), where the phase shift c must be continuously adjusted to compensate for the
different starting positions. If during one ride the horse reached a maximum height after seconds, find the
equation that models the horse’s position.
SOLUTION: First, find the period of y = 1.5 sin (2t + c).
Since the period is π, the function will reach a maximum height at radians. The phase shift is the difference
between the horizontal position of the function at and radians, which is radians. Substitute and b into
the phase shift formula to find c.
Therefore, the equation is
Write an equation that corresponds to each graph.
31.
SOLUTION: Sample answer: There is an x-intercept at 0, so one equation that corresponds to this graph is y = a sin (bx + c) + d. Half of the distance from the maximum to the minimum value of the function is 3. So, the amplitude is 3. It appears that the function completes one period on [0, π]. Find b.
The midline appears to be at y = 0, so there does not appear to be any vertical shift. Therefore, one equation that corresponds to this graph is y = 3 sin (2x).
33.
SOLUTION: Sample answer: Because there is a y-intercept at 3, one equation that corresponds to this graph is y = a cos (bx + c)+ d. Half of the distance from the maximum to the minimum value of the function is 4 ÷ 2 or 2. So, the amplitude is 2.
It appears that the function completes one period on Find b.
The midline appears to be at y = 1, so there is a vertical shift 1 unit up. Therefore, one equation that corresponds to this graph is y = 2 cos 4x + 1.
Write an equation for a sinusoidal function with the given period and amplitude that passes through the given point.
35. period: ; amplitude: 5; point:
SOLUTION: Use the period to find b.
Sample answer: One sinusoidal function in which a = 5 and b = 2 is y = 5 cos 2x. Evaluate the function for
The function passes through . Therefore, a sinusoidal function with period π and amplitude 5 that passes
through the point is y = 5 cos 2x.
37. period: ; amplitude: ; point:
SOLUTION: Use the period to find b.
Sample answer: One sinusoidal function in which a = 1.5 and b = 4 is y = 1.5 cos 4x. Evaluate the function for
The function passes through . Therefore, a sinusoidal function with period and amplitude 1.5 that passes
through the point is y = 1.5 cos 4x.
39. MULTIPLE REPRESENTATIONS In this problem, you will investigate the change in the graph of a sinusoidal function of the form y = sin x or y = cos x when multiplied by a polynomial function. a. GRAPHICAL Use a graphing calculator to sketch the graphs of y = 2x, y = –2x, and y = 2x cos x on the same coordinate plane, on the interval [–20, 20]. b. VERBAL Describe the behavior of the graph of y = 2x cos x in relation to the graphs of y = 2x and y = –2x.
c. GRAPHICAL Use a graphing calculator to sketch the graphs of y = x2, y = –x
2, and y = x
2 sin x on the same
coordinate plane, on the interval [–20, 20].
d. VERBAL Describe the behavior of the graph of y = x2 sin x in relation to the graphs of y = x
2 and y = –x
2.
e. ANALYTICAL Make a conjecture as to the behavior of the graph of a sinusoidal function of the form y = sin x or y = cos x when multiplied by polynomial function of the form y = f (x).
SOLUTION: a.
b. The graph of y = 2x cos x oscillates between the graphs of y = 2x and y = –2x. c.
d. The graph of y = x
2 sin x oscillates between the graphs of y = x
2 and y = –x
2.
e . The graph of y = f (x) sin x or y = f (x) cos x will oscillate between the graphs of y = f (x) and y = –f (x).
REASONING Determine whether each statement is true or false . Explain your reasoning.
41. Every sine function of the form y = a sin (bx + c) + d can be written as a cosine function of the form y = a cos (bx + c) + d.
SOLUTION: True; sample answer: The graph of cosine is a horizontal translation of the sine graph. Therefore, a cosine function can be written from any sine function using the same amplitude and period by applying the necessary phase shift.
43. CHALLENGE How many zeros does y = cos 1500x have on the interval 0 ≤ x ≤ 2 ?
SOLUTION: Find the period of y = cos 1500x.
Graph y = cos 1500x on .
The graph of y = cos 1500x has two x-intercepts for one cycle, so the function has 2 zeros per cycle. Find the
number of cycles for y = cos 1500x on [0, 2 ].
So, the graph of y = cos 1500x will complete 1500 cycles on [0, 2 ]. Because there are two zeros per cycle, y =
cos 1500x will have 1500(2) or 3000 zeros on [0, 2 ].
45. Writing in Math The Power Tower ride in Sandusky, Ohio, is shown below. Along the side of each tower is a string of lights that send a continuous pulse of light up and down each tower at a constant rate. Explain why the distance d of this light from the ground over time t cannot be represented by a sinusoidal function.
SOLUTION: Sample answer: Although the pulse of light can be represented as a function with a period, it is not a sinusoidal function because the distance the pulse of light is from the ground changes at a constant rate. As a result, the graph of this function would resemble the graph below.
The given point lies on the terminal side of an angle θ in standard position. Find the values of the six
trigonometric functions of θ. 47. (8, −2)
SOLUTION: Use the values of x and y to find r.
Use x = 8, y = –2, and r = to write the six trigonometric ratios.
49. (4, 5)
SOLUTION: Use the values of x and y to find r.
Use x = 4, y = 5, and r = to write the six trigonometric ratios.
Write each degree measure in radians as a multiple of π and each radian measure in degrees.
51. −420°
SOLUTION:
To convert a degree measure to radians, multiply by
53.
SOLUTION:
To convert a radian measure to degrees, multiply by
State the number of possible real zeros and turning points of each function. Then determine all of the real zeros by factoring.
55. f (x) = x3 + 2x
2 – 8x
SOLUTION: The degree of f (x) is 3, so it will have at most three real zeros and two turning points.
So, the zeros are −4, 0, and 2.
57. f (x) = x5 + 2x
4 – 4x
3 – 8x
2
SOLUTION: The degree of f (x) is 5, so it will have at most five real zeros and four turning points.
So, the zeros are −2, 0, and 2.
Determine whether f has an inverse function. If it does, find the inverse function and state any restrictions on its domain.
59. f (x) = −x – 2
SOLUTION:
Graph f (x) = −x – 2.
The graph of f passes the horizontal line test. Therefore, f is a one-to-one function and has an inverse function. From
the graph, you can see that f has domain (– , ) and range (– , ). Now find f–1
.
Because f–1
and f are the same function, the domain and range of f are equal to the domain and range of f–1
,
respectively. Therefore, it is not necessary to restrict the domain of f–1
.
61. f (x) = (x – 3)2 – 7
SOLUTION:
Graph f (x) = (x – 3)2 – 7.
The graph of f does not pass the horizontal line test. Therefore, f is not a one-to-one function and does not have an inverse function.
63. SAT/ACT If x + y = 90° and x and y are both nonnegative angles, what is equal to ?
A 0
B
C 1
D
E Cannot be determined from the information given.
SOLUTION:
If x + y = 90º, then x = 90º – y , and can be rewritten as . Let y = 60º.
Try a second angle. Let y = 45º.
Therefore, = 1, and the correct answer is C.
65. Identify the equation represented by the graph.
A y = sin 4x
B y = sin 2x
C y = 2 sin 2x
D y = 4 sin x
SOLUTION:
From the graph, it appears that the amplitude is 2 and the period is π. Use the period to find b.
So, the sine function represented by the graph could be y = 2 sin 2x. Therefore, the correct answer is C.
eSolutions Manual - Powered by Cognero Page 2
4-4 Graphing Sine and Cosine Functions

Describe how the graphs of f (x) and g (x) are related. Then find the amplitude of g (x), and sketch two periods of both functions on the same coordinate axes.
1. f (x) = sin x; g(x) = sin x
SOLUTION:
The graph of g(x) is the graph of f (x) compressed vertically. The amplitude of g(x) is or .
Create a table listing the coordinates of the x-intercepts and extrema for f (x) = sin x for one period, 2 , on the
interval [0, 2 ]. Then use the amplitude of g(x) to find corresponding points on its graph.
Sketch the curve through the indicated points for each function. Then repeat the pattern to complete a second period.
Functions x-intercept Maximum x-intercept Minimum x-intercept
f (x) = sin x (0, 0)
( , 0)
(2π, 0)
g(x) = sin x
(0, 0)
( , 0)
(2π, 0)
3. f (x) = cos x; g(x) = 6 cos x
SOLUTION:
The graph of g(x) is the graph of f (x) expanded vertically. The amplitude of g(x) is or 6.
Create a table listing the coordinates of the x-intercepts and extrema for f (x) = cos x for one period, 2 , on the
interval [0, 2 ]. Then use the amplitude of g(x) to find corresponding points on its graph.
Sketch the curve through the indicated points for each function. Then repeat the pattern to complete a second period.
Functions Maximum x-intercept Minimum x-intercept Maximum
f (x) = cos x
g(x) = 6 cos x
Describe how the graphs of f (x) and g (x) are related. Then find the period of g (x), and sketch at least oneperiod of both functions on the same coordinate axes.
5. f (x) = sin x; g(x) = sin 4x
SOLUTION:
The graph of g(x) is the graph of f (x) compressed horizontally. The period of g(x) is or . To find
corresponding points on the graph of g(x), change the x-coordinates of those key points on f (x) so that they range
from 0 to , increasing by increments of or .
Sketch the curve through the indicated points for each function. Then repeat the pattern to complete a second period.
Functions x-intercept Maximum x-intercept Minimum x-intercept
f (x) = sin x (0, 0)
(π, 0)
(2π, 0)
g(x) = sin 4x (0, 0)
7. f (x) = cos x; g(x) = cos 0.2x
SOLUTION:
The graph of g(x) is the graph of f (x) expanded horizontally. The period of g(x) is or . To find
corresponding points on the graph of g(x), change the x-coordinates of those key points on f (x) so that they range
from 0 to , increasing by increments of or .
Sketch the curve through the indicated points for each function. Then repeat the pattern to complete a second period.
Functions Maximum x-intercept Minimum x-intercept Maximum
f (x) = cos x (0, 1)
g(x) = cos x
(0, 1)
9. VOICES The contralto vocal type includes the deepest female singing voice. Some contraltos can sing as low as the E below middle C (E3), which has a frequency of 165 hertz. Write an equation for a sine function that models the initial behavior of the sound wave associated with E3 having an amplitude of 0.15.
SOLUTION:
The general form of the equation will be y = a sin bt, where t is the time in seconds. Because the amplitude is 0.15, a = 0.15. This means that a = ±0.15.
The period is the reciprocal of the frequency or . Use this value to find b.
Sample answer: One sine function that models the initial behavior is y = 0.15 sin 330 t.
Write a sine function that can be used to model the initial behavior of a sound wave with the frequency and amplitude given.
11. f = 932, a = 0.25
SOLUTION:
The general form of the equation is y = a sin bt, where t is the time in seconds. Because the amplitude is 0.25, =
0.25. This means that a = ±0.25.
The period is the reciprocal of the frequency or . Use this value to find b.
Using the positive values of a and b, one sine function that models the initial behavior is y = 0.25 sin 1864 t.
13. f = 623, a = 0.2
SOLUTION:
The general form of the equation is y = a sin bt, where t is the time in seconds. Because the amplitude is 0.2, =
0.2. This means that a = ±0.2.
The period is the reciprocal of the frequency or . Use this value to find b.
Using the positive values of a and b, one sine function that models the initial behavior is y = 0.2 sin 1246 t.
State the amplitude, period, frequency, phase shift, and vertical shift of each function. Then graph two periods of the function.
15.
SOLUTION:
In this function, a = 1, b = 1, c = , and d = 0. Because d = 0, there is no vertical shift.
Graph y = 3 cos x shifted units to the right.
17. y = sin 3x – 2
SOLUTION: In this function, a = 1, b = 3, c = 0, and d = –2.
Graph y = sin 3x shifted 2 units down.
19.
SOLUTION:
In this function, a = 1, b = 1, c = , and d = 4.
.
Graph y = sin x shifted units to the right and 4 units up.
21. TIDES The table shown below provides data for the first high and low tides of the day for a certain bay during oneday in June.
a. Determine the amplitude, period, phase shift, and vertical shift of a sinusoidal function that models the height of the tide. Let x represent the number of hours that the high or low tide occurred after midnight and y represent the height of the wave in feet. b. Write a sinusoidal function that models the data. c. According to your model, what was the height of the tide at 8:45 P.M. that night?
SOLUTION: a. Sample answer: Use a sinusoidal function of the form y = a cos (bx + c) + d to model the data. First, find the amplitude a, which is half of the distance between the heights of the high and low tides.
The vertical shift d is the average of the heights of the high and low tides.
A sinusoid completes half of a period in the time that it takes to go from its maximum to its minimum value. One
period is twice this time. The first high tide occurs at 4:25 A.M. or x = 4.417 and the first low tide occurs at 10:55
A.M. or x = 10.917.
Because the period of a sinusoidal function is you can write Therefore,
The maximum data value occurs when x ≈ 4.417. Since y = cos x attains its first maximum when x = 0, we must
apply a phase shift of 4.417 − 0 or 4.417 units. Use this value to find c.
b. Write a function using the values for a, b, c, and d. Use b =
c. To find the height of the water at 8:45 P.M. that night, evaluate the model for x = 20.75.
Therefore, the tide was about 7.28 feet high at 8:45 P.M. that night.
GRAPHING CALCULATOR Find the values of x in the interval – < x < that make each equation or inequality true. (Hint: Use the intersection function.)
23. –sin x = cos x
SOLUTION:
Graph y = −sin x and y = cos x on the same graphing calculator screen on (−π, π). Use the intersect feature under the CALC menu to determine where the two graphs intersect.
The graphs intersect at about −0.7854 or − and about 2.356 or . Therefore, on –π < x < π, –sin x = cos x
when x = − and .
25. sin x + cos x = 0
SOLUTION:
Graph y = sin x + cos x on (−π, π). Use the zero feature under the CALC menu to determine the zeros of the function.
There are zeros at about −0.785 or − or and about 2.356 or . Therefore, on – < x < , sin x + cos x = 0
when x =
27. sin x cos x > 1
SOLUTION:
Graph y = sin x cos x and y = 1 on (− , ). Use the intersect feature under the CALC menu to determine on what interval(s) sin x cos x > 1.
The graphs do not intersect. Therefore, y = sin x cos x is not greater than y = 1 for any values of x on – < x < .
29. CAROUSELS A wooden horse on a carousel moves up and down as the carousel spins. When the ride ends, the horse usually stops in a vertical position different from where it started. The position y of the horse after t seconds can be modeled by y = 1.5 sin (2t + c), where the phase shift c must be continuously adjusted to compensate for the
different starting positions. If during one ride the horse reached a maximum height after seconds, find the
equation that models the horse’s position.
SOLUTION: First, find the period of y = 1.5 sin (2t + c).
Since the period is π, the function will reach a maximum height at radians. The phase shift is the difference
between the horizontal position of the function at and radians, which is radians. Substitute and b into
the phase shift formula to find c.
Therefore, the equation is
Write an equation that corresponds to each graph.
31.
SOLUTION: Sample answer: There is an x-intercept at 0, so one equation that corresponds to this graph is y = a sin (bx + c) + d. Half of the distance from the maximum to the minimum value of the function is 3. So, the amplitude is 3. It appears that the function completes one period on [0, π]. Find b.
The midline appears to be at y = 0, so there does not appear to be any vertical shift. Therefore, one equation that corresponds to this graph is y = 3 sin (2x).
33.
SOLUTION: Sample answer: Because there is a y-intercept at 3, one equation that corresponds to this graph is y = a cos (bx + c)+ d. Half of the distance from the maximum to the minimum value of the function is 4 ÷ 2 or 2. So, the amplitude is 2.
It appears that the function completes one period on Find b.
The midline appears to be at y = 1, so there is a vertical shift 1 unit up. Therefore, one equation that corresponds to this graph is y = 2 cos 4x + 1.
Write an equation for a sinusoidal function with the given period and amplitude that passes through the given point.
35. period: ; amplitude: 5; point:
SOLUTION: Use the period to find b.
Sample answer: One sinusoidal function in which a = 5 and b = 2 is y = 5 cos 2x. Evaluate the function for
The function passes through . Therefore, a sinusoidal function with period π and amplitude 5 that passes
through the point is y = 5 cos 2x.
37. period: ; amplitude: ; point:
SOLUTION: Use the period to find b.
Sample answer: One sinusoidal function in which a = 1.5 and b = 4 is y = 1.5 cos 4x. Evaluate the function for
The function passes through . Therefore, a sinusoidal function with period and amplitude 1.5 that passes
through the point is y = 1.5 cos 4x.
39. MULTIPLE REPRESENTATIONS In this problem, you will investigate the change in the graph of a sinusoidal function of the form y = sin x or y = cos x when multiplied by a polynomial function. a. GRAPHICAL Use a graphing calculator to sketch the graphs of y = 2x, y = –2x, and y = 2x cos x on the same coordinate plane, on the interval [–20, 20]. b. VERBAL Describe the behavior of the graph of y = 2x cos x in relation to the graphs of y = 2x and y = –2x.
c. GRAPHICAL Use a graphing calculator to sketch the graphs of y = x2, y = –x
2, and y = x
2 sin x on the same
coordinate plane, on the interval [–20, 20].
d. VERBAL Describe the behavior of the graph of y = x2 sin x in relation to the graphs of y = x
2 and y = –x
2.
e. ANALYTICAL Make a conjecture as to the behavior of the graph of a sinusoidal function of the form y = sin x or y = cos x when multiplied by polynomial function of the form y = f (x).
SOLUTION: a.
b. The graph of y = 2x cos x oscillates between the graphs of y = 2x and y = –2x. c.
d. The graph of y = x
2 sin x oscillates between the graphs of y = x
2 and y = –x
2.
e . The graph of y = f (x) sin x or y = f (x) cos x will oscillate between the graphs of y = f (x) and y = –f (x).
REASONING Determine whether each statement is true or false . Explain your reasoning.
41. Every sine function of the form y = a sin (bx + c) + d can be written as a cosine function of the form y = a cos (bx + c) + d.
SOLUTION: True; sample answer: The graph of cosine is a horizontal translation of the sine graph. Therefore, a cosine function can be written from any sine function using the same amplitude and period by applying the necessary phase shift.
43. CHALLENGE How many zeros does y = cos 1500x have on the interval 0 ≤ x ≤ 2 ?
SOLUTION: Find the period of y = cos 1500x.
Graph y = cos 1500x on .
The graph of y = cos 1500x has two x-intercepts for one cycle, so the function has 2 zeros per cycle. Find the
number of cycles for y = cos 1500x on [0, 2 ].
So, the graph of y = cos 1500x will complete 1500 cycles on [0, 2 ]. Because there are two zeros per cycle, y =
cos 1500x will have 1500(2) or 3000 zeros on [0, 2 ].
45. Writing in Math The Power Tower ride in Sandusky, Ohio, is shown below. Along the side of each tower is a string of lights that send a continuous pulse of light up and down each tower at a constant rate. Explain why the distance d of this light from the ground over time t cannot be represented by a sinusoidal function.
SOLUTION: Sample answer: Although the pulse of light can be represented as a function with a period, it is not a sinusoidal function because the distance the pulse of light is from the ground changes at a constant rate. As a result, the graph of this function would resemble the graph below.
The given point lies on the terminal side of an angle θ in standard position. Find the values of the six
trigonometric functions of θ. 47. (8, −2)
SOLUTION: Use the values of x and y to find r.
Use x = 8, y = –2, and r = to write the six trigonometric ratios.
49. (4, 5)
SOLUTION: Use the values of x and y to find r.
Use x = 4, y = 5, and r = to write the six trigonometric ratios.
Write each degree measure in radians as a multiple of π and each radian measure in degrees.
51. −420°
SOLUTION:
To convert a degree measure to radians, multiply by
53.
SOLUTION:
To convert a radian measure to degrees, multiply by
State the number of possible real zeros and turning points of each function. Then determine all of the real zeros by factoring.
55. f (x) = x3 + 2x
2 – 8x
SOLUTION: The degree of f (x) is 3, so it will have at most three real zeros and two turning points.
So, the zeros are −4, 0, and 2.
57. f (x) = x5 + 2x
4 – 4x
3 – 8x
2
SOLUTION: The degree of f (x) is 5, so it will have at most five real zeros and four turning points.
So, the zeros are −2, 0, and 2.
Determine whether f has an inverse function. If it does, find the inverse function and state any restrictions on its domain.
59. f (x) = −x – 2
SOLUTION:
Graph f (x) = −x – 2.
The graph of f passes the horizontal line test. Therefore, f is a one-to-one function and has an inverse function. From
the graph, you can see that f has domain (– , ) and range (– , ). Now find f–1
.
Because f–1
and f are the same function, the domain and range of f are equal to the domain and range of f–1
,
respectively. Therefore, it is not necessary to restrict the domain of f–1
.
61. f (x) = (x – 3)2 – 7
SOLUTION:
Graph f (x) = (x – 3)2 – 7.
The graph of f does not pass the horizontal line test. Therefore, f is not a one-to-one function and does not have an inverse function.
63. SAT/ACT If x + y = 90° and x and y are both nonnegative angles, what is equal to ?
A 0
B
C 1
D
E Cannot be determined from the information given.
SOLUTION:
If x + y = 90º, then x = 90º – y , and can be rewritten as . Let y = 60º.
Try a second angle. Let y = 45º.
Therefore, = 1, and the correct answer is C.
65. Identify the equation represented by the graph.
A y = sin 4x
B y = sin 2x
C y = 2 sin 2x
D y = 4 sin x
SOLUTION:
From the graph, it appears that the amplitude is 2 and the period is π. Use the period to find b.
So, the sine function represented by the graph could be y = 2 sin 2x. Therefore, the correct answer is C.
eSolutions Manual - Powered by Cognero Page 3
4-4 Graphing Sine and Cosine Functions

Describe how the graphs of f (x) and g (x) are related. Then find the amplitude of g (x), and sketch two periods of both functions on the same coordinate axes.
1. f (x) = sin x; g(x) = sin x
SOLUTION:
The graph of g(x) is the graph of f (x) compressed vertically. The amplitude of g(x) is or .
Create a table listing the coordinates of the x-intercepts and extrema for f (x) = sin x for one period, 2 , on the
interval [0, 2 ]. Then use the amplitude of g(x) to find corresponding points on its graph.
Sketch the curve through the indicated points for each function. Then repeat the pattern to complete a second period.
Functions x-intercept Maximum x-intercept Minimum x-intercept
f (x) = sin x (0, 0)
( , 0)
(2π, 0)
g(x) = sin x
(0, 0)
( , 0)
(2π, 0)
3. f (x) = cos x; g(x) = 6 cos x
SOLUTION:
The graph of g(x) is the graph of f (x) expanded vertically. The amplitude of g(x) is or 6.
Create a table listing the coordinates of the x-intercepts and extrema for f (x) = cos x for one period, 2 , on the
interval [0, 2 ]. Then use the amplitude of g(x) to find corresponding points on its graph.
Sketch the curve through the indicated points for each function. Then repeat the pattern to complete a second period.
Functions Maximum x-intercept Minimum x-intercept Maximum
f (x) = cos x
g(x) = 6 cos x
Describe how the graphs of f (x) and g (x) are related. Then find the period of g (x), and sketch at least oneperiod of both functions on the same coordinate axes.
5. f (x) = sin x; g(x) = sin 4x
SOLUTION:
The graph of g(x) is the graph of f (x) compressed horizontally. The period of g(x) is or . To find
corresponding points on the graph of g(x), change the x-coordinates of those key points on f (x) so that they range
from 0 to , increasing by increments of or .
Sketch the curve through the indicated points for each function. Then repeat the pattern to complete a second period.
Functions x-intercept Maximum x-intercept Minimum x-intercept
f (x) = sin x (0, 0)
(π, 0)
(2π, 0)
g(x) = sin 4x (0, 0)
7. f (x) = cos x; g(x) = cos 0.2x
SOLUTION:
The graph of g(x) is the graph of f (x) expanded horizontally. The period of g(x) is or . To find
corresponding points on the graph of g(x), change the x-coordinates of those key points on f (x) so that they range
from 0 to , increasing by increments of or .
Sketch the curve through the indicated points for each function. Then repeat the pattern to complete a second period.
Functions Maximum x-intercept Minimum x-intercept Maximum
f (x) = cos x (0, 1)
g(x) = cos x
(0, 1)
9. VOICES The contralto vocal type includes the deepest female singing voice. Some contraltos can sing as low as the E below middle C (E3), which has a frequency of 165 hertz. Write an equation for a sine function that models the initial behavior of the sound wave associated with E3 having an amplitude of 0.15.
SOLUTION:
The general form of the equation will be y = a sin bt, where t is the time in seconds. Because the amplitude is 0.15, a = 0.15. This means that a = ±0.15.
The period is the reciprocal of the frequency or . Use this value to find b.
Sample answer: One sine function that models the initial behavior is y = 0.15 sin 330 t.
Write a sine function that can be used to model the initial behavior of a sound wave with the frequency and amplitude given.
11. f = 932, a = 0.25
SOLUTION:
The general form of the equation is y = a sin bt, where t is the time in seconds. Because the amplitude is 0.25, =
0.25. This means that a = ±0.25.
The period is the reciprocal of the frequency or . Use this value to find b.
Using the positive values of a and b, one sine function that models the initial behavior is y = 0.25 sin 1864 t.
13. f = 623, a = 0.2
SOLUTION:
The general form of the equation is y = a sin bt, where t is the time in seconds. Because the amplitude is 0.2, =
0.2. This means that a = ±0.2.
The period is the reciprocal of the frequency or . Use this value to find b.
Using the positive values of a and b, one sine function that models the initial behavior is y = 0.2 sin 1246 t.
State the amplitude, period, frequency, phase shift, and vertical shift of each function. Then graph two periods of the function.
15.
SOLUTION:
In this function, a = 1, b = 1, c = , and d = 0. Because d = 0, there is no vertical shift.
Graph y = 3 cos x shifted units to the right.
17. y = sin 3x – 2
SOLUTION: In this function, a = 1, b = 3, c = 0, and d = –2.
Graph y = sin 3x shifted 2 units down.
19.
SOLUTION:
In this function, a = 1, b = 1, c = , and d = 4.
.
Graph y = sin x shifted units to the right and 4 units up.
21. TIDES The table shown below provides data for the first high and low tides of the day for a certain bay during oneday in June.
a. Determine the amplitude, period, phase shift, and vertical shift of a sinusoidal function that models the height of the tide. Let x represent the number of hours that the high or low tide occurred after midnight and y represent the height of the wave in feet. b. Write a sinusoidal function that models the data. c. According to your model, what was the height of the tide at 8:45 P.M. that night?
SOLUTION: a. Sample answer: Use a sinusoidal function of the form y = a cos (bx + c) + d to model the data. First, find the amplitude a, which is half of the distance between the heights of the high and low tides.
The vertical shift d is the average of the heights of the high and low tides.
A sinusoid completes half of a period in the time that it takes to go from its maximum to its minimum value. One
period is twice this time. The first high tide occurs at 4:25 A.M. or x = 4.417 and the first low tide occurs at 10:55
A.M. or x = 10.917.
Because the period of a sinusoidal function is you can write Therefore,
The maximum data value occurs when x ≈ 4.417. Since y = cos x attains its first maximum when x = 0, we must
apply a phase shift of 4.417 − 0 or 4.417 units. Use this value to find c.
b. Write a function using the values for a, b, c, and d. Use b =
c. To find the height of the water at 8:45 P.M. that night, evaluate the model for x = 20.75.
Therefore, the tide was about 7.28 feet high at 8:45 P.M. that night.
GRAPHING CALCULATOR Find the values of x in the interval – < x < that make each equation or inequality true. (Hint: Use the intersection function.)
23. –sin x = cos x
SOLUTION:
Graph y = −sin x and y = cos x on the same graphing calculator screen on (−π, π). Use the intersect feature under the CALC menu to determine where the two graphs intersect.
The graphs intersect at about −0.7854 or − and about 2.356 or . Therefore, on –π < x < π, –sin x = cos x
when x = − and .
25. sin x + cos x = 0
SOLUTION:
Graph y = sin x + cos x on (−π, π). Use the zero feature under the CALC menu to determine the zeros of the function.
There are zeros at about −0.785 or − or and about 2.356 or . Therefore, on – < x < , sin x + cos x = 0
when x =
27. sin x cos x > 1
SOLUTION:
Graph y = sin x cos x and y = 1 on (− , ). Use the intersect feature under the CALC menu to determine on what interval(s) sin x cos x > 1.
The graphs do not intersect. Therefore, y = sin x cos x is not greater than y = 1 for any values of x on – < x < .
29. CAROUSELS A wooden horse on a carousel moves up and down as the carousel spins. When the ride ends, the horse usually stops in a vertical position different from where it started. The position y of the horse after t seconds can be modeled by y = 1.5 sin (2t + c), where the phase shift c must be continuously adjusted to compensate for the
different starting positions. If during one ride the horse reached a maximum height after seconds, find the
equation that models the horse’s position.
SOLUTION: First, find the period of y = 1.5 sin (2t + c).
Since the period is π, the function will reach a maximum height at radians. The phase shift is the difference
between the horizontal position of the function at and radians, which is radians. Substitute and b into
the phase shift formula to find c.
Therefore, the equation is
Write an equation that corresponds to each graph.
31.
SOLUTION: Sample answer: There is an x-intercept at 0, so one equation that corresponds to this graph is y = a sin (bx + c) + d. Half of the distance from the maximum to the minimum value of the function is 3. So, the amplitude is 3. It appears that the function completes one period on [0, π]. Find b.
The midline appears to be at y = 0, so there does not appear to be any vertical shift. Therefore, one equation that corresponds to this graph is y = 3 sin (2x).
33.
SOLUTION: Sample answer: Because there is a y-intercept at 3, one equation that corresponds to this graph is y = a cos (bx + c)+ d. Half of the distance from the maximum to the minimum value of the function is 4 ÷ 2 or 2. So, the amplitude is 2.
It appears that the function completes one period on Find b.
The midline appears to be at y = 1, so there is a vertical shift 1 unit up. Therefore, one equation that corresponds to this graph is y = 2 cos 4x + 1.
Write an equation for a sinusoidal function with the given period and amplitude that passes through the given point.
35. period: ; amplitude: 5; point:
SOLUTION: Use the period to find b.
Sample answer: One sinusoidal function in which a = 5 and b = 2 is y = 5 cos 2x. Evaluate the function for
The function passes through . Therefore, a sinusoidal function with period π and amplitude 5 that passes
through the point is y = 5 cos 2x.
37. period: ; amplitude: ; point:
SOLUTION: Use the period to find b.
Sample answer: One sinusoidal function in which a = 1.5 and b = 4 is y = 1.5 cos 4x. Evaluate the function for
The function passes through . Therefore, a sinusoidal function with period and amplitude 1.5 that passes
through the point is y = 1.5 cos 4x.
39. MULTIPLE REPRESENTATIONS In this problem, you will investigate the change in the graph of a sinusoidal function of the form y = sin x or y = cos x when multiplied by a polynomial function. a. GRAPHICAL Use a graphing calculator to sketch the graphs of y = 2x, y = –2x, and y = 2x cos x on the same coordinate plane, on the interval [–20, 20]. b. VERBAL Describe the behavior of the graph of y = 2x cos x in relation to the graphs of y = 2x and y = –2x.
c. GRAPHICAL Use a graphing calculator to sketch the graphs of y = x2, y = –x
2, and y = x
2 sin x on the same
coordinate plane, on the interval [–20, 20].
d. VERBAL Describe the behavior of the graph of y = x2 sin x in relation to the graphs of y = x
2 and y = –x
2.
e. ANALYTICAL Make a conjecture as to the behavior of the graph of a sinusoidal function of the form y = sin x or y = cos x when multiplied by polynomial function of the form y = f (x).
SOLUTION: a.
b. The graph of y = 2x cos x oscillates between the graphs of y = 2x and y = –2x. c.
d. The graph of y = x
2 sin x oscillates between the graphs of y = x
2 and y = –x
2.
e . The graph of y = f (x) sin x or y = f (x) cos x will oscillate between the graphs of y = f (x) and y = –f (x).
REASONING Determine whether each statement is true or false . Explain your reasoning.
41. Every sine function of the form y = a sin (bx + c) + d can be written as a cosine function of the form y = a cos (bx + c) + d.
SOLUTION: True; sample answer: The graph of cosine is a horizontal translation of the sine graph. Therefore, a cosine function can be written from any sine function using the same amplitude and period by applying the necessary phase shift.
43. CHALLENGE How many zeros does y = cos 1500x have on the interval 0 ≤ x ≤ 2 ?
SOLUTION: Find the period of y = cos 1500x.
Graph y = cos 1500x on .
The graph of y = cos 1500x has two x-intercepts for one cycle, so the function has 2 zeros per cycle. Find the
number of cycles for y = cos 1500x on [0, 2 ].
So, the graph of y = cos 1500x will complete 1500 cycles on [0, 2 ]. Because there are two zeros per cycle, y =
cos 1500x will have 1500(2) or 3000 zeros on [0, 2 ].
45. Writing in Math The Power Tower ride in Sandusky, Ohio, is shown below. Along the side of each tower is a string of lights that send a continuous pulse of light up and down each tower at a constant rate. Explain why the distance d of this light from the ground over time t cannot be represented by a sinusoidal function.
SOLUTION: Sample answer: Although the pulse of light can be represented as a function with a period, it is not a sinusoidal function because the distance the pulse of light is from the ground changes at a constant rate. As a result, the graph of this function would resemble the graph below.
The given point lies on the terminal side of an angle θ in standard position. Find the values of the six
trigonometric functions of θ. 47. (8, −2)
SOLUTION: Use the values of x and y to find r.
Use x = 8, y = –2, and r = to write the six trigonometric ratios.
49. (4, 5)
SOLUTION: Use the values of x and y to find r.
Use x = 4, y = 5, and r = to write the six trigonometric ratios.
Write each degree measure in radians as a multiple of π and each radian measure in degrees.
51. −420°
SOLUTION:
To convert a degree measure to radians, multiply by
53.
SOLUTION:
To convert a radian measure to degrees, multiply by
State the number of possible real zeros and turning points of each function. Then determine all of the real zeros by factoring.
55. f (x) = x3 + 2x
2 – 8x
SOLUTION: The degree of f (x) is 3, so it will have at most three real zeros and two turning points.
So, the zeros are −4, 0, and 2.
57. f (x) = x5 + 2x
4 – 4x
3 – 8x
2
SOLUTION: The degree of f (x) is 5, so it will have at most five real zeros and four turning points.
So, the zeros are −2, 0, and 2.
Determine whether f has an inverse function. If it does, find the inverse function and state any restrictions on its domain.
59. f (x) = −x – 2
SOLUTION:
Graph f (x) = −x – 2.
The graph of f passes the horizontal line test. Therefore, f is a one-to-one function and has an inverse function. From
the graph, you can see that f has domain (– , ) and range (– , ). Now find f–1
.
Because f–1
and f are the same function, the domain and range of f are equal to the domain and range of f–1
,
respectively. Therefore, it is not necessary to restrict the domain of f–1
.
61. f (x) = (x – 3)2 – 7
SOLUTION:
Graph f (x) = (x – 3)2 – 7.
The graph of f does not pass the horizontal line test. Therefore, f is not a one-to-one function and does not have an inverse function.
63. SAT/ACT If x + y = 90° and x and y are both nonnegative angles, what is equal to ?
A 0
B
C 1
D
E Cannot be determined from the information given.
SOLUTION:
If x + y = 90º, then x = 90º – y , and can be rewritten as . Let y = 60º.
Try a second angle. Let y = 45º.
Therefore, = 1, and the correct answer is C.
65. Identify the equation represented by the graph.
A y = sin 4x
B y = sin 2x
C y = 2 sin 2x
D y = 4 sin x
SOLUTION:
From the graph, it appears that the amplitude is 2 and the period is π. Use the period to find b.
So, the sine function represented by the graph could be y = 2 sin 2x. Therefore, the correct answer is C.
eSolutions Manual - Powered by Cognero Page 4
4-4 Graphing Sine and Cosine Functions

Describe how the graphs of f (x) and g (x) are related. Then find the amplitude of g (x), and sketch two periods of both functions on the same coordinate axes.
1. f (x) = sin x; g(x) = sin x
SOLUTION:
The graph of g(x) is the graph of f (x) compressed vertically. The amplitude of g(x) is or .
Create a table listing the coordinates of the x-intercepts and extrema for f (x) = sin x for one period, 2 , on the
interval [0, 2 ]. Then use the amplitude of g(x) to find corresponding points on its graph.
Sketch the curve through the indicated points for each function. Then repeat the pattern to complete a second period.
Functions x-intercept Maximum x-intercept Minimum x-intercept
f (x) = sin x (0, 0)
( , 0)
(2π, 0)
g(x) = sin x
(0, 0)
( , 0)
(2π, 0)
3. f (x) = cos x; g(x) = 6 cos x
SOLUTION:
The graph of g(x) is the graph of f (x) expanded vertically. The amplitude of g(x) is or 6.
Create a table listing the coordinates of the x-intercepts and extrema for f (x) = cos x for one period, 2 , on the
interval [0, 2 ]. Then use the amplitude of g(x) to find corresponding points on its graph.
Sketch the curve through the indicated points for each function. Then repeat the pattern to complete a second period.
Functions Maximum x-intercept Minimum x-intercept Maximum
f (x) = cos x
g(x) = 6 cos x
Describe how the graphs of f (x) and g (x) are related. Then find the period of g (x), and sketch at least oneperiod of both functions on the same coordinate axes.
5. f (x) = sin x; g(x) = sin 4x
SOLUTION:
The graph of g(x) is the graph of f (x) compressed horizontally. The period of g(x) is or . To find
corresponding points on the graph of g(x), change the x-coordinates of those key points on f (x) so that they range
from 0 to , increasing by increments of or .
Sketch the curve through the indicated points for each function. Then repeat the pattern to complete a second period.
Functions x-intercept Maximum x-intercept Minimum x-intercept
f (x) = sin x (0, 0)
(π, 0)
(2π, 0)
g(x) = sin 4x (0, 0)
7. f (x) = cos x; g(x) = cos 0.2x
SOLUTION:
The graph of g(x) is the graph of f (x) expanded horizontally. The period of g(x) is or . To find
corresponding points on the graph of g(x), change the x-coordinates of those key points on f (x) so that they range
from 0 to , increasing by increments of or .
Sketch the curve through the indicated points for each function. Then repeat the pattern to complete a second period.
Functions Maximum x-intercept Minimum x-intercept Maximum
f (x) = cos x (0, 1)
g(x) = cos x
(0, 1)
9. VOICES The contralto vocal type includes the deepest female singing voice. Some contraltos can sing as low as the E below middle C (E3), which has a frequency of 165 hertz. Write an equation for a sine function that models the initial behavior of the sound wave associated with E3 having an amplitude of 0.15.
SOLUTION:
The general form of the equation will be y = a sin bt, where t is the time in seconds. Because the amplitude is 0.15, a = 0.15. This means that a = ±0.15.
The period is the reciprocal of the frequency or . Use this value to find b.
Sample answer: One sine function that models the initial behavior is y = 0.15 sin 330 t.
Write a sine function that can be used to model the initial behavior of a sound wave with the frequency and amplitude given.
11. f = 932, a = 0.25
SOLUTION:
The general form of the equation is y = a sin bt, where t is the time in seconds. Because the amplitude is 0.25, =
0.25. This means that a = ±0.25.
The period is the reciprocal of the frequency or . Use this value to find b.
Using the positive values of a and b, one sine function that models the initial behavior is y = 0.25 sin 1864 t.
13. f = 623, a = 0.2
SOLUTION:
The general form of the equation is y = a sin bt, where t is the time in seconds. Because the amplitude is 0.2, =
0.2. This means that a = ±0.2.
The period is the reciprocal of the frequency or . Use this value to find b.
Using the positive values of a and b, one sine function that models the initial behavior is y = 0.2 sin 1246 t.
State the amplitude, period, frequency, phase shift, and vertical shift of each function. Then graph two periods of the function.
15.
SOLUTION:
In this function, a = 1, b = 1, c = , and d = 0. Because d = 0, there is no vertical shift.
Graph y = 3 cos x shifted units to the right.
17. y = sin 3x – 2
SOLUTION: In this function, a = 1, b = 3, c = 0, and d = –2.
Graph y = sin 3x shifted 2 units down.
19.
SOLUTION:
In this function, a = 1, b = 1, c = , and d = 4.
.
Graph y = sin x shifted units to the right and 4 units up.
21. TIDES The table shown below provides data for the first high and low tides of the day for a certain bay during oneday in June.
a. Determine the amplitude, period, phase shift, and vertical shift of a sinusoidal function that models the height of the tide. Let x represent the number of hours that the high or low tide occurred after midnight and y represent the height of the wave in feet. b. Write a sinusoidal function that models the data. c. According to your model, what was the height of the tide at 8:45 P.M. that night?
SOLUTION: a. Sample answer: Use a sinusoidal function of the form y = a cos (bx + c) + d to model the data. First, find the amplitude a, which is half of the distance between the heights of the high and low tides.
The vertical shift d is the average of the heights of the high and low tides.
A sinusoid completes half of a period in the time that it takes to go from its maximum to its minimum value. One
period is twice this time. The first high tide occurs at 4:25 A.M. or x = 4.417 and the first low tide occurs at 10:55
A.M. or x = 10.917.
Because the period of a sinusoidal function is you can write Therefore,
The maximum data value occurs when x ≈ 4.417. Since y = cos x attains its first maximum when x = 0, we must
apply a phase shift of 4.417 − 0 or 4.417 units. Use this value to find c.
b. Write a function using the values for a, b, c, and d. Use b =
c. To find the height of the water at 8:45 P.M. that night, evaluate the model for x = 20.75.
Therefore, the tide was about 7.28 feet high at 8:45 P.M. that night.
GRAPHING CALCULATOR Find the values of x in the interval – < x < that make each equation or inequality true. (Hint: Use the intersection function.)
23. –sin x = cos x
SOLUTION:
Graph y = −sin x and y = cos x on the same graphing calculator screen on (−π, π). Use the intersect feature under the CALC menu to determine where the two graphs intersect.
The graphs intersect at about −0.7854 or − and about 2.356 or . Therefore, on –π < x < π, –sin x = cos x
when x = − and .
25. sin x + cos x = 0
SOLUTION:
Graph y = sin x + cos x on (−π, π). Use the zero feature under the CALC menu to determine the zeros of the function.
There are zeros at about −0.785 or − or and about 2.356 or . Therefore, on – < x < , sin x + cos x = 0
when x =
27. sin x cos x > 1
SOLUTION:
Graph y = sin x cos x and y = 1 on (− , ). Use the intersect feature under the CALC menu to determine on what interval(s) sin x cos x > 1.
The graphs do not intersect. Therefore, y = sin x cos x is not greater than y = 1 for any values of x on – < x < .
29. CAROUSELS A wooden horse on a carousel moves up and down as the carousel spins. When the ride ends, the horse usually stops in a vertical position different from where it started. The position y of the horse after t seconds can be modeled by y = 1.5 sin (2t + c), where the phase shift c must be continuously adjusted to compensate for the
different starting positions. If during one ride the horse reached a maximum height after seconds, find the
equation that models the horse’s position.
SOLUTION: First, find the period of y = 1.5 sin (2t + c).
Since the period is π, the function will reach a maximum height at radians. The phase shift is the difference
between the horizontal position of the function at and radians, which is radians. Substitute and b into
the phase shift formula to find c.
Therefore, the equation is
Write an equation that corresponds to each graph.
31.
SOLUTION: Sample answer: There is an x-intercept at 0, so one equation that corresponds to this graph is y = a sin (bx + c) + d. Half of the distance from the maximum to the minimum value of the function is 3. So, the amplitude is 3. It appears that the function completes one period on [0, π]. Find b.
The midline appears to be at y = 0, so there does not appear to be any vertical shift. Therefore, one equation that corresponds to this graph is y = 3 sin (2x).
33.
SOLUTION: Sample answer: Because there is a y-intercept at 3, one equation that corresponds to this graph is y = a cos (bx + c)+ d. Half of the distance from the maximum to the minimum value of the function is 4 ÷ 2 or 2. So, the amplitude is 2.
It appears that the function completes one period on Find b.
The midline appears to be at y = 1, so there is a vertical shift 1 unit up. Therefore, one equation that corresponds to this graph is y = 2 cos 4x + 1.
Write an equation for a sinusoidal function with the given period and amplitude that passes through the given point.
35. period: ; amplitude: 5; point:
SOLUTION: Use the period to find b.
Sample answer: One sinusoidal function in which a = 5 and b = 2 is y = 5 cos 2x. Evaluate the function for
The function passes through . Therefore, a sinusoidal function with period π and amplitude 5 that passes
through the point is y = 5 cos 2x.
37. period: ; amplitude: ; point:
SOLUTION: Use the period to find b.
Sample answer: One sinusoidal function in which a = 1.5 and b = 4 is y = 1.5 cos 4x. Evaluate the function for
The function passes through . Therefore, a sinusoidal function with period and amplitude 1.5 that passes
through the point is y = 1.5 cos 4x.
39. MULTIPLE REPRESENTATIONS In this problem, you will investigate the change in the graph of a sinusoidal function of the form y = sin x or y = cos x when multiplied by a polynomial function. a. GRAPHICAL Use a graphing calculator to sketch the graphs of y = 2x, y = –2x, and y = 2x cos x on the same coordinate plane, on the interval [–20, 20]. b. VERBAL Describe the behavior of the graph of y = 2x cos x in relation to the graphs of y = 2x and y = –2x.
c. GRAPHICAL Use a graphing calculator to sketch the graphs of y = x2, y = –x
2, and y = x
2 sin x on the same
coordinate plane, on the interval [–20, 20].
d. VERBAL Describe the behavior of the graph of y = x2 sin x in relation to the graphs of y = x
2 and y = –x
2.
e. ANALYTICAL Make a conjecture as to the behavior of the graph of a sinusoidal function of the form y = sin x or y = cos x when multiplied by polynomial function of the form y = f (x).
SOLUTION: a.
b. The graph of y = 2x cos x oscillates between the graphs of y = 2x and y = –2x. c.
d. The graph of y = x
2 sin x oscillates between the graphs of y = x
2 and y = –x
2.
e . The graph of y = f (x) sin x or y = f (x) cos x will oscillate between the graphs of y = f (x) and y = –f (x).
REASONING Determine whether each statement is true or false . Explain your reasoning.
41. Every sine function of the form y = a sin (bx + c) + d can be written as a cosine function of the form y = a cos (bx + c) + d.
SOLUTION: True; sample answer: The graph of cosine is a horizontal translation of the sine graph. Therefore, a cosine function can be written from any sine function using the same amplitude and period by applying the necessary phase shift.
43. CHALLENGE How many zeros does y = cos 1500x have on the interval 0 ≤ x ≤ 2 ?
SOLUTION: Find the period of y = cos 1500x.
Graph y = cos 1500x on .
The graph of y = cos 1500x has two x-intercepts for one cycle, so the function has 2 zeros per cycle. Find the
number of cycles for y = cos 1500x on [0, 2 ].
So, the graph of y = cos 1500x will complete 1500 cycles on [0, 2 ]. Because there are two zeros per cycle, y =
cos 1500x will have 1500(2) or 3000 zeros on [0, 2 ].
45. Writing in Math The Power Tower ride in Sandusky, Ohio, is shown below. Along the side of each tower is a string of lights that send a continuous pulse of light up and down each tower at a constant rate. Explain why the distance d of this light from the ground over time t cannot be represented by a sinusoidal function.
SOLUTION: Sample answer: Although the pulse of light can be represented as a function with a period, it is not a sinusoidal function because the distance the pulse of light is from the ground changes at a constant rate. As a result, the graph of this function would resemble the graph below.
The given point lies on the terminal side of an angle θ in standard position. Find the values of the six
trigonometric functions of θ. 47. (8, −2)
SOLUTION: Use the values of x and y to find r.
Use x = 8, y = –2, and r = to write the six trigonometric ratios.
49. (4, 5)
SOLUTION: Use the values of x and y to find r.
Use x = 4, y = 5, and r = to write the six trigonometric ratios.
Write each degree measure in radians as a multiple of π and each radian measure in degrees.
51. −420°
SOLUTION:
To convert a degree measure to radians, multiply by
53.
SOLUTION:
To convert a radian measure to degrees, multiply by
State the number of possible real zeros and turning points of each function. Then determine all of the real zeros by factoring.
55. f (x) = x3 + 2x
2 – 8x
SOLUTION: The degree of f (x) is 3, so it will have at most three real zeros and two turning points.
So, the zeros are −4, 0, and 2.
57. f (x) = x5 + 2x
4 – 4x
3 – 8x
2
SOLUTION: The degree of f (x) is 5, so it will have at most five real zeros and four turning points.
So, the zeros are −2, 0, and 2.
Determine whether f has an inverse function. If it does, find the inverse function and state any restrictions on its domain.
59. f (x) = −x – 2
SOLUTION:
Graph f (x) = −x – 2.
The graph of f passes the horizontal line test. Therefore, f is a one-to-one function and has an inverse function. From
the graph, you can see that f has domain (– , ) and range (– , ). Now find f–1
.
Because f–1
and f are the same function, the domain and range of f are equal to the domain and range of f–1
,
respectively. Therefore, it is not necessary to restrict the domain of f–1
.
61. f (x) = (x – 3)2 – 7
SOLUTION:
Graph f (x) = (x – 3)2 – 7.
The graph of f does not pass the horizontal line test. Therefore, f is not a one-to-one function and does not have an inverse function.
63. SAT/ACT If x + y = 90° and x and y are both nonnegative angles, what is equal to ?
A 0
B
C 1
D
E Cannot be determined from the information given.
SOLUTION:
If x + y = 90º, then x = 90º – y , and can be rewritten as . Let y = 60º.
Try a second angle. Let y = 45º.
Therefore, = 1, and the correct answer is C.
65. Identify the equation represented by the graph.
A y = sin 4x
B y = sin 2x
C y = 2 sin 2x
D y = 4 sin x
SOLUTION:
From the graph, it appears that the amplitude is 2 and the period is π. Use the period to find b.
So, the sine function represented by the graph could be y = 2 sin 2x. Therefore, the correct answer is C.
eSolutions Manual - Powered by Cognero Page 5
4-4 Graphing Sine and Cosine Functions
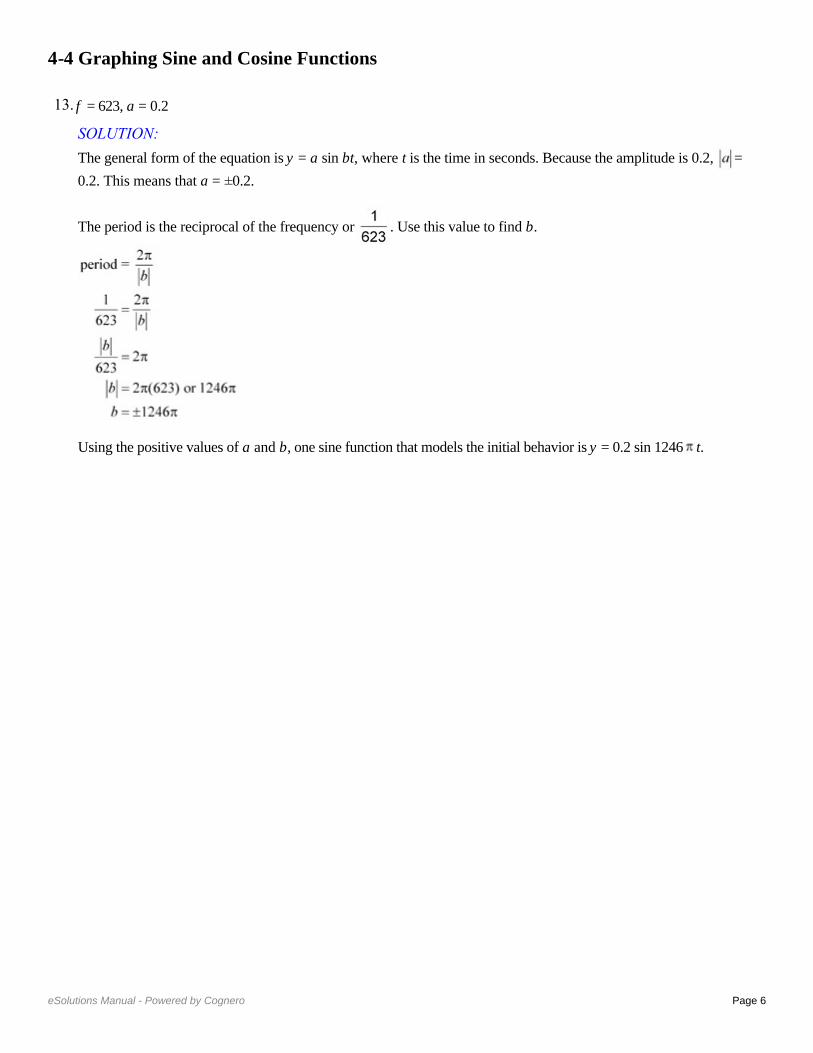
Describe how the graphs of f (x) and g (x) are related. Then find the amplitude of g (x), and sketch two periods of both functions on the same coordinate axes.
1. f (x) = sin x; g(x) = sin x
SOLUTION:
The graph of g(x) is the graph of f (x) compressed vertically. The amplitude of g(x) is or .
Create a table listing the coordinates of the x-intercepts and extrema for f (x) = sin x for one period, 2 , on the
interval [0, 2 ]. Then use the amplitude of g(x) to find corresponding points on its graph.
Sketch the curve through the indicated points for each function. Then repeat the pattern to complete a second period.
Functions x-intercept Maximum x-intercept Minimum x-intercept
f (x) = sin x (0, 0)
( , 0)
(2π, 0)
g(x) = sin x
(0, 0)
( , 0)
(2π, 0)
3. f (x) = cos x; g(x) = 6 cos x
SOLUTION:
The graph of g(x) is the graph of f (x) expanded vertically. The amplitude of g(x) is or 6.
Create a table listing the coordinates of the x-intercepts and extrema for f (x) = cos x for one period, 2 , on the
interval [0, 2 ]. Then use the amplitude of g(x) to find corresponding points on its graph.
Sketch the curve through the indicated points for each function. Then repeat the pattern to complete a second period.
Functions Maximum x-intercept Minimum x-intercept Maximum
f (x) = cos x
g(x) = 6 cos x
Describe how the graphs of f (x) and g (x) are related. Then find the period of g (x), and sketch at least oneperiod of both functions on the same coordinate axes.
5. f (x) = sin x; g(x) = sin 4x
SOLUTION:
The graph of g(x) is the graph of f (x) compressed horizontally. The period of g(x) is or . To find
corresponding points on the graph of g(x), change the x-coordinates of those key points on f (x) so that they range
from 0 to , increasing by increments of or .
Sketch the curve through the indicated points for each function. Then repeat the pattern to complete a second period.
Functions x-intercept Maximum x-intercept Minimum x-intercept
f (x) = sin x (0, 0)
(π, 0)
(2π, 0)
g(x) = sin 4x (0, 0)
7. f (x) = cos x; g(x) = cos 0.2x
SOLUTION:
The graph of g(x) is the graph of f (x) expanded horizontally. The period of g(x) is or . To find
corresponding points on the graph of g(x), change the x-coordinates of those key points on f (x) so that they range
from 0 to , increasing by increments of or .
Sketch the curve through the indicated points for each function. Then repeat the pattern to complete a second period.
Functions Maximum x-intercept Minimum x-intercept Maximum
f (x) = cos x (0, 1)
g(x) = cos x
(0, 1)
9. VOICES The contralto vocal type includes the deepest female singing voice. Some contraltos can sing as low as the E below middle C (E3), which has a frequency of 165 hertz. Write an equation for a sine function that models the initial behavior of the sound wave associated with E3 having an amplitude of 0.15.
SOLUTION:
The general form of the equation will be y = a sin bt, where t is the time in seconds. Because the amplitude is 0.15, a = 0.15. This means that a = ±0.15.
The period is the reciprocal of the frequency or . Use this value to find b.
Sample answer: One sine function that models the initial behavior is y = 0.15 sin 330 t.
Write a sine function that can be used to model the initial behavior of a sound wave with the frequency and amplitude given.
11. f = 932, a = 0.25
SOLUTION:
The general form of the equation is y = a sin bt, where t is the time in seconds. Because the amplitude is 0.25, =
0.25. This means that a = ±0.25.
The period is the reciprocal of the frequency or . Use this value to find b.
Using the positive values of a and b, one sine function that models the initial behavior is y = 0.25 sin 1864 t.
13. f = 623, a = 0.2
SOLUTION:
The general form of the equation is y = a sin bt, where t is the time in seconds. Because the amplitude is 0.2, =
0.2. This means that a = ±0.2.
The period is the reciprocal of the frequency or . Use this value to find b.
Using the positive values of a and b, one sine function that models the initial behavior is y = 0.2 sin 1246 t.
State the amplitude, period, frequency, phase shift, and vertical shift of each function. Then graph two periods of the function.
15.
SOLUTION:
In this function, a = 1, b = 1, c = , and d = 0. Because d = 0, there is no vertical shift.
Graph y = 3 cos x shifted units to the right.
17. y = sin 3x – 2
SOLUTION: In this function, a = 1, b = 3, c = 0, and d = –2.
Graph y = sin 3x shifted 2 units down.
19.
SOLUTION:
In this function, a = 1, b = 1, c = , and d = 4.
.
Graph y = sin x shifted units to the right and 4 units up.
21. TIDES The table shown below provides data for the first high and low tides of the day for a certain bay during oneday in June.
a. Determine the amplitude, period, phase shift, and vertical shift of a sinusoidal function that models the height of the tide. Let x represent the number of hours that the high or low tide occurred after midnight and y represent the height of the wave in feet. b. Write a sinusoidal function that models the data. c. According to your model, what was the height of the tide at 8:45 P.M. that night?
SOLUTION: a. Sample answer: Use a sinusoidal function of the form y = a cos (bx + c) + d to model the data. First, find the amplitude a, which is half of the distance between the heights of the high and low tides.
The vertical shift d is the average of the heights of the high and low tides.
A sinusoid completes half of a period in the time that it takes to go from its maximum to its minimum value. One
period is twice this time. The first high tide occurs at 4:25 A.M. or x = 4.417 and the first low tide occurs at 10:55
A.M. or x = 10.917.
Because the period of a sinusoidal function is you can write Therefore,
The maximum data value occurs when x ≈ 4.417. Since y = cos x attains its first maximum when x = 0, we must
apply a phase shift of 4.417 − 0 or 4.417 units. Use this value to find c.
b. Write a function using the values for a, b, c, and d. Use b =
c. To find the height of the water at 8:45 P.M. that night, evaluate the model for x = 20.75.
Therefore, the tide was about 7.28 feet high at 8:45 P.M. that night.
GRAPHING CALCULATOR Find the values of x in the interval – < x < that make each equation or inequality true. (Hint: Use the intersection function.)
23. –sin x = cos x
SOLUTION:
Graph y = −sin x and y = cos x on the same graphing calculator screen on (−π, π). Use the intersect feature under the CALC menu to determine where the two graphs intersect.
The graphs intersect at about −0.7854 or − and about 2.356 or . Therefore, on –π < x < π, –sin x = cos x
when x = − and .
25. sin x + cos x = 0
SOLUTION:
Graph y = sin x + cos x on (−π, π). Use the zero feature under the CALC menu to determine the zeros of the function.
There are zeros at about −0.785 or − or and about 2.356 or . Therefore, on – < x < , sin x + cos x = 0
when x =
27. sin x cos x > 1
SOLUTION:
Graph y = sin x cos x and y = 1 on (− , ). Use the intersect feature under the CALC menu to determine on what interval(s) sin x cos x > 1.
The graphs do not intersect. Therefore, y = sin x cos x is not greater than y = 1 for any values of x on – < x < .
29. CAROUSELS A wooden horse on a carousel moves up and down as the carousel spins. When the ride ends, the horse usually stops in a vertical position different from where it started. The position y of the horse after t seconds can be modeled by y = 1.5 sin (2t + c), where the phase shift c must be continuously adjusted to compensate for the
different starting positions. If during one ride the horse reached a maximum height after seconds, find the
equation that models the horse’s position.
SOLUTION: First, find the period of y = 1.5 sin (2t + c).
Since the period is π, the function will reach a maximum height at radians. The phase shift is the difference
between the horizontal position of the function at and radians, which is radians. Substitute and b into
the phase shift formula to find c.
Therefore, the equation is
Write an equation that corresponds to each graph.
31.
SOLUTION: Sample answer: There is an x-intercept at 0, so one equation that corresponds to this graph is y = a sin (bx + c) + d. Half of the distance from the maximum to the minimum value of the function is 3. So, the amplitude is 3. It appears that the function completes one period on [0, π]. Find b.
The midline appears to be at y = 0, so there does not appear to be any vertical shift. Therefore, one equation that corresponds to this graph is y = 3 sin (2x).
33.
SOLUTION: Sample answer: Because there is a y-intercept at 3, one equation that corresponds to this graph is y = a cos (bx + c)+ d. Half of the distance from the maximum to the minimum value of the function is 4 ÷ 2 or 2. So, the amplitude is 2.
It appears that the function completes one period on Find b.
The midline appears to be at y = 1, so there is a vertical shift 1 unit up. Therefore, one equation that corresponds to this graph is y = 2 cos 4x + 1.
Write an equation for a sinusoidal function with the given period and amplitude that passes through the given point.
35. period: ; amplitude: 5; point:
SOLUTION: Use the period to find b.
Sample answer: One sinusoidal function in which a = 5 and b = 2 is y = 5 cos 2x. Evaluate the function for
The function passes through . Therefore, a sinusoidal function with period π and amplitude 5 that passes
through the point is y = 5 cos 2x.
37. period: ; amplitude: ; point:
SOLUTION: Use the period to find b.
Sample answer: One sinusoidal function in which a = 1.5 and b = 4 is y = 1.5 cos 4x. Evaluate the function for
The function passes through . Therefore, a sinusoidal function with period and amplitude 1.5 that passes
through the point is y = 1.5 cos 4x.
39. MULTIPLE REPRESENTATIONS In this problem, you will investigate the change in the graph of a sinusoidal function of the form y = sin x or y = cos x when multiplied by a polynomial function. a. GRAPHICAL Use a graphing calculator to sketch the graphs of y = 2x, y = –2x, and y = 2x cos x on the same coordinate plane, on the interval [–20, 20]. b. VERBAL Describe the behavior of the graph of y = 2x cos x in relation to the graphs of y = 2x and y = –2x.
c. GRAPHICAL Use a graphing calculator to sketch the graphs of y = x2, y = –x
2, and y = x
2 sin x on the same
coordinate plane, on the interval [–20, 20].
d. VERBAL Describe the behavior of the graph of y = x2 sin x in relation to the graphs of y = x
2 and y = –x
2.
e. ANALYTICAL Make a conjecture as to the behavior of the graph of a sinusoidal function of the form y = sin x or y = cos x when multiplied by polynomial function of the form y = f (x).
SOLUTION: a.
b. The graph of y = 2x cos x oscillates between the graphs of y = 2x and y = –2x. c.
d. The graph of y = x
2 sin x oscillates between the graphs of y = x
2 and y = –x
2.
e . The graph of y = f (x) sin x or y = f (x) cos x will oscillate between the graphs of y = f (x) and y = –f (x).
REASONING Determine whether each statement is true or false . Explain your reasoning.
41. Every sine function of the form y = a sin (bx + c) + d can be written as a cosine function of the form y = a cos (bx + c) + d.
SOLUTION: True; sample answer: The graph of cosine is a horizontal translation of the sine graph. Therefore, a cosine function can be written from any sine function using the same amplitude and period by applying the necessary phase shift.
43. CHALLENGE How many zeros does y = cos 1500x have on the interval 0 ≤ x ≤ 2 ?
SOLUTION: Find the period of y = cos 1500x.
Graph y = cos 1500x on .
The graph of y = cos 1500x has two x-intercepts for one cycle, so the function has 2 zeros per cycle. Find the
number of cycles for y = cos 1500x on [0, 2 ].
So, the graph of y = cos 1500x will complete 1500 cycles on [0, 2 ]. Because there are two zeros per cycle, y =
cos 1500x will have 1500(2) or 3000 zeros on [0, 2 ].
45. Writing in Math The Power Tower ride in Sandusky, Ohio, is shown below. Along the side of each tower is a string of lights that send a continuous pulse of light up and down each tower at a constant rate. Explain why the distance d of this light from the ground over time t cannot be represented by a sinusoidal function.
SOLUTION: Sample answer: Although the pulse of light can be represented as a function with a period, it is not a sinusoidal function because the distance the pulse of light is from the ground changes at a constant rate. As a result, the graph of this function would resemble the graph below.
The given point lies on the terminal side of an angle θ in standard position. Find the values of the six
trigonometric functions of θ. 47. (8, −2)
SOLUTION: Use the values of x and y to find r.
Use x = 8, y = –2, and r = to write the six trigonometric ratios.
49. (4, 5)
SOLUTION: Use the values of x and y to find r.
Use x = 4, y = 5, and r = to write the six trigonometric ratios.
Write each degree measure in radians as a multiple of π and each radian measure in degrees.
51. −420°
SOLUTION:
To convert a degree measure to radians, multiply by
53.
SOLUTION:
To convert a radian measure to degrees, multiply by
State the number of possible real zeros and turning points of each function. Then determine all of the real zeros by factoring.
55. f (x) = x3 + 2x
2 – 8x
SOLUTION: The degree of f (x) is 3, so it will have at most three real zeros and two turning points.
So, the zeros are −4, 0, and 2.
57. f (x) = x5 + 2x
4 – 4x
3 – 8x
2
SOLUTION: The degree of f (x) is 5, so it will have at most five real zeros and four turning points.
So, the zeros are −2, 0, and 2.
Determine whether f has an inverse function. If it does, find the inverse function and state any restrictions on its domain.
59. f (x) = −x – 2
SOLUTION:
Graph f (x) = −x – 2.
The graph of f passes the horizontal line test. Therefore, f is a one-to-one function and has an inverse function. From
the graph, you can see that f has domain (– , ) and range (– , ). Now find f–1
.
Because f–1
and f are the same function, the domain and range of f are equal to the domain and range of f–1
,
respectively. Therefore, it is not necessary to restrict the domain of f–1
.
61. f (x) = (x – 3)2 – 7
SOLUTION:
Graph f (x) = (x – 3)2 – 7.
The graph of f does not pass the horizontal line test. Therefore, f is not a one-to-one function and does not have an inverse function.
63. SAT/ACT If x + y = 90° and x and y are both nonnegative angles, what is equal to ?
A 0
B
C 1
D
E Cannot be determined from the information given.
SOLUTION:
If x + y = 90º, then x = 90º – y , and can be rewritten as . Let y = 60º.
Try a second angle. Let y = 45º.
Therefore, = 1, and the correct answer is C.
65. Identify the equation represented by the graph.
A y = sin 4x
B y = sin 2x
C y = 2 sin 2x
D y = 4 sin x
SOLUTION:
From the graph, it appears that the amplitude is 2 and the period is π. Use the period to find b.
So, the sine function represented by the graph could be y = 2 sin 2x. Therefore, the correct answer is C.
eSolutions Manual - Powered by Cognero Page 6
4-4 Graphing Sine and Cosine Functions

Describe how the graphs of f (x) and g (x) are related. Then find the amplitude of g (x), and sketch two periods of both functions on the same coordinate axes.
1. f (x) = sin x; g(x) = sin x
SOLUTION:
The graph of g(x) is the graph of f (x) compressed vertically. The amplitude of g(x) is or .
Create a table listing the coordinates of the x-intercepts and extrema for f (x) = sin x for one period, 2 , on the
interval [0, 2 ]. Then use the amplitude of g(x) to find corresponding points on its graph.
Sketch the curve through the indicated points for each function. Then repeat the pattern to complete a second period.
Functions x-intercept Maximum x-intercept Minimum x-intercept
f (x) = sin x (0, 0)
( , 0)
(2π, 0)
g(x) = sin x
(0, 0)
( , 0)
(2π, 0)
3. f (x) = cos x; g(x) = 6 cos x
SOLUTION:
The graph of g(x) is the graph of f (x) expanded vertically. The amplitude of g(x) is or 6.
Create a table listing the coordinates of the x-intercepts and extrema for f (x) = cos x for one period, 2 , on the
interval [0, 2 ]. Then use the amplitude of g(x) to find corresponding points on its graph.
Sketch the curve through the indicated points for each function. Then repeat the pattern to complete a second period.
Functions Maximum x-intercept Minimum x-intercept Maximum
f (x) = cos x
g(x) = 6 cos x
Describe how the graphs of f (x) and g (x) are related. Then find the period of g (x), and sketch at least oneperiod of both functions on the same coordinate axes.
5. f (x) = sin x; g(x) = sin 4x
SOLUTION:
The graph of g(x) is the graph of f (x) compressed horizontally. The period of g(x) is or . To find
corresponding points on the graph of g(x), change the x-coordinates of those key points on f (x) so that they range
from 0 to , increasing by increments of or .
Sketch the curve through the indicated points for each function. Then repeat the pattern to complete a second period.
Functions x-intercept Maximum x-intercept Minimum x-intercept
f (x) = sin x (0, 0)
(π, 0)
(2π, 0)
g(x) = sin 4x (0, 0)
7. f (x) = cos x; g(x) = cos 0.2x
SOLUTION:
The graph of g(x) is the graph of f (x) expanded horizontally. The period of g(x) is or . To find
corresponding points on the graph of g(x), change the x-coordinates of those key points on f (x) so that they range
from 0 to , increasing by increments of or .
Sketch the curve through the indicated points for each function. Then repeat the pattern to complete a second period.
Functions Maximum x-intercept Minimum x-intercept Maximum
f (x) = cos x (0, 1)
g(x) = cos x
(0, 1)
9. VOICES The contralto vocal type includes the deepest female singing voice. Some contraltos can sing as low as the E below middle C (E3), which has a frequency of 165 hertz. Write an equation for a sine function that models the initial behavior of the sound wave associated with E3 having an amplitude of 0.15.
SOLUTION:
The general form of the equation will be y = a sin bt, where t is the time in seconds. Because the amplitude is 0.15, a = 0.15. This means that a = ±0.15.
The period is the reciprocal of the frequency or . Use this value to find b.
Sample answer: One sine function that models the initial behavior is y = 0.15 sin 330 t.
Write a sine function that can be used to model the initial behavior of a sound wave with the frequency and amplitude given.
11. f = 932, a = 0.25
SOLUTION:
The general form of the equation is y = a sin bt, where t is the time in seconds. Because the amplitude is 0.25, =
0.25. This means that a = ±0.25.
The period is the reciprocal of the frequency or . Use this value to find b.
Using the positive values of a and b, one sine function that models the initial behavior is y = 0.25 sin 1864 t.
13. f = 623, a = 0.2
SOLUTION:
The general form of the equation is y = a sin bt, where t is the time in seconds. Because the amplitude is 0.2, =
0.2. This means that a = ±0.2.
The period is the reciprocal of the frequency or . Use this value to find b.
Using the positive values of a and b, one sine function that models the initial behavior is y = 0.2 sin 1246 t.
State the amplitude, period, frequency, phase shift, and vertical shift of each function. Then graph two periods of the function.
15.
SOLUTION:
In this function, a = 1, b = 1, c = , and d = 0. Because d = 0, there is no vertical shift.
Graph y = 3 cos x shifted units to the right.
17. y = sin 3x – 2
SOLUTION: In this function, a = 1, b = 3, c = 0, and d = –2.
Graph y = sin 3x shifted 2 units down.
19.
SOLUTION:
In this function, a = 1, b = 1, c = , and d = 4.
.
Graph y = sin x shifted units to the right and 4 units up.
21. TIDES The table shown below provides data for the first high and low tides of the day for a certain bay during oneday in June.
a. Determine the amplitude, period, phase shift, and vertical shift of a sinusoidal function that models the height of the tide. Let x represent the number of hours that the high or low tide occurred after midnight and y represent the height of the wave in feet. b. Write a sinusoidal function that models the data. c. According to your model, what was the height of the tide at 8:45 P.M. that night?
SOLUTION: a. Sample answer: Use a sinusoidal function of the form y = a cos (bx + c) + d to model the data. First, find the amplitude a, which is half of the distance between the heights of the high and low tides.
The vertical shift d is the average of the heights of the high and low tides.
A sinusoid completes half of a period in the time that it takes to go from its maximum to its minimum value. One
period is twice this time. The first high tide occurs at 4:25 A.M. or x = 4.417 and the first low tide occurs at 10:55
A.M. or x = 10.917.
Because the period of a sinusoidal function is you can write Therefore,
The maximum data value occurs when x ≈ 4.417. Since y = cos x attains its first maximum when x = 0, we must
apply a phase shift of 4.417 − 0 or 4.417 units. Use this value to find c.
b. Write a function using the values for a, b, c, and d. Use b =
c. To find the height of the water at 8:45 P.M. that night, evaluate the model for x = 20.75.
Therefore, the tide was about 7.28 feet high at 8:45 P.M. that night.
GRAPHING CALCULATOR Find the values of x in the interval – < x < that make each equation or inequality true. (Hint: Use the intersection function.)
23. –sin x = cos x
SOLUTION:
Graph y = −sin x and y = cos x on the same graphing calculator screen on (−π, π). Use the intersect feature under the CALC menu to determine where the two graphs intersect.
The graphs intersect at about −0.7854 or − and about 2.356 or . Therefore, on –π < x < π, –sin x = cos x
when x = − and .
25. sin x + cos x = 0
SOLUTION:
Graph y = sin x + cos x on (−π, π). Use the zero feature under the CALC menu to determine the zeros of the function.
There are zeros at about −0.785 or − or and about 2.356 or . Therefore, on – < x < , sin x + cos x = 0
when x =
27. sin x cos x > 1
SOLUTION:
Graph y = sin x cos x and y = 1 on (− , ). Use the intersect feature under the CALC menu to determine on what interval(s) sin x cos x > 1.
The graphs do not intersect. Therefore, y = sin x cos x is not greater than y = 1 for any values of x on – < x < .
29. CAROUSELS A wooden horse on a carousel moves up and down as the carousel spins. When the ride ends, the horse usually stops in a vertical position different from where it started. The position y of the horse after t seconds can be modeled by y = 1.5 sin (2t + c), where the phase shift c must be continuously adjusted to compensate for the
different starting positions. If during one ride the horse reached a maximum height after seconds, find the
equation that models the horse’s position.
SOLUTION: First, find the period of y = 1.5 sin (2t + c).
Since the period is π, the function will reach a maximum height at radians. The phase shift is the difference
between the horizontal position of the function at and radians, which is radians. Substitute and b into
the phase shift formula to find c.
Therefore, the equation is
Write an equation that corresponds to each graph.
31.
SOLUTION: Sample answer: There is an x-intercept at 0, so one equation that corresponds to this graph is y = a sin (bx + c) + d. Half of the distance from the maximum to the minimum value of the function is 3. So, the amplitude is 3. It appears that the function completes one period on [0, π]. Find b.
The midline appears to be at y = 0, so there does not appear to be any vertical shift. Therefore, one equation that corresponds to this graph is y = 3 sin (2x).
33.
SOLUTION: Sample answer: Because there is a y-intercept at 3, one equation that corresponds to this graph is y = a cos (bx + c)+ d. Half of the distance from the maximum to the minimum value of the function is 4 ÷ 2 or 2. So, the amplitude is 2.
It appears that the function completes one period on Find b.
The midline appears to be at y = 1, so there is a vertical shift 1 unit up. Therefore, one equation that corresponds to this graph is y = 2 cos 4x + 1.
Write an equation for a sinusoidal function with the given period and amplitude that passes through the given point.
35. period: ; amplitude: 5; point:
SOLUTION: Use the period to find b.
Sample answer: One sinusoidal function in which a = 5 and b = 2 is y = 5 cos 2x. Evaluate the function for
The function passes through . Therefore, a sinusoidal function with period π and amplitude 5 that passes
through the point is y = 5 cos 2x.
37. period: ; amplitude: ; point:
SOLUTION: Use the period to find b.
Sample answer: One sinusoidal function in which a = 1.5 and b = 4 is y = 1.5 cos 4x. Evaluate the function for
The function passes through . Therefore, a sinusoidal function with period and amplitude 1.5 that passes
through the point is y = 1.5 cos 4x.
39. MULTIPLE REPRESENTATIONS In this problem, you will investigate the change in the graph of a sinusoidal function of the form y = sin x or y = cos x when multiplied by a polynomial function. a. GRAPHICAL Use a graphing calculator to sketch the graphs of y = 2x, y = –2x, and y = 2x cos x on the same coordinate plane, on the interval [–20, 20]. b. VERBAL Describe the behavior of the graph of y = 2x cos x in relation to the graphs of y = 2x and y = –2x.
c. GRAPHICAL Use a graphing calculator to sketch the graphs of y = x2, y = –x
2, and y = x
2 sin x on the same
coordinate plane, on the interval [–20, 20].
d. VERBAL Describe the behavior of the graph of y = x2 sin x in relation to the graphs of y = x
2 and y = –x
2.
e. ANALYTICAL Make a conjecture as to the behavior of the graph of a sinusoidal function of the form y = sin x or y = cos x when multiplied by polynomial function of the form y = f (x).
SOLUTION: a.
b. The graph of y = 2x cos x oscillates between the graphs of y = 2x and y = –2x. c.
d. The graph of y = x
2 sin x oscillates between the graphs of y = x
2 and y = –x
2.
e . The graph of y = f (x) sin x or y = f (x) cos x will oscillate between the graphs of y = f (x) and y = –f (x).
REASONING Determine whether each statement is true or false . Explain your reasoning.
41. Every sine function of the form y = a sin (bx + c) + d can be written as a cosine function of the form y = a cos (bx + c) + d.
SOLUTION: True; sample answer: The graph of cosine is a horizontal translation of the sine graph. Therefore, a cosine function can be written from any sine function using the same amplitude and period by applying the necessary phase shift.
43. CHALLENGE How many zeros does y = cos 1500x have on the interval 0 ≤ x ≤ 2 ?
SOLUTION: Find the period of y = cos 1500x.
Graph y = cos 1500x on .
The graph of y = cos 1500x has two x-intercepts for one cycle, so the function has 2 zeros per cycle. Find the
number of cycles for y = cos 1500x on [0, 2 ].
So, the graph of y = cos 1500x will complete 1500 cycles on [0, 2 ]. Because there are two zeros per cycle, y =
cos 1500x will have 1500(2) or 3000 zeros on [0, 2 ].
45. Writing in Math The Power Tower ride in Sandusky, Ohio, is shown below. Along the side of each tower is a string of lights that send a continuous pulse of light up and down each tower at a constant rate. Explain why the distance d of this light from the ground over time t cannot be represented by a sinusoidal function.
SOLUTION: Sample answer: Although the pulse of light can be represented as a function with a period, it is not a sinusoidal function because the distance the pulse of light is from the ground changes at a constant rate. As a result, the graph of this function would resemble the graph below.
The given point lies on the terminal side of an angle θ in standard position. Find the values of the six
trigonometric functions of θ. 47. (8, −2)
SOLUTION: Use the values of x and y to find r.
Use x = 8, y = –2, and r = to write the six trigonometric ratios.
49. (4, 5)
SOLUTION: Use the values of x and y to find r.
Use x = 4, y = 5, and r = to write the six trigonometric ratios.
Write each degree measure in radians as a multiple of π and each radian measure in degrees.
51. −420°
SOLUTION:
To convert a degree measure to radians, multiply by
53.
SOLUTION:
To convert a radian measure to degrees, multiply by
State the number of possible real zeros and turning points of each function. Then determine all of the real zeros by factoring.
55. f (x) = x3 + 2x
2 – 8x
SOLUTION: The degree of f (x) is 3, so it will have at most three real zeros and two turning points.
So, the zeros are −4, 0, and 2.
57. f (x) = x5 + 2x
4 – 4x
3 – 8x
2
SOLUTION: The degree of f (x) is 5, so it will have at most five real zeros and four turning points.
So, the zeros are −2, 0, and 2.
Determine whether f has an inverse function. If it does, find the inverse function and state any restrictions on its domain.
59. f (x) = −x – 2
SOLUTION:
Graph f (x) = −x – 2.
The graph of f passes the horizontal line test. Therefore, f is a one-to-one function and has an inverse function. From
the graph, you can see that f has domain (– , ) and range (– , ). Now find f–1
.
Because f–1
and f are the same function, the domain and range of f are equal to the domain and range of f–1
,
respectively. Therefore, it is not necessary to restrict the domain of f–1
.
61. f (x) = (x – 3)2 – 7
SOLUTION:
Graph f (x) = (x – 3)2 – 7.
The graph of f does not pass the horizontal line test. Therefore, f is not a one-to-one function and does not have an inverse function.
63. SAT/ACT If x + y = 90° and x and y are both nonnegative angles, what is equal to ?
A 0
B
C 1
D
E Cannot be determined from the information given.
SOLUTION:
If x + y = 90º, then x = 90º – y , and can be rewritten as . Let y = 60º.
Try a second angle. Let y = 45º.
Therefore, = 1, and the correct answer is C.
65. Identify the equation represented by the graph.
A y = sin 4x
B y = sin 2x
C y = 2 sin 2x
D y = 4 sin x
SOLUTION:
From the graph, it appears that the amplitude is 2 and the period is π. Use the period to find b.
So, the sine function represented by the graph could be y = 2 sin 2x. Therefore, the correct answer is C.
eSolutions Manual - Powered by Cognero Page 7
4-4 Graphing Sine and Cosine Functions

Describe how the graphs of f (x) and g (x) are related. Then find the amplitude of g (x), and sketch two periods of both functions on the same coordinate axes.
1. f (x) = sin x; g(x) = sin x
SOLUTION:
The graph of g(x) is the graph of f (x) compressed vertically. The amplitude of g(x) is or .
Create a table listing the coordinates of the x-intercepts and extrema for f (x) = sin x for one period, 2 , on the
interval [0, 2 ]. Then use the amplitude of g(x) to find corresponding points on its graph.
Sketch the curve through the indicated points for each function. Then repeat the pattern to complete a second period.
Functions x-intercept Maximum x-intercept Minimum x-intercept
f (x) = sin x (0, 0)
( , 0)
(2π, 0)
g(x) = sin x
(0, 0)
( , 0)
(2π, 0)
3. f (x) = cos x; g(x) = 6 cos x
SOLUTION:
The graph of g(x) is the graph of f (x) expanded vertically. The amplitude of g(x) is or 6.
Create a table listing the coordinates of the x-intercepts and extrema for f (x) = cos x for one period, 2 , on the
interval [0, 2 ]. Then use the amplitude of g(x) to find corresponding points on its graph.
Sketch the curve through the indicated points for each function. Then repeat the pattern to complete a second period.
Functions Maximum x-intercept Minimum x-intercept Maximum
f (x) = cos x
g(x) = 6 cos x
Describe how the graphs of f (x) and g (x) are related. Then find the period of g (x), and sketch at least oneperiod of both functions on the same coordinate axes.
5. f (x) = sin x; g(x) = sin 4x
SOLUTION:
The graph of g(x) is the graph of f (x) compressed horizontally. The period of g(x) is or . To find
corresponding points on the graph of g(x), change the x-coordinates of those key points on f (x) so that they range
from 0 to , increasing by increments of or .
Sketch the curve through the indicated points for each function. Then repeat the pattern to complete a second period.
Functions x-intercept Maximum x-intercept Minimum x-intercept
f (x) = sin x (0, 0)
(π, 0)
(2π, 0)
g(x) = sin 4x (0, 0)
7. f (x) = cos x; g(x) = cos 0.2x
SOLUTION:
The graph of g(x) is the graph of f (x) expanded horizontally. The period of g(x) is or . To find
corresponding points on the graph of g(x), change the x-coordinates of those key points on f (x) so that they range
from 0 to , increasing by increments of or .
Sketch the curve through the indicated points for each function. Then repeat the pattern to complete a second period.
Functions Maximum x-intercept Minimum x-intercept Maximum
f (x) = cos x (0, 1)
g(x) = cos x
(0, 1)
9. VOICES The contralto vocal type includes the deepest female singing voice. Some contraltos can sing as low as the E below middle C (E3), which has a frequency of 165 hertz. Write an equation for a sine function that models the initial behavior of the sound wave associated with E3 having an amplitude of 0.15.
SOLUTION:
The general form of the equation will be y = a sin bt, where t is the time in seconds. Because the amplitude is 0.15, a = 0.15. This means that a = ±0.15.
The period is the reciprocal of the frequency or . Use this value to find b.
Sample answer: One sine function that models the initial behavior is y = 0.15 sin 330 t.
Write a sine function that can be used to model the initial behavior of a sound wave with the frequency and amplitude given.
11. f = 932, a = 0.25
SOLUTION:
The general form of the equation is y = a sin bt, where t is the time in seconds. Because the amplitude is 0.25, =
0.25. This means that a = ±0.25.
The period is the reciprocal of the frequency or . Use this value to find b.
Using the positive values of a and b, one sine function that models the initial behavior is y = 0.25 sin 1864 t.
13. f = 623, a = 0.2
SOLUTION:
The general form of the equation is y = a sin bt, where t is the time in seconds. Because the amplitude is 0.2, =
0.2. This means that a = ±0.2.
The period is the reciprocal of the frequency or . Use this value to find b.
Using the positive values of a and b, one sine function that models the initial behavior is y = 0.2 sin 1246 t.
State the amplitude, period, frequency, phase shift, and vertical shift of each function. Then graph two periods of the function.
15.
SOLUTION:
In this function, a = 1, b = 1, c = , and d = 0. Because d = 0, there is no vertical shift.
Graph y = 3 cos x shifted units to the right.
17. y = sin 3x – 2
SOLUTION: In this function, a = 1, b = 3, c = 0, and d = –2.
Graph y = sin 3x shifted 2 units down.
19.
SOLUTION:
In this function, a = 1, b = 1, c = , and d = 4.
.
Graph y = sin x shifted units to the right and 4 units up.
21. TIDES The table shown below provides data for the first high and low tides of the day for a certain bay during oneday in June.
a. Determine the amplitude, period, phase shift, and vertical shift of a sinusoidal function that models the height of the tide. Let x represent the number of hours that the high or low tide occurred after midnight and y represent the height of the wave in feet. b. Write a sinusoidal function that models the data. c. According to your model, what was the height of the tide at 8:45 P.M. that night?
SOLUTION: a. Sample answer: Use a sinusoidal function of the form y = a cos (bx + c) + d to model the data. First, find the amplitude a, which is half of the distance between the heights of the high and low tides.
The vertical shift d is the average of the heights of the high and low tides.
A sinusoid completes half of a period in the time that it takes to go from its maximum to its minimum value. One
period is twice this time. The first high tide occurs at 4:25 A.M. or x = 4.417 and the first low tide occurs at 10:55
A.M. or x = 10.917.
Because the period of a sinusoidal function is you can write Therefore,
The maximum data value occurs when x ≈ 4.417. Since y = cos x attains its first maximum when x = 0, we must
apply a phase shift of 4.417 − 0 or 4.417 units. Use this value to find c.
b. Write a function using the values for a, b, c, and d. Use b =
c. To find the height of the water at 8:45 P.M. that night, evaluate the model for x = 20.75.
Therefore, the tide was about 7.28 feet high at 8:45 P.M. that night.
GRAPHING CALCULATOR Find the values of x in the interval – < x < that make each equation or inequality true. (Hint: Use the intersection function.)
23. –sin x = cos x
SOLUTION:
Graph y = −sin x and y = cos x on the same graphing calculator screen on (−π, π). Use the intersect feature under the CALC menu to determine where the two graphs intersect.
The graphs intersect at about −0.7854 or − and about 2.356 or . Therefore, on –π < x < π, –sin x = cos x
when x = − and .
25. sin x + cos x = 0
SOLUTION:
Graph y = sin x + cos x on (−π, π). Use the zero feature under the CALC menu to determine the zeros of the function.
There are zeros at about −0.785 or − or and about 2.356 or . Therefore, on – < x < , sin x + cos x = 0
when x =
27. sin x cos x > 1
SOLUTION:
Graph y = sin x cos x and y = 1 on (− , ). Use the intersect feature under the CALC menu to determine on what interval(s) sin x cos x > 1.
The graphs do not intersect. Therefore, y = sin x cos x is not greater than y = 1 for any values of x on – < x < .
29. CAROUSELS A wooden horse on a carousel moves up and down as the carousel spins. When the ride ends, the horse usually stops in a vertical position different from where it started. The position y of the horse after t seconds can be modeled by y = 1.5 sin (2t + c), where the phase shift c must be continuously adjusted to compensate for the
different starting positions. If during one ride the horse reached a maximum height after seconds, find the
equation that models the horse’s position.
SOLUTION: First, find the period of y = 1.5 sin (2t + c).
Since the period is π, the function will reach a maximum height at radians. The phase shift is the difference
between the horizontal position of the function at and radians, which is radians. Substitute and b into
the phase shift formula to find c.
Therefore, the equation is
Write an equation that corresponds to each graph.
31.
SOLUTION: Sample answer: There is an x-intercept at 0, so one equation that corresponds to this graph is y = a sin (bx + c) + d. Half of the distance from the maximum to the minimum value of the function is 3. So, the amplitude is 3. It appears that the function completes one period on [0, π]. Find b.
The midline appears to be at y = 0, so there does not appear to be any vertical shift. Therefore, one equation that corresponds to this graph is y = 3 sin (2x).
33.
SOLUTION: Sample answer: Because there is a y-intercept at 3, one equation that corresponds to this graph is y = a cos (bx + c)+ d. Half of the distance from the maximum to the minimum value of the function is 4 ÷ 2 or 2. So, the amplitude is 2.
It appears that the function completes one period on Find b.
The midline appears to be at y = 1, so there is a vertical shift 1 unit up. Therefore, one equation that corresponds to this graph is y = 2 cos 4x + 1.
Write an equation for a sinusoidal function with the given period and amplitude that passes through the given point.
35. period: ; amplitude: 5; point:
SOLUTION: Use the period to find b.
Sample answer: One sinusoidal function in which a = 5 and b = 2 is y = 5 cos 2x. Evaluate the function for
The function passes through . Therefore, a sinusoidal function with period π and amplitude 5 that passes
through the point is y = 5 cos 2x.
37. period: ; amplitude: ; point:
SOLUTION: Use the period to find b.
Sample answer: One sinusoidal function in which a = 1.5 and b = 4 is y = 1.5 cos 4x. Evaluate the function for
The function passes through . Therefore, a sinusoidal function with period and amplitude 1.5 that passes
through the point is y = 1.5 cos 4x.
39. MULTIPLE REPRESENTATIONS In this problem, you will investigate the change in the graph of a sinusoidal function of the form y = sin x or y = cos x when multiplied by a polynomial function. a. GRAPHICAL Use a graphing calculator to sketch the graphs of y = 2x, y = –2x, and y = 2x cos x on the same coordinate plane, on the interval [–20, 20]. b. VERBAL Describe the behavior of the graph of y = 2x cos x in relation to the graphs of y = 2x and y = –2x.
c. GRAPHICAL Use a graphing calculator to sketch the graphs of y = x2, y = –x
2, and y = x
2 sin x on the same
coordinate plane, on the interval [–20, 20].
d. VERBAL Describe the behavior of the graph of y = x2 sin x in relation to the graphs of y = x
2 and y = –x
2.
e. ANALYTICAL Make a conjecture as to the behavior of the graph of a sinusoidal function of the form y = sin x or y = cos x when multiplied by polynomial function of the form y = f (x).
SOLUTION: a.
b. The graph of y = 2x cos x oscillates between the graphs of y = 2x and y = –2x. c.
d. The graph of y = x
2 sin x oscillates between the graphs of y = x
2 and y = –x
2.
e . The graph of y = f (x) sin x or y = f (x) cos x will oscillate between the graphs of y = f (x) and y = –f (x).
REASONING Determine whether each statement is true or false . Explain your reasoning.
41. Every sine function of the form y = a sin (bx + c) + d can be written as a cosine function of the form y = a cos (bx + c) + d.
SOLUTION: True; sample answer: The graph of cosine is a horizontal translation of the sine graph. Therefore, a cosine function can be written from any sine function using the same amplitude and period by applying the necessary phase shift.
43. CHALLENGE How many zeros does y = cos 1500x have on the interval 0 ≤ x ≤ 2 ?
SOLUTION: Find the period of y = cos 1500x.
Graph y = cos 1500x on .
The graph of y = cos 1500x has two x-intercepts for one cycle, so the function has 2 zeros per cycle. Find the
number of cycles for y = cos 1500x on [0, 2 ].
So, the graph of y = cos 1500x will complete 1500 cycles on [0, 2 ]. Because there are two zeros per cycle, y =
cos 1500x will have 1500(2) or 3000 zeros on [0, 2 ].
45. Writing in Math The Power Tower ride in Sandusky, Ohio, is shown below. Along the side of each tower is a string of lights that send a continuous pulse of light up and down each tower at a constant rate. Explain why the distance d of this light from the ground over time t cannot be represented by a sinusoidal function.
SOLUTION: Sample answer: Although the pulse of light can be represented as a function with a period, it is not a sinusoidal function because the distance the pulse of light is from the ground changes at a constant rate. As a result, the graph of this function would resemble the graph below.
The given point lies on the terminal side of an angle θ in standard position. Find the values of the six
trigonometric functions of θ. 47. (8, −2)
SOLUTION: Use the values of x and y to find r.
Use x = 8, y = –2, and r = to write the six trigonometric ratios.
49. (4, 5)
SOLUTION: Use the values of x and y to find r.
Use x = 4, y = 5, and r = to write the six trigonometric ratios.
Write each degree measure in radians as a multiple of π and each radian measure in degrees.
51. −420°
SOLUTION:
To convert a degree measure to radians, multiply by
53.
SOLUTION:
To convert a radian measure to degrees, multiply by
State the number of possible real zeros and turning points of each function. Then determine all of the real zeros by factoring.
55. f (x) = x3 + 2x
2 – 8x
SOLUTION: The degree of f (x) is 3, so it will have at most three real zeros and two turning points.
So, the zeros are −4, 0, and 2.
57. f (x) = x5 + 2x
4 – 4x
3 – 8x
2
SOLUTION: The degree of f (x) is 5, so it will have at most five real zeros and four turning points.
So, the zeros are −2, 0, and 2.
Determine whether f has an inverse function. If it does, find the inverse function and state any restrictions on its domain.
59. f (x) = −x – 2
SOLUTION:
Graph f (x) = −x – 2.
The graph of f passes the horizontal line test. Therefore, f is a one-to-one function and has an inverse function. From
the graph, you can see that f has domain (– , ) and range (– , ). Now find f–1
.
Because f–1
and f are the same function, the domain and range of f are equal to the domain and range of f–1
,
respectively. Therefore, it is not necessary to restrict the domain of f–1
.
61. f (x) = (x – 3)2 – 7
SOLUTION:
Graph f (x) = (x – 3)2 – 7.
The graph of f does not pass the horizontal line test. Therefore, f is not a one-to-one function and does not have an inverse function.
63. SAT/ACT If x + y = 90° and x and y are both nonnegative angles, what is equal to ?
A 0
B
C 1
D
E Cannot be determined from the information given.
SOLUTION:
If x + y = 90º, then x = 90º – y , and can be rewritten as . Let y = 60º.
Try a second angle. Let y = 45º.
Therefore, = 1, and the correct answer is C.
65. Identify the equation represented by the graph.
A y = sin 4x
B y = sin 2x
C y = 2 sin 2x
D y = 4 sin x
SOLUTION:
From the graph, it appears that the amplitude is 2 and the period is π. Use the period to find b.
So, the sine function represented by the graph could be y = 2 sin 2x. Therefore, the correct answer is C.
eSolutions Manual - Powered by Cognero Page 8
4-4 Graphing Sine and Cosine Functions
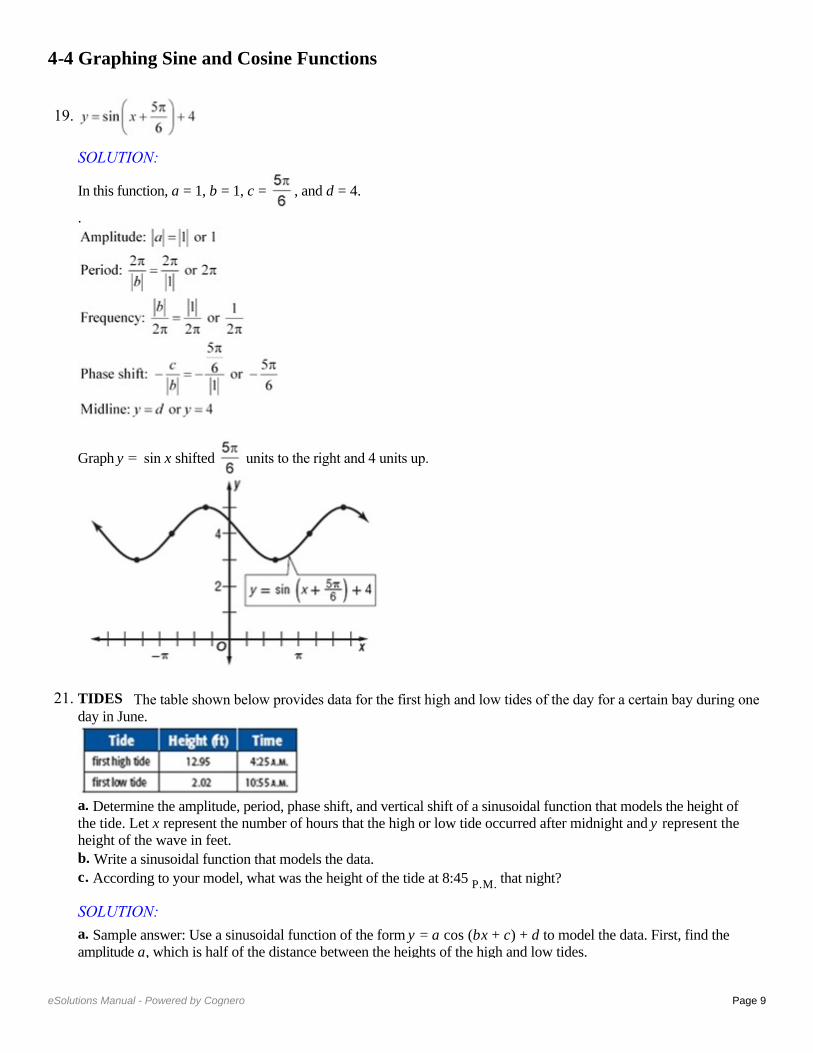
Describe how the graphs of f (x) and g (x) are related. Then find the amplitude of g (x), and sketch two periods of both functions on the same coordinate axes.
1. f (x) = sin x; g(x) = sin x
SOLUTION:
The graph of g(x) is the graph of f (x) compressed vertically. The amplitude of g(x) is or .
Create a table listing the coordinates of the x-intercepts and extrema for f (x) = sin x for one period, 2 , on the
interval [0, 2 ]. Then use the amplitude of g(x) to find corresponding points on its graph.
Sketch the curve through the indicated points for each function. Then repeat the pattern to complete a second period.
Functions x-intercept Maximum x-intercept Minimum x-intercept
f (x) = sin x (0, 0)
( , 0)
(2π, 0)
g(x) = sin x
(0, 0)
( , 0)
(2π, 0)
3. f (x) = cos x; g(x) = 6 cos x
SOLUTION:
The graph of g(x) is the graph of f (x) expanded vertically. The amplitude of g(x) is or 6.
Create a table listing the coordinates of the x-intercepts and extrema for f (x) = cos x for one period, 2 , on the
interval [0, 2 ]. Then use the amplitude of g(x) to find corresponding points on its graph.
Sketch the curve through the indicated points for each function. Then repeat the pattern to complete a second period.
Functions Maximum x-intercept Minimum x-intercept Maximum
f (x) = cos x
g(x) = 6 cos x
Describe how the graphs of f (x) and g (x) are related. Then find the period of g (x), and sketch at least oneperiod of both functions on the same coordinate axes.
5. f (x) = sin x; g(x) = sin 4x
SOLUTION:
The graph of g(x) is the graph of f (x) compressed horizontally. The period of g(x) is or . To find
corresponding points on the graph of g(x), change the x-coordinates of those key points on f (x) so that they range
from 0 to , increasing by increments of or .
Sketch the curve through the indicated points for each function. Then repeat the pattern to complete a second period.
Functions x-intercept Maximum x-intercept Minimum x-intercept
f (x) = sin x (0, 0)
(π, 0)
(2π, 0)
g(x) = sin 4x (0, 0)
7. f (x) = cos x; g(x) = cos 0.2x
SOLUTION:
The graph of g(x) is the graph of f (x) expanded horizontally. The period of g(x) is or . To find
corresponding points on the graph of g(x), change the x-coordinates of those key points on f (x) so that they range
from 0 to , increasing by increments of or .
Sketch the curve through the indicated points for each function. Then repeat the pattern to complete a second period.
Functions Maximum x-intercept Minimum x-intercept Maximum
f (x) = cos x (0, 1)
g(x) = cos x
(0, 1)
9. VOICES The contralto vocal type includes the deepest female singing voice. Some contraltos can sing as low as the E below middle C (E3), which has a frequency of 165 hertz. Write an equation for a sine function that models the initial behavior of the sound wave associated with E3 having an amplitude of 0.15.
SOLUTION:
The general form of the equation will be y = a sin bt, where t is the time in seconds. Because the amplitude is 0.15, a = 0.15. This means that a = ±0.15.
The period is the reciprocal of the frequency or . Use this value to find b.
Sample answer: One sine function that models the initial behavior is y = 0.15 sin 330 t.
Write a sine function that can be used to model the initial behavior of a sound wave with the frequency and amplitude given.
11. f = 932, a = 0.25
SOLUTION:
The general form of the equation is y = a sin bt, where t is the time in seconds. Because the amplitude is 0.25, =
0.25. This means that a = ±0.25.
The period is the reciprocal of the frequency or . Use this value to find b.
Using the positive values of a and b, one sine function that models the initial behavior is y = 0.25 sin 1864 t.
13. f = 623, a = 0.2
SOLUTION:
The general form of the equation is y = a sin bt, where t is the time in seconds. Because the amplitude is 0.2, =
0.2. This means that a = ±0.2.
The period is the reciprocal of the frequency or . Use this value to find b.
Using the positive values of a and b, one sine function that models the initial behavior is y = 0.2 sin 1246 t.
State the amplitude, period, frequency, phase shift, and vertical shift of each function. Then graph two periods of the function.
15.
SOLUTION:
In this function, a = 1, b = 1, c = , and d = 0. Because d = 0, there is no vertical shift.
Graph y = 3 cos x shifted units to the right.
17. y = sin 3x – 2
SOLUTION: In this function, a = 1, b = 3, c = 0, and d = –2.
Graph y = sin 3x shifted 2 units down.
19.
SOLUTION:
In this function, a = 1, b = 1, c = , and d = 4.
.
Graph y = sin x shifted units to the right and 4 units up.
21. TIDES The table shown below provides data for the first high and low tides of the day for a certain bay during oneday in June.
a. Determine the amplitude, period, phase shift, and vertical shift of a sinusoidal function that models the height of the tide. Let x represent the number of hours that the high or low tide occurred after midnight and y represent the height of the wave in feet. b. Write a sinusoidal function that models the data. c. According to your model, what was the height of the tide at 8:45 P.M. that night?
SOLUTION: a. Sample answer: Use a sinusoidal function of the form y = a cos (bx + c) + d to model the data. First, find the amplitude a, which is half of the distance between the heights of the high and low tides.
The vertical shift d is the average of the heights of the high and low tides.
A sinusoid completes half of a period in the time that it takes to go from its maximum to its minimum value. One
period is twice this time. The first high tide occurs at 4:25 A.M. or x = 4.417 and the first low tide occurs at 10:55
A.M. or x = 10.917.
Because the period of a sinusoidal function is you can write Therefore,
The maximum data value occurs when x ≈ 4.417. Since y = cos x attains its first maximum when x = 0, we must
apply a phase shift of 4.417 − 0 or 4.417 units. Use this value to find c.
b. Write a function using the values for a, b, c, and d. Use b =
c. To find the height of the water at 8:45 P.M. that night, evaluate the model for x = 20.75.
Therefore, the tide was about 7.28 feet high at 8:45 P.M. that night.
GRAPHING CALCULATOR Find the values of x in the interval – < x < that make each equation or inequality true. (Hint: Use the intersection function.)
23. –sin x = cos x
SOLUTION:
Graph y = −sin x and y = cos x on the same graphing calculator screen on (−π, π). Use the intersect feature under the CALC menu to determine where the two graphs intersect.
The graphs intersect at about −0.7854 or − and about 2.356 or . Therefore, on –π < x < π, –sin x = cos x
when x = − and .
25. sin x + cos x = 0
SOLUTION:
Graph y = sin x + cos x on (−π, π). Use the zero feature under the CALC menu to determine the zeros of the function.
There are zeros at about −0.785 or − or and about 2.356 or . Therefore, on – < x < , sin x + cos x = 0
when x =
27. sin x cos x > 1
SOLUTION:
Graph y = sin x cos x and y = 1 on (− , ). Use the intersect feature under the CALC menu to determine on what interval(s) sin x cos x > 1.
The graphs do not intersect. Therefore, y = sin x cos x is not greater than y = 1 for any values of x on – < x < .
29. CAROUSELS A wooden horse on a carousel moves up and down as the carousel spins. When the ride ends, the horse usually stops in a vertical position different from where it started. The position y of the horse after t seconds can be modeled by y = 1.5 sin (2t + c), where the phase shift c must be continuously adjusted to compensate for the
different starting positions. If during one ride the horse reached a maximum height after seconds, find the
equation that models the horse’s position.
SOLUTION: First, find the period of y = 1.5 sin (2t + c).
Since the period is π, the function will reach a maximum height at radians. The phase shift is the difference
between the horizontal position of the function at and radians, which is radians. Substitute and b into
the phase shift formula to find c.
Therefore, the equation is
Write an equation that corresponds to each graph.
31.
SOLUTION: Sample answer: There is an x-intercept at 0, so one equation that corresponds to this graph is y = a sin (bx + c) + d. Half of the distance from the maximum to the minimum value of the function is 3. So, the amplitude is 3. It appears that the function completes one period on [0, π]. Find b.
The midline appears to be at y = 0, so there does not appear to be any vertical shift. Therefore, one equation that corresponds to this graph is y = 3 sin (2x).
33.
SOLUTION: Sample answer: Because there is a y-intercept at 3, one equation that corresponds to this graph is y = a cos (bx + c)+ d. Half of the distance from the maximum to the minimum value of the function is 4 ÷ 2 or 2. So, the amplitude is 2.
It appears that the function completes one period on Find b.
The midline appears to be at y = 1, so there is a vertical shift 1 unit up. Therefore, one equation that corresponds to this graph is y = 2 cos 4x + 1.
Write an equation for a sinusoidal function with the given period and amplitude that passes through the given point.
35. period: ; amplitude: 5; point:
SOLUTION: Use the period to find b.
Sample answer: One sinusoidal function in which a = 5 and b = 2 is y = 5 cos 2x. Evaluate the function for
The function passes through . Therefore, a sinusoidal function with period π and amplitude 5 that passes
through the point is y = 5 cos 2x.
37. period: ; amplitude: ; point:
SOLUTION: Use the period to find b.
Sample answer: One sinusoidal function in which a = 1.5 and b = 4 is y = 1.5 cos 4x. Evaluate the function for
The function passes through . Therefore, a sinusoidal function with period and amplitude 1.5 that passes
through the point is y = 1.5 cos 4x.
39. MULTIPLE REPRESENTATIONS In this problem, you will investigate the change in the graph of a sinusoidal function of the form y = sin x or y = cos x when multiplied by a polynomial function. a. GRAPHICAL Use a graphing calculator to sketch the graphs of y = 2x, y = –2x, and y = 2x cos x on the same coordinate plane, on the interval [–20, 20]. b. VERBAL Describe the behavior of the graph of y = 2x cos x in relation to the graphs of y = 2x and y = –2x.
c. GRAPHICAL Use a graphing calculator to sketch the graphs of y = x2, y = –x
2, and y = x
2 sin x on the same
coordinate plane, on the interval [–20, 20].
d. VERBAL Describe the behavior of the graph of y = x2 sin x in relation to the graphs of y = x
2 and y = –x
2.
e. ANALYTICAL Make a conjecture as to the behavior of the graph of a sinusoidal function of the form y = sin x or y = cos x when multiplied by polynomial function of the form y = f (x).
SOLUTION: a.
b. The graph of y = 2x cos x oscillates between the graphs of y = 2x and y = –2x. c.
d. The graph of y = x
2 sin x oscillates between the graphs of y = x
2 and y = –x
2.
e . The graph of y = f (x) sin x or y = f (x) cos x will oscillate between the graphs of y = f (x) and y = –f (x).
REASONING Determine whether each statement is true or false . Explain your reasoning.
41. Every sine function of the form y = a sin (bx + c) + d can be written as a cosine function of the form y = a cos (bx + c) + d.
SOLUTION: True; sample answer: The graph of cosine is a horizontal translation of the sine graph. Therefore, a cosine function can be written from any sine function using the same amplitude and period by applying the necessary phase shift.
43. CHALLENGE How many zeros does y = cos 1500x have on the interval 0 ≤ x ≤ 2 ?
SOLUTION: Find the period of y = cos 1500x.
Graph y = cos 1500x on .
The graph of y = cos 1500x has two x-intercepts for one cycle, so the function has 2 zeros per cycle. Find the
number of cycles for y = cos 1500x on [0, 2 ].
So, the graph of y = cos 1500x will complete 1500 cycles on [0, 2 ]. Because there are two zeros per cycle, y =
cos 1500x will have 1500(2) or 3000 zeros on [0, 2 ].
45. Writing in Math The Power Tower ride in Sandusky, Ohio, is shown below. Along the side of each tower is a string of lights that send a continuous pulse of light up and down each tower at a constant rate. Explain why the distance d of this light from the ground over time t cannot be represented by a sinusoidal function.
SOLUTION: Sample answer: Although the pulse of light can be represented as a function with a period, it is not a sinusoidal function because the distance the pulse of light is from the ground changes at a constant rate. As a result, the graph of this function would resemble the graph below.
The given point lies on the terminal side of an angle θ in standard position. Find the values of the six
trigonometric functions of θ. 47. (8, −2)
SOLUTION: Use the values of x and y to find r.
Use x = 8, y = –2, and r = to write the six trigonometric ratios.
49. (4, 5)
SOLUTION: Use the values of x and y to find r.
Use x = 4, y = 5, and r = to write the six trigonometric ratios.
Write each degree measure in radians as a multiple of π and each radian measure in degrees.
51. −420°
SOLUTION:
To convert a degree measure to radians, multiply by
53.
SOLUTION:
To convert a radian measure to degrees, multiply by
State the number of possible real zeros and turning points of each function. Then determine all of the real zeros by factoring.
55. f (x) = x3 + 2x
2 – 8x
SOLUTION: The degree of f (x) is 3, so it will have at most three real zeros and two turning points.
So, the zeros are −4, 0, and 2.
57. f (x) = x5 + 2x
4 – 4x
3 – 8x
2
SOLUTION: The degree of f (x) is 5, so it will have at most five real zeros and four turning points.
So, the zeros are −2, 0, and 2.
Determine whether f has an inverse function. If it does, find the inverse function and state any restrictions on its domain.
59. f (x) = −x – 2
SOLUTION:
Graph f (x) = −x – 2.
The graph of f passes the horizontal line test. Therefore, f is a one-to-one function and has an inverse function. From
the graph, you can see that f has domain (– , ) and range (– , ). Now find f–1
.
Because f–1
and f are the same function, the domain and range of f are equal to the domain and range of f–1
,
respectively. Therefore, it is not necessary to restrict the domain of f–1
.
61. f (x) = (x – 3)2 – 7
SOLUTION:
Graph f (x) = (x – 3)2 – 7.
The graph of f does not pass the horizontal line test. Therefore, f is not a one-to-one function and does not have an inverse function.
63. SAT/ACT If x + y = 90° and x and y are both nonnegative angles, what is equal to ?
A 0
B
C 1
D
E Cannot be determined from the information given.
SOLUTION:
If x + y = 90º, then x = 90º – y , and can be rewritten as . Let y = 60º.
Try a second angle. Let y = 45º.
Therefore, = 1, and the correct answer is C.
65. Identify the equation represented by the graph.
A y = sin 4x
B y = sin 2x
C y = 2 sin 2x
D y = 4 sin x
SOLUTION:
From the graph, it appears that the amplitude is 2 and the period is π. Use the period to find b.
So, the sine function represented by the graph could be y = 2 sin 2x. Therefore, the correct answer is C.
eSolutions Manual - Powered by Cognero Page 9
4-4 Graphing Sine and Cosine Functions

Describe how the graphs of f (x) and g (x) are related. Then find the amplitude of g (x), and sketch two periods of both functions on the same coordinate axes.
1. f (x) = sin x; g(x) = sin x
SOLUTION:
The graph of g(x) is the graph of f (x) compressed vertically. The amplitude of g(x) is or .
Create a table listing the coordinates of the x-intercepts and extrema for f (x) = sin x for one period, 2 , on the
interval [0, 2 ]. Then use the amplitude of g(x) to find corresponding points on its graph.
Sketch the curve through the indicated points for each function. Then repeat the pattern to complete a second period.
Functions x-intercept Maximum x-intercept Minimum x-intercept
f (x) = sin x (0, 0)
( , 0)
(2π, 0)
g(x) = sin x
(0, 0)
( , 0)
(2π, 0)
3. f (x) = cos x; g(x) = 6 cos x
SOLUTION:
The graph of g(x) is the graph of f (x) expanded vertically. The amplitude of g(x) is or 6.
Create a table listing the coordinates of the x-intercepts and extrema for f (x) = cos x for one period, 2 , on the
interval [0, 2 ]. Then use the amplitude of g(x) to find corresponding points on its graph.
Sketch the curve through the indicated points for each function. Then repeat the pattern to complete a second period.
Functions Maximum x-intercept Minimum x-intercept Maximum
f (x) = cos x
g(x) = 6 cos x
Describe how the graphs of f (x) and g (x) are related. Then find the period of g (x), and sketch at least oneperiod of both functions on the same coordinate axes.
5. f (x) = sin x; g(x) = sin 4x
SOLUTION:
The graph of g(x) is the graph of f (x) compressed horizontally. The period of g(x) is or . To find
corresponding points on the graph of g(x), change the x-coordinates of those key points on f (x) so that they range
from 0 to , increasing by increments of or .
Sketch the curve through the indicated points for each function. Then repeat the pattern to complete a second period.
Functions x-intercept Maximum x-intercept Minimum x-intercept
f (x) = sin x (0, 0)
(π, 0)
(2π, 0)
g(x) = sin 4x (0, 0)
7. f (x) = cos x; g(x) = cos 0.2x
SOLUTION:
The graph of g(x) is the graph of f (x) expanded horizontally. The period of g(x) is or . To find
corresponding points on the graph of g(x), change the x-coordinates of those key points on f (x) so that they range
from 0 to , increasing by increments of or .
Sketch the curve through the indicated points for each function. Then repeat the pattern to complete a second period.
Functions Maximum x-intercept Minimum x-intercept Maximum
f (x) = cos x (0, 1)
g(x) = cos x
(0, 1)
9. VOICES The contralto vocal type includes the deepest female singing voice. Some contraltos can sing as low as the E below middle C (E3), which has a frequency of 165 hertz. Write an equation for a sine function that models the initial behavior of the sound wave associated with E3 having an amplitude of 0.15.
SOLUTION:
The general form of the equation will be y = a sin bt, where t is the time in seconds. Because the amplitude is 0.15, a = 0.15. This means that a = ±0.15.
The period is the reciprocal of the frequency or . Use this value to find b.
Sample answer: One sine function that models the initial behavior is y = 0.15 sin 330 t.
Write a sine function that can be used to model the initial behavior of a sound wave with the frequency and amplitude given.
11. f = 932, a = 0.25
SOLUTION:
The general form of the equation is y = a sin bt, where t is the time in seconds. Because the amplitude is 0.25, =
0.25. This means that a = ±0.25.
The period is the reciprocal of the frequency or . Use this value to find b.
Using the positive values of a and b, one sine function that models the initial behavior is y = 0.25 sin 1864 t.
13. f = 623, a = 0.2
SOLUTION:
The general form of the equation is y = a sin bt, where t is the time in seconds. Because the amplitude is 0.2, =
0.2. This means that a = ±0.2.
The period is the reciprocal of the frequency or . Use this value to find b.
Using the positive values of a and b, one sine function that models the initial behavior is y = 0.2 sin 1246 t.
State the amplitude, period, frequency, phase shift, and vertical shift of each function. Then graph two periods of the function.
15.
SOLUTION:
In this function, a = 1, b = 1, c = , and d = 0. Because d = 0, there is no vertical shift.
Graph y = 3 cos x shifted units to the right.
17. y = sin 3x – 2
SOLUTION: In this function, a = 1, b = 3, c = 0, and d = –2.
Graph y = sin 3x shifted 2 units down.
19.
SOLUTION:
In this function, a = 1, b = 1, c = , and d = 4.
.
Graph y = sin x shifted units to the right and 4 units up.
21. TIDES The table shown below provides data for the first high and low tides of the day for a certain bay during oneday in June.
a. Determine the amplitude, period, phase shift, and vertical shift of a sinusoidal function that models the height of the tide. Let x represent the number of hours that the high or low tide occurred after midnight and y represent the height of the wave in feet. b. Write a sinusoidal function that models the data. c. According to your model, what was the height of the tide at 8:45 P.M. that night?
SOLUTION: a. Sample answer: Use a sinusoidal function of the form y = a cos (bx + c) + d to model the data. First, find the amplitude a, which is half of the distance between the heights of the high and low tides.
The vertical shift d is the average of the heights of the high and low tides.
A sinusoid completes half of a period in the time that it takes to go from its maximum to its minimum value. One
period is twice this time. The first high tide occurs at 4:25 A.M. or x = 4.417 and the first low tide occurs at 10:55
A.M. or x = 10.917.
Because the period of a sinusoidal function is you can write Therefore,
The maximum data value occurs when x ≈ 4.417. Since y = cos x attains its first maximum when x = 0, we must
apply a phase shift of 4.417 − 0 or 4.417 units. Use this value to find c.
b. Write a function using the values for a, b, c, and d. Use b =
c. To find the height of the water at 8:45 P.M. that night, evaluate the model for x = 20.75.
Therefore, the tide was about 7.28 feet high at 8:45 P.M. that night.
GRAPHING CALCULATOR Find the values of x in the interval – < x < that make each equation or inequality true. (Hint: Use the intersection function.)
23. –sin x = cos x
SOLUTION:
Graph y = −sin x and y = cos x on the same graphing calculator screen on (−π, π). Use the intersect feature under the CALC menu to determine where the two graphs intersect.
The graphs intersect at about −0.7854 or − and about 2.356 or . Therefore, on –π < x < π, –sin x = cos x
when x = − and .
25. sin x + cos x = 0
SOLUTION:
Graph y = sin x + cos x on (−π, π). Use the zero feature under the CALC menu to determine the zeros of the function.
There are zeros at about −0.785 or − or and about 2.356 or . Therefore, on – < x < , sin x + cos x = 0
when x =
27. sin x cos x > 1
SOLUTION:
Graph y = sin x cos x and y = 1 on (− , ). Use the intersect feature under the CALC menu to determine on what interval(s) sin x cos x > 1.
The graphs do not intersect. Therefore, y = sin x cos x is not greater than y = 1 for any values of x on – < x < .
29. CAROUSELS A wooden horse on a carousel moves up and down as the carousel spins. When the ride ends, the horse usually stops in a vertical position different from where it started. The position y of the horse after t seconds can be modeled by y = 1.5 sin (2t + c), where the phase shift c must be continuously adjusted to compensate for the
different starting positions. If during one ride the horse reached a maximum height after seconds, find the
equation that models the horse’s position.
SOLUTION: First, find the period of y = 1.5 sin (2t + c).
Since the period is π, the function will reach a maximum height at radians. The phase shift is the difference
between the horizontal position of the function at and radians, which is radians. Substitute and b into
the phase shift formula to find c.
Therefore, the equation is
Write an equation that corresponds to each graph.
31.
SOLUTION: Sample answer: There is an x-intercept at 0, so one equation that corresponds to this graph is y = a sin (bx + c) + d. Half of the distance from the maximum to the minimum value of the function is 3. So, the amplitude is 3. It appears that the function completes one period on [0, π]. Find b.
The midline appears to be at y = 0, so there does not appear to be any vertical shift. Therefore, one equation that corresponds to this graph is y = 3 sin (2x).
33.
SOLUTION: Sample answer: Because there is a y-intercept at 3, one equation that corresponds to this graph is y = a cos (bx + c)+ d. Half of the distance from the maximum to the minimum value of the function is 4 ÷ 2 or 2. So, the amplitude is 2.
It appears that the function completes one period on Find b.
The midline appears to be at y = 1, so there is a vertical shift 1 unit up. Therefore, one equation that corresponds to this graph is y = 2 cos 4x + 1.
Write an equation for a sinusoidal function with the given period and amplitude that passes through the given point.
35. period: ; amplitude: 5; point:
SOLUTION: Use the period to find b.
Sample answer: One sinusoidal function in which a = 5 and b = 2 is y = 5 cos 2x. Evaluate the function for
The function passes through . Therefore, a sinusoidal function with period π and amplitude 5 that passes
through the point is y = 5 cos 2x.
37. period: ; amplitude: ; point:
SOLUTION: Use the period to find b.
Sample answer: One sinusoidal function in which a = 1.5 and b = 4 is y = 1.5 cos 4x. Evaluate the function for
The function passes through . Therefore, a sinusoidal function with period and amplitude 1.5 that passes
through the point is y = 1.5 cos 4x.
39. MULTIPLE REPRESENTATIONS In this problem, you will investigate the change in the graph of a sinusoidal function of the form y = sin x or y = cos x when multiplied by a polynomial function. a. GRAPHICAL Use a graphing calculator to sketch the graphs of y = 2x, y = –2x, and y = 2x cos x on the same coordinate plane, on the interval [–20, 20]. b. VERBAL Describe the behavior of the graph of y = 2x cos x in relation to the graphs of y = 2x and y = –2x.
c. GRAPHICAL Use a graphing calculator to sketch the graphs of y = x2, y = –x
2, and y = x
2 sin x on the same
coordinate plane, on the interval [–20, 20].
d. VERBAL Describe the behavior of the graph of y = x2 sin x in relation to the graphs of y = x
2 and y = –x
2.
e. ANALYTICAL Make a conjecture as to the behavior of the graph of a sinusoidal function of the form y = sin x or y = cos x when multiplied by polynomial function of the form y = f (x).
SOLUTION: a.
b. The graph of y = 2x cos x oscillates between the graphs of y = 2x and y = –2x. c.
d. The graph of y = x
2 sin x oscillates between the graphs of y = x
2 and y = –x
2.
e . The graph of y = f (x) sin x or y = f (x) cos x will oscillate between the graphs of y = f (x) and y = –f (x).
REASONING Determine whether each statement is true or false . Explain your reasoning.
41. Every sine function of the form y = a sin (bx + c) + d can be written as a cosine function of the form y = a cos (bx + c) + d.
SOLUTION: True; sample answer: The graph of cosine is a horizontal translation of the sine graph. Therefore, a cosine function can be written from any sine function using the same amplitude and period by applying the necessary phase shift.
43. CHALLENGE How many zeros does y = cos 1500x have on the interval 0 ≤ x ≤ 2 ?
SOLUTION: Find the period of y = cos 1500x.
Graph y = cos 1500x on .
The graph of y = cos 1500x has two x-intercepts for one cycle, so the function has 2 zeros per cycle. Find the
number of cycles for y = cos 1500x on [0, 2 ].
So, the graph of y = cos 1500x will complete 1500 cycles on [0, 2 ]. Because there are two zeros per cycle, y =
cos 1500x will have 1500(2) or 3000 zeros on [0, 2 ].
45. Writing in Math The Power Tower ride in Sandusky, Ohio, is shown below. Along the side of each tower is a string of lights that send a continuous pulse of light up and down each tower at a constant rate. Explain why the distance d of this light from the ground over time t cannot be represented by a sinusoidal function.
SOLUTION: Sample answer: Although the pulse of light can be represented as a function with a period, it is not a sinusoidal function because the distance the pulse of light is from the ground changes at a constant rate. As a result, the graph of this function would resemble the graph below.
The given point lies on the terminal side of an angle θ in standard position. Find the values of the six
trigonometric functions of θ. 47. (8, −2)
SOLUTION: Use the values of x and y to find r.
Use x = 8, y = –2, and r = to write the six trigonometric ratios.
49. (4, 5)
SOLUTION: Use the values of x and y to find r.
Use x = 4, y = 5, and r = to write the six trigonometric ratios.
Write each degree measure in radians as a multiple of π and each radian measure in degrees.
51. −420°
SOLUTION:
To convert a degree measure to radians, multiply by
53.
SOLUTION:
To convert a radian measure to degrees, multiply by
State the number of possible real zeros and turning points of each function. Then determine all of the real zeros by factoring.
55. f (x) = x3 + 2x
2 – 8x
SOLUTION: The degree of f (x) is 3, so it will have at most three real zeros and two turning points.
So, the zeros are −4, 0, and 2.
57. f (x) = x5 + 2x
4 – 4x
3 – 8x
2
SOLUTION: The degree of f (x) is 5, so it will have at most five real zeros and four turning points.
So, the zeros are −2, 0, and 2.
Determine whether f has an inverse function. If it does, find the inverse function and state any restrictions on its domain.
59. f (x) = −x – 2
SOLUTION:
Graph f (x) = −x – 2.
The graph of f passes the horizontal line test. Therefore, f is a one-to-one function and has an inverse function. From
the graph, you can see that f has domain (– , ) and range (– , ). Now find f–1
.
Because f–1
and f are the same function, the domain and range of f are equal to the domain and range of f–1
,
respectively. Therefore, it is not necessary to restrict the domain of f–1
.
61. f (x) = (x – 3)2 – 7
SOLUTION:
Graph f (x) = (x – 3)2 – 7.
The graph of f does not pass the horizontal line test. Therefore, f is not a one-to-one function and does not have an inverse function.
63. SAT/ACT If x + y = 90° and x and y are both nonnegative angles, what is equal to ?
A 0
B
C 1
D
E Cannot be determined from the information given.
SOLUTION:
If x + y = 90º, then x = 90º – y , and can be rewritten as . Let y = 60º.
Try a second angle. Let y = 45º.
Therefore, = 1, and the correct answer is C.
65. Identify the equation represented by the graph.
A y = sin 4x
B y = sin 2x
C y = 2 sin 2x
D y = 4 sin x
SOLUTION:
From the graph, it appears that the amplitude is 2 and the period is π. Use the period to find b.
So, the sine function represented by the graph could be y = 2 sin 2x. Therefore, the correct answer is C.
eSolutions Manual - Powered by Cognero Page 10
4-4 Graphing Sine and Cosine Functions

Describe how the graphs of f (x) and g (x) are related. Then find the amplitude of g (x), and sketch two periods of both functions on the same coordinate axes.
1. f (x) = sin x; g(x) = sin x
SOLUTION:
The graph of g(x) is the graph of f (x) compressed vertically. The amplitude of g(x) is or .
Create a table listing the coordinates of the x-intercepts and extrema for f (x) = sin x for one period, 2 , on the
interval [0, 2 ]. Then use the amplitude of g(x) to find corresponding points on its graph.
Sketch the curve through the indicated points for each function. Then repeat the pattern to complete a second period.
Functions x-intercept Maximum x-intercept Minimum x-intercept
f (x) = sin x (0, 0)
( , 0)
(2π, 0)
g(x) = sin x
(0, 0)
( , 0)
(2π, 0)
3. f (x) = cos x; g(x) = 6 cos x
SOLUTION:
The graph of g(x) is the graph of f (x) expanded vertically. The amplitude of g(x) is or 6.
Create a table listing the coordinates of the x-intercepts and extrema for f (x) = cos x for one period, 2 , on the
interval [0, 2 ]. Then use the amplitude of g(x) to find corresponding points on its graph.
Sketch the curve through the indicated points for each function. Then repeat the pattern to complete a second period.
Functions Maximum x-intercept Minimum x-intercept Maximum
f (x) = cos x
g(x) = 6 cos x
Describe how the graphs of f (x) and g (x) are related. Then find the period of g (x), and sketch at least oneperiod of both functions on the same coordinate axes.
5. f (x) = sin x; g(x) = sin 4x
SOLUTION:
The graph of g(x) is the graph of f (x) compressed horizontally. The period of g(x) is or . To find
corresponding points on the graph of g(x), change the x-coordinates of those key points on f (x) so that they range
from 0 to , increasing by increments of or .
Sketch the curve through the indicated points for each function. Then repeat the pattern to complete a second period.
Functions x-intercept Maximum x-intercept Minimum x-intercept
f (x) = sin x (0, 0)
(π, 0)
(2π, 0)
g(x) = sin 4x (0, 0)
7. f (x) = cos x; g(x) = cos 0.2x
SOLUTION:
The graph of g(x) is the graph of f (x) expanded horizontally. The period of g(x) is or . To find
corresponding points on the graph of g(x), change the x-coordinates of those key points on f (x) so that they range
from 0 to , increasing by increments of or .
Sketch the curve through the indicated points for each function. Then repeat the pattern to complete a second period.
Functions Maximum x-intercept Minimum x-intercept Maximum
f (x) = cos x (0, 1)
g(x) = cos x
(0, 1)
9. VOICES The contralto vocal type includes the deepest female singing voice. Some contraltos can sing as low as the E below middle C (E3), which has a frequency of 165 hertz. Write an equation for a sine function that models the initial behavior of the sound wave associated with E3 having an amplitude of 0.15.
SOLUTION:
The general form of the equation will be y = a sin bt, where t is the time in seconds. Because the amplitude is 0.15, a = 0.15. This means that a = ±0.15.
The period is the reciprocal of the frequency or . Use this value to find b.
Sample answer: One sine function that models the initial behavior is y = 0.15 sin 330 t.
Write a sine function that can be used to model the initial behavior of a sound wave with the frequency and amplitude given.
11. f = 932, a = 0.25
SOLUTION:
The general form of the equation is y = a sin bt, where t is the time in seconds. Because the amplitude is 0.25, =
0.25. This means that a = ±0.25.
The period is the reciprocal of the frequency or . Use this value to find b.
Using the positive values of a and b, one sine function that models the initial behavior is y = 0.25 sin 1864 t.
13. f = 623, a = 0.2
SOLUTION:
The general form of the equation is y = a sin bt, where t is the time in seconds. Because the amplitude is 0.2, =
0.2. This means that a = ±0.2.
The period is the reciprocal of the frequency or . Use this value to find b.
Using the positive values of a and b, one sine function that models the initial behavior is y = 0.2 sin 1246 t.
State the amplitude, period, frequency, phase shift, and vertical shift of each function. Then graph two periods of the function.
15.
SOLUTION:
In this function, a = 1, b = 1, c = , and d = 0. Because d = 0, there is no vertical shift.
Graph y = 3 cos x shifted units to the right.
17. y = sin 3x – 2
SOLUTION: In this function, a = 1, b = 3, c = 0, and d = –2.
Graph y = sin 3x shifted 2 units down.
19.
SOLUTION:
In this function, a = 1, b = 1, c = , and d = 4.
.
Graph y = sin x shifted units to the right and 4 units up.
21. TIDES The table shown below provides data for the first high and low tides of the day for a certain bay during oneday in June.
a. Determine the amplitude, period, phase shift, and vertical shift of a sinusoidal function that models the height of the tide. Let x represent the number of hours that the high or low tide occurred after midnight and y represent the height of the wave in feet. b. Write a sinusoidal function that models the data. c. According to your model, what was the height of the tide at 8:45 P.M. that night?
SOLUTION: a. Sample answer: Use a sinusoidal function of the form y = a cos (bx + c) + d to model the data. First, find the amplitude a, which is half of the distance between the heights of the high and low tides.
The vertical shift d is the average of the heights of the high and low tides.
A sinusoid completes half of a period in the time that it takes to go from its maximum to its minimum value. One
period is twice this time. The first high tide occurs at 4:25 A.M. or x = 4.417 and the first low tide occurs at 10:55
A.M. or x = 10.917.
Because the period of a sinusoidal function is you can write Therefore,
The maximum data value occurs when x ≈ 4.417. Since y = cos x attains its first maximum when x = 0, we must
apply a phase shift of 4.417 − 0 or 4.417 units. Use this value to find c.
b. Write a function using the values for a, b, c, and d. Use b =
c. To find the height of the water at 8:45 P.M. that night, evaluate the model for x = 20.75.
Therefore, the tide was about 7.28 feet high at 8:45 P.M. that night.
GRAPHING CALCULATOR Find the values of x in the interval – < x < that make each equation or inequality true. (Hint: Use the intersection function.)
23. –sin x = cos x
SOLUTION:
Graph y = −sin x and y = cos x on the same graphing calculator screen on (−π, π). Use the intersect feature under the CALC menu to determine where the two graphs intersect.
The graphs intersect at about −0.7854 or − and about 2.356 or . Therefore, on –π < x < π, –sin x = cos x
when x = − and .
25. sin x + cos x = 0
SOLUTION:
Graph y = sin x + cos x on (−π, π). Use the zero feature under the CALC menu to determine the zeros of the function.
There are zeros at about −0.785 or − or and about 2.356 or . Therefore, on – < x < , sin x + cos x = 0
when x =
27. sin x cos x > 1
SOLUTION:
Graph y = sin x cos x and y = 1 on (− , ). Use the intersect feature under the CALC menu to determine on what interval(s) sin x cos x > 1.
The graphs do not intersect. Therefore, y = sin x cos x is not greater than y = 1 for any values of x on – < x < .
29. CAROUSELS A wooden horse on a carousel moves up and down as the carousel spins. When the ride ends, the horse usually stops in a vertical position different from where it started. The position y of the horse after t seconds can be modeled by y = 1.5 sin (2t + c), where the phase shift c must be continuously adjusted to compensate for the
different starting positions. If during one ride the horse reached a maximum height after seconds, find the
equation that models the horse’s position.
SOLUTION: First, find the period of y = 1.5 sin (2t + c).
Since the period is π, the function will reach a maximum height at radians. The phase shift is the difference
between the horizontal position of the function at and radians, which is radians. Substitute and b into
the phase shift formula to find c.
Therefore, the equation is
Write an equation that corresponds to each graph.
31.
SOLUTION: Sample answer: There is an x-intercept at 0, so one equation that corresponds to this graph is y = a sin (bx + c) + d. Half of the distance from the maximum to the minimum value of the function is 3. So, the amplitude is 3. It appears that the function completes one period on [0, π]. Find b.
The midline appears to be at y = 0, so there does not appear to be any vertical shift. Therefore, one equation that corresponds to this graph is y = 3 sin (2x).
33.
SOLUTION: Sample answer: Because there is a y-intercept at 3, one equation that corresponds to this graph is y = a cos (bx + c)+ d. Half of the distance from the maximum to the minimum value of the function is 4 ÷ 2 or 2. So, the amplitude is 2.
It appears that the function completes one period on Find b.
The midline appears to be at y = 1, so there is a vertical shift 1 unit up. Therefore, one equation that corresponds to this graph is y = 2 cos 4x + 1.
Write an equation for a sinusoidal function with the given period and amplitude that passes through the given point.
35. period: ; amplitude: 5; point:
SOLUTION: Use the period to find b.
Sample answer: One sinusoidal function in which a = 5 and b = 2 is y = 5 cos 2x. Evaluate the function for
The function passes through . Therefore, a sinusoidal function with period π and amplitude 5 that passes
through the point is y = 5 cos 2x.
37. period: ; amplitude: ; point:
SOLUTION: Use the period to find b.
Sample answer: One sinusoidal function in which a = 1.5 and b = 4 is y = 1.5 cos 4x. Evaluate the function for
The function passes through . Therefore, a sinusoidal function with period and amplitude 1.5 that passes
through the point is y = 1.5 cos 4x.
39. MULTIPLE REPRESENTATIONS In this problem, you will investigate the change in the graph of a sinusoidal function of the form y = sin x or y = cos x when multiplied by a polynomial function. a. GRAPHICAL Use a graphing calculator to sketch the graphs of y = 2x, y = –2x, and y = 2x cos x on the same coordinate plane, on the interval [–20, 20]. b. VERBAL Describe the behavior of the graph of y = 2x cos x in relation to the graphs of y = 2x and y = –2x.
c. GRAPHICAL Use a graphing calculator to sketch the graphs of y = x2, y = –x
2, and y = x
2 sin x on the same
coordinate plane, on the interval [–20, 20].
d. VERBAL Describe the behavior of the graph of y = x2 sin x in relation to the graphs of y = x
2 and y = –x
2.
e. ANALYTICAL Make a conjecture as to the behavior of the graph of a sinusoidal function of the form y = sin x or y = cos x when multiplied by polynomial function of the form y = f (x).
SOLUTION: a.
b. The graph of y = 2x cos x oscillates between the graphs of y = 2x and y = –2x. c.
d. The graph of y = x
2 sin x oscillates between the graphs of y = x
2 and y = –x
2.
e . The graph of y = f (x) sin x or y = f (x) cos x will oscillate between the graphs of y = f (x) and y = –f (x).
REASONING Determine whether each statement is true or false . Explain your reasoning.
41. Every sine function of the form y = a sin (bx + c) + d can be written as a cosine function of the form y = a cos (bx + c) + d.
SOLUTION: True; sample answer: The graph of cosine is a horizontal translation of the sine graph. Therefore, a cosine function can be written from any sine function using the same amplitude and period by applying the necessary phase shift.
43. CHALLENGE How many zeros does y = cos 1500x have on the interval 0 ≤ x ≤ 2 ?
SOLUTION: Find the period of y = cos 1500x.
Graph y = cos 1500x on .
The graph of y = cos 1500x has two x-intercepts for one cycle, so the function has 2 zeros per cycle. Find the
number of cycles for y = cos 1500x on [0, 2 ].
So, the graph of y = cos 1500x will complete 1500 cycles on [0, 2 ]. Because there are two zeros per cycle, y =
cos 1500x will have 1500(2) or 3000 zeros on [0, 2 ].
45. Writing in Math The Power Tower ride in Sandusky, Ohio, is shown below. Along the side of each tower is a string of lights that send a continuous pulse of light up and down each tower at a constant rate. Explain why the distance d of this light from the ground over time t cannot be represented by a sinusoidal function.
SOLUTION: Sample answer: Although the pulse of light can be represented as a function with a period, it is not a sinusoidal function because the distance the pulse of light is from the ground changes at a constant rate. As a result, the graph of this function would resemble the graph below.
The given point lies on the terminal side of an angle θ in standard position. Find the values of the six
trigonometric functions of θ. 47. (8, −2)
SOLUTION: Use the values of x and y to find r.
Use x = 8, y = –2, and r = to write the six trigonometric ratios.
49. (4, 5)
SOLUTION: Use the values of x and y to find r.
Use x = 4, y = 5, and r = to write the six trigonometric ratios.
Write each degree measure in radians as a multiple of π and each radian measure in degrees.
51. −420°
SOLUTION:
To convert a degree measure to radians, multiply by
53.
SOLUTION:
To convert a radian measure to degrees, multiply by
State the number of possible real zeros and turning points of each function. Then determine all of the real zeros by factoring.
55. f (x) = x3 + 2x
2 – 8x
SOLUTION: The degree of f (x) is 3, so it will have at most three real zeros and two turning points.
So, the zeros are −4, 0, and 2.
57. f (x) = x5 + 2x
4 – 4x
3 – 8x
2
SOLUTION: The degree of f (x) is 5, so it will have at most five real zeros and four turning points.
So, the zeros are −2, 0, and 2.
Determine whether f has an inverse function. If it does, find the inverse function and state any restrictions on its domain.
59. f (x) = −x – 2
SOLUTION:
Graph f (x) = −x – 2.
The graph of f passes the horizontal line test. Therefore, f is a one-to-one function and has an inverse function. From
the graph, you can see that f has domain (– , ) and range (– , ). Now find f–1
.
Because f–1
and f are the same function, the domain and range of f are equal to the domain and range of f–1
,
respectively. Therefore, it is not necessary to restrict the domain of f–1
.
61. f (x) = (x – 3)2 – 7
SOLUTION:
Graph f (x) = (x – 3)2 – 7.
The graph of f does not pass the horizontal line test. Therefore, f is not a one-to-one function and does not have an inverse function.
63. SAT/ACT If x + y = 90° and x and y are both nonnegative angles, what is equal to ?
A 0
B
C 1
D
E Cannot be determined from the information given.
SOLUTION:
If x + y = 90º, then x = 90º – y , and can be rewritten as . Let y = 60º.
Try a second angle. Let y = 45º.
Therefore, = 1, and the correct answer is C.
65. Identify the equation represented by the graph.
A y = sin 4x
B y = sin 2x
C y = 2 sin 2x
D y = 4 sin x
SOLUTION:
From the graph, it appears that the amplitude is 2 and the period is π. Use the period to find b.
So, the sine function represented by the graph could be y = 2 sin 2x. Therefore, the correct answer is C.
eSolutions Manual - Powered by Cognero Page 11
4-4 Graphing Sine and Cosine Functions
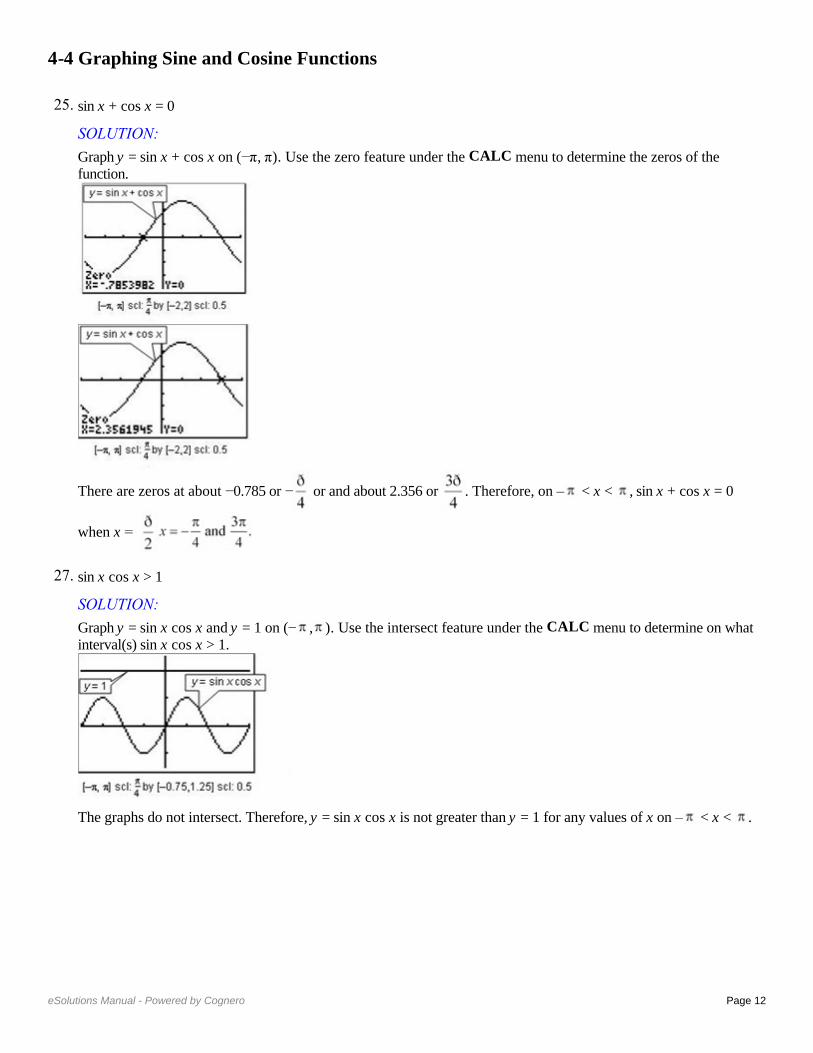
Describe how the graphs of f (x) and g (x) are related. Then find the amplitude of g (x), and sketch two periods of both functions on the same coordinate axes.
1. f (x) = sin x; g(x) = sin x
SOLUTION:
The graph of g(x) is the graph of f (x) compressed vertically. The amplitude of g(x) is or .
Create a table listing the coordinates of the x-intercepts and extrema for f (x) = sin x for one period, 2 , on the
interval [0, 2 ]. Then use the amplitude of g(x) to find corresponding points on its graph.
Sketch the curve through the indicated points for each function. Then repeat the pattern to complete a second period.
Functions x-intercept Maximum x-intercept Minimum x-intercept
f (x) = sin x (0, 0)
( , 0)
(2π, 0)
g(x) = sin x
(0, 0)
( , 0)
(2π, 0)
3. f (x) = cos x; g(x) = 6 cos x
SOLUTION:
The graph of g(x) is the graph of f (x) expanded vertically. The amplitude of g(x) is or 6.
Create a table listing the coordinates of the x-intercepts and extrema for f (x) = cos x for one period, 2 , on the
interval [0, 2 ]. Then use the amplitude of g(x) to find corresponding points on its graph.
Sketch the curve through the indicated points for each function. Then repeat the pattern to complete a second period.
Functions Maximum x-intercept Minimum x-intercept Maximum
f (x) = cos x
g(x) = 6 cos x
Describe how the graphs of f (x) and g (x) are related. Then find the period of g (x), and sketch at least oneperiod of both functions on the same coordinate axes.
5. f (x) = sin x; g(x) = sin 4x
SOLUTION:
The graph of g(x) is the graph of f (x) compressed horizontally. The period of g(x) is or . To find
corresponding points on the graph of g(x), change the x-coordinates of those key points on f (x) so that they range
from 0 to , increasing by increments of or .
Sketch the curve through the indicated points for each function. Then repeat the pattern to complete a second period.
Functions x-intercept Maximum x-intercept Minimum x-intercept
f (x) = sin x (0, 0)
(π, 0)
(2π, 0)
g(x) = sin 4x (0, 0)
7. f (x) = cos x; g(x) = cos 0.2x
SOLUTION:
The graph of g(x) is the graph of f (x) expanded horizontally. The period of g(x) is or . To find
corresponding points on the graph of g(x), change the x-coordinates of those key points on f (x) so that they range
from 0 to , increasing by increments of or .
Sketch the curve through the indicated points for each function. Then repeat the pattern to complete a second period.
Functions Maximum x-intercept Minimum x-intercept Maximum
f (x) = cos x (0, 1)
g(x) = cos x
(0, 1)
9. VOICES The contralto vocal type includes the deepest female singing voice. Some contraltos can sing as low as the E below middle C (E3), which has a frequency of 165 hertz. Write an equation for a sine function that models the initial behavior of the sound wave associated with E3 having an amplitude of 0.15.
SOLUTION:
The general form of the equation will be y = a sin bt, where t is the time in seconds. Because the amplitude is 0.15, a = 0.15. This means that a = ±0.15.
The period is the reciprocal of the frequency or . Use this value to find b.
Sample answer: One sine function that models the initial behavior is y = 0.15 sin 330 t.
Write a sine function that can be used to model the initial behavior of a sound wave with the frequency and amplitude given.
11. f = 932, a = 0.25
SOLUTION:
The general form of the equation is y = a sin bt, where t is the time in seconds. Because the amplitude is 0.25, =
0.25. This means that a = ±0.25.
The period is the reciprocal of the frequency or . Use this value to find b.
Using the positive values of a and b, one sine function that models the initial behavior is y = 0.25 sin 1864 t.
13. f = 623, a = 0.2
SOLUTION:
The general form of the equation is y = a sin bt, where t is the time in seconds. Because the amplitude is 0.2, =
0.2. This means that a = ±0.2.
The period is the reciprocal of the frequency or . Use this value to find b.
Using the positive values of a and b, one sine function that models the initial behavior is y = 0.2 sin 1246 t.
State the amplitude, period, frequency, phase shift, and vertical shift of each function. Then graph two periods of the function.
15.
SOLUTION:
In this function, a = 1, b = 1, c = , and d = 0. Because d = 0, there is no vertical shift.
Graph y = 3 cos x shifted units to the right.
17. y = sin 3x – 2
SOLUTION: In this function, a = 1, b = 3, c = 0, and d = –2.
Graph y = sin 3x shifted 2 units down.
19.
SOLUTION:
In this function, a = 1, b = 1, c = , and d = 4.
.
Graph y = sin x shifted units to the right and 4 units up.
21. TIDES The table shown below provides data for the first high and low tides of the day for a certain bay during oneday in June.
a. Determine the amplitude, period, phase shift, and vertical shift of a sinusoidal function that models the height of the tide. Let x represent the number of hours that the high or low tide occurred after midnight and y represent the height of the wave in feet. b. Write a sinusoidal function that models the data. c. According to your model, what was the height of the tide at 8:45 P.M. that night?
SOLUTION: a. Sample answer: Use a sinusoidal function of the form y = a cos (bx + c) + d to model the data. First, find the amplitude a, which is half of the distance between the heights of the high and low tides.
The vertical shift d is the average of the heights of the high and low tides.
A sinusoid completes half of a period in the time that it takes to go from its maximum to its minimum value. One
period is twice this time. The first high tide occurs at 4:25 A.M. or x = 4.417 and the first low tide occurs at 10:55
A.M. or x = 10.917.
Because the period of a sinusoidal function is you can write Therefore,
The maximum data value occurs when x ≈ 4.417. Since y = cos x attains its first maximum when x = 0, we must
apply a phase shift of 4.417 − 0 or 4.417 units. Use this value to find c.
b. Write a function using the values for a, b, c, and d. Use b =
c. To find the height of the water at 8:45 P.M. that night, evaluate the model for x = 20.75.
Therefore, the tide was about 7.28 feet high at 8:45 P.M. that night.
GRAPHING CALCULATOR Find the values of x in the interval – < x < that make each equation or inequality true. (Hint: Use the intersection function.)
23. –sin x = cos x
SOLUTION:
Graph y = −sin x and y = cos x on the same graphing calculator screen on (−π, π). Use the intersect feature under the CALC menu to determine where the two graphs intersect.
The graphs intersect at about −0.7854 or − and about 2.356 or . Therefore, on –π < x < π, –sin x = cos x
when x = − and .
25. sin x + cos x = 0
SOLUTION:
Graph y = sin x + cos x on (−π, π). Use the zero feature under the CALC menu to determine the zeros of the function.
There are zeros at about −0.785 or − or and about 2.356 or . Therefore, on – < x < , sin x + cos x = 0
when x =
27. sin x cos x > 1
SOLUTION:
Graph y = sin x cos x and y = 1 on (− , ). Use the intersect feature under the CALC menu to determine on what interval(s) sin x cos x > 1.
The graphs do not intersect. Therefore, y = sin x cos x is not greater than y = 1 for any values of x on – < x < .
29. CAROUSELS A wooden horse on a carousel moves up and down as the carousel spins. When the ride ends, the horse usually stops in a vertical position different from where it started. The position y of the horse after t seconds can be modeled by y = 1.5 sin (2t + c), where the phase shift c must be continuously adjusted to compensate for the
different starting positions. If during one ride the horse reached a maximum height after seconds, find the
equation that models the horse’s position.
SOLUTION: First, find the period of y = 1.5 sin (2t + c).
Since the period is π, the function will reach a maximum height at radians. The phase shift is the difference
between the horizontal position of the function at and radians, which is radians. Substitute and b into
the phase shift formula to find c.
Therefore, the equation is
Write an equation that corresponds to each graph.
31.
SOLUTION: Sample answer: There is an x-intercept at 0, so one equation that corresponds to this graph is y = a sin (bx + c) + d. Half of the distance from the maximum to the minimum value of the function is 3. So, the amplitude is 3. It appears that the function completes one period on [0, π]. Find b.
The midline appears to be at y = 0, so there does not appear to be any vertical shift. Therefore, one equation that corresponds to this graph is y = 3 sin (2x).
33.
SOLUTION: Sample answer: Because there is a y-intercept at 3, one equation that corresponds to this graph is y = a cos (bx + c)+ d. Half of the distance from the maximum to the minimum value of the function is 4 ÷ 2 or 2. So, the amplitude is 2.
It appears that the function completes one period on Find b.
The midline appears to be at y = 1, so there is a vertical shift 1 unit up. Therefore, one equation that corresponds to this graph is y = 2 cos 4x + 1.
Write an equation for a sinusoidal function with the given period and amplitude that passes through the given point.
35. period: ; amplitude: 5; point:
SOLUTION: Use the period to find b.
Sample answer: One sinusoidal function in which a = 5 and b = 2 is y = 5 cos 2x. Evaluate the function for
The function passes through . Therefore, a sinusoidal function with period π and amplitude 5 that passes
through the point is y = 5 cos 2x.
37. period: ; amplitude: ; point:
SOLUTION: Use the period to find b.
Sample answer: One sinusoidal function in which a = 1.5 and b = 4 is y = 1.5 cos 4x. Evaluate the function for
The function passes through . Therefore, a sinusoidal function with period and amplitude 1.5 that passes
through the point is y = 1.5 cos 4x.
39. MULTIPLE REPRESENTATIONS In this problem, you will investigate the change in the graph of a sinusoidal function of the form y = sin x or y = cos x when multiplied by a polynomial function. a. GRAPHICAL Use a graphing calculator to sketch the graphs of y = 2x, y = –2x, and y = 2x cos x on the same coordinate plane, on the interval [–20, 20]. b. VERBAL Describe the behavior of the graph of y = 2x cos x in relation to the graphs of y = 2x and y = –2x.
c. GRAPHICAL Use a graphing calculator to sketch the graphs of y = x2, y = –x
2, and y = x
2 sin x on the same
coordinate plane, on the interval [–20, 20].
d. VERBAL Describe the behavior of the graph of y = x2 sin x in relation to the graphs of y = x
2 and y = –x
2.
e. ANALYTICAL Make a conjecture as to the behavior of the graph of a sinusoidal function of the form y = sin x or y = cos x when multiplied by polynomial function of the form y = f (x).
SOLUTION: a.
b. The graph of y = 2x cos x oscillates between the graphs of y = 2x and y = –2x. c.
d. The graph of y = x
2 sin x oscillates between the graphs of y = x
2 and y = –x
2.
e . The graph of y = f (x) sin x or y = f (x) cos x will oscillate between the graphs of y = f (x) and y = –f (x).
REASONING Determine whether each statement is true or false . Explain your reasoning.
41. Every sine function of the form y = a sin (bx + c) + d can be written as a cosine function of the form y = a cos (bx + c) + d.
SOLUTION: True; sample answer: The graph of cosine is a horizontal translation of the sine graph. Therefore, a cosine function can be written from any sine function using the same amplitude and period by applying the necessary phase shift.
43. CHALLENGE How many zeros does y = cos 1500x have on the interval 0 ≤ x ≤ 2 ?
SOLUTION: Find the period of y = cos 1500x.
Graph y = cos 1500x on .
The graph of y = cos 1500x has two x-intercepts for one cycle, so the function has 2 zeros per cycle. Find the
number of cycles for y = cos 1500x on [0, 2 ].
So, the graph of y = cos 1500x will complete 1500 cycles on [0, 2 ]. Because there are two zeros per cycle, y =
cos 1500x will have 1500(2) or 3000 zeros on [0, 2 ].
45. Writing in Math The Power Tower ride in Sandusky, Ohio, is shown below. Along the side of each tower is a string of lights that send a continuous pulse of light up and down each tower at a constant rate. Explain why the distance d of this light from the ground over time t cannot be represented by a sinusoidal function.
SOLUTION: Sample answer: Although the pulse of light can be represented as a function with a period, it is not a sinusoidal function because the distance the pulse of light is from the ground changes at a constant rate. As a result, the graph of this function would resemble the graph below.
The given point lies on the terminal side of an angle θ in standard position. Find the values of the six
trigonometric functions of θ. 47. (8, −2)
SOLUTION: Use the values of x and y to find r.
Use x = 8, y = –2, and r = to write the six trigonometric ratios.
49. (4, 5)
SOLUTION: Use the values of x and y to find r.
Use x = 4, y = 5, and r = to write the six trigonometric ratios.
Write each degree measure in radians as a multiple of π and each radian measure in degrees.
51. −420°
SOLUTION:
To convert a degree measure to radians, multiply by
53.
SOLUTION:
To convert a radian measure to degrees, multiply by
State the number of possible real zeros and turning points of each function. Then determine all of the real zeros by factoring.
55. f (x) = x3 + 2x
2 – 8x
SOLUTION: The degree of f (x) is 3, so it will have at most three real zeros and two turning points.
So, the zeros are −4, 0, and 2.
57. f (x) = x5 + 2x
4 – 4x
3 – 8x
2
SOLUTION: The degree of f (x) is 5, so it will have at most five real zeros and four turning points.
So, the zeros are −2, 0, and 2.
Determine whether f has an inverse function. If it does, find the inverse function and state any restrictions on its domain.
59. f (x) = −x – 2
SOLUTION:
Graph f (x) = −x – 2.
The graph of f passes the horizontal line test. Therefore, f is a one-to-one function and has an inverse function. From
the graph, you can see that f has domain (– , ) and range (– , ). Now find f–1
.
Because f–1
and f are the same function, the domain and range of f are equal to the domain and range of f–1
,
respectively. Therefore, it is not necessary to restrict the domain of f–1
.
61. f (x) = (x – 3)2 – 7
SOLUTION:
Graph f (x) = (x – 3)2 – 7.
The graph of f does not pass the horizontal line test. Therefore, f is not a one-to-one function and does not have an inverse function.
63. SAT/ACT If x + y = 90° and x and y are both nonnegative angles, what is equal to ?
A 0
B
C 1
D
E Cannot be determined from the information given.
SOLUTION:
If x + y = 90º, then x = 90º – y , and can be rewritten as . Let y = 60º.
Try a second angle. Let y = 45º.
Therefore, = 1, and the correct answer is C.
65. Identify the equation represented by the graph.
A y = sin 4x
B y = sin 2x
C y = 2 sin 2x
D y = 4 sin x
SOLUTION:
From the graph, it appears that the amplitude is 2 and the period is π. Use the period to find b.
So, the sine function represented by the graph could be y = 2 sin 2x. Therefore, the correct answer is C.
eSolutions Manual - Powered by Cognero Page 12
4-4 Graphing Sine and Cosine Functions
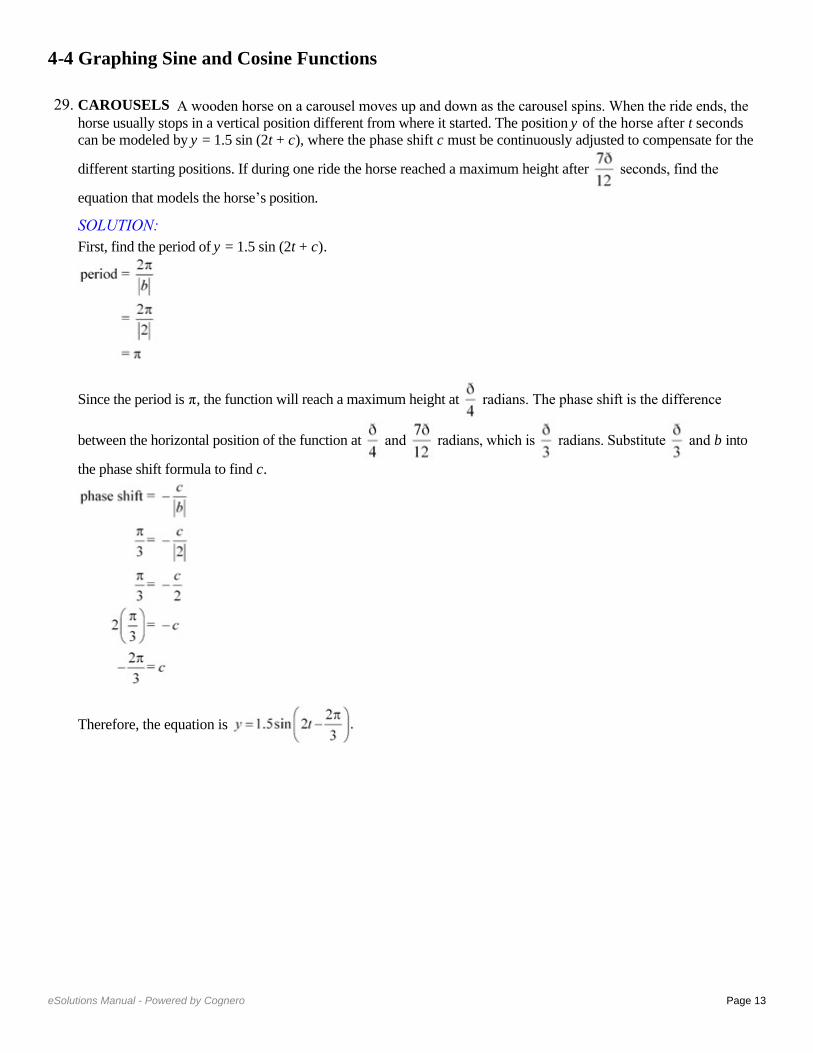
Describe how the graphs of f (x) and g (x) are related. Then find the amplitude of g (x), and sketch two periods of both functions on the same coordinate axes.
1. f (x) = sin x; g(x) = sin x
SOLUTION:
The graph of g(x) is the graph of f (x) compressed vertically. The amplitude of g(x) is or .
Create a table listing the coordinates of the x-intercepts and extrema for f (x) = sin x for one period, 2 , on the
interval [0, 2 ]. Then use the amplitude of g(x) to find corresponding points on its graph.
Sketch the curve through the indicated points for each function. Then repeat the pattern to complete a second period.
Functions x-intercept Maximum x-intercept Minimum x-intercept
f (x) = sin x (0, 0)
( , 0)
(2π, 0)
g(x) = sin x
(0, 0)
( , 0)
(2π, 0)
3. f (x) = cos x; g(x) = 6 cos x
SOLUTION:
The graph of g(x) is the graph of f (x) expanded vertically. The amplitude of g(x) is or 6.
Create a table listing the coordinates of the x-intercepts and extrema for f (x) = cos x for one period, 2 , on the
interval [0, 2 ]. Then use the amplitude of g(x) to find corresponding points on its graph.
Sketch the curve through the indicated points for each function. Then repeat the pattern to complete a second period.
Functions Maximum x-intercept Minimum x-intercept Maximum
f (x) = cos x
g(x) = 6 cos x
Describe how the graphs of f (x) and g (x) are related. Then find the period of g (x), and sketch at least oneperiod of both functions on the same coordinate axes.
5. f (x) = sin x; g(x) = sin 4x
SOLUTION:
The graph of g(x) is the graph of f (x) compressed horizontally. The period of g(x) is or . To find
corresponding points on the graph of g(x), change the x-coordinates of those key points on f (x) so that they range
from 0 to , increasing by increments of or .
Sketch the curve through the indicated points for each function. Then repeat the pattern to complete a second period.
Functions x-intercept Maximum x-intercept Minimum x-intercept
f (x) = sin x (0, 0)
(π, 0)
(2π, 0)
g(x) = sin 4x (0, 0)
7. f (x) = cos x; g(x) = cos 0.2x
SOLUTION:
The graph of g(x) is the graph of f (x) expanded horizontally. The period of g(x) is or . To find
corresponding points on the graph of g(x), change the x-coordinates of those key points on f (x) so that they range
from 0 to , increasing by increments of or .
Sketch the curve through the indicated points for each function. Then repeat the pattern to complete a second period.
Functions Maximum x-intercept Minimum x-intercept Maximum
f (x) = cos x (0, 1)
g(x) = cos x
(0, 1)
9. VOICES The contralto vocal type includes the deepest female singing voice. Some contraltos can sing as low as the E below middle C (E3), which has a frequency of 165 hertz. Write an equation for a sine function that models the initial behavior of the sound wave associated with E3 having an amplitude of 0.15.
SOLUTION:
The general form of the equation will be y = a sin bt, where t is the time in seconds. Because the amplitude is 0.15, a = 0.15. This means that a = ±0.15.
The period is the reciprocal of the frequency or . Use this value to find b.
Sample answer: One sine function that models the initial behavior is y = 0.15 sin 330 t.
Write a sine function that can be used to model the initial behavior of a sound wave with the frequency and amplitude given.
11. f = 932, a = 0.25
SOLUTION:
The general form of the equation is y = a sin bt, where t is the time in seconds. Because the amplitude is 0.25, =
0.25. This means that a = ±0.25.
The period is the reciprocal of the frequency or . Use this value to find b.
Using the positive values of a and b, one sine function that models the initial behavior is y = 0.25 sin 1864 t.
13. f = 623, a = 0.2
SOLUTION:
The general form of the equation is y = a sin bt, where t is the time in seconds. Because the amplitude is 0.2, =
0.2. This means that a = ±0.2.
The period is the reciprocal of the frequency or . Use this value to find b.
Using the positive values of a and b, one sine function that models the initial behavior is y = 0.2 sin 1246 t.
State the amplitude, period, frequency, phase shift, and vertical shift of each function. Then graph two periods of the function.
15.
SOLUTION:
In this function, a = 1, b = 1, c = , and d = 0. Because d = 0, there is no vertical shift.
Graph y = 3 cos x shifted units to the right.
17. y = sin 3x – 2
SOLUTION: In this function, a = 1, b = 3, c = 0, and d = –2.
Graph y = sin 3x shifted 2 units down.
19.
SOLUTION:
In this function, a = 1, b = 1, c = , and d = 4.
.
Graph y = sin x shifted units to the right and 4 units up.
21. TIDES The table shown below provides data for the first high and low tides of the day for a certain bay during oneday in June.
a. Determine the amplitude, period, phase shift, and vertical shift of a sinusoidal function that models the height of the tide. Let x represent the number of hours that the high or low tide occurred after midnight and y represent the height of the wave in feet. b. Write a sinusoidal function that models the data. c. According to your model, what was the height of the tide at 8:45 P.M. that night?
SOLUTION: a. Sample answer: Use a sinusoidal function of the form y = a cos (bx + c) + d to model the data. First, find the amplitude a, which is half of the distance between the heights of the high and low tides.
The vertical shift d is the average of the heights of the high and low tides.
A sinusoid completes half of a period in the time that it takes to go from its maximum to its minimum value. One
period is twice this time. The first high tide occurs at 4:25 A.M. or x = 4.417 and the first low tide occurs at 10:55
A.M. or x = 10.917.
Because the period of a sinusoidal function is you can write Therefore,
The maximum data value occurs when x ≈ 4.417. Since y = cos x attains its first maximum when x = 0, we must
apply a phase shift of 4.417 − 0 or 4.417 units. Use this value to find c.
b. Write a function using the values for a, b, c, and d. Use b =
c. To find the height of the water at 8:45 P.M. that night, evaluate the model for x = 20.75.
Therefore, the tide was about 7.28 feet high at 8:45 P.M. that night.
GRAPHING CALCULATOR Find the values of x in the interval – < x < that make each equation or inequality true. (Hint: Use the intersection function.)
23. –sin x = cos x
SOLUTION:
Graph y = −sin x and y = cos x on the same graphing calculator screen on (−π, π). Use the intersect feature under the CALC menu to determine where the two graphs intersect.
The graphs intersect at about −0.7854 or − and about 2.356 or . Therefore, on –π < x < π, –sin x = cos x
when x = − and .
25. sin x + cos x = 0
SOLUTION:
Graph y = sin x + cos x on (−π, π). Use the zero feature under the CALC menu to determine the zeros of the function.
There are zeros at about −0.785 or − or and about 2.356 or . Therefore, on – < x < , sin x + cos x = 0
when x =
27. sin x cos x > 1
SOLUTION:
Graph y = sin x cos x and y = 1 on (− , ). Use the intersect feature under the CALC menu to determine on what interval(s) sin x cos x > 1.
The graphs do not intersect. Therefore, y = sin x cos x is not greater than y = 1 for any values of x on – < x < .
29. CAROUSELS A wooden horse on a carousel moves up and down as the carousel spins. When the ride ends, the horse usually stops in a vertical position different from where it started. The position y of the horse after t seconds can be modeled by y = 1.5 sin (2t + c), where the phase shift c must be continuously adjusted to compensate for the
different starting positions. If during one ride the horse reached a maximum height after seconds, find the
equation that models the horse’s position.
SOLUTION: First, find the period of y = 1.5 sin (2t + c).
Since the period is π, the function will reach a maximum height at radians. The phase shift is the difference
between the horizontal position of the function at and radians, which is radians. Substitute and b into
the phase shift formula to find c.
Therefore, the equation is
Write an equation that corresponds to each graph.
31.
SOLUTION: Sample answer: There is an x-intercept at 0, so one equation that corresponds to this graph is y = a sin (bx + c) + d. Half of the distance from the maximum to the minimum value of the function is 3. So, the amplitude is 3. It appears that the function completes one period on [0, π]. Find b.
The midline appears to be at y = 0, so there does not appear to be any vertical shift. Therefore, one equation that corresponds to this graph is y = 3 sin (2x).
33.
SOLUTION: Sample answer: Because there is a y-intercept at 3, one equation that corresponds to this graph is y = a cos (bx + c)+ d. Half of the distance from the maximum to the minimum value of the function is 4 ÷ 2 or 2. So, the amplitude is 2.
It appears that the function completes one period on Find b.
The midline appears to be at y = 1, so there is a vertical shift 1 unit up. Therefore, one equation that corresponds to this graph is y = 2 cos 4x + 1.
Write an equation for a sinusoidal function with the given period and amplitude that passes through the given point.
35. period: ; amplitude: 5; point:
SOLUTION: Use the period to find b.
Sample answer: One sinusoidal function in which a = 5 and b = 2 is y = 5 cos 2x. Evaluate the function for
The function passes through . Therefore, a sinusoidal function with period π and amplitude 5 that passes
through the point is y = 5 cos 2x.
37. period: ; amplitude: ; point:
SOLUTION: Use the period to find b.
Sample answer: One sinusoidal function in which a = 1.5 and b = 4 is y = 1.5 cos 4x. Evaluate the function for
The function passes through . Therefore, a sinusoidal function with period and amplitude 1.5 that passes
through the point is y = 1.5 cos 4x.
39. MULTIPLE REPRESENTATIONS In this problem, you will investigate the change in the graph of a sinusoidal function of the form y = sin x or y = cos x when multiplied by a polynomial function. a. GRAPHICAL Use a graphing calculator to sketch the graphs of y = 2x, y = –2x, and y = 2x cos x on the same coordinate plane, on the interval [–20, 20]. b. VERBAL Describe the behavior of the graph of y = 2x cos x in relation to the graphs of y = 2x and y = –2x.
c. GRAPHICAL Use a graphing calculator to sketch the graphs of y = x2, y = –x
2, and y = x
2 sin x on the same
coordinate plane, on the interval [–20, 20].
d. VERBAL Describe the behavior of the graph of y = x2 sin x in relation to the graphs of y = x
2 and y = –x
2.
e. ANALYTICAL Make a conjecture as to the behavior of the graph of a sinusoidal function of the form y = sin x or y = cos x when multiplied by polynomial function of the form y = f (x).
SOLUTION: a.
b. The graph of y = 2x cos x oscillates between the graphs of y = 2x and y = –2x. c.
d. The graph of y = x
2 sin x oscillates between the graphs of y = x
2 and y = –x
2.
e . The graph of y = f (x) sin x or y = f (x) cos x will oscillate between the graphs of y = f (x) and y = –f (x).
REASONING Determine whether each statement is true or false . Explain your reasoning.
41. Every sine function of the form y = a sin (bx + c) + d can be written as a cosine function of the form y = a cos (bx + c) + d.
SOLUTION: True; sample answer: The graph of cosine is a horizontal translation of the sine graph. Therefore, a cosine function can be written from any sine function using the same amplitude and period by applying the necessary phase shift.
43. CHALLENGE How many zeros does y = cos 1500x have on the interval 0 ≤ x ≤ 2 ?
SOLUTION: Find the period of y = cos 1500x.
Graph y = cos 1500x on .
The graph of y = cos 1500x has two x-intercepts for one cycle, so the function has 2 zeros per cycle. Find the
number of cycles for y = cos 1500x on [0, 2 ].
So, the graph of y = cos 1500x will complete 1500 cycles on [0, 2 ]. Because there are two zeros per cycle, y =
cos 1500x will have 1500(2) or 3000 zeros on [0, 2 ].
45. Writing in Math The Power Tower ride in Sandusky, Ohio, is shown below. Along the side of each tower is a string of lights that send a continuous pulse of light up and down each tower at a constant rate. Explain why the distance d of this light from the ground over time t cannot be represented by a sinusoidal function.
SOLUTION: Sample answer: Although the pulse of light can be represented as a function with a period, it is not a sinusoidal function because the distance the pulse of light is from the ground changes at a constant rate. As a result, the graph of this function would resemble the graph below.
The given point lies on the terminal side of an angle θ in standard position. Find the values of the six
trigonometric functions of θ. 47. (8, −2)
SOLUTION: Use the values of x and y to find r.
Use x = 8, y = –2, and r = to write the six trigonometric ratios.
49. (4, 5)
SOLUTION: Use the values of x and y to find r.
Use x = 4, y = 5, and r = to write the six trigonometric ratios.
Write each degree measure in radians as a multiple of π and each radian measure in degrees.
51. −420°
SOLUTION:
To convert a degree measure to radians, multiply by
53.
SOLUTION:
To convert a radian measure to degrees, multiply by
State the number of possible real zeros and turning points of each function. Then determine all of the real zeros by factoring.
55. f (x) = x3 + 2x
2 – 8x
SOLUTION: The degree of f (x) is 3, so it will have at most three real zeros and two turning points.
So, the zeros are −4, 0, and 2.
57. f (x) = x5 + 2x
4 – 4x
3 – 8x
2
SOLUTION: The degree of f (x) is 5, so it will have at most five real zeros and four turning points.
So, the zeros are −2, 0, and 2.
Determine whether f has an inverse function. If it does, find the inverse function and state any restrictions on its domain.
59. f (x) = −x – 2
SOLUTION:
Graph f (x) = −x – 2.
The graph of f passes the horizontal line test. Therefore, f is a one-to-one function and has an inverse function. From
the graph, you can see that f has domain (– , ) and range (– , ). Now find f–1
.
Because f–1
and f are the same function, the domain and range of f are equal to the domain and range of f–1
,
respectively. Therefore, it is not necessary to restrict the domain of f–1
.
61. f (x) = (x – 3)2 – 7
SOLUTION:
Graph f (x) = (x – 3)2 – 7.
The graph of f does not pass the horizontal line test. Therefore, f is not a one-to-one function and does not have an inverse function.
63. SAT/ACT If x + y = 90° and x and y are both nonnegative angles, what is equal to ?
A 0
B
C 1
D
E Cannot be determined from the information given.
SOLUTION:
If x + y = 90º, then x = 90º – y , and can be rewritten as . Let y = 60º.
Try a second angle. Let y = 45º.
Therefore, = 1, and the correct answer is C.
65. Identify the equation represented by the graph.
A y = sin 4x
B y = sin 2x
C y = 2 sin 2x
D y = 4 sin x
SOLUTION:
From the graph, it appears that the amplitude is 2 and the period is π. Use the period to find b.
So, the sine function represented by the graph could be y = 2 sin 2x. Therefore, the correct answer is C.
eSolutions Manual - Powered by Cognero Page 13
4-4 Graphing Sine and Cosine Functions
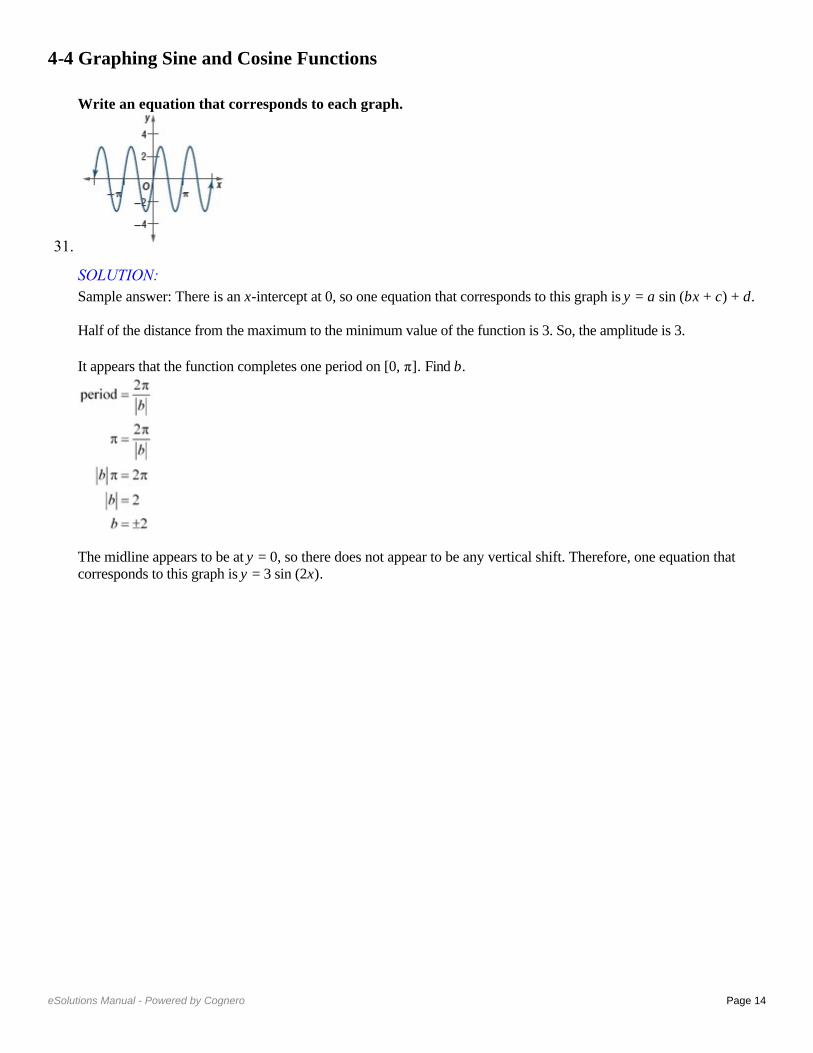
Describe how the graphs of f (x) and g (x) are related. Then find the amplitude of g (x), and sketch two periods of both functions on the same coordinate axes.
1. f (x) = sin x; g(x) = sin x
SOLUTION:
The graph of g(x) is the graph of f (x) compressed vertically. The amplitude of g(x) is or .
Create a table listing the coordinates of the x-intercepts and extrema for f (x) = sin x for one period, 2 , on the
interval [0, 2 ]. Then use the amplitude of g(x) to find corresponding points on its graph.
Sketch the curve through the indicated points for each function. Then repeat the pattern to complete a second period.
Functions x-intercept Maximum x-intercept Minimum x-intercept
f (x) = sin x (0, 0)
( , 0)
(2π, 0)
g(x) = sin x
(0, 0)
( , 0)
(2π, 0)
3. f (x) = cos x; g(x) = 6 cos x
SOLUTION:
The graph of g(x) is the graph of f (x) expanded vertically. The amplitude of g(x) is or 6.
Create a table listing the coordinates of the x-intercepts and extrema for f (x) = cos x for one period, 2 , on the
interval [0, 2 ]. Then use the amplitude of g(x) to find corresponding points on its graph.
Sketch the curve through the indicated points for each function. Then repeat the pattern to complete a second period.
Functions Maximum x-intercept Minimum x-intercept Maximum
f (x) = cos x
g(x) = 6 cos x
Describe how the graphs of f (x) and g (x) are related. Then find the period of g (x), and sketch at least oneperiod of both functions on the same coordinate axes.
5. f (x) = sin x; g(x) = sin 4x
SOLUTION:
The graph of g(x) is the graph of f (x) compressed horizontally. The period of g(x) is or . To find
corresponding points on the graph of g(x), change the x-coordinates of those key points on f (x) so that they range
from 0 to , increasing by increments of or .
Sketch the curve through the indicated points for each function. Then repeat the pattern to complete a second period.
Functions x-intercept Maximum x-intercept Minimum x-intercept
f (x) = sin x (0, 0)
(π, 0)
(2π, 0)
g(x) = sin 4x (0, 0)
7. f (x) = cos x; g(x) = cos 0.2x
SOLUTION:
The graph of g(x) is the graph of f (x) expanded horizontally. The period of g(x) is or . To find
corresponding points on the graph of g(x), change the x-coordinates of those key points on f (x) so that they range
from 0 to , increasing by increments of or .
Sketch the curve through the indicated points for each function. Then repeat the pattern to complete a second period.
Functions Maximum x-intercept Minimum x-intercept Maximum
f (x) = cos x (0, 1)
g(x) = cos x
(0, 1)
9. VOICES The contralto vocal type includes the deepest female singing voice. Some contraltos can sing as low as the E below middle C (E3), which has a frequency of 165 hertz. Write an equation for a sine function that models the initial behavior of the sound wave associated with E3 having an amplitude of 0.15.
SOLUTION:
The general form of the equation will be y = a sin bt, where t is the time in seconds. Because the amplitude is 0.15, a = 0.15. This means that a = ±0.15.
The period is the reciprocal of the frequency or . Use this value to find b.
Sample answer: One sine function that models the initial behavior is y = 0.15 sin 330 t.
Write a sine function that can be used to model the initial behavior of a sound wave with the frequency and amplitude given.
11. f = 932, a = 0.25
SOLUTION:
The general form of the equation is y = a sin bt, where t is the time in seconds. Because the amplitude is 0.25, =
0.25. This means that a = ±0.25.
The period is the reciprocal of the frequency or . Use this value to find b.
Using the positive values of a and b, one sine function that models the initial behavior is y = 0.25 sin 1864 t.
13. f = 623, a = 0.2
SOLUTION:
The general form of the equation is y = a sin bt, where t is the time in seconds. Because the amplitude is 0.2, =
0.2. This means that a = ±0.2.
The period is the reciprocal of the frequency or . Use this value to find b.
Using the positive values of a and b, one sine function that models the initial behavior is y = 0.2 sin 1246 t.
State the amplitude, period, frequency, phase shift, and vertical shift of each function. Then graph two periods of the function.
15.
SOLUTION:
In this function, a = 1, b = 1, c = , and d = 0. Because d = 0, there is no vertical shift.
Graph y = 3 cos x shifted units to the right.
17. y = sin 3x – 2
SOLUTION: In this function, a = 1, b = 3, c = 0, and d = –2.
Graph y = sin 3x shifted 2 units down.
19.
SOLUTION:
In this function, a = 1, b = 1, c = , and d = 4.
.
Graph y = sin x shifted units to the right and 4 units up.
21. TIDES The table shown below provides data for the first high and low tides of the day for a certain bay during oneday in June.
a. Determine the amplitude, period, phase shift, and vertical shift of a sinusoidal function that models the height of the tide. Let x represent the number of hours that the high or low tide occurred after midnight and y represent the height of the wave in feet. b. Write a sinusoidal function that models the data. c. According to your model, what was the height of the tide at 8:45 P.M. that night?
SOLUTION: a. Sample answer: Use a sinusoidal function of the form y = a cos (bx + c) + d to model the data. First, find the amplitude a, which is half of the distance between the heights of the high and low tides.
The vertical shift d is the average of the heights of the high and low tides.
A sinusoid completes half of a period in the time that it takes to go from its maximum to its minimum value. One
period is twice this time. The first high tide occurs at 4:25 A.M. or x = 4.417 and the first low tide occurs at 10:55
A.M. or x = 10.917.
Because the period of a sinusoidal function is you can write Therefore,
The maximum data value occurs when x ≈ 4.417. Since y = cos x attains its first maximum when x = 0, we must
apply a phase shift of 4.417 − 0 or 4.417 units. Use this value to find c.
b. Write a function using the values for a, b, c, and d. Use b =
c. To find the height of the water at 8:45 P.M. that night, evaluate the model for x = 20.75.
Therefore, the tide was about 7.28 feet high at 8:45 P.M. that night.
GRAPHING CALCULATOR Find the values of x in the interval – < x < that make each equation or inequality true. (Hint: Use the intersection function.)
23. –sin x = cos x
SOLUTION:
Graph y = −sin x and y = cos x on the same graphing calculator screen on (−π, π). Use the intersect feature under the CALC menu to determine where the two graphs intersect.
The graphs intersect at about −0.7854 or − and about 2.356 or . Therefore, on –π < x < π, –sin x = cos x
when x = − and .
25. sin x + cos x = 0
SOLUTION:
Graph y = sin x + cos x on (−π, π). Use the zero feature under the CALC menu to determine the zeros of the function.
There are zeros at about −0.785 or − or and about 2.356 or . Therefore, on – < x < , sin x + cos x = 0
when x =
27. sin x cos x > 1
SOLUTION:
Graph y = sin x cos x and y = 1 on (− , ). Use the intersect feature under the CALC menu to determine on what interval(s) sin x cos x > 1.
The graphs do not intersect. Therefore, y = sin x cos x is not greater than y = 1 for any values of x on – < x < .
29. CAROUSELS A wooden horse on a carousel moves up and down as the carousel spins. When the ride ends, the horse usually stops in a vertical position different from where it started. The position y of the horse after t seconds can be modeled by y = 1.5 sin (2t + c), where the phase shift c must be continuously adjusted to compensate for the
different starting positions. If during one ride the horse reached a maximum height after seconds, find the
equation that models the horse’s position.
SOLUTION: First, find the period of y = 1.5 sin (2t + c).
Since the period is π, the function will reach a maximum height at radians. The phase shift is the difference
between the horizontal position of the function at and radians, which is radians. Substitute and b into
the phase shift formula to find c.
Therefore, the equation is
Write an equation that corresponds to each graph.
31.
SOLUTION: Sample answer: There is an x-intercept at 0, so one equation that corresponds to this graph is y = a sin (bx + c) + d. Half of the distance from the maximum to the minimum value of the function is 3. So, the amplitude is 3. It appears that the function completes one period on [0, π]. Find b.
The midline appears to be at y = 0, so there does not appear to be any vertical shift. Therefore, one equation that corresponds to this graph is y = 3 sin (2x).
33.
SOLUTION: Sample answer: Because there is a y-intercept at 3, one equation that corresponds to this graph is y = a cos (bx + c)+ d. Half of the distance from the maximum to the minimum value of the function is 4 ÷ 2 or 2. So, the amplitude is 2.
It appears that the function completes one period on Find b.
The midline appears to be at y = 1, so there is a vertical shift 1 unit up. Therefore, one equation that corresponds to this graph is y = 2 cos 4x + 1.
Write an equation for a sinusoidal function with the given period and amplitude that passes through the given point.
35. period: ; amplitude: 5; point:
SOLUTION: Use the period to find b.
Sample answer: One sinusoidal function in which a = 5 and b = 2 is y = 5 cos 2x. Evaluate the function for
The function passes through . Therefore, a sinusoidal function with period π and amplitude 5 that passes
through the point is y = 5 cos 2x.
37. period: ; amplitude: ; point:
SOLUTION: Use the period to find b.
Sample answer: One sinusoidal function in which a = 1.5 and b = 4 is y = 1.5 cos 4x. Evaluate the function for
The function passes through . Therefore, a sinusoidal function with period and amplitude 1.5 that passes
through the point is y = 1.5 cos 4x.
39. MULTIPLE REPRESENTATIONS In this problem, you will investigate the change in the graph of a sinusoidal function of the form y = sin x or y = cos x when multiplied by a polynomial function. a. GRAPHICAL Use a graphing calculator to sketch the graphs of y = 2x, y = –2x, and y = 2x cos x on the same coordinate plane, on the interval [–20, 20]. b. VERBAL Describe the behavior of the graph of y = 2x cos x in relation to the graphs of y = 2x and y = –2x.
c. GRAPHICAL Use a graphing calculator to sketch the graphs of y = x2, y = –x
2, and y = x
2 sin x on the same
coordinate plane, on the interval [–20, 20].
d. VERBAL Describe the behavior of the graph of y = x2 sin x in relation to the graphs of y = x
2 and y = –x
2.
e. ANALYTICAL Make a conjecture as to the behavior of the graph of a sinusoidal function of the form y = sin x or y = cos x when multiplied by polynomial function of the form y = f (x).
SOLUTION: a.
b. The graph of y = 2x cos x oscillates between the graphs of y = 2x and y = –2x. c.
d. The graph of y = x
2 sin x oscillates between the graphs of y = x
2 and y = –x
2.
e . The graph of y = f (x) sin x or y = f (x) cos x will oscillate between the graphs of y = f (x) and y = –f (x).
REASONING Determine whether each statement is true or false . Explain your reasoning.
41. Every sine function of the form y = a sin (bx + c) + d can be written as a cosine function of the form y = a cos (bx + c) + d.
SOLUTION: True; sample answer: The graph of cosine is a horizontal translation of the sine graph. Therefore, a cosine function can be written from any sine function using the same amplitude and period by applying the necessary phase shift.
43. CHALLENGE How many zeros does y = cos 1500x have on the interval 0 ≤ x ≤ 2 ?
SOLUTION: Find the period of y = cos 1500x.
Graph y = cos 1500x on .
The graph of y = cos 1500x has two x-intercepts for one cycle, so the function has 2 zeros per cycle. Find the
number of cycles for y = cos 1500x on [0, 2 ].
So, the graph of y = cos 1500x will complete 1500 cycles on [0, 2 ]. Because there are two zeros per cycle, y =
cos 1500x will have 1500(2) or 3000 zeros on [0, 2 ].
45. Writing in Math The Power Tower ride in Sandusky, Ohio, is shown below. Along the side of each tower is a string of lights that send a continuous pulse of light up and down each tower at a constant rate. Explain why the distance d of this light from the ground over time t cannot be represented by a sinusoidal function.
SOLUTION: Sample answer: Although the pulse of light can be represented as a function with a period, it is not a sinusoidal function because the distance the pulse of light is from the ground changes at a constant rate. As a result, the graph of this function would resemble the graph below.
The given point lies on the terminal side of an angle θ in standard position. Find the values of the six
trigonometric functions of θ. 47. (8, −2)
SOLUTION: Use the values of x and y to find r.
Use x = 8, y = –2, and r = to write the six trigonometric ratios.
49. (4, 5)
SOLUTION: Use the values of x and y to find r.
Use x = 4, y = 5, and r = to write the six trigonometric ratios.
Write each degree measure in radians as a multiple of π and each radian measure in degrees.
51. −420°
SOLUTION:
To convert a degree measure to radians, multiply by
53.
SOLUTION:
To convert a radian measure to degrees, multiply by
State the number of possible real zeros and turning points of each function. Then determine all of the real zeros by factoring.
55. f (x) = x3 + 2x
2 – 8x
SOLUTION: The degree of f (x) is 3, so it will have at most three real zeros and two turning points.
So, the zeros are −4, 0, and 2.
57. f (x) = x5 + 2x
4 – 4x
3 – 8x
2
SOLUTION: The degree of f (x) is 5, so it will have at most five real zeros and four turning points.
So, the zeros are −2, 0, and 2.
Determine whether f has an inverse function. If it does, find the inverse function and state any restrictions on its domain.
59. f (x) = −x – 2
SOLUTION:
Graph f (x) = −x – 2.
The graph of f passes the horizontal line test. Therefore, f is a one-to-one function and has an inverse function. From
the graph, you can see that f has domain (– , ) and range (– , ). Now find f–1
.
Because f–1
and f are the same function, the domain and range of f are equal to the domain and range of f–1
,
respectively. Therefore, it is not necessary to restrict the domain of f–1
.
61. f (x) = (x – 3)2 – 7
SOLUTION:
Graph f (x) = (x – 3)2 – 7.
The graph of f does not pass the horizontal line test. Therefore, f is not a one-to-one function and does not have an inverse function.
63. SAT/ACT If x + y = 90° and x and y are both nonnegative angles, what is equal to ?
A 0
B
C 1
D
E Cannot be determined from the information given.
SOLUTION:
If x + y = 90º, then x = 90º – y , and can be rewritten as . Let y = 60º.
Try a second angle. Let y = 45º.
Therefore, = 1, and the correct answer is C.
65. Identify the equation represented by the graph.
A y = sin 4x
B y = sin 2x
C y = 2 sin 2x
D y = 4 sin x
SOLUTION:
From the graph, it appears that the amplitude is 2 and the period is π. Use the period to find b.
So, the sine function represented by the graph could be y = 2 sin 2x. Therefore, the correct answer is C.
eSolutions Manual - Powered by Cognero Page 14
4-4 Graphing Sine and Cosine Functions

Describe how the graphs of f (x) and g (x) are related. Then find the amplitude of g (x), and sketch two periods of both functions on the same coordinate axes.
1. f (x) = sin x; g(x) = sin x
SOLUTION:
The graph of g(x) is the graph of f (x) compressed vertically. The amplitude of g(x) is or .
Create a table listing the coordinates of the x-intercepts and extrema for f (x) = sin x for one period, 2 , on the
interval [0, 2 ]. Then use the amplitude of g(x) to find corresponding points on its graph.
Sketch the curve through the indicated points for each function. Then repeat the pattern to complete a second period.
Functions x-intercept Maximum x-intercept Minimum x-intercept
f (x) = sin x (0, 0)
( , 0)
(2π, 0)
g(x) = sin x
(0, 0)
( , 0)
(2π, 0)
3. f (x) = cos x; g(x) = 6 cos x
SOLUTION:
The graph of g(x) is the graph of f (x) expanded vertically. The amplitude of g(x) is or 6.
Create a table listing the coordinates of the x-intercepts and extrema for f (x) = cos x for one period, 2 , on the
interval [0, 2 ]. Then use the amplitude of g(x) to find corresponding points on its graph.
Sketch the curve through the indicated points for each function. Then repeat the pattern to complete a second period.
Functions Maximum x-intercept Minimum x-intercept Maximum
f (x) = cos x
g(x) = 6 cos x
Describe how the graphs of f (x) and g (x) are related. Then find the period of g (x), and sketch at least oneperiod of both functions on the same coordinate axes.
5. f (x) = sin x; g(x) = sin 4x
SOLUTION:
The graph of g(x) is the graph of f (x) compressed horizontally. The period of g(x) is or . To find
corresponding points on the graph of g(x), change the x-coordinates of those key points on f (x) so that they range
from 0 to , increasing by increments of or .
Sketch the curve through the indicated points for each function. Then repeat the pattern to complete a second period.
Functions x-intercept Maximum x-intercept Minimum x-intercept
f (x) = sin x (0, 0)
(π, 0)
(2π, 0)
g(x) = sin 4x (0, 0)
7. f (x) = cos x; g(x) = cos 0.2x
SOLUTION:
The graph of g(x) is the graph of f (x) expanded horizontally. The period of g(x) is or . To find
corresponding points on the graph of g(x), change the x-coordinates of those key points on f (x) so that they range
from 0 to , increasing by increments of or .
Sketch the curve through the indicated points for each function. Then repeat the pattern to complete a second period.
Functions Maximum x-intercept Minimum x-intercept Maximum
f (x) = cos x (0, 1)
g(x) = cos x
(0, 1)
9. VOICES The contralto vocal type includes the deepest female singing voice. Some contraltos can sing as low as the E below middle C (E3), which has a frequency of 165 hertz. Write an equation for a sine function that models the initial behavior of the sound wave associated with E3 having an amplitude of 0.15.
SOLUTION:
The general form of the equation will be y = a sin bt, where t is the time in seconds. Because the amplitude is 0.15, a = 0.15. This means that a = ±0.15.
The period is the reciprocal of the frequency or . Use this value to find b.
Sample answer: One sine function that models the initial behavior is y = 0.15 sin 330 t.
Write a sine function that can be used to model the initial behavior of a sound wave with the frequency and amplitude given.
11. f = 932, a = 0.25
SOLUTION:
The general form of the equation is y = a sin bt, where t is the time in seconds. Because the amplitude is 0.25, =
0.25. This means that a = ±0.25.
The period is the reciprocal of the frequency or . Use this value to find b.
Using the positive values of a and b, one sine function that models the initial behavior is y = 0.25 sin 1864 t.
13. f = 623, a = 0.2
SOLUTION:
The general form of the equation is y = a sin bt, where t is the time in seconds. Because the amplitude is 0.2, =
0.2. This means that a = ±0.2.
The period is the reciprocal of the frequency or . Use this value to find b.
Using the positive values of a and b, one sine function that models the initial behavior is y = 0.2 sin 1246 t.
State the amplitude, period, frequency, phase shift, and vertical shift of each function. Then graph two periods of the function.
15.
SOLUTION:
In this function, a = 1, b = 1, c = , and d = 0. Because d = 0, there is no vertical shift.
Graph y = 3 cos x shifted units to the right.
17. y = sin 3x – 2
SOLUTION: In this function, a = 1, b = 3, c = 0, and d = –2.
Graph y = sin 3x shifted 2 units down.
19.
SOLUTION:
In this function, a = 1, b = 1, c = , and d = 4.
.
Graph y = sin x shifted units to the right and 4 units up.
21. TIDES The table shown below provides data for the first high and low tides of the day for a certain bay during oneday in June.
a. Determine the amplitude, period, phase shift, and vertical shift of a sinusoidal function that models the height of the tide. Let x represent the number of hours that the high or low tide occurred after midnight and y represent the height of the wave in feet. b. Write a sinusoidal function that models the data. c. According to your model, what was the height of the tide at 8:45 P.M. that night?
SOLUTION: a. Sample answer: Use a sinusoidal function of the form y = a cos (bx + c) + d to model the data. First, find the amplitude a, which is half of the distance between the heights of the high and low tides.
The vertical shift d is the average of the heights of the high and low tides.
A sinusoid completes half of a period in the time that it takes to go from its maximum to its minimum value. One
period is twice this time. The first high tide occurs at 4:25 A.M. or x = 4.417 and the first low tide occurs at 10:55
A.M. or x = 10.917.
Because the period of a sinusoidal function is you can write Therefore,
The maximum data value occurs when x ≈ 4.417. Since y = cos x attains its first maximum when x = 0, we must
apply a phase shift of 4.417 − 0 or 4.417 units. Use this value to find c.
b. Write a function using the values for a, b, c, and d. Use b =
c. To find the height of the water at 8:45 P.M. that night, evaluate the model for x = 20.75.
Therefore, the tide was about 7.28 feet high at 8:45 P.M. that night.
GRAPHING CALCULATOR Find the values of x in the interval – < x < that make each equation or inequality true. (Hint: Use the intersection function.)
23. –sin x = cos x
SOLUTION:
Graph y = −sin x and y = cos x on the same graphing calculator screen on (−π, π). Use the intersect feature under the CALC menu to determine where the two graphs intersect.
The graphs intersect at about −0.7854 or − and about 2.356 or . Therefore, on –π < x < π, –sin x = cos x
when x = − and .
25. sin x + cos x = 0
SOLUTION:
Graph y = sin x + cos x on (−π, π). Use the zero feature under the CALC menu to determine the zeros of the function.
There are zeros at about −0.785 or − or and about 2.356 or . Therefore, on – < x < , sin x + cos x = 0
when x =
27. sin x cos x > 1
SOLUTION:
Graph y = sin x cos x and y = 1 on (− , ). Use the intersect feature under the CALC menu to determine on what interval(s) sin x cos x > 1.
The graphs do not intersect. Therefore, y = sin x cos x is not greater than y = 1 for any values of x on – < x < .
29. CAROUSELS A wooden horse on a carousel moves up and down as the carousel spins. When the ride ends, the horse usually stops in a vertical position different from where it started. The position y of the horse after t seconds can be modeled by y = 1.5 sin (2t + c), where the phase shift c must be continuously adjusted to compensate for the
different starting positions. If during one ride the horse reached a maximum height after seconds, find the
equation that models the horse’s position.
SOLUTION: First, find the period of y = 1.5 sin (2t + c).
Since the period is π, the function will reach a maximum height at radians. The phase shift is the difference
between the horizontal position of the function at and radians, which is radians. Substitute and b into
the phase shift formula to find c.
Therefore, the equation is
Write an equation that corresponds to each graph.
31.
SOLUTION: Sample answer: There is an x-intercept at 0, so one equation that corresponds to this graph is y = a sin (bx + c) + d. Half of the distance from the maximum to the minimum value of the function is 3. So, the amplitude is 3. It appears that the function completes one period on [0, π]. Find b.
The midline appears to be at y = 0, so there does not appear to be any vertical shift. Therefore, one equation that corresponds to this graph is y = 3 sin (2x).
33.
SOLUTION: Sample answer: Because there is a y-intercept at 3, one equation that corresponds to this graph is y = a cos (bx + c)+ d. Half of the distance from the maximum to the minimum value of the function is 4 ÷ 2 or 2. So, the amplitude is 2.
It appears that the function completes one period on Find b.
The midline appears to be at y = 1, so there is a vertical shift 1 unit up. Therefore, one equation that corresponds to this graph is y = 2 cos 4x + 1.
Write an equation for a sinusoidal function with the given period and amplitude that passes through the given point.
35. period: ; amplitude: 5; point:
SOLUTION: Use the period to find b.
Sample answer: One sinusoidal function in which a = 5 and b = 2 is y = 5 cos 2x. Evaluate the function for
The function passes through . Therefore, a sinusoidal function with period π and amplitude 5 that passes
through the point is y = 5 cos 2x.
37. period: ; amplitude: ; point:
SOLUTION: Use the period to find b.
Sample answer: One sinusoidal function in which a = 1.5 and b = 4 is y = 1.5 cos 4x. Evaluate the function for
The function passes through . Therefore, a sinusoidal function with period and amplitude 1.5 that passes
through the point is y = 1.5 cos 4x.
39. MULTIPLE REPRESENTATIONS In this problem, you will investigate the change in the graph of a sinusoidal function of the form y = sin x or y = cos x when multiplied by a polynomial function. a. GRAPHICAL Use a graphing calculator to sketch the graphs of y = 2x, y = –2x, and y = 2x cos x on the same coordinate plane, on the interval [–20, 20]. b. VERBAL Describe the behavior of the graph of y = 2x cos x in relation to the graphs of y = 2x and y = –2x.
c. GRAPHICAL Use a graphing calculator to sketch the graphs of y = x2, y = –x
2, and y = x
2 sin x on the same
coordinate plane, on the interval [–20, 20].
d. VERBAL Describe the behavior of the graph of y = x2 sin x in relation to the graphs of y = x
2 and y = –x
2.
e. ANALYTICAL Make a conjecture as to the behavior of the graph of a sinusoidal function of the form y = sin x or y = cos x when multiplied by polynomial function of the form y = f (x).
SOLUTION: a.
b. The graph of y = 2x cos x oscillates between the graphs of y = 2x and y = –2x. c.
d. The graph of y = x
2 sin x oscillates between the graphs of y = x
2 and y = –x
2.
e . The graph of y = f (x) sin x or y = f (x) cos x will oscillate between the graphs of y = f (x) and y = –f (x).
REASONING Determine whether each statement is true or false . Explain your reasoning.
41. Every sine function of the form y = a sin (bx + c) + d can be written as a cosine function of the form y = a cos (bx + c) + d.
SOLUTION: True; sample answer: The graph of cosine is a horizontal translation of the sine graph. Therefore, a cosine function can be written from any sine function using the same amplitude and period by applying the necessary phase shift.
43. CHALLENGE How many zeros does y = cos 1500x have on the interval 0 ≤ x ≤ 2 ?
SOLUTION: Find the period of y = cos 1500x.
Graph y = cos 1500x on .
The graph of y = cos 1500x has two x-intercepts for one cycle, so the function has 2 zeros per cycle. Find the
number of cycles for y = cos 1500x on [0, 2 ].
So, the graph of y = cos 1500x will complete 1500 cycles on [0, 2 ]. Because there are two zeros per cycle, y =
cos 1500x will have 1500(2) or 3000 zeros on [0, 2 ].
45. Writing in Math The Power Tower ride in Sandusky, Ohio, is shown below. Along the side of each tower is a string of lights that send a continuous pulse of light up and down each tower at a constant rate. Explain why the distance d of this light from the ground over time t cannot be represented by a sinusoidal function.
SOLUTION: Sample answer: Although the pulse of light can be represented as a function with a period, it is not a sinusoidal function because the distance the pulse of light is from the ground changes at a constant rate. As a result, the graph of this function would resemble the graph below.
The given point lies on the terminal side of an angle θ in standard position. Find the values of the six
trigonometric functions of θ. 47. (8, −2)
SOLUTION: Use the values of x and y to find r.
Use x = 8, y = –2, and r = to write the six trigonometric ratios.
49. (4, 5)
SOLUTION: Use the values of x and y to find r.
Use x = 4, y = 5, and r = to write the six trigonometric ratios.
Write each degree measure in radians as a multiple of π and each radian measure in degrees.
51. −420°
SOLUTION:
To convert a degree measure to radians, multiply by
53.
SOLUTION:
To convert a radian measure to degrees, multiply by
State the number of possible real zeros and turning points of each function. Then determine all of the real zeros by factoring.
55. f (x) = x3 + 2x
2 – 8x
SOLUTION: The degree of f (x) is 3, so it will have at most three real zeros and two turning points.
So, the zeros are −4, 0, and 2.
57. f (x) = x5 + 2x
4 – 4x
3 – 8x
2
SOLUTION: The degree of f (x) is 5, so it will have at most five real zeros and four turning points.
So, the zeros are −2, 0, and 2.
Determine whether f has an inverse function. If it does, find the inverse function and state any restrictions on its domain.
59. f (x) = −x – 2
SOLUTION:
Graph f (x) = −x – 2.
The graph of f passes the horizontal line test. Therefore, f is a one-to-one function and has an inverse function. From
the graph, you can see that f has domain (– , ) and range (– , ). Now find f–1
.
Because f–1
and f are the same function, the domain and range of f are equal to the domain and range of f–1
,
respectively. Therefore, it is not necessary to restrict the domain of f–1
.
61. f (x) = (x – 3)2 – 7
SOLUTION:
Graph f (x) = (x – 3)2 – 7.
The graph of f does not pass the horizontal line test. Therefore, f is not a one-to-one function and does not have an inverse function.
63. SAT/ACT If x + y = 90° and x and y are both nonnegative angles, what is equal to ?
A 0
B
C 1
D
E Cannot be determined from the information given.
SOLUTION:
If x + y = 90º, then x = 90º – y , and can be rewritten as . Let y = 60º.
Try a second angle. Let y = 45º.
Therefore, = 1, and the correct answer is C.
65. Identify the equation represented by the graph.
A y = sin 4x
B y = sin 2x
C y = 2 sin 2x
D y = 4 sin x
SOLUTION:
From the graph, it appears that the amplitude is 2 and the period is π. Use the period to find b.
So, the sine function represented by the graph could be y = 2 sin 2x. Therefore, the correct answer is C.
eSolutions Manual - Powered by Cognero Page 15
4-4 Graphing Sine and Cosine Functions

Describe how the graphs of f (x) and g (x) are related. Then find the amplitude of g (x), and sketch two periods of both functions on the same coordinate axes.
1. f (x) = sin x; g(x) = sin x
SOLUTION:
The graph of g(x) is the graph of f (x) compressed vertically. The amplitude of g(x) is or .
Create a table listing the coordinates of the x-intercepts and extrema for f (x) = sin x for one period, 2 , on the
interval [0, 2 ]. Then use the amplitude of g(x) to find corresponding points on its graph.
Sketch the curve through the indicated points for each function. Then repeat the pattern to complete a second period.
Functions x-intercept Maximum x-intercept Minimum x-intercept
f (x) = sin x (0, 0)
( , 0)
(2π, 0)
g(x) = sin x
(0, 0)
( , 0)
(2π, 0)
3. f (x) = cos x; g(x) = 6 cos x
SOLUTION:
The graph of g(x) is the graph of f (x) expanded vertically. The amplitude of g(x) is or 6.
Create a table listing the coordinates of the x-intercepts and extrema for f (x) = cos x for one period, 2 , on the
interval [0, 2 ]. Then use the amplitude of g(x) to find corresponding points on its graph.
Sketch the curve through the indicated points for each function. Then repeat the pattern to complete a second period.
Functions Maximum x-intercept Minimum x-intercept Maximum
f (x) = cos x
g(x) = 6 cos x
Describe how the graphs of f (x) and g (x) are related. Then find the period of g (x), and sketch at least oneperiod of both functions on the same coordinate axes.
5. f (x) = sin x; g(x) = sin 4x
SOLUTION:
The graph of g(x) is the graph of f (x) compressed horizontally. The period of g(x) is or . To find
corresponding points on the graph of g(x), change the x-coordinates of those key points on f (x) so that they range
from 0 to , increasing by increments of or .
Sketch the curve through the indicated points for each function. Then repeat the pattern to complete a second period.
Functions x-intercept Maximum x-intercept Minimum x-intercept
f (x) = sin x (0, 0)
(π, 0)
(2π, 0)
g(x) = sin 4x (0, 0)
7. f (x) = cos x; g(x) = cos 0.2x
SOLUTION:
The graph of g(x) is the graph of f (x) expanded horizontally. The period of g(x) is or . To find
corresponding points on the graph of g(x), change the x-coordinates of those key points on f (x) so that they range
from 0 to , increasing by increments of or .
Sketch the curve through the indicated points for each function. Then repeat the pattern to complete a second period.
Functions Maximum x-intercept Minimum x-intercept Maximum
f (x) = cos x (0, 1)
g(x) = cos x
(0, 1)
9. VOICES The contralto vocal type includes the deepest female singing voice. Some contraltos can sing as low as the E below middle C (E3), which has a frequency of 165 hertz. Write an equation for a sine function that models the initial behavior of the sound wave associated with E3 having an amplitude of 0.15.
SOLUTION:
The general form of the equation will be y = a sin bt, where t is the time in seconds. Because the amplitude is 0.15, a = 0.15. This means that a = ±0.15.
The period is the reciprocal of the frequency or . Use this value to find b.
Sample answer: One sine function that models the initial behavior is y = 0.15 sin 330 t.
Write a sine function that can be used to model the initial behavior of a sound wave with the frequency and amplitude given.
11. f = 932, a = 0.25
SOLUTION:
The general form of the equation is y = a sin bt, where t is the time in seconds. Because the amplitude is 0.25, =
0.25. This means that a = ±0.25.
The period is the reciprocal of the frequency or . Use this value to find b.
Using the positive values of a and b, one sine function that models the initial behavior is y = 0.25 sin 1864 t.
13. f = 623, a = 0.2
SOLUTION:
The general form of the equation is y = a sin bt, where t is the time in seconds. Because the amplitude is 0.2, =
0.2. This means that a = ±0.2.
The period is the reciprocal of the frequency or . Use this value to find b.
Using the positive values of a and b, one sine function that models the initial behavior is y = 0.2 sin 1246 t.
State the amplitude, period, frequency, phase shift, and vertical shift of each function. Then graph two periods of the function.
15.
SOLUTION:
In this function, a = 1, b = 1, c = , and d = 0. Because d = 0, there is no vertical shift.
Graph y = 3 cos x shifted units to the right.
17. y = sin 3x – 2
SOLUTION: In this function, a = 1, b = 3, c = 0, and d = –2.
Graph y = sin 3x shifted 2 units down.
19.
SOLUTION:
In this function, a = 1, b = 1, c = , and d = 4.
.
Graph y = sin x shifted units to the right and 4 units up.
21. TIDES The table shown below provides data for the first high and low tides of the day for a certain bay during oneday in June.
a. Determine the amplitude, period, phase shift, and vertical shift of a sinusoidal function that models the height of the tide. Let x represent the number of hours that the high or low tide occurred after midnight and y represent the height of the wave in feet. b. Write a sinusoidal function that models the data. c. According to your model, what was the height of the tide at 8:45 P.M. that night?
SOLUTION: a. Sample answer: Use a sinusoidal function of the form y = a cos (bx + c) + d to model the data. First, find the amplitude a, which is half of the distance between the heights of the high and low tides.
The vertical shift d is the average of the heights of the high and low tides.
A sinusoid completes half of a period in the time that it takes to go from its maximum to its minimum value. One
period is twice this time. The first high tide occurs at 4:25 A.M. or x = 4.417 and the first low tide occurs at 10:55
A.M. or x = 10.917.
Because the period of a sinusoidal function is you can write Therefore,
The maximum data value occurs when x ≈ 4.417. Since y = cos x attains its first maximum when x = 0, we must
apply a phase shift of 4.417 − 0 or 4.417 units. Use this value to find c.
b. Write a function using the values for a, b, c, and d. Use b =
c. To find the height of the water at 8:45 P.M. that night, evaluate the model for x = 20.75.
Therefore, the tide was about 7.28 feet high at 8:45 P.M. that night.
GRAPHING CALCULATOR Find the values of x in the interval – < x < that make each equation or inequality true. (Hint: Use the intersection function.)
23. –sin x = cos x
SOLUTION:
Graph y = −sin x and y = cos x on the same graphing calculator screen on (−π, π). Use the intersect feature under the CALC menu to determine where the two graphs intersect.
The graphs intersect at about −0.7854 or − and about 2.356 or . Therefore, on –π < x < π, –sin x = cos x
when x = − and .
25. sin x + cos x = 0
SOLUTION:
Graph y = sin x + cos x on (−π, π). Use the zero feature under the CALC menu to determine the zeros of the function.
There are zeros at about −0.785 or − or and about 2.356 or . Therefore, on – < x < , sin x + cos x = 0
when x =
27. sin x cos x > 1
SOLUTION:
Graph y = sin x cos x and y = 1 on (− , ). Use the intersect feature under the CALC menu to determine on what interval(s) sin x cos x > 1.
The graphs do not intersect. Therefore, y = sin x cos x is not greater than y = 1 for any values of x on – < x < .
29. CAROUSELS A wooden horse on a carousel moves up and down as the carousel spins. When the ride ends, the horse usually stops in a vertical position different from where it started. The position y of the horse after t seconds can be modeled by y = 1.5 sin (2t + c), where the phase shift c must be continuously adjusted to compensate for the
different starting positions. If during one ride the horse reached a maximum height after seconds, find the
equation that models the horse’s position.
SOLUTION: First, find the period of y = 1.5 sin (2t + c).
Since the period is π, the function will reach a maximum height at radians. The phase shift is the difference
between the horizontal position of the function at and radians, which is radians. Substitute and b into
the phase shift formula to find c.
Therefore, the equation is
Write an equation that corresponds to each graph.
31.
SOLUTION: Sample answer: There is an x-intercept at 0, so one equation that corresponds to this graph is y = a sin (bx + c) + d. Half of the distance from the maximum to the minimum value of the function is 3. So, the amplitude is 3. It appears that the function completes one period on [0, π]. Find b.
The midline appears to be at y = 0, so there does not appear to be any vertical shift. Therefore, one equation that corresponds to this graph is y = 3 sin (2x).
33.
SOLUTION: Sample answer: Because there is a y-intercept at 3, one equation that corresponds to this graph is y = a cos (bx + c)+ d. Half of the distance from the maximum to the minimum value of the function is 4 ÷ 2 or 2. So, the amplitude is 2.
It appears that the function completes one period on Find b.
The midline appears to be at y = 1, so there is a vertical shift 1 unit up. Therefore, one equation that corresponds to this graph is y = 2 cos 4x + 1.
Write an equation for a sinusoidal function with the given period and amplitude that passes through the given point.
35. period: ; amplitude: 5; point:
SOLUTION: Use the period to find b.
Sample answer: One sinusoidal function in which a = 5 and b = 2 is y = 5 cos 2x. Evaluate the function for
The function passes through . Therefore, a sinusoidal function with period π and amplitude 5 that passes
through the point is y = 5 cos 2x.
37. period: ; amplitude: ; point:
SOLUTION: Use the period to find b.
Sample answer: One sinusoidal function in which a = 1.5 and b = 4 is y = 1.5 cos 4x. Evaluate the function for
The function passes through . Therefore, a sinusoidal function with period and amplitude 1.5 that passes
through the point is y = 1.5 cos 4x.
39. MULTIPLE REPRESENTATIONS In this problem, you will investigate the change in the graph of a sinusoidal function of the form y = sin x or y = cos x when multiplied by a polynomial function. a. GRAPHICAL Use a graphing calculator to sketch the graphs of y = 2x, y = –2x, and y = 2x cos x on the same coordinate plane, on the interval [–20, 20]. b. VERBAL Describe the behavior of the graph of y = 2x cos x in relation to the graphs of y = 2x and y = –2x.
c. GRAPHICAL Use a graphing calculator to sketch the graphs of y = x2, y = –x
2, and y = x
2 sin x on the same
coordinate plane, on the interval [–20, 20].
d. VERBAL Describe the behavior of the graph of y = x2 sin x in relation to the graphs of y = x
2 and y = –x
2.
e. ANALYTICAL Make a conjecture as to the behavior of the graph of a sinusoidal function of the form y = sin x or y = cos x when multiplied by polynomial function of the form y = f (x).
SOLUTION: a.
b. The graph of y = 2x cos x oscillates between the graphs of y = 2x and y = –2x. c.
d. The graph of y = x
2 sin x oscillates between the graphs of y = x
2 and y = –x
2.
e . The graph of y = f (x) sin x or y = f (x) cos x will oscillate between the graphs of y = f (x) and y = –f (x).
REASONING Determine whether each statement is true or false . Explain your reasoning.
41. Every sine function of the form y = a sin (bx + c) + d can be written as a cosine function of the form y = a cos (bx + c) + d.
SOLUTION: True; sample answer: The graph of cosine is a horizontal translation of the sine graph. Therefore, a cosine function can be written from any sine function using the same amplitude and period by applying the necessary phase shift.
43. CHALLENGE How many zeros does y = cos 1500x have on the interval 0 ≤ x ≤ 2 ?
SOLUTION: Find the period of y = cos 1500x.
Graph y = cos 1500x on .
The graph of y = cos 1500x has two x-intercepts for one cycle, so the function has 2 zeros per cycle. Find the
number of cycles for y = cos 1500x on [0, 2 ].
So, the graph of y = cos 1500x will complete 1500 cycles on [0, 2 ]. Because there are two zeros per cycle, y =
cos 1500x will have 1500(2) or 3000 zeros on [0, 2 ].
45. Writing in Math The Power Tower ride in Sandusky, Ohio, is shown below. Along the side of each tower is a string of lights that send a continuous pulse of light up and down each tower at a constant rate. Explain why the distance d of this light from the ground over time t cannot be represented by a sinusoidal function.
SOLUTION: Sample answer: Although the pulse of light can be represented as a function with a period, it is not a sinusoidal function because the distance the pulse of light is from the ground changes at a constant rate. As a result, the graph of this function would resemble the graph below.
The given point lies on the terminal side of an angle θ in standard position. Find the values of the six
trigonometric functions of θ. 47. (8, −2)
SOLUTION: Use the values of x and y to find r.
Use x = 8, y = –2, and r = to write the six trigonometric ratios.
49. (4, 5)
SOLUTION: Use the values of x and y to find r.
Use x = 4, y = 5, and r = to write the six trigonometric ratios.
Write each degree measure in radians as a multiple of π and each radian measure in degrees.
51. −420°
SOLUTION:
To convert a degree measure to radians, multiply by
53.
SOLUTION:
To convert a radian measure to degrees, multiply by
State the number of possible real zeros and turning points of each function. Then determine all of the real zeros by factoring.
55. f (x) = x3 + 2x
2 – 8x
SOLUTION: The degree of f (x) is 3, so it will have at most three real zeros and two turning points.
So, the zeros are −4, 0, and 2.
57. f (x) = x5 + 2x
4 – 4x
3 – 8x
2
SOLUTION: The degree of f (x) is 5, so it will have at most five real zeros and four turning points.
So, the zeros are −2, 0, and 2.
Determine whether f has an inverse function. If it does, find the inverse function and state any restrictions on its domain.
59. f (x) = −x – 2
SOLUTION:
Graph f (x) = −x – 2.
The graph of f passes the horizontal line test. Therefore, f is a one-to-one function and has an inverse function. From
the graph, you can see that f has domain (– , ) and range (– , ). Now find f–1
.
Because f–1
and f are the same function, the domain and range of f are equal to the domain and range of f–1
,
respectively. Therefore, it is not necessary to restrict the domain of f–1
.
61. f (x) = (x – 3)2 – 7
SOLUTION:
Graph f (x) = (x – 3)2 – 7.
The graph of f does not pass the horizontal line test. Therefore, f is not a one-to-one function and does not have an inverse function.
63. SAT/ACT If x + y = 90° and x and y are both nonnegative angles, what is equal to ?
A 0
B
C 1
D
E Cannot be determined from the information given.
SOLUTION:
If x + y = 90º, then x = 90º – y , and can be rewritten as . Let y = 60º.
Try a second angle. Let y = 45º.
Therefore, = 1, and the correct answer is C.
65. Identify the equation represented by the graph.
A y = sin 4x
B y = sin 2x
C y = 2 sin 2x
D y = 4 sin x
SOLUTION:
From the graph, it appears that the amplitude is 2 and the period is π. Use the period to find b.
So, the sine function represented by the graph could be y = 2 sin 2x. Therefore, the correct answer is C.
eSolutions Manual - Powered by Cognero Page 16
4-4 Graphing Sine and Cosine Functions

Describe how the graphs of f (x) and g (x) are related. Then find the amplitude of g (x), and sketch two periods of both functions on the same coordinate axes.
1. f (x) = sin x; g(x) = sin x
SOLUTION:
The graph of g(x) is the graph of f (x) compressed vertically. The amplitude of g(x) is or .
Create a table listing the coordinates of the x-intercepts and extrema for f (x) = sin x for one period, 2 , on the
interval [0, 2 ]. Then use the amplitude of g(x) to find corresponding points on its graph.
Sketch the curve through the indicated points for each function. Then repeat the pattern to complete a second period.
Functions x-intercept Maximum x-intercept Minimum x-intercept
f (x) = sin x (0, 0)
( , 0)
(2π, 0)
g(x) = sin x
(0, 0)
( , 0)
(2π, 0)
3. f (x) = cos x; g(x) = 6 cos x
SOLUTION:
The graph of g(x) is the graph of f (x) expanded vertically. The amplitude of g(x) is or 6.
Create a table listing the coordinates of the x-intercepts and extrema for f (x) = cos x for one period, 2 , on the
interval [0, 2 ]. Then use the amplitude of g(x) to find corresponding points on its graph.
Sketch the curve through the indicated points for each function. Then repeat the pattern to complete a second period.
Functions Maximum x-intercept Minimum x-intercept Maximum
f (x) = cos x
g(x) = 6 cos x
Describe how the graphs of f (x) and g (x) are related. Then find the period of g (x), and sketch at least oneperiod of both functions on the same coordinate axes.
5. f (x) = sin x; g(x) = sin 4x
SOLUTION:
The graph of g(x) is the graph of f (x) compressed horizontally. The period of g(x) is or . To find
corresponding points on the graph of g(x), change the x-coordinates of those key points on f (x) so that they range
from 0 to , increasing by increments of or .
Sketch the curve through the indicated points for each function. Then repeat the pattern to complete a second period.
Functions x-intercept Maximum x-intercept Minimum x-intercept
f (x) = sin x (0, 0)
(π, 0)
(2π, 0)
g(x) = sin 4x (0, 0)
7. f (x) = cos x; g(x) = cos 0.2x
SOLUTION:
The graph of g(x) is the graph of f (x) expanded horizontally. The period of g(x) is or . To find
corresponding points on the graph of g(x), change the x-coordinates of those key points on f (x) so that they range
from 0 to , increasing by increments of or .
Sketch the curve through the indicated points for each function. Then repeat the pattern to complete a second period.
Functions Maximum x-intercept Minimum x-intercept Maximum
f (x) = cos x (0, 1)
g(x) = cos x
(0, 1)
9. VOICES The contralto vocal type includes the deepest female singing voice. Some contraltos can sing as low as the E below middle C (E3), which has a frequency of 165 hertz. Write an equation for a sine function that models the initial behavior of the sound wave associated with E3 having an amplitude of 0.15.
SOLUTION:
The general form of the equation will be y = a sin bt, where t is the time in seconds. Because the amplitude is 0.15, a = 0.15. This means that a = ±0.15.
The period is the reciprocal of the frequency or . Use this value to find b.
Sample answer: One sine function that models the initial behavior is y = 0.15 sin 330 t.
Write a sine function that can be used to model the initial behavior of a sound wave with the frequency and amplitude given.
11. f = 932, a = 0.25
SOLUTION:
The general form of the equation is y = a sin bt, where t is the time in seconds. Because the amplitude is 0.25, =
0.25. This means that a = ±0.25.
The period is the reciprocal of the frequency or . Use this value to find b.
Using the positive values of a and b, one sine function that models the initial behavior is y = 0.25 sin 1864 t.
13. f = 623, a = 0.2
SOLUTION:
The general form of the equation is y = a sin bt, where t is the time in seconds. Because the amplitude is 0.2, =
0.2. This means that a = ±0.2.
The period is the reciprocal of the frequency or . Use this value to find b.
Using the positive values of a and b, one sine function that models the initial behavior is y = 0.2 sin 1246 t.
State the amplitude, period, frequency, phase shift, and vertical shift of each function. Then graph two periods of the function.
15.
SOLUTION:
In this function, a = 1, b = 1, c = , and d = 0. Because d = 0, there is no vertical shift.
Graph y = 3 cos x shifted units to the right.
17. y = sin 3x – 2
SOLUTION: In this function, a = 1, b = 3, c = 0, and d = –2.
Graph y = sin 3x shifted 2 units down.
19.
SOLUTION:
In this function, a = 1, b = 1, c = , and d = 4.
.
Graph y = sin x shifted units to the right and 4 units up.
21. TIDES The table shown below provides data for the first high and low tides of the day for a certain bay during oneday in June.
a. Determine the amplitude, period, phase shift, and vertical shift of a sinusoidal function that models the height of the tide. Let x represent the number of hours that the high or low tide occurred after midnight and y represent the height of the wave in feet. b. Write a sinusoidal function that models the data. c. According to your model, what was the height of the tide at 8:45 P.M. that night?
SOLUTION: a. Sample answer: Use a sinusoidal function of the form y = a cos (bx + c) + d to model the data. First, find the amplitude a, which is half of the distance between the heights of the high and low tides.
The vertical shift d is the average of the heights of the high and low tides.
A sinusoid completes half of a period in the time that it takes to go from its maximum to its minimum value. One
period is twice this time. The first high tide occurs at 4:25 A.M. or x = 4.417 and the first low tide occurs at 10:55
A.M. or x = 10.917.
Because the period of a sinusoidal function is you can write Therefore,
The maximum data value occurs when x ≈ 4.417. Since y = cos x attains its first maximum when x = 0, we must
apply a phase shift of 4.417 − 0 or 4.417 units. Use this value to find c.
b. Write a function using the values for a, b, c, and d. Use b =
c. To find the height of the water at 8:45 P.M. that night, evaluate the model for x = 20.75.
Therefore, the tide was about 7.28 feet high at 8:45 P.M. that night.
GRAPHING CALCULATOR Find the values of x in the interval – < x < that make each equation or inequality true. (Hint: Use the intersection function.)
23. –sin x = cos x
SOLUTION:
Graph y = −sin x and y = cos x on the same graphing calculator screen on (−π, π). Use the intersect feature under the CALC menu to determine where the two graphs intersect.
The graphs intersect at about −0.7854 or − and about 2.356 or . Therefore, on –π < x < π, –sin x = cos x
when x = − and .
25. sin x + cos x = 0
SOLUTION:
Graph y = sin x + cos x on (−π, π). Use the zero feature under the CALC menu to determine the zeros of the function.
There are zeros at about −0.785 or − or and about 2.356 or . Therefore, on – < x < , sin x + cos x = 0
when x =
27. sin x cos x > 1
SOLUTION:
Graph y = sin x cos x and y = 1 on (− , ). Use the intersect feature under the CALC menu to determine on what interval(s) sin x cos x > 1.
The graphs do not intersect. Therefore, y = sin x cos x is not greater than y = 1 for any values of x on – < x < .
29. CAROUSELS A wooden horse on a carousel moves up and down as the carousel spins. When the ride ends, the horse usually stops in a vertical position different from where it started. The position y of the horse after t seconds can be modeled by y = 1.5 sin (2t + c), where the phase shift c must be continuously adjusted to compensate for the
different starting positions. If during one ride the horse reached a maximum height after seconds, find the
equation that models the horse’s position.
SOLUTION: First, find the period of y = 1.5 sin (2t + c).
Since the period is π, the function will reach a maximum height at radians. The phase shift is the difference
between the horizontal position of the function at and radians, which is radians. Substitute and b into
the phase shift formula to find c.
Therefore, the equation is
Write an equation that corresponds to each graph.
31.
SOLUTION: Sample answer: There is an x-intercept at 0, so one equation that corresponds to this graph is y = a sin (bx + c) + d. Half of the distance from the maximum to the minimum value of the function is 3. So, the amplitude is 3. It appears that the function completes one period on [0, π]. Find b.
The midline appears to be at y = 0, so there does not appear to be any vertical shift. Therefore, one equation that corresponds to this graph is y = 3 sin (2x).
33.
SOLUTION: Sample answer: Because there is a y-intercept at 3, one equation that corresponds to this graph is y = a cos (bx + c)+ d. Half of the distance from the maximum to the minimum value of the function is 4 ÷ 2 or 2. So, the amplitude is 2.
It appears that the function completes one period on Find b.
The midline appears to be at y = 1, so there is a vertical shift 1 unit up. Therefore, one equation that corresponds to this graph is y = 2 cos 4x + 1.
Write an equation for a sinusoidal function with the given period and amplitude that passes through the given point.
35. period: ; amplitude: 5; point:
SOLUTION: Use the period to find b.
Sample answer: One sinusoidal function in which a = 5 and b = 2 is y = 5 cos 2x. Evaluate the function for
The function passes through . Therefore, a sinusoidal function with period π and amplitude 5 that passes
through the point is y = 5 cos 2x.
37. period: ; amplitude: ; point:
SOLUTION: Use the period to find b.
Sample answer: One sinusoidal function in which a = 1.5 and b = 4 is y = 1.5 cos 4x. Evaluate the function for
The function passes through . Therefore, a sinusoidal function with period and amplitude 1.5 that passes
through the point is y = 1.5 cos 4x.
39. MULTIPLE REPRESENTATIONS In this problem, you will investigate the change in the graph of a sinusoidal function of the form y = sin x or y = cos x when multiplied by a polynomial function. a. GRAPHICAL Use a graphing calculator to sketch the graphs of y = 2x, y = –2x, and y = 2x cos x on the same coordinate plane, on the interval [–20, 20]. b. VERBAL Describe the behavior of the graph of y = 2x cos x in relation to the graphs of y = 2x and y = –2x.
c. GRAPHICAL Use a graphing calculator to sketch the graphs of y = x2, y = –x
2, and y = x
2 sin x on the same
coordinate plane, on the interval [–20, 20].
d. VERBAL Describe the behavior of the graph of y = x2 sin x in relation to the graphs of y = x
2 and y = –x
2.
e. ANALYTICAL Make a conjecture as to the behavior of the graph of a sinusoidal function of the form y = sin x or y = cos x when multiplied by polynomial function of the form y = f (x).
SOLUTION: a.
b. The graph of y = 2x cos x oscillates between the graphs of y = 2x and y = –2x. c.
d. The graph of y = x
2 sin x oscillates between the graphs of y = x
2 and y = –x
2.
e . The graph of y = f (x) sin x or y = f (x) cos x will oscillate between the graphs of y = f (x) and y = –f (x).
REASONING Determine whether each statement is true or false . Explain your reasoning.
41. Every sine function of the form y = a sin (bx + c) + d can be written as a cosine function of the form y = a cos (bx + c) + d.
SOLUTION: True; sample answer: The graph of cosine is a horizontal translation of the sine graph. Therefore, a cosine function can be written from any sine function using the same amplitude and period by applying the necessary phase shift.
43. CHALLENGE How many zeros does y = cos 1500x have on the interval 0 ≤ x ≤ 2 ?
SOLUTION: Find the period of y = cos 1500x.
Graph y = cos 1500x on .
The graph of y = cos 1500x has two x-intercepts for one cycle, so the function has 2 zeros per cycle. Find the
number of cycles for y = cos 1500x on [0, 2 ].
So, the graph of y = cos 1500x will complete 1500 cycles on [0, 2 ]. Because there are two zeros per cycle, y =
cos 1500x will have 1500(2) or 3000 zeros on [0, 2 ].
45. Writing in Math The Power Tower ride in Sandusky, Ohio, is shown below. Along the side of each tower is a string of lights that send a continuous pulse of light up and down each tower at a constant rate. Explain why the distance d of this light from the ground over time t cannot be represented by a sinusoidal function.
SOLUTION: Sample answer: Although the pulse of light can be represented as a function with a period, it is not a sinusoidal function because the distance the pulse of light is from the ground changes at a constant rate. As a result, the graph of this function would resemble the graph below.
The given point lies on the terminal side of an angle θ in standard position. Find the values of the six
trigonometric functions of θ. 47. (8, −2)
SOLUTION: Use the values of x and y to find r.
Use x = 8, y = –2, and r = to write the six trigonometric ratios.
49. (4, 5)
SOLUTION: Use the values of x and y to find r.
Use x = 4, y = 5, and r = to write the six trigonometric ratios.
Write each degree measure in radians as a multiple of π and each radian measure in degrees.
51. −420°
SOLUTION:
To convert a degree measure to radians, multiply by
53.
SOLUTION:
To convert a radian measure to degrees, multiply by
State the number of possible real zeros and turning points of each function. Then determine all of the real zeros by factoring.
55. f (x) = x3 + 2x
2 – 8x
SOLUTION: The degree of f (x) is 3, so it will have at most three real zeros and two turning points.
So, the zeros are −4, 0, and 2.
57. f (x) = x5 + 2x
4 – 4x
3 – 8x
2
SOLUTION: The degree of f (x) is 5, so it will have at most five real zeros and four turning points.
So, the zeros are −2, 0, and 2.
Determine whether f has an inverse function. If it does, find the inverse function and state any restrictions on its domain.
59. f (x) = −x – 2
SOLUTION:
Graph f (x) = −x – 2.
The graph of f passes the horizontal line test. Therefore, f is a one-to-one function and has an inverse function. From
the graph, you can see that f has domain (– , ) and range (– , ). Now find f–1
.
Because f–1
and f are the same function, the domain and range of f are equal to the domain and range of f–1
,
respectively. Therefore, it is not necessary to restrict the domain of f–1
.
61. f (x) = (x – 3)2 – 7
SOLUTION:
Graph f (x) = (x – 3)2 – 7.
The graph of f does not pass the horizontal line test. Therefore, f is not a one-to-one function and does not have an inverse function.
63. SAT/ACT If x + y = 90° and x and y are both nonnegative angles, what is equal to ?
A 0
B
C 1
D
E Cannot be determined from the information given.
SOLUTION:
If x + y = 90º, then x = 90º – y , and can be rewritten as . Let y = 60º.
Try a second angle. Let y = 45º.
Therefore, = 1, and the correct answer is C.
65. Identify the equation represented by the graph.
A y = sin 4x
B y = sin 2x
C y = 2 sin 2x
D y = 4 sin x
SOLUTION:
From the graph, it appears that the amplitude is 2 and the period is π. Use the period to find b.
So, the sine function represented by the graph could be y = 2 sin 2x. Therefore, the correct answer is C.
eSolutions Manual - Powered by Cognero Page 17
4-4 Graphing Sine and Cosine Functions

Describe how the graphs of f (x) and g (x) are related. Then find the amplitude of g (x), and sketch two periods of both functions on the same coordinate axes.
1. f (x) = sin x; g(x) = sin x
SOLUTION:
The graph of g(x) is the graph of f (x) compressed vertically. The amplitude of g(x) is or .
Create a table listing the coordinates of the x-intercepts and extrema for f (x) = sin x for one period, 2 , on the
interval [0, 2 ]. Then use the amplitude of g(x) to find corresponding points on its graph.
Sketch the curve through the indicated points for each function. Then repeat the pattern to complete a second period.
Functions x-intercept Maximum x-intercept Minimum x-intercept
f (x) = sin x (0, 0)
( , 0)
(2π, 0)
g(x) = sin x
(0, 0)
( , 0)
(2π, 0)
3. f (x) = cos x; g(x) = 6 cos x
SOLUTION:
The graph of g(x) is the graph of f (x) expanded vertically. The amplitude of g(x) is or 6.
Create a table listing the coordinates of the x-intercepts and extrema for f (x) = cos x for one period, 2 , on the
interval [0, 2 ]. Then use the amplitude of g(x) to find corresponding points on its graph.
Sketch the curve through the indicated points for each function. Then repeat the pattern to complete a second period.
Functions Maximum x-intercept Minimum x-intercept Maximum
f (x) = cos x
g(x) = 6 cos x
Describe how the graphs of f (x) and g (x) are related. Then find the period of g (x), and sketch at least oneperiod of both functions on the same coordinate axes.
5. f (x) = sin x; g(x) = sin 4x
SOLUTION:
The graph of g(x) is the graph of f (x) compressed horizontally. The period of g(x) is or . To find
corresponding points on the graph of g(x), change the x-coordinates of those key points on f (x) so that they range
from 0 to , increasing by increments of or .
Sketch the curve through the indicated points for each function. Then repeat the pattern to complete a second period.
Functions x-intercept Maximum x-intercept Minimum x-intercept
f (x) = sin x (0, 0)
(π, 0)
(2π, 0)
g(x) = sin 4x (0, 0)
7. f (x) = cos x; g(x) = cos 0.2x
SOLUTION:
The graph of g(x) is the graph of f (x) expanded horizontally. The period of g(x) is or . To find
corresponding points on the graph of g(x), change the x-coordinates of those key points on f (x) so that they range
from 0 to , increasing by increments of or .
Sketch the curve through the indicated points for each function. Then repeat the pattern to complete a second period.
Functions Maximum x-intercept Minimum x-intercept Maximum
f (x) = cos x (0, 1)
g(x) = cos x
(0, 1)
9. VOICES The contralto vocal type includes the deepest female singing voice. Some contraltos can sing as low as the E below middle C (E3), which has a frequency of 165 hertz. Write an equation for a sine function that models the initial behavior of the sound wave associated with E3 having an amplitude of 0.15.
SOLUTION:
The general form of the equation will be y = a sin bt, where t is the time in seconds. Because the amplitude is 0.15, a = 0.15. This means that a = ±0.15.
The period is the reciprocal of the frequency or . Use this value to find b.
Sample answer: One sine function that models the initial behavior is y = 0.15 sin 330 t.
Write a sine function that can be used to model the initial behavior of a sound wave with the frequency and amplitude given.
11. f = 932, a = 0.25
SOLUTION:
The general form of the equation is y = a sin bt, where t is the time in seconds. Because the amplitude is 0.25, =
0.25. This means that a = ±0.25.
The period is the reciprocal of the frequency or . Use this value to find b.
Using the positive values of a and b, one sine function that models the initial behavior is y = 0.25 sin 1864 t.
13. f = 623, a = 0.2
SOLUTION:
The general form of the equation is y = a sin bt, where t is the time in seconds. Because the amplitude is 0.2, =
0.2. This means that a = ±0.2.
The period is the reciprocal of the frequency or . Use this value to find b.
Using the positive values of a and b, one sine function that models the initial behavior is y = 0.2 sin 1246 t.
State the amplitude, period, frequency, phase shift, and vertical shift of each function. Then graph two periods of the function.
15.
SOLUTION:
In this function, a = 1, b = 1, c = , and d = 0. Because d = 0, there is no vertical shift.
Graph y = 3 cos x shifted units to the right.
17. y = sin 3x – 2
SOLUTION: In this function, a = 1, b = 3, c = 0, and d = –2.
Graph y = sin 3x shifted 2 units down.
19.
SOLUTION:
In this function, a = 1, b = 1, c = , and d = 4.
.
Graph y = sin x shifted units to the right and 4 units up.
21. TIDES The table shown below provides data for the first high and low tides of the day for a certain bay during oneday in June.
a. Determine the amplitude, period, phase shift, and vertical shift of a sinusoidal function that models the height of the tide. Let x represent the number of hours that the high or low tide occurred after midnight and y represent the height of the wave in feet. b. Write a sinusoidal function that models the data. c. According to your model, what was the height of the tide at 8:45 P.M. that night?
SOLUTION: a. Sample answer: Use a sinusoidal function of the form y = a cos (bx + c) + d to model the data. First, find the amplitude a, which is half of the distance between the heights of the high and low tides.
The vertical shift d is the average of the heights of the high and low tides.
A sinusoid completes half of a period in the time that it takes to go from its maximum to its minimum value. One
period is twice this time. The first high tide occurs at 4:25 A.M. or x = 4.417 and the first low tide occurs at 10:55
A.M. or x = 10.917.
Because the period of a sinusoidal function is you can write Therefore,
The maximum data value occurs when x ≈ 4.417. Since y = cos x attains its first maximum when x = 0, we must
apply a phase shift of 4.417 − 0 or 4.417 units. Use this value to find c.
b. Write a function using the values for a, b, c, and d. Use b =
c. To find the height of the water at 8:45 P.M. that night, evaluate the model for x = 20.75.
Therefore, the tide was about 7.28 feet high at 8:45 P.M. that night.
GRAPHING CALCULATOR Find the values of x in the interval – < x < that make each equation or inequality true. (Hint: Use the intersection function.)
23. –sin x = cos x
SOLUTION:
Graph y = −sin x and y = cos x on the same graphing calculator screen on (−π, π). Use the intersect feature under the CALC menu to determine where the two graphs intersect.
The graphs intersect at about −0.7854 or − and about 2.356 or . Therefore, on –π < x < π, –sin x = cos x
when x = − and .
25. sin x + cos x = 0
SOLUTION:
Graph y = sin x + cos x on (−π, π). Use the zero feature under the CALC menu to determine the zeros of the function.
There are zeros at about −0.785 or − or and about 2.356 or . Therefore, on – < x < , sin x + cos x = 0
when x =
27. sin x cos x > 1
SOLUTION:
Graph y = sin x cos x and y = 1 on (− , ). Use the intersect feature under the CALC menu to determine on what interval(s) sin x cos x > 1.
The graphs do not intersect. Therefore, y = sin x cos x is not greater than y = 1 for any values of x on – < x < .
29. CAROUSELS A wooden horse on a carousel moves up and down as the carousel spins. When the ride ends, the horse usually stops in a vertical position different from where it started. The position y of the horse after t seconds can be modeled by y = 1.5 sin (2t + c), where the phase shift c must be continuously adjusted to compensate for the
different starting positions. If during one ride the horse reached a maximum height after seconds, find the
equation that models the horse’s position.
SOLUTION: First, find the period of y = 1.5 sin (2t + c).
Since the period is π, the function will reach a maximum height at radians. The phase shift is the difference
between the horizontal position of the function at and radians, which is radians. Substitute and b into
the phase shift formula to find c.
Therefore, the equation is
Write an equation that corresponds to each graph.
31.
SOLUTION: Sample answer: There is an x-intercept at 0, so one equation that corresponds to this graph is y = a sin (bx + c) + d. Half of the distance from the maximum to the minimum value of the function is 3. So, the amplitude is 3. It appears that the function completes one period on [0, π]. Find b.
The midline appears to be at y = 0, so there does not appear to be any vertical shift. Therefore, one equation that corresponds to this graph is y = 3 sin (2x).
33.
SOLUTION: Sample answer: Because there is a y-intercept at 3, one equation that corresponds to this graph is y = a cos (bx + c)+ d. Half of the distance from the maximum to the minimum value of the function is 4 ÷ 2 or 2. So, the amplitude is 2.
It appears that the function completes one period on Find b.
The midline appears to be at y = 1, so there is a vertical shift 1 unit up. Therefore, one equation that corresponds to this graph is y = 2 cos 4x + 1.
Write an equation for a sinusoidal function with the given period and amplitude that passes through the given point.
35. period: ; amplitude: 5; point:
SOLUTION: Use the period to find b.
Sample answer: One sinusoidal function in which a = 5 and b = 2 is y = 5 cos 2x. Evaluate the function for
The function passes through . Therefore, a sinusoidal function with period π and amplitude 5 that passes
through the point is y = 5 cos 2x.
37. period: ; amplitude: ; point:
SOLUTION: Use the period to find b.
Sample answer: One sinusoidal function in which a = 1.5 and b = 4 is y = 1.5 cos 4x. Evaluate the function for
The function passes through . Therefore, a sinusoidal function with period and amplitude 1.5 that passes
through the point is y = 1.5 cos 4x.
39. MULTIPLE REPRESENTATIONS In this problem, you will investigate the change in the graph of a sinusoidal function of the form y = sin x or y = cos x when multiplied by a polynomial function. a. GRAPHICAL Use a graphing calculator to sketch the graphs of y = 2x, y = –2x, and y = 2x cos x on the same coordinate plane, on the interval [–20, 20]. b. VERBAL Describe the behavior of the graph of y = 2x cos x in relation to the graphs of y = 2x and y = –2x.
c. GRAPHICAL Use a graphing calculator to sketch the graphs of y = x2, y = –x
2, and y = x
2 sin x on the same
coordinate plane, on the interval [–20, 20].
d. VERBAL Describe the behavior of the graph of y = x2 sin x in relation to the graphs of y = x
2 and y = –x
2.
e. ANALYTICAL Make a conjecture as to the behavior of the graph of a sinusoidal function of the form y = sin x or y = cos x when multiplied by polynomial function of the form y = f (x).
SOLUTION: a.
b. The graph of y = 2x cos x oscillates between the graphs of y = 2x and y = –2x. c.
d. The graph of y = x
2 sin x oscillates between the graphs of y = x
2 and y = –x
2.
e . The graph of y = f (x) sin x or y = f (x) cos x will oscillate between the graphs of y = f (x) and y = –f (x).
REASONING Determine whether each statement is true or false . Explain your reasoning.
41. Every sine function of the form y = a sin (bx + c) + d can be written as a cosine function of the form y = a cos (bx + c) + d.
SOLUTION: True; sample answer: The graph of cosine is a horizontal translation of the sine graph. Therefore, a cosine function can be written from any sine function using the same amplitude and period by applying the necessary phase shift.
43. CHALLENGE How many zeros does y = cos 1500x have on the interval 0 ≤ x ≤ 2 ?
SOLUTION: Find the period of y = cos 1500x.
Graph y = cos 1500x on .
The graph of y = cos 1500x has two x-intercepts for one cycle, so the function has 2 zeros per cycle. Find the
number of cycles for y = cos 1500x on [0, 2 ].
So, the graph of y = cos 1500x will complete 1500 cycles on [0, 2 ]. Because there are two zeros per cycle, y =
cos 1500x will have 1500(2) or 3000 zeros on [0, 2 ].
45. Writing in Math The Power Tower ride in Sandusky, Ohio, is shown below. Along the side of each tower is a string of lights that send a continuous pulse of light up and down each tower at a constant rate. Explain why the distance d of this light from the ground over time t cannot be represented by a sinusoidal function.
SOLUTION: Sample answer: Although the pulse of light can be represented as a function with a period, it is not a sinusoidal function because the distance the pulse of light is from the ground changes at a constant rate. As a result, the graph of this function would resemble the graph below.
The given point lies on the terminal side of an angle θ in standard position. Find the values of the six
trigonometric functions of θ. 47. (8, −2)
SOLUTION: Use the values of x and y to find r.
Use x = 8, y = –2, and r = to write the six trigonometric ratios.
49. (4, 5)
SOLUTION: Use the values of x and y to find r.
Use x = 4, y = 5, and r = to write the six trigonometric ratios.
Write each degree measure in radians as a multiple of π and each radian measure in degrees.
51. −420°
SOLUTION:
To convert a degree measure to radians, multiply by
53.
SOLUTION:
To convert a radian measure to degrees, multiply by
State the number of possible real zeros and turning points of each function. Then determine all of the real zeros by factoring.
55. f (x) = x3 + 2x
2 – 8x
SOLUTION: The degree of f (x) is 3, so it will have at most three real zeros and two turning points.
So, the zeros are −4, 0, and 2.
57. f (x) = x5 + 2x
4 – 4x
3 – 8x
2
SOLUTION: The degree of f (x) is 5, so it will have at most five real zeros and four turning points.
So, the zeros are −2, 0, and 2.
Determine whether f has an inverse function. If it does, find the inverse function and state any restrictions on its domain.
59. f (x) = −x – 2
SOLUTION:
Graph f (x) = −x – 2.
The graph of f passes the horizontal line test. Therefore, f is a one-to-one function and has an inverse function. From
the graph, you can see that f has domain (– , ) and range (– , ). Now find f–1
.
Because f–1
and f are the same function, the domain and range of f are equal to the domain and range of f–1
,
respectively. Therefore, it is not necessary to restrict the domain of f–1
.
61. f (x) = (x – 3)2 – 7
SOLUTION:
Graph f (x) = (x – 3)2 – 7.
The graph of f does not pass the horizontal line test. Therefore, f is not a one-to-one function and does not have an inverse function.
63. SAT/ACT If x + y = 90° and x and y are both nonnegative angles, what is equal to ?
A 0
B
C 1
D
E Cannot be determined from the information given.
SOLUTION:
If x + y = 90º, then x = 90º – y , and can be rewritten as . Let y = 60º.
Try a second angle. Let y = 45º.
Therefore, = 1, and the correct answer is C.
65. Identify the equation represented by the graph.
A y = sin 4x
B y = sin 2x
C y = 2 sin 2x
D y = 4 sin x
SOLUTION:
From the graph, it appears that the amplitude is 2 and the period is π. Use the period to find b.
So, the sine function represented by the graph could be y = 2 sin 2x. Therefore, the correct answer is C.
eSolutions Manual - Powered by Cognero Page 18
4-4 Graphing Sine and Cosine Functions
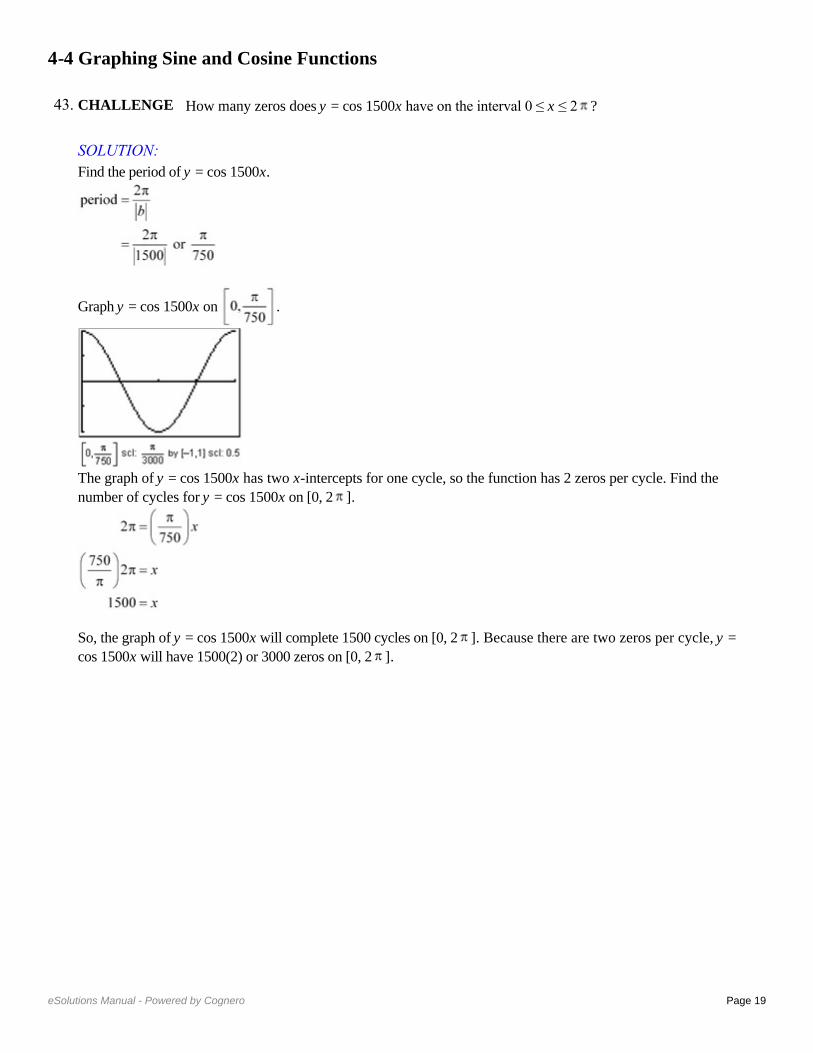
Describe how the graphs of f (x) and g (x) are related. Then find the amplitude of g (x), and sketch two periods of both functions on the same coordinate axes.
1. f (x) = sin x; g(x) = sin x
SOLUTION:
The graph of g(x) is the graph of f (x) compressed vertically. The amplitude of g(x) is or .
Create a table listing the coordinates of the x-intercepts and extrema for f (x) = sin x for one period, 2 , on the
interval [0, 2 ]. Then use the amplitude of g(x) to find corresponding points on its graph.
Sketch the curve through the indicated points for each function. Then repeat the pattern to complete a second period.
Functions x-intercept Maximum x-intercept Minimum x-intercept
f (x) = sin x (0, 0)
( , 0)
(2π, 0)
g(x) = sin x
(0, 0)
( , 0)
(2π, 0)
3. f (x) = cos x; g(x) = 6 cos x
SOLUTION:
The graph of g(x) is the graph of f (x) expanded vertically. The amplitude of g(x) is or 6.
Create a table listing the coordinates of the x-intercepts and extrema for f (x) = cos x for one period, 2 , on the
interval [0, 2 ]. Then use the amplitude of g(x) to find corresponding points on its graph.
Sketch the curve through the indicated points for each function. Then repeat the pattern to complete a second period.
Functions Maximum x-intercept Minimum x-intercept Maximum
f (x) = cos x
g(x) = 6 cos x
Describe how the graphs of f (x) and g (x) are related. Then find the period of g (x), and sketch at least oneperiod of both functions on the same coordinate axes.
5. f (x) = sin x; g(x) = sin 4x
SOLUTION:
The graph of g(x) is the graph of f (x) compressed horizontally. The period of g(x) is or . To find
corresponding points on the graph of g(x), change the x-coordinates of those key points on f (x) so that they range
from 0 to , increasing by increments of or .
Sketch the curve through the indicated points for each function. Then repeat the pattern to complete a second period.
Functions x-intercept Maximum x-intercept Minimum x-intercept
f (x) = sin x (0, 0)
(π, 0)
(2π, 0)
g(x) = sin 4x (0, 0)
7. f (x) = cos x; g(x) = cos 0.2x
SOLUTION:
The graph of g(x) is the graph of f (x) expanded horizontally. The period of g(x) is or . To find
corresponding points on the graph of g(x), change the x-coordinates of those key points on f (x) so that they range
from 0 to , increasing by increments of or .
Sketch the curve through the indicated points for each function. Then repeat the pattern to complete a second period.
Functions Maximum x-intercept Minimum x-intercept Maximum
f (x) = cos x (0, 1)
g(x) = cos x
(0, 1)
9. VOICES The contralto vocal type includes the deepest female singing voice. Some contraltos can sing as low as the E below middle C (E3), which has a frequency of 165 hertz. Write an equation for a sine function that models the initial behavior of the sound wave associated with E3 having an amplitude of 0.15.
SOLUTION:
The general form of the equation will be y = a sin bt, where t is the time in seconds. Because the amplitude is 0.15, a = 0.15. This means that a = ±0.15.
The period is the reciprocal of the frequency or . Use this value to find b.
Sample answer: One sine function that models the initial behavior is y = 0.15 sin 330 t.
Write a sine function that can be used to model the initial behavior of a sound wave with the frequency and amplitude given.
11. f = 932, a = 0.25
SOLUTION:
The general form of the equation is y = a sin bt, where t is the time in seconds. Because the amplitude is 0.25, =
0.25. This means that a = ±0.25.
The period is the reciprocal of the frequency or . Use this value to find b.
Using the positive values of a and b, one sine function that models the initial behavior is y = 0.25 sin 1864 t.
13. f = 623, a = 0.2
SOLUTION:
The general form of the equation is y = a sin bt, where t is the time in seconds. Because the amplitude is 0.2, =
0.2. This means that a = ±0.2.
The period is the reciprocal of the frequency or . Use this value to find b.
Using the positive values of a and b, one sine function that models the initial behavior is y = 0.2 sin 1246 t.
State the amplitude, period, frequency, phase shift, and vertical shift of each function. Then graph two periods of the function.
15.
SOLUTION:
In this function, a = 1, b = 1, c = , and d = 0. Because d = 0, there is no vertical shift.
Graph y = 3 cos x shifted units to the right.
17. y = sin 3x – 2
SOLUTION: In this function, a = 1, b = 3, c = 0, and d = –2.
Graph y = sin 3x shifted 2 units down.
19.
SOLUTION:
In this function, a = 1, b = 1, c = , and d = 4.
.
Graph y = sin x shifted units to the right and 4 units up.
21. TIDES The table shown below provides data for the first high and low tides of the day for a certain bay during oneday in June.
a. Determine the amplitude, period, phase shift, and vertical shift of a sinusoidal function that models the height of the tide. Let x represent the number of hours that the high or low tide occurred after midnight and y represent the height of the wave in feet. b. Write a sinusoidal function that models the data. c. According to your model, what was the height of the tide at 8:45 P.M. that night?
SOLUTION: a. Sample answer: Use a sinusoidal function of the form y = a cos (bx + c) + d to model the data. First, find the amplitude a, which is half of the distance between the heights of the high and low tides.
The vertical shift d is the average of the heights of the high and low tides.
A sinusoid completes half of a period in the time that it takes to go from its maximum to its minimum value. One
period is twice this time. The first high tide occurs at 4:25 A.M. or x = 4.417 and the first low tide occurs at 10:55
A.M. or x = 10.917.
Because the period of a sinusoidal function is you can write Therefore,
The maximum data value occurs when x ≈ 4.417. Since y = cos x attains its first maximum when x = 0, we must
apply a phase shift of 4.417 − 0 or 4.417 units. Use this value to find c.
b. Write a function using the values for a, b, c, and d. Use b =
c. To find the height of the water at 8:45 P.M. that night, evaluate the model for x = 20.75.
Therefore, the tide was about 7.28 feet high at 8:45 P.M. that night.
GRAPHING CALCULATOR Find the values of x in the interval – < x < that make each equation or inequality true. (Hint: Use the intersection function.)
23. –sin x = cos x
SOLUTION:
Graph y = −sin x and y = cos x on the same graphing calculator screen on (−π, π). Use the intersect feature under the CALC menu to determine where the two graphs intersect.
The graphs intersect at about −0.7854 or − and about 2.356 or . Therefore, on –π < x < π, –sin x = cos x
when x = − and .
25. sin x + cos x = 0
SOLUTION:
Graph y = sin x + cos x on (−π, π). Use the zero feature under the CALC menu to determine the zeros of the function.
There are zeros at about −0.785 or − or and about 2.356 or . Therefore, on – < x < , sin x + cos x = 0
when x =
27. sin x cos x > 1
SOLUTION:
Graph y = sin x cos x and y = 1 on (− , ). Use the intersect feature under the CALC menu to determine on what interval(s) sin x cos x > 1.
The graphs do not intersect. Therefore, y = sin x cos x is not greater than y = 1 for any values of x on – < x < .
29. CAROUSELS A wooden horse on a carousel moves up and down as the carousel spins. When the ride ends, the horse usually stops in a vertical position different from where it started. The position y of the horse after t seconds can be modeled by y = 1.5 sin (2t + c), where the phase shift c must be continuously adjusted to compensate for the
different starting positions. If during one ride the horse reached a maximum height after seconds, find the
equation that models the horse’s position.
SOLUTION: First, find the period of y = 1.5 sin (2t + c).
Since the period is π, the function will reach a maximum height at radians. The phase shift is the difference
between the horizontal position of the function at and radians, which is radians. Substitute and b into
the phase shift formula to find c.
Therefore, the equation is
Write an equation that corresponds to each graph.
31.
SOLUTION: Sample answer: There is an x-intercept at 0, so one equation that corresponds to this graph is y = a sin (bx + c) + d. Half of the distance from the maximum to the minimum value of the function is 3. So, the amplitude is 3. It appears that the function completes one period on [0, π]. Find b.
The midline appears to be at y = 0, so there does not appear to be any vertical shift. Therefore, one equation that corresponds to this graph is y = 3 sin (2x).
33.
SOLUTION: Sample answer: Because there is a y-intercept at 3, one equation that corresponds to this graph is y = a cos (bx + c)+ d. Half of the distance from the maximum to the minimum value of the function is 4 ÷ 2 or 2. So, the amplitude is 2.
It appears that the function completes one period on Find b.
The midline appears to be at y = 1, so there is a vertical shift 1 unit up. Therefore, one equation that corresponds to this graph is y = 2 cos 4x + 1.
Write an equation for a sinusoidal function with the given period and amplitude that passes through the given point.
35. period: ; amplitude: 5; point:
SOLUTION: Use the period to find b.
Sample answer: One sinusoidal function in which a = 5 and b = 2 is y = 5 cos 2x. Evaluate the function for
The function passes through . Therefore, a sinusoidal function with period π and amplitude 5 that passes
through the point is y = 5 cos 2x.
37. period: ; amplitude: ; point:
SOLUTION: Use the period to find b.
Sample answer: One sinusoidal function in which a = 1.5 and b = 4 is y = 1.5 cos 4x. Evaluate the function for
The function passes through . Therefore, a sinusoidal function with period and amplitude 1.5 that passes
through the point is y = 1.5 cos 4x.
39. MULTIPLE REPRESENTATIONS In this problem, you will investigate the change in the graph of a sinusoidal function of the form y = sin x or y = cos x when multiplied by a polynomial function. a. GRAPHICAL Use a graphing calculator to sketch the graphs of y = 2x, y = –2x, and y = 2x cos x on the same coordinate plane, on the interval [–20, 20]. b. VERBAL Describe the behavior of the graph of y = 2x cos x in relation to the graphs of y = 2x and y = –2x.
c. GRAPHICAL Use a graphing calculator to sketch the graphs of y = x2, y = –x
2, and y = x
2 sin x on the same
coordinate plane, on the interval [–20, 20].
d. VERBAL Describe the behavior of the graph of y = x2 sin x in relation to the graphs of y = x
2 and y = –x
2.
e. ANALYTICAL Make a conjecture as to the behavior of the graph of a sinusoidal function of the form y = sin x or y = cos x when multiplied by polynomial function of the form y = f (x).
SOLUTION: a.
b. The graph of y = 2x cos x oscillates between the graphs of y = 2x and y = –2x. c.
d. The graph of y = x
2 sin x oscillates between the graphs of y = x
2 and y = –x
2.
e . The graph of y = f (x) sin x or y = f (x) cos x will oscillate between the graphs of y = f (x) and y = –f (x).
REASONING Determine whether each statement is true or false . Explain your reasoning.
41. Every sine function of the form y = a sin (bx + c) + d can be written as a cosine function of the form y = a cos (bx + c) + d.
SOLUTION: True; sample answer: The graph of cosine is a horizontal translation of the sine graph. Therefore, a cosine function can be written from any sine function using the same amplitude and period by applying the necessary phase shift.
43. CHALLENGE How many zeros does y = cos 1500x have on the interval 0 ≤ x ≤ 2 ?
SOLUTION: Find the period of y = cos 1500x.
Graph y = cos 1500x on .
The graph of y = cos 1500x has two x-intercepts for one cycle, so the function has 2 zeros per cycle. Find the
number of cycles for y = cos 1500x on [0, 2 ].
So, the graph of y = cos 1500x will complete 1500 cycles on [0, 2 ]. Because there are two zeros per cycle, y =
cos 1500x will have 1500(2) or 3000 zeros on [0, 2 ].
45. Writing in Math The Power Tower ride in Sandusky, Ohio, is shown below. Along the side of each tower is a string of lights that send a continuous pulse of light up and down each tower at a constant rate. Explain why the distance d of this light from the ground over time t cannot be represented by a sinusoidal function.
SOLUTION: Sample answer: Although the pulse of light can be represented as a function with a period, it is not a sinusoidal function because the distance the pulse of light is from the ground changes at a constant rate. As a result, the graph of this function would resemble the graph below.
The given point lies on the terminal side of an angle θ in standard position. Find the values of the six
trigonometric functions of θ. 47. (8, −2)
SOLUTION: Use the values of x and y to find r.
Use x = 8, y = –2, and r = to write the six trigonometric ratios.
49. (4, 5)
SOLUTION: Use the values of x and y to find r.
Use x = 4, y = 5, and r = to write the six trigonometric ratios.
Write each degree measure in radians as a multiple of π and each radian measure in degrees.
51. −420°
SOLUTION:
To convert a degree measure to radians, multiply by
53.
SOLUTION:
To convert a radian measure to degrees, multiply by
State the number of possible real zeros and turning points of each function. Then determine all of the real zeros by factoring.
55. f (x) = x3 + 2x
2 – 8x
SOLUTION: The degree of f (x) is 3, so it will have at most three real zeros and two turning points.
So, the zeros are −4, 0, and 2.
57. f (x) = x5 + 2x
4 – 4x
3 – 8x
2
SOLUTION: The degree of f (x) is 5, so it will have at most five real zeros and four turning points.
So, the zeros are −2, 0, and 2.
Determine whether f has an inverse function. If it does, find the inverse function and state any restrictions on its domain.
59. f (x) = −x – 2
SOLUTION:
Graph f (x) = −x – 2.
The graph of f passes the horizontal line test. Therefore, f is a one-to-one function and has an inverse function. From
the graph, you can see that f has domain (– , ) and range (– , ). Now find f–1
.
Because f–1
and f are the same function, the domain and range of f are equal to the domain and range of f–1
,
respectively. Therefore, it is not necessary to restrict the domain of f–1
.
61. f (x) = (x – 3)2 – 7
SOLUTION:
Graph f (x) = (x – 3)2 – 7.
The graph of f does not pass the horizontal line test. Therefore, f is not a one-to-one function and does not have an inverse function.
63. SAT/ACT If x + y = 90° and x and y are both nonnegative angles, what is equal to ?
A 0
B
C 1
D
E Cannot be determined from the information given.
SOLUTION:
If x + y = 90º, then x = 90º – y , and can be rewritten as . Let y = 60º.
Try a second angle. Let y = 45º.
Therefore, = 1, and the correct answer is C.
65. Identify the equation represented by the graph.
A y = sin 4x
B y = sin 2x
C y = 2 sin 2x
D y = 4 sin x
SOLUTION:
From the graph, it appears that the amplitude is 2 and the period is π. Use the period to find b.
So, the sine function represented by the graph could be y = 2 sin 2x. Therefore, the correct answer is C.
eSolutions Manual - Powered by Cognero Page 19
4-4 Graphing Sine and Cosine Functions
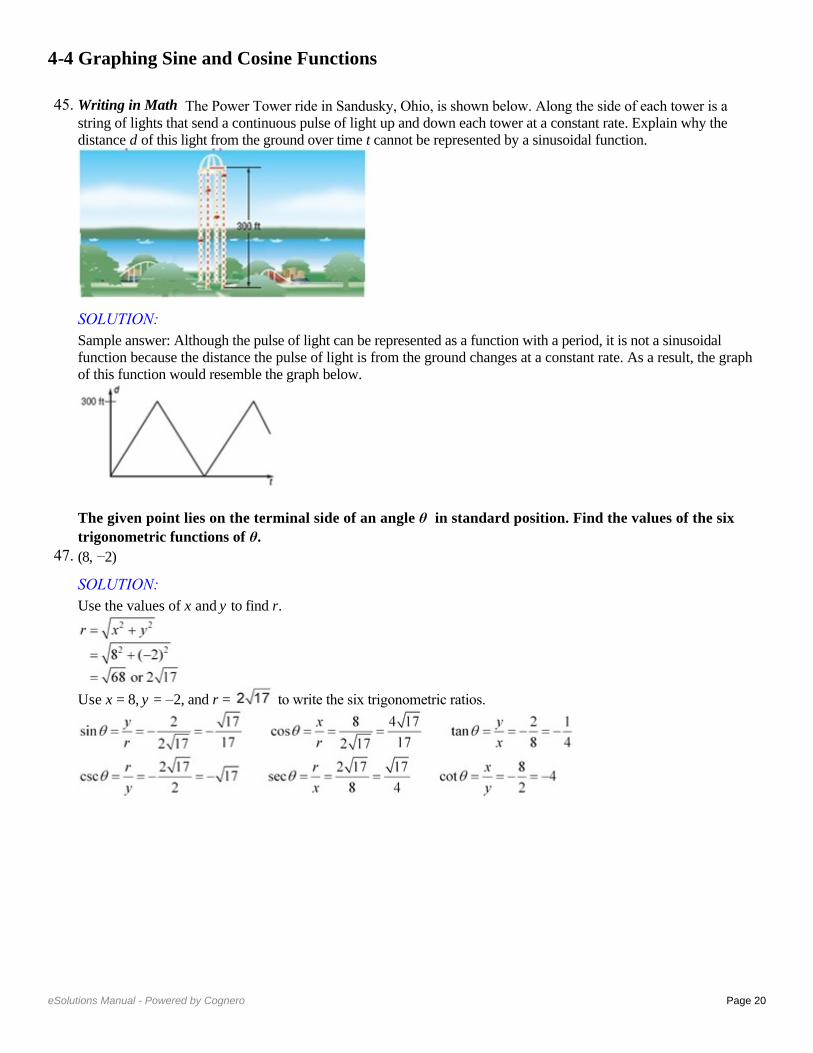
Describe how the graphs of f (x) and g (x) are related. Then find the amplitude of g (x), and sketch two periods of both functions on the same coordinate axes.
1. f (x) = sin x; g(x) = sin x
SOLUTION:
The graph of g(x) is the graph of f (x) compressed vertically. The amplitude of g(x) is or .
Create a table listing the coordinates of the x-intercepts and extrema for f (x) = sin x for one period, 2 , on the
interval [0, 2 ]. Then use the amplitude of g(x) to find corresponding points on its graph.
Sketch the curve through the indicated points for each function. Then repeat the pattern to complete a second period.
Functions x-intercept Maximum x-intercept Minimum x-intercept
f (x) = sin x (0, 0)
( , 0)
(2π, 0)
g(x) = sin x
(0, 0)
( , 0)
(2π, 0)
3. f (x) = cos x; g(x) = 6 cos x
SOLUTION:
The graph of g(x) is the graph of f (x) expanded vertically. The amplitude of g(x) is or 6.
Create a table listing the coordinates of the x-intercepts and extrema for f (x) = cos x for one period, 2 , on the
interval [0, 2 ]. Then use the amplitude of g(x) to find corresponding points on its graph.
Sketch the curve through the indicated points for each function. Then repeat the pattern to complete a second period.
Functions Maximum x-intercept Minimum x-intercept Maximum
f (x) = cos x
g(x) = 6 cos x
Describe how the graphs of f (x) and g (x) are related. Then find the period of g (x), and sketch at least oneperiod of both functions on the same coordinate axes.
5. f (x) = sin x; g(x) = sin 4x
SOLUTION:
The graph of g(x) is the graph of f (x) compressed horizontally. The period of g(x) is or . To find
corresponding points on the graph of g(x), change the x-coordinates of those key points on f (x) so that they range
from 0 to , increasing by increments of or .
Sketch the curve through the indicated points for each function. Then repeat the pattern to complete a second period.
Functions x-intercept Maximum x-intercept Minimum x-intercept
f (x) = sin x (0, 0)
(π, 0)
(2π, 0)
g(x) = sin 4x (0, 0)
7. f (x) = cos x; g(x) = cos 0.2x
SOLUTION:
The graph of g(x) is the graph of f (x) expanded horizontally. The period of g(x) is or . To find
corresponding points on the graph of g(x), change the x-coordinates of those key points on f (x) so that they range
from 0 to , increasing by increments of or .
Sketch the curve through the indicated points for each function. Then repeat the pattern to complete a second period.
Functions Maximum x-intercept Minimum x-intercept Maximum
f (x) = cos x (0, 1)
g(x) = cos x
(0, 1)
9. VOICES The contralto vocal type includes the deepest female singing voice. Some contraltos can sing as low as the E below middle C (E3), which has a frequency of 165 hertz. Write an equation for a sine function that models the initial behavior of the sound wave associated with E3 having an amplitude of 0.15.
SOLUTION:
The general form of the equation will be y = a sin bt, where t is the time in seconds. Because the amplitude is 0.15, a = 0.15. This means that a = ±0.15.
The period is the reciprocal of the frequency or . Use this value to find b.
Sample answer: One sine function that models the initial behavior is y = 0.15 sin 330 t.
Write a sine function that can be used to model the initial behavior of a sound wave with the frequency and amplitude given.
11. f = 932, a = 0.25
SOLUTION:
The general form of the equation is y = a sin bt, where t is the time in seconds. Because the amplitude is 0.25, =
0.25. This means that a = ±0.25.
The period is the reciprocal of the frequency or . Use this value to find b.
Using the positive values of a and b, one sine function that models the initial behavior is y = 0.25 sin 1864 t.
13. f = 623, a = 0.2
SOLUTION:
The general form of the equation is y = a sin bt, where t is the time in seconds. Because the amplitude is 0.2, =
0.2. This means that a = ±0.2.
The period is the reciprocal of the frequency or . Use this value to find b.
Using the positive values of a and b, one sine function that models the initial behavior is y = 0.2 sin 1246 t.
State the amplitude, period, frequency, phase shift, and vertical shift of each function. Then graph two periods of the function.
15.
SOLUTION:
In this function, a = 1, b = 1, c = , and d = 0. Because d = 0, there is no vertical shift.
Graph y = 3 cos x shifted units to the right.
17. y = sin 3x – 2
SOLUTION: In this function, a = 1, b = 3, c = 0, and d = –2.
Graph y = sin 3x shifted 2 units down.
19.
SOLUTION:
In this function, a = 1, b = 1, c = , and d = 4.
.
Graph y = sin x shifted units to the right and 4 units up.
21. TIDES The table shown below provides data for the first high and low tides of the day for a certain bay during oneday in June.
a. Determine the amplitude, period, phase shift, and vertical shift of a sinusoidal function that models the height of the tide. Let x represent the number of hours that the high or low tide occurred after midnight and y represent the height of the wave in feet. b. Write a sinusoidal function that models the data. c. According to your model, what was the height of the tide at 8:45 P.M. that night?
SOLUTION: a. Sample answer: Use a sinusoidal function of the form y = a cos (bx + c) + d to model the data. First, find the amplitude a, which is half of the distance between the heights of the high and low tides.
The vertical shift d is the average of the heights of the high and low tides.
A sinusoid completes half of a period in the time that it takes to go from its maximum to its minimum value. One
period is twice this time. The first high tide occurs at 4:25 A.M. or x = 4.417 and the first low tide occurs at 10:55
A.M. or x = 10.917.
Because the period of a sinusoidal function is you can write Therefore,
The maximum data value occurs when x ≈ 4.417. Since y = cos x attains its first maximum when x = 0, we must
apply a phase shift of 4.417 − 0 or 4.417 units. Use this value to find c.
b. Write a function using the values for a, b, c, and d. Use b =
c. To find the height of the water at 8:45 P.M. that night, evaluate the model for x = 20.75.
Therefore, the tide was about 7.28 feet high at 8:45 P.M. that night.
GRAPHING CALCULATOR Find the values of x in the interval – < x < that make each equation or inequality true. (Hint: Use the intersection function.)
23. –sin x = cos x
SOLUTION:
Graph y = −sin x and y = cos x on the same graphing calculator screen on (−π, π). Use the intersect feature under the CALC menu to determine where the two graphs intersect.
The graphs intersect at about −0.7854 or − and about 2.356 or . Therefore, on –π < x < π, –sin x = cos x
when x = − and .
25. sin x + cos x = 0
SOLUTION:
Graph y = sin x + cos x on (−π, π). Use the zero feature under the CALC menu to determine the zeros of the function.
There are zeros at about −0.785 or − or and about 2.356 or . Therefore, on – < x < , sin x + cos x = 0
when x =
27. sin x cos x > 1
SOLUTION:
Graph y = sin x cos x and y = 1 on (− , ). Use the intersect feature under the CALC menu to determine on what interval(s) sin x cos x > 1.
The graphs do not intersect. Therefore, y = sin x cos x is not greater than y = 1 for any values of x on – < x < .
29. CAROUSELS A wooden horse on a carousel moves up and down as the carousel spins. When the ride ends, the horse usually stops in a vertical position different from where it started. The position y of the horse after t seconds can be modeled by y = 1.5 sin (2t + c), where the phase shift c must be continuously adjusted to compensate for the
different starting positions. If during one ride the horse reached a maximum height after seconds, find the
equation that models the horse’s position.
SOLUTION: First, find the period of y = 1.5 sin (2t + c).
Since the period is π, the function will reach a maximum height at radians. The phase shift is the difference
between the horizontal position of the function at and radians, which is radians. Substitute and b into
the phase shift formula to find c.
Therefore, the equation is
Write an equation that corresponds to each graph.
31.
SOLUTION: Sample answer: There is an x-intercept at 0, so one equation that corresponds to this graph is y = a sin (bx + c) + d. Half of the distance from the maximum to the minimum value of the function is 3. So, the amplitude is 3. It appears that the function completes one period on [0, π]. Find b.
The midline appears to be at y = 0, so there does not appear to be any vertical shift. Therefore, one equation that corresponds to this graph is y = 3 sin (2x).
33.
SOLUTION: Sample answer: Because there is a y-intercept at 3, one equation that corresponds to this graph is y = a cos (bx + c)+ d. Half of the distance from the maximum to the minimum value of the function is 4 ÷ 2 or 2. So, the amplitude is 2.
It appears that the function completes one period on Find b.
The midline appears to be at y = 1, so there is a vertical shift 1 unit up. Therefore, one equation that corresponds to this graph is y = 2 cos 4x + 1.
Write an equation for a sinusoidal function with the given period and amplitude that passes through the given point.
35. period: ; amplitude: 5; point:
SOLUTION: Use the period to find b.
Sample answer: One sinusoidal function in which a = 5 and b = 2 is y = 5 cos 2x. Evaluate the function for
The function passes through . Therefore, a sinusoidal function with period π and amplitude 5 that passes
through the point is y = 5 cos 2x.
37. period: ; amplitude: ; point:
SOLUTION: Use the period to find b.
Sample answer: One sinusoidal function in which a = 1.5 and b = 4 is y = 1.5 cos 4x. Evaluate the function for
The function passes through . Therefore, a sinusoidal function with period and amplitude 1.5 that passes
through the point is y = 1.5 cos 4x.
39. MULTIPLE REPRESENTATIONS In this problem, you will investigate the change in the graph of a sinusoidal function of the form y = sin x or y = cos x when multiplied by a polynomial function. a. GRAPHICAL Use a graphing calculator to sketch the graphs of y = 2x, y = –2x, and y = 2x cos x on the same coordinate plane, on the interval [–20, 20]. b. VERBAL Describe the behavior of the graph of y = 2x cos x in relation to the graphs of y = 2x and y = –2x.
c. GRAPHICAL Use a graphing calculator to sketch the graphs of y = x2, y = –x
2, and y = x
2 sin x on the same
coordinate plane, on the interval [–20, 20].
d. VERBAL Describe the behavior of the graph of y = x2 sin x in relation to the graphs of y = x
2 and y = –x
2.
e. ANALYTICAL Make a conjecture as to the behavior of the graph of a sinusoidal function of the form y = sin x or y = cos x when multiplied by polynomial function of the form y = f (x).
SOLUTION: a.
b. The graph of y = 2x cos x oscillates between the graphs of y = 2x and y = –2x. c.
d. The graph of y = x
2 sin x oscillates between the graphs of y = x
2 and y = –x
2.
e . The graph of y = f (x) sin x or y = f (x) cos x will oscillate between the graphs of y = f (x) and y = –f (x).
REASONING Determine whether each statement is true or false . Explain your reasoning.
41. Every sine function of the form y = a sin (bx + c) + d can be written as a cosine function of the form y = a cos (bx + c) + d.
SOLUTION: True; sample answer: The graph of cosine is a horizontal translation of the sine graph. Therefore, a cosine function can be written from any sine function using the same amplitude and period by applying the necessary phase shift.
43. CHALLENGE How many zeros does y = cos 1500x have on the interval 0 ≤ x ≤ 2 ?
SOLUTION: Find the period of y = cos 1500x.
Graph y = cos 1500x on .
The graph of y = cos 1500x has two x-intercepts for one cycle, so the function has 2 zeros per cycle. Find the
number of cycles for y = cos 1500x on [0, 2 ].
So, the graph of y = cos 1500x will complete 1500 cycles on [0, 2 ]. Because there are two zeros per cycle, y =
cos 1500x will have 1500(2) or 3000 zeros on [0, 2 ].
45. Writing in Math The Power Tower ride in Sandusky, Ohio, is shown below. Along the side of each tower is a string of lights that send a continuous pulse of light up and down each tower at a constant rate. Explain why the distance d of this light from the ground over time t cannot be represented by a sinusoidal function.
SOLUTION: Sample answer: Although the pulse of light can be represented as a function with a period, it is not a sinusoidal function because the distance the pulse of light is from the ground changes at a constant rate. As a result, the graph of this function would resemble the graph below.
The given point lies on the terminal side of an angle θ in standard position. Find the values of the six
trigonometric functions of θ. 47. (8, −2)
SOLUTION: Use the values of x and y to find r.
Use x = 8, y = –2, and r = to write the six trigonometric ratios.
49. (4, 5)
SOLUTION: Use the values of x and y to find r.
Use x = 4, y = 5, and r = to write the six trigonometric ratios.
Write each degree measure in radians as a multiple of π and each radian measure in degrees.
51. −420°
SOLUTION:
To convert a degree measure to radians, multiply by
53.
SOLUTION:
To convert a radian measure to degrees, multiply by
State the number of possible real zeros and turning points of each function. Then determine all of the real zeros by factoring.
55. f (x) = x3 + 2x
2 – 8x
SOLUTION: The degree of f (x) is 3, so it will have at most three real zeros and two turning points.
So, the zeros are −4, 0, and 2.
57. f (x) = x5 + 2x
4 – 4x
3 – 8x
2
SOLUTION: The degree of f (x) is 5, so it will have at most five real zeros and four turning points.
So, the zeros are −2, 0, and 2.
Determine whether f has an inverse function. If it does, find the inverse function and state any restrictions on its domain.
59. f (x) = −x – 2
SOLUTION:
Graph f (x) = −x – 2.
The graph of f passes the horizontal line test. Therefore, f is a one-to-one function and has an inverse function. From
the graph, you can see that f has domain (– , ) and range (– , ). Now find f–1
.
Because f–1
and f are the same function, the domain and range of f are equal to the domain and range of f–1
,
respectively. Therefore, it is not necessary to restrict the domain of f–1
.
61. f (x) = (x – 3)2 – 7
SOLUTION:
Graph f (x) = (x – 3)2 – 7.
The graph of f does not pass the horizontal line test. Therefore, f is not a one-to-one function and does not have an inverse function.
63. SAT/ACT If x + y = 90° and x and y are both nonnegative angles, what is equal to ?
A 0
B
C 1
D
E Cannot be determined from the information given.
SOLUTION:
If x + y = 90º, then x = 90º – y , and can be rewritten as . Let y = 60º.
Try a second angle. Let y = 45º.
Therefore, = 1, and the correct answer is C.
65. Identify the equation represented by the graph.
A y = sin 4x
B y = sin 2x
C y = 2 sin 2x
D y = 4 sin x
SOLUTION:
From the graph, it appears that the amplitude is 2 and the period is π. Use the period to find b.
So, the sine function represented by the graph could be y = 2 sin 2x. Therefore, the correct answer is C.
eSolutions Manual - Powered by Cognero Page 20
4-4 Graphing Sine and Cosine Functions

Describe how the graphs of f (x) and g (x) are related. Then find the amplitude of g (x), and sketch two periods of both functions on the same coordinate axes.
1. f (x) = sin x; g(x) = sin x
SOLUTION:
The graph of g(x) is the graph of f (x) compressed vertically. The amplitude of g(x) is or .
Create a table listing the coordinates of the x-intercepts and extrema for f (x) = sin x for one period, 2 , on the
interval [0, 2 ]. Then use the amplitude of g(x) to find corresponding points on its graph.
Sketch the curve through the indicated points for each function. Then repeat the pattern to complete a second period.
Functions x-intercept Maximum x-intercept Minimum x-intercept
f (x) = sin x (0, 0)
( , 0)
(2π, 0)
g(x) = sin x
(0, 0)
( , 0)
(2π, 0)
3. f (x) = cos x; g(x) = 6 cos x
SOLUTION:
The graph of g(x) is the graph of f (x) expanded vertically. The amplitude of g(x) is or 6.
Create a table listing the coordinates of the x-intercepts and extrema for f (x) = cos x for one period, 2 , on the
interval [0, 2 ]. Then use the amplitude of g(x) to find corresponding points on its graph.
Sketch the curve through the indicated points for each function. Then repeat the pattern to complete a second period.
Functions Maximum x-intercept Minimum x-intercept Maximum
f (x) = cos x
g(x) = 6 cos x
Describe how the graphs of f (x) and g (x) are related. Then find the period of g (x), and sketch at least oneperiod of both functions on the same coordinate axes.
5. f (x) = sin x; g(x) = sin 4x
SOLUTION:
The graph of g(x) is the graph of f (x) compressed horizontally. The period of g(x) is or . To find
corresponding points on the graph of g(x), change the x-coordinates of those key points on f (x) so that they range
from 0 to , increasing by increments of or .
Sketch the curve through the indicated points for each function. Then repeat the pattern to complete a second period.
Functions x-intercept Maximum x-intercept Minimum x-intercept
f (x) = sin x (0, 0)
(π, 0)
(2π, 0)
g(x) = sin 4x (0, 0)
7. f (x) = cos x; g(x) = cos 0.2x
SOLUTION:
The graph of g(x) is the graph of f (x) expanded horizontally. The period of g(x) is or . To find
corresponding points on the graph of g(x), change the x-coordinates of those key points on f (x) so that they range
from 0 to , increasing by increments of or .
Sketch the curve through the indicated points for each function. Then repeat the pattern to complete a second period.
Functions Maximum x-intercept Minimum x-intercept Maximum
f (x) = cos x (0, 1)
g(x) = cos x
(0, 1)
9. VOICES The contralto vocal type includes the deepest female singing voice. Some contraltos can sing as low as the E below middle C (E3), which has a frequency of 165 hertz. Write an equation for a sine function that models the initial behavior of the sound wave associated with E3 having an amplitude of 0.15.
SOLUTION:
The general form of the equation will be y = a sin bt, where t is the time in seconds. Because the amplitude is 0.15, a = 0.15. This means that a = ±0.15.
The period is the reciprocal of the frequency or . Use this value to find b.
Sample answer: One sine function that models the initial behavior is y = 0.15 sin 330 t.
Write a sine function that can be used to model the initial behavior of a sound wave with the frequency and amplitude given.
11. f = 932, a = 0.25
SOLUTION:
The general form of the equation is y = a sin bt, where t is the time in seconds. Because the amplitude is 0.25, =
0.25. This means that a = ±0.25.
The period is the reciprocal of the frequency or . Use this value to find b.
Using the positive values of a and b, one sine function that models the initial behavior is y = 0.25 sin 1864 t.
13. f = 623, a = 0.2
SOLUTION:
The general form of the equation is y = a sin bt, where t is the time in seconds. Because the amplitude is 0.2, =
0.2. This means that a = ±0.2.
The period is the reciprocal of the frequency or . Use this value to find b.
Using the positive values of a and b, one sine function that models the initial behavior is y = 0.2 sin 1246 t.
State the amplitude, period, frequency, phase shift, and vertical shift of each function. Then graph two periods of the function.
15.
SOLUTION:
In this function, a = 1, b = 1, c = , and d = 0. Because d = 0, there is no vertical shift.
Graph y = 3 cos x shifted units to the right.
17. y = sin 3x – 2
SOLUTION: In this function, a = 1, b = 3, c = 0, and d = –2.
Graph y = sin 3x shifted 2 units down.
19.
SOLUTION:
In this function, a = 1, b = 1, c = , and d = 4.
.
Graph y = sin x shifted units to the right and 4 units up.
21. TIDES The table shown below provides data for the first high and low tides of the day for a certain bay during oneday in June.
a. Determine the amplitude, period, phase shift, and vertical shift of a sinusoidal function that models the height of the tide. Let x represent the number of hours that the high or low tide occurred after midnight and y represent the height of the wave in feet. b. Write a sinusoidal function that models the data. c. According to your model, what was the height of the tide at 8:45 P.M. that night?
SOLUTION: a. Sample answer: Use a sinusoidal function of the form y = a cos (bx + c) + d to model the data. First, find the amplitude a, which is half of the distance between the heights of the high and low tides.
The vertical shift d is the average of the heights of the high and low tides.
A sinusoid completes half of a period in the time that it takes to go from its maximum to its minimum value. One
period is twice this time. The first high tide occurs at 4:25 A.M. or x = 4.417 and the first low tide occurs at 10:55
A.M. or x = 10.917.
Because the period of a sinusoidal function is you can write Therefore,
The maximum data value occurs when x ≈ 4.417. Since y = cos x attains its first maximum when x = 0, we must
apply a phase shift of 4.417 − 0 or 4.417 units. Use this value to find c.
b. Write a function using the values for a, b, c, and d. Use b =
c. To find the height of the water at 8:45 P.M. that night, evaluate the model for x = 20.75.
Therefore, the tide was about 7.28 feet high at 8:45 P.M. that night.
GRAPHING CALCULATOR Find the values of x in the interval – < x < that make each equation or inequality true. (Hint: Use the intersection function.)
23. –sin x = cos x
SOLUTION:
Graph y = −sin x and y = cos x on the same graphing calculator screen on (−π, π). Use the intersect feature under the CALC menu to determine where the two graphs intersect.
The graphs intersect at about −0.7854 or − and about 2.356 or . Therefore, on –π < x < π, –sin x = cos x
when x = − and .
25. sin x + cos x = 0
SOLUTION:
Graph y = sin x + cos x on (−π, π). Use the zero feature under the CALC menu to determine the zeros of the function.
There are zeros at about −0.785 or − or and about 2.356 or . Therefore, on – < x < , sin x + cos x = 0
when x =
27. sin x cos x > 1
SOLUTION:
Graph y = sin x cos x and y = 1 on (− , ). Use the intersect feature under the CALC menu to determine on what interval(s) sin x cos x > 1.
The graphs do not intersect. Therefore, y = sin x cos x is not greater than y = 1 for any values of x on – < x < .
29. CAROUSELS A wooden horse on a carousel moves up and down as the carousel spins. When the ride ends, the horse usually stops in a vertical position different from where it started. The position y of the horse after t seconds can be modeled by y = 1.5 sin (2t + c), where the phase shift c must be continuously adjusted to compensate for the
different starting positions. If during one ride the horse reached a maximum height after seconds, find the
equation that models the horse’s position.
SOLUTION: First, find the period of y = 1.5 sin (2t + c).
Since the period is π, the function will reach a maximum height at radians. The phase shift is the difference
between the horizontal position of the function at and radians, which is radians. Substitute and b into
the phase shift formula to find c.
Therefore, the equation is
Write an equation that corresponds to each graph.
31.
SOLUTION: Sample answer: There is an x-intercept at 0, so one equation that corresponds to this graph is y = a sin (bx + c) + d. Half of the distance from the maximum to the minimum value of the function is 3. So, the amplitude is 3. It appears that the function completes one period on [0, π]. Find b.
The midline appears to be at y = 0, so there does not appear to be any vertical shift. Therefore, one equation that corresponds to this graph is y = 3 sin (2x).
33.
SOLUTION: Sample answer: Because there is a y-intercept at 3, one equation that corresponds to this graph is y = a cos (bx + c)+ d. Half of the distance from the maximum to the minimum value of the function is 4 ÷ 2 or 2. So, the amplitude is 2.
It appears that the function completes one period on Find b.
The midline appears to be at y = 1, so there is a vertical shift 1 unit up. Therefore, one equation that corresponds to this graph is y = 2 cos 4x + 1.
Write an equation for a sinusoidal function with the given period and amplitude that passes through the given point.
35. period: ; amplitude: 5; point:
SOLUTION: Use the period to find b.
Sample answer: One sinusoidal function in which a = 5 and b = 2 is y = 5 cos 2x. Evaluate the function for
The function passes through . Therefore, a sinusoidal function with period π and amplitude 5 that passes
through the point is y = 5 cos 2x.
37. period: ; amplitude: ; point:
SOLUTION: Use the period to find b.
Sample answer: One sinusoidal function in which a = 1.5 and b = 4 is y = 1.5 cos 4x. Evaluate the function for
The function passes through . Therefore, a sinusoidal function with period and amplitude 1.5 that passes
through the point is y = 1.5 cos 4x.
39. MULTIPLE REPRESENTATIONS In this problem, you will investigate the change in the graph of a sinusoidal function of the form y = sin x or y = cos x when multiplied by a polynomial function. a. GRAPHICAL Use a graphing calculator to sketch the graphs of y = 2x, y = –2x, and y = 2x cos x on the same coordinate plane, on the interval [–20, 20]. b. VERBAL Describe the behavior of the graph of y = 2x cos x in relation to the graphs of y = 2x and y = –2x.
c. GRAPHICAL Use a graphing calculator to sketch the graphs of y = x2, y = –x
2, and y = x
2 sin x on the same
coordinate plane, on the interval [–20, 20].
d. VERBAL Describe the behavior of the graph of y = x2 sin x in relation to the graphs of y = x
2 and y = –x
2.
e. ANALYTICAL Make a conjecture as to the behavior of the graph of a sinusoidal function of the form y = sin x or y = cos x when multiplied by polynomial function of the form y = f (x).
SOLUTION: a.
b. The graph of y = 2x cos x oscillates between the graphs of y = 2x and y = –2x. c.
d. The graph of y = x
2 sin x oscillates between the graphs of y = x
2 and y = –x
2.
e . The graph of y = f (x) sin x or y = f (x) cos x will oscillate between the graphs of y = f (x) and y = –f (x).
REASONING Determine whether each statement is true or false . Explain your reasoning.
41. Every sine function of the form y = a sin (bx + c) + d can be written as a cosine function of the form y = a cos (bx + c) + d.
SOLUTION: True; sample answer: The graph of cosine is a horizontal translation of the sine graph. Therefore, a cosine function can be written from any sine function using the same amplitude and period by applying the necessary phase shift.
43. CHALLENGE How many zeros does y = cos 1500x have on the interval 0 ≤ x ≤ 2 ?
SOLUTION: Find the period of y = cos 1500x.
Graph y = cos 1500x on .
The graph of y = cos 1500x has two x-intercepts for one cycle, so the function has 2 zeros per cycle. Find the
number of cycles for y = cos 1500x on [0, 2 ].
So, the graph of y = cos 1500x will complete 1500 cycles on [0, 2 ]. Because there are two zeros per cycle, y =
cos 1500x will have 1500(2) or 3000 zeros on [0, 2 ].
45. Writing in Math The Power Tower ride in Sandusky, Ohio, is shown below. Along the side of each tower is a string of lights that send a continuous pulse of light up and down each tower at a constant rate. Explain why the distance d of this light from the ground over time t cannot be represented by a sinusoidal function.
SOLUTION: Sample answer: Although the pulse of light can be represented as a function with a period, it is not a sinusoidal function because the distance the pulse of light is from the ground changes at a constant rate. As a result, the graph of this function would resemble the graph below.
The given point lies on the terminal side of an angle θ in standard position. Find the values of the six
trigonometric functions of θ. 47. (8, −2)
SOLUTION: Use the values of x and y to find r.
Use x = 8, y = –2, and r = to write the six trigonometric ratios.
49. (4, 5)
SOLUTION: Use the values of x and y to find r.
Use x = 4, y = 5, and r = to write the six trigonometric ratios.
Write each degree measure in radians as a multiple of π and each radian measure in degrees.
51. −420°
SOLUTION:
To convert a degree measure to radians, multiply by
53.
SOLUTION:
To convert a radian measure to degrees, multiply by
State the number of possible real zeros and turning points of each function. Then determine all of the real zeros by factoring.
55. f (x) = x3 + 2x
2 – 8x
SOLUTION: The degree of f (x) is 3, so it will have at most three real zeros and two turning points.
So, the zeros are −4, 0, and 2.
57. f (x) = x5 + 2x
4 – 4x
3 – 8x
2
SOLUTION: The degree of f (x) is 5, so it will have at most five real zeros and four turning points.
So, the zeros are −2, 0, and 2.
Determine whether f has an inverse function. If it does, find the inverse function and state any restrictions on its domain.
59. f (x) = −x – 2
SOLUTION:
Graph f (x) = −x – 2.
The graph of f passes the horizontal line test. Therefore, f is a one-to-one function and has an inverse function. From
the graph, you can see that f has domain (– , ) and range (– , ). Now find f–1
.
Because f–1
and f are the same function, the domain and range of f are equal to the domain and range of f–1
,
respectively. Therefore, it is not necessary to restrict the domain of f–1
.
61. f (x) = (x – 3)2 – 7
SOLUTION:
Graph f (x) = (x – 3)2 – 7.
The graph of f does not pass the horizontal line test. Therefore, f is not a one-to-one function and does not have an inverse function.
63. SAT/ACT If x + y = 90° and x and y are both nonnegative angles, what is equal to ?
A 0
B
C 1
D
E Cannot be determined from the information given.
SOLUTION:
If x + y = 90º, then x = 90º – y , and can be rewritten as . Let y = 60º.
Try a second angle. Let y = 45º.
Therefore, = 1, and the correct answer is C.
65. Identify the equation represented by the graph.
A y = sin 4x
B y = sin 2x
C y = 2 sin 2x
D y = 4 sin x
SOLUTION:
From the graph, it appears that the amplitude is 2 and the period is π. Use the period to find b.
So, the sine function represented by the graph could be y = 2 sin 2x. Therefore, the correct answer is C.
eSolutions Manual - Powered by Cognero Page 21
4-4 Graphing Sine and Cosine Functions

Describe how the graphs of f (x) and g (x) are related. Then find the amplitude of g (x), and sketch two periods of both functions on the same coordinate axes.
1. f (x) = sin x; g(x) = sin x
SOLUTION:
The graph of g(x) is the graph of f (x) compressed vertically. The amplitude of g(x) is or .
Create a table listing the coordinates of the x-intercepts and extrema for f (x) = sin x for one period, 2 , on the
interval [0, 2 ]. Then use the amplitude of g(x) to find corresponding points on its graph.
Sketch the curve through the indicated points for each function. Then repeat the pattern to complete a second period.
Functions x-intercept Maximum x-intercept Minimum x-intercept
f (x) = sin x (0, 0)
( , 0)
(2π, 0)
g(x) = sin x
(0, 0)
( , 0)
(2π, 0)
3. f (x) = cos x; g(x) = 6 cos x
SOLUTION:
The graph of g(x) is the graph of f (x) expanded vertically. The amplitude of g(x) is or 6.
Create a table listing the coordinates of the x-intercepts and extrema for f (x) = cos x for one period, 2 , on the
interval [0, 2 ]. Then use the amplitude of g(x) to find corresponding points on its graph.
Sketch the curve through the indicated points for each function. Then repeat the pattern to complete a second period.
Functions Maximum x-intercept Minimum x-intercept Maximum
f (x) = cos x
g(x) = 6 cos x
Describe how the graphs of f (x) and g (x) are related. Then find the period of g (x), and sketch at least oneperiod of both functions on the same coordinate axes.
5. f (x) = sin x; g(x) = sin 4x
SOLUTION:
The graph of g(x) is the graph of f (x) compressed horizontally. The period of g(x) is or . To find
corresponding points on the graph of g(x), change the x-coordinates of those key points on f (x) so that they range
from 0 to , increasing by increments of or .
Sketch the curve through the indicated points for each function. Then repeat the pattern to complete a second period.
Functions x-intercept Maximum x-intercept Minimum x-intercept
f (x) = sin x (0, 0)
(π, 0)
(2π, 0)
g(x) = sin 4x (0, 0)
7. f (x) = cos x; g(x) = cos 0.2x
SOLUTION:
The graph of g(x) is the graph of f (x) expanded horizontally. The period of g(x) is or . To find
corresponding points on the graph of g(x), change the x-coordinates of those key points on f (x) so that they range
from 0 to , increasing by increments of or .
Sketch the curve through the indicated points for each function. Then repeat the pattern to complete a second period.
Functions Maximum x-intercept Minimum x-intercept Maximum
f (x) = cos x (0, 1)
g(x) = cos x
(0, 1)
9. VOICES The contralto vocal type includes the deepest female singing voice. Some contraltos can sing as low as the E below middle C (E3), which has a frequency of 165 hertz. Write an equation for a sine function that models the initial behavior of the sound wave associated with E3 having an amplitude of 0.15.
SOLUTION:
The general form of the equation will be y = a sin bt, where t is the time in seconds. Because the amplitude is 0.15, a = 0.15. This means that a = ±0.15.
The period is the reciprocal of the frequency or . Use this value to find b.
Sample answer: One sine function that models the initial behavior is y = 0.15 sin 330 t.
Write a sine function that can be used to model the initial behavior of a sound wave with the frequency and amplitude given.
11. f = 932, a = 0.25
SOLUTION:
The general form of the equation is y = a sin bt, where t is the time in seconds. Because the amplitude is 0.25, =
0.25. This means that a = ±0.25.
The period is the reciprocal of the frequency or . Use this value to find b.
Using the positive values of a and b, one sine function that models the initial behavior is y = 0.25 sin 1864 t.
13. f = 623, a = 0.2
SOLUTION:
The general form of the equation is y = a sin bt, where t is the time in seconds. Because the amplitude is 0.2, =
0.2. This means that a = ±0.2.
The period is the reciprocal of the frequency or . Use this value to find b.
Using the positive values of a and b, one sine function that models the initial behavior is y = 0.2 sin 1246 t.
State the amplitude, period, frequency, phase shift, and vertical shift of each function. Then graph two periods of the function.
15.
SOLUTION:
In this function, a = 1, b = 1, c = , and d = 0. Because d = 0, there is no vertical shift.
Graph y = 3 cos x shifted units to the right.
17. y = sin 3x – 2
SOLUTION: In this function, a = 1, b = 3, c = 0, and d = –2.
Graph y = sin 3x shifted 2 units down.
19.
SOLUTION:
In this function, a = 1, b = 1, c = , and d = 4.
.
Graph y = sin x shifted units to the right and 4 units up.
21. TIDES The table shown below provides data for the first high and low tides of the day for a certain bay during oneday in June.
a. Determine the amplitude, period, phase shift, and vertical shift of a sinusoidal function that models the height of the tide. Let x represent the number of hours that the high or low tide occurred after midnight and y represent the height of the wave in feet. b. Write a sinusoidal function that models the data. c. According to your model, what was the height of the tide at 8:45 P.M. that night?
SOLUTION: a. Sample answer: Use a sinusoidal function of the form y = a cos (bx + c) + d to model the data. First, find the amplitude a, which is half of the distance between the heights of the high and low tides.
The vertical shift d is the average of the heights of the high and low tides.
A sinusoid completes half of a period in the time that it takes to go from its maximum to its minimum value. One
period is twice this time. The first high tide occurs at 4:25 A.M. or x = 4.417 and the first low tide occurs at 10:55
A.M. or x = 10.917.
Because the period of a sinusoidal function is you can write Therefore,
The maximum data value occurs when x ≈ 4.417. Since y = cos x attains its first maximum when x = 0, we must
apply a phase shift of 4.417 − 0 or 4.417 units. Use this value to find c.
b. Write a function using the values for a, b, c, and d. Use b =
c. To find the height of the water at 8:45 P.M. that night, evaluate the model for x = 20.75.
Therefore, the tide was about 7.28 feet high at 8:45 P.M. that night.
GRAPHING CALCULATOR Find the values of x in the interval – < x < that make each equation or inequality true. (Hint: Use the intersection function.)
23. –sin x = cos x
SOLUTION:
Graph y = −sin x and y = cos x on the same graphing calculator screen on (−π, π). Use the intersect feature under the CALC menu to determine where the two graphs intersect.
The graphs intersect at about −0.7854 or − and about 2.356 or . Therefore, on –π < x < π, –sin x = cos x
when x = − and .
25. sin x + cos x = 0
SOLUTION:
Graph y = sin x + cos x on (−π, π). Use the zero feature under the CALC menu to determine the zeros of the function.
There are zeros at about −0.785 or − or and about 2.356 or . Therefore, on – < x < , sin x + cos x = 0
when x =
27. sin x cos x > 1
SOLUTION:
Graph y = sin x cos x and y = 1 on (− , ). Use the intersect feature under the CALC menu to determine on what interval(s) sin x cos x > 1.
The graphs do not intersect. Therefore, y = sin x cos x is not greater than y = 1 for any values of x on – < x < .
29. CAROUSELS A wooden horse on a carousel moves up and down as the carousel spins. When the ride ends, the horse usually stops in a vertical position different from where it started. The position y of the horse after t seconds can be modeled by y = 1.5 sin (2t + c), where the phase shift c must be continuously adjusted to compensate for the
different starting positions. If during one ride the horse reached a maximum height after seconds, find the
equation that models the horse’s position.
SOLUTION: First, find the period of y = 1.5 sin (2t + c).
Since the period is π, the function will reach a maximum height at radians. The phase shift is the difference
between the horizontal position of the function at and radians, which is radians. Substitute and b into
the phase shift formula to find c.
Therefore, the equation is
Write an equation that corresponds to each graph.
31.
SOLUTION: Sample answer: There is an x-intercept at 0, so one equation that corresponds to this graph is y = a sin (bx + c) + d. Half of the distance from the maximum to the minimum value of the function is 3. So, the amplitude is 3. It appears that the function completes one period on [0, π]. Find b.
The midline appears to be at y = 0, so there does not appear to be any vertical shift. Therefore, one equation that corresponds to this graph is y = 3 sin (2x).
33.
SOLUTION: Sample answer: Because there is a y-intercept at 3, one equation that corresponds to this graph is y = a cos (bx + c)+ d. Half of the distance from the maximum to the minimum value of the function is 4 ÷ 2 or 2. So, the amplitude is 2.
It appears that the function completes one period on Find b.
The midline appears to be at y = 1, so there is a vertical shift 1 unit up. Therefore, one equation that corresponds to this graph is y = 2 cos 4x + 1.
Write an equation for a sinusoidal function with the given period and amplitude that passes through the given point.
35. period: ; amplitude: 5; point:
SOLUTION: Use the period to find b.
Sample answer: One sinusoidal function in which a = 5 and b = 2 is y = 5 cos 2x. Evaluate the function for
The function passes through . Therefore, a sinusoidal function with period π and amplitude 5 that passes
through the point is y = 5 cos 2x.
37. period: ; amplitude: ; point:
SOLUTION: Use the period to find b.
Sample answer: One sinusoidal function in which a = 1.5 and b = 4 is y = 1.5 cos 4x. Evaluate the function for
The function passes through . Therefore, a sinusoidal function with period and amplitude 1.5 that passes
through the point is y = 1.5 cos 4x.
39. MULTIPLE REPRESENTATIONS In this problem, you will investigate the change in the graph of a sinusoidal function of the form y = sin x or y = cos x when multiplied by a polynomial function. a. GRAPHICAL Use a graphing calculator to sketch the graphs of y = 2x, y = –2x, and y = 2x cos x on the same coordinate plane, on the interval [–20, 20]. b. VERBAL Describe the behavior of the graph of y = 2x cos x in relation to the graphs of y = 2x and y = –2x.
c. GRAPHICAL Use a graphing calculator to sketch the graphs of y = x2, y = –x
2, and y = x
2 sin x on the same
coordinate plane, on the interval [–20, 20].
d. VERBAL Describe the behavior of the graph of y = x2 sin x in relation to the graphs of y = x
2 and y = –x
2.
e. ANALYTICAL Make a conjecture as to the behavior of the graph of a sinusoidal function of the form y = sin x or y = cos x when multiplied by polynomial function of the form y = f (x).
SOLUTION: a.
b. The graph of y = 2x cos x oscillates between the graphs of y = 2x and y = –2x. c.
d. The graph of y = x
2 sin x oscillates between the graphs of y = x
2 and y = –x
2.
e . The graph of y = f (x) sin x or y = f (x) cos x will oscillate between the graphs of y = f (x) and y = –f (x).
REASONING Determine whether each statement is true or false . Explain your reasoning.
41. Every sine function of the form y = a sin (bx + c) + d can be written as a cosine function of the form y = a cos (bx + c) + d.
SOLUTION: True; sample answer: The graph of cosine is a horizontal translation of the sine graph. Therefore, a cosine function can be written from any sine function using the same amplitude and period by applying the necessary phase shift.
43. CHALLENGE How many zeros does y = cos 1500x have on the interval 0 ≤ x ≤ 2 ?
SOLUTION: Find the period of y = cos 1500x.
Graph y = cos 1500x on .
The graph of y = cos 1500x has two x-intercepts for one cycle, so the function has 2 zeros per cycle. Find the
number of cycles for y = cos 1500x on [0, 2 ].
So, the graph of y = cos 1500x will complete 1500 cycles on [0, 2 ]. Because there are two zeros per cycle, y =
cos 1500x will have 1500(2) or 3000 zeros on [0, 2 ].
45. Writing in Math The Power Tower ride in Sandusky, Ohio, is shown below. Along the side of each tower is a string of lights that send a continuous pulse of light up and down each tower at a constant rate. Explain why the distance d of this light from the ground over time t cannot be represented by a sinusoidal function.
SOLUTION: Sample answer: Although the pulse of light can be represented as a function with a period, it is not a sinusoidal function because the distance the pulse of light is from the ground changes at a constant rate. As a result, the graph of this function would resemble the graph below.
The given point lies on the terminal side of an angle θ in standard position. Find the values of the six
trigonometric functions of θ. 47. (8, −2)
SOLUTION: Use the values of x and y to find r.
Use x = 8, y = –2, and r = to write the six trigonometric ratios.
49. (4, 5)
SOLUTION: Use the values of x and y to find r.
Use x = 4, y = 5, and r = to write the six trigonometric ratios.
Write each degree measure in radians as a multiple of π and each radian measure in degrees.
51. −420°
SOLUTION:
To convert a degree measure to radians, multiply by
53.
SOLUTION:
To convert a radian measure to degrees, multiply by
State the number of possible real zeros and turning points of each function. Then determine all of the real zeros by factoring.
55. f (x) = x3 + 2x
2 – 8x
SOLUTION: The degree of f (x) is 3, so it will have at most three real zeros and two turning points.
So, the zeros are −4, 0, and 2.
57. f (x) = x5 + 2x
4 – 4x
3 – 8x
2
SOLUTION: The degree of f (x) is 5, so it will have at most five real zeros and four turning points.
So, the zeros are −2, 0, and 2.
Determine whether f has an inverse function. If it does, find the inverse function and state any restrictions on its domain.
59. f (x) = −x – 2
SOLUTION:
Graph f (x) = −x – 2.
The graph of f passes the horizontal line test. Therefore, f is a one-to-one function and has an inverse function. From
the graph, you can see that f has domain (– , ) and range (– , ). Now find f–1
.
Because f–1
and f are the same function, the domain and range of f are equal to the domain and range of f–1
,
respectively. Therefore, it is not necessary to restrict the domain of f–1
.
61. f (x) = (x – 3)2 – 7
SOLUTION:
Graph f (x) = (x – 3)2 – 7.
The graph of f does not pass the horizontal line test. Therefore, f is not a one-to-one function and does not have an inverse function.
63. SAT/ACT If x + y = 90° and x and y are both nonnegative angles, what is equal to ?
A 0
B
C 1
D
E Cannot be determined from the information given.
SOLUTION:
If x + y = 90º, then x = 90º – y , and can be rewritten as . Let y = 60º.
Try a second angle. Let y = 45º.
Therefore, = 1, and the correct answer is C.
65. Identify the equation represented by the graph.
A y = sin 4x
B y = sin 2x
C y = 2 sin 2x
D y = 4 sin x
SOLUTION:
From the graph, it appears that the amplitude is 2 and the period is π. Use the period to find b.
So, the sine function represented by the graph could be y = 2 sin 2x. Therefore, the correct answer is C.
eSolutions Manual - Powered by Cognero Page 22
4-4 Graphing Sine and Cosine Functions

Describe how the graphs of f (x) and g (x) are related. Then find the amplitude of g (x), and sketch two periods of both functions on the same coordinate axes.
1. f (x) = sin x; g(x) = sin x
SOLUTION:
The graph of g(x) is the graph of f (x) compressed vertically. The amplitude of g(x) is or .
Create a table listing the coordinates of the x-intercepts and extrema for f (x) = sin x for one period, 2 , on the
interval [0, 2 ]. Then use the amplitude of g(x) to find corresponding points on its graph.
Sketch the curve through the indicated points for each function. Then repeat the pattern to complete a second period.
Functions x-intercept Maximum x-intercept Minimum x-intercept
f (x) = sin x (0, 0)
( , 0)
(2π, 0)
g(x) = sin x
(0, 0)
( , 0)
(2π, 0)
3. f (x) = cos x; g(x) = 6 cos x
SOLUTION:
The graph of g(x) is the graph of f (x) expanded vertically. The amplitude of g(x) is or 6.
Create a table listing the coordinates of the x-intercepts and extrema for f (x) = cos x for one period, 2 , on the
interval [0, 2 ]. Then use the amplitude of g(x) to find corresponding points on its graph.
Sketch the curve through the indicated points for each function. Then repeat the pattern to complete a second period.
Functions Maximum x-intercept Minimum x-intercept Maximum
f (x) = cos x
g(x) = 6 cos x
Describe how the graphs of f (x) and g (x) are related. Then find the period of g (x), and sketch at least oneperiod of both functions on the same coordinate axes.
5. f (x) = sin x; g(x) = sin 4x
SOLUTION:
The graph of g(x) is the graph of f (x) compressed horizontally. The period of g(x) is or . To find
corresponding points on the graph of g(x), change the x-coordinates of those key points on f (x) so that they range
from 0 to , increasing by increments of or .
Sketch the curve through the indicated points for each function. Then repeat the pattern to complete a second period.
Functions x-intercept Maximum x-intercept Minimum x-intercept
f (x) = sin x (0, 0)
(π, 0)
(2π, 0)
g(x) = sin 4x (0, 0)
7. f (x) = cos x; g(x) = cos 0.2x
SOLUTION:
The graph of g(x) is the graph of f (x) expanded horizontally. The period of g(x) is or . To find
corresponding points on the graph of g(x), change the x-coordinates of those key points on f (x) so that they range
from 0 to , increasing by increments of or .
Sketch the curve through the indicated points for each function. Then repeat the pattern to complete a second period.
Functions Maximum x-intercept Minimum x-intercept Maximum
f (x) = cos x (0, 1)
g(x) = cos x
(0, 1)
9. VOICES The contralto vocal type includes the deepest female singing voice. Some contraltos can sing as low as the E below middle C (E3), which has a frequency of 165 hertz. Write an equation for a sine function that models the initial behavior of the sound wave associated with E3 having an amplitude of 0.15.
SOLUTION:
The general form of the equation will be y = a sin bt, where t is the time in seconds. Because the amplitude is 0.15, a = 0.15. This means that a = ±0.15.
The period is the reciprocal of the frequency or . Use this value to find b.
Sample answer: One sine function that models the initial behavior is y = 0.15 sin 330 t.
Write a sine function that can be used to model the initial behavior of a sound wave with the frequency and amplitude given.
11. f = 932, a = 0.25
SOLUTION:
The general form of the equation is y = a sin bt, where t is the time in seconds. Because the amplitude is 0.25, =
0.25. This means that a = ±0.25.
The period is the reciprocal of the frequency or . Use this value to find b.
Using the positive values of a and b, one sine function that models the initial behavior is y = 0.25 sin 1864 t.
13. f = 623, a = 0.2
SOLUTION:
The general form of the equation is y = a sin bt, where t is the time in seconds. Because the amplitude is 0.2, =
0.2. This means that a = ±0.2.
The period is the reciprocal of the frequency or . Use this value to find b.
Using the positive values of a and b, one sine function that models the initial behavior is y = 0.2 sin 1246 t.
State the amplitude, period, frequency, phase shift, and vertical shift of each function. Then graph two periods of the function.
15.
SOLUTION:
In this function, a = 1, b = 1, c = , and d = 0. Because d = 0, there is no vertical shift.
Graph y = 3 cos x shifted units to the right.
17. y = sin 3x – 2
SOLUTION: In this function, a = 1, b = 3, c = 0, and d = –2.
Graph y = sin 3x shifted 2 units down.
19.
SOLUTION:
In this function, a = 1, b = 1, c = , and d = 4.
.
Graph y = sin x shifted units to the right and 4 units up.
21. TIDES The table shown below provides data for the first high and low tides of the day for a certain bay during oneday in June.
a. Determine the amplitude, period, phase shift, and vertical shift of a sinusoidal function that models the height of the tide. Let x represent the number of hours that the high or low tide occurred after midnight and y represent the height of the wave in feet. b. Write a sinusoidal function that models the data. c. According to your model, what was the height of the tide at 8:45 P.M. that night?
SOLUTION: a. Sample answer: Use a sinusoidal function of the form y = a cos (bx + c) + d to model the data. First, find the amplitude a, which is half of the distance between the heights of the high and low tides.
The vertical shift d is the average of the heights of the high and low tides.
A sinusoid completes half of a period in the time that it takes to go from its maximum to its minimum value. One
period is twice this time. The first high tide occurs at 4:25 A.M. or x = 4.417 and the first low tide occurs at 10:55
A.M. or x = 10.917.
Because the period of a sinusoidal function is you can write Therefore,
The maximum data value occurs when x ≈ 4.417. Since y = cos x attains its first maximum when x = 0, we must
apply a phase shift of 4.417 − 0 or 4.417 units. Use this value to find c.
b. Write a function using the values for a, b, c, and d. Use b =
c. To find the height of the water at 8:45 P.M. that night, evaluate the model for x = 20.75.
Therefore, the tide was about 7.28 feet high at 8:45 P.M. that night.
GRAPHING CALCULATOR Find the values of x in the interval – < x < that make each equation or inequality true. (Hint: Use the intersection function.)
23. –sin x = cos x
SOLUTION:
Graph y = −sin x and y = cos x on the same graphing calculator screen on (−π, π). Use the intersect feature under the CALC menu to determine where the two graphs intersect.
The graphs intersect at about −0.7854 or − and about 2.356 or . Therefore, on –π < x < π, –sin x = cos x
when x = − and .
25. sin x + cos x = 0
SOLUTION:
Graph y = sin x + cos x on (−π, π). Use the zero feature under the CALC menu to determine the zeros of the function.
There are zeros at about −0.785 or − or and about 2.356 or . Therefore, on – < x < , sin x + cos x = 0
when x =
27. sin x cos x > 1
SOLUTION:
Graph y = sin x cos x and y = 1 on (− , ). Use the intersect feature under the CALC menu to determine on what interval(s) sin x cos x > 1.
The graphs do not intersect. Therefore, y = sin x cos x is not greater than y = 1 for any values of x on – < x < .
29. CAROUSELS A wooden horse on a carousel moves up and down as the carousel spins. When the ride ends, the horse usually stops in a vertical position different from where it started. The position y of the horse after t seconds can be modeled by y = 1.5 sin (2t + c), where the phase shift c must be continuously adjusted to compensate for the
different starting positions. If during one ride the horse reached a maximum height after seconds, find the
equation that models the horse’s position.
SOLUTION: First, find the period of y = 1.5 sin (2t + c).
Since the period is π, the function will reach a maximum height at radians. The phase shift is the difference
between the horizontal position of the function at and radians, which is radians. Substitute and b into
the phase shift formula to find c.
Therefore, the equation is
Write an equation that corresponds to each graph.
31.
SOLUTION: Sample answer: There is an x-intercept at 0, so one equation that corresponds to this graph is y = a sin (bx + c) + d. Half of the distance from the maximum to the minimum value of the function is 3. So, the amplitude is 3. It appears that the function completes one period on [0, π]. Find b.
The midline appears to be at y = 0, so there does not appear to be any vertical shift. Therefore, one equation that corresponds to this graph is y = 3 sin (2x).
33.
SOLUTION: Sample answer: Because there is a y-intercept at 3, one equation that corresponds to this graph is y = a cos (bx + c)+ d. Half of the distance from the maximum to the minimum value of the function is 4 ÷ 2 or 2. So, the amplitude is 2.
It appears that the function completes one period on Find b.
The midline appears to be at y = 1, so there is a vertical shift 1 unit up. Therefore, one equation that corresponds to this graph is y = 2 cos 4x + 1.
Write an equation for a sinusoidal function with the given period and amplitude that passes through the given point.
35. period: ; amplitude: 5; point:
SOLUTION: Use the period to find b.
Sample answer: One sinusoidal function in which a = 5 and b = 2 is y = 5 cos 2x. Evaluate the function for
The function passes through . Therefore, a sinusoidal function with period π and amplitude 5 that passes
through the point is y = 5 cos 2x.
37. period: ; amplitude: ; point:
SOLUTION: Use the period to find b.
Sample answer: One sinusoidal function in which a = 1.5 and b = 4 is y = 1.5 cos 4x. Evaluate the function for
The function passes through . Therefore, a sinusoidal function with period and amplitude 1.5 that passes
through the point is y = 1.5 cos 4x.
39. MULTIPLE REPRESENTATIONS In this problem, you will investigate the change in the graph of a sinusoidal function of the form y = sin x or y = cos x when multiplied by a polynomial function. a. GRAPHICAL Use a graphing calculator to sketch the graphs of y = 2x, y = –2x, and y = 2x cos x on the same coordinate plane, on the interval [–20, 20]. b. VERBAL Describe the behavior of the graph of y = 2x cos x in relation to the graphs of y = 2x and y = –2x.
c. GRAPHICAL Use a graphing calculator to sketch the graphs of y = x2, y = –x
2, and y = x
2 sin x on the same
coordinate plane, on the interval [–20, 20].
d. VERBAL Describe the behavior of the graph of y = x2 sin x in relation to the graphs of y = x
2 and y = –x
2.
e. ANALYTICAL Make a conjecture as to the behavior of the graph of a sinusoidal function of the form y = sin x or y = cos x when multiplied by polynomial function of the form y = f (x).
SOLUTION: a.
b. The graph of y = 2x cos x oscillates between the graphs of y = 2x and y = –2x. c.
d. The graph of y = x
2 sin x oscillates between the graphs of y = x
2 and y = –x
2.
e . The graph of y = f (x) sin x or y = f (x) cos x will oscillate between the graphs of y = f (x) and y = –f (x).
REASONING Determine whether each statement is true or false . Explain your reasoning.
41. Every sine function of the form y = a sin (bx + c) + d can be written as a cosine function of the form y = a cos (bx + c) + d.
SOLUTION: True; sample answer: The graph of cosine is a horizontal translation of the sine graph. Therefore, a cosine function can be written from any sine function using the same amplitude and period by applying the necessary phase shift.
43. CHALLENGE How many zeros does y = cos 1500x have on the interval 0 ≤ x ≤ 2 ?
SOLUTION: Find the period of y = cos 1500x.
Graph y = cos 1500x on .
The graph of y = cos 1500x has two x-intercepts for one cycle, so the function has 2 zeros per cycle. Find the
number of cycles for y = cos 1500x on [0, 2 ].
So, the graph of y = cos 1500x will complete 1500 cycles on [0, 2 ]. Because there are two zeros per cycle, y =
cos 1500x will have 1500(2) or 3000 zeros on [0, 2 ].
45. Writing in Math The Power Tower ride in Sandusky, Ohio, is shown below. Along the side of each tower is a string of lights that send a continuous pulse of light up and down each tower at a constant rate. Explain why the distance d of this light from the ground over time t cannot be represented by a sinusoidal function.
SOLUTION: Sample answer: Although the pulse of light can be represented as a function with a period, it is not a sinusoidal function because the distance the pulse of light is from the ground changes at a constant rate. As a result, the graph of this function would resemble the graph below.
The given point lies on the terminal side of an angle θ in standard position. Find the values of the six
trigonometric functions of θ. 47. (8, −2)
SOLUTION: Use the values of x and y to find r.
Use x = 8, y = –2, and r = to write the six trigonometric ratios.
49. (4, 5)
SOLUTION: Use the values of x and y to find r.
Use x = 4, y = 5, and r = to write the six trigonometric ratios.
Write each degree measure in radians as a multiple of π and each radian measure in degrees.
51. −420°
SOLUTION:
To convert a degree measure to radians, multiply by
53.
SOLUTION:
To convert a radian measure to degrees, multiply by
State the number of possible real zeros and turning points of each function. Then determine all of the real zeros by factoring.
55. f (x) = x3 + 2x
2 – 8x
SOLUTION: The degree of f (x) is 3, so it will have at most three real zeros and two turning points.
So, the zeros are −4, 0, and 2.
57. f (x) = x5 + 2x
4 – 4x
3 – 8x
2
SOLUTION: The degree of f (x) is 5, so it will have at most five real zeros and four turning points.
So, the zeros are −2, 0, and 2.
Determine whether f has an inverse function. If it does, find the inverse function and state any restrictions on its domain.
59. f (x) = −x – 2
SOLUTION:
Graph f (x) = −x – 2.
The graph of f passes the horizontal line test. Therefore, f is a one-to-one function and has an inverse function. From
the graph, you can see that f has domain (– , ) and range (– , ). Now find f–1
.
Because f–1
and f are the same function, the domain and range of f are equal to the domain and range of f–1
,
respectively. Therefore, it is not necessary to restrict the domain of f–1
.
61. f (x) = (x – 3)2 – 7
SOLUTION:
Graph f (x) = (x – 3)2 – 7.
The graph of f does not pass the horizontal line test. Therefore, f is not a one-to-one function and does not have an inverse function.
63. SAT/ACT If x + y = 90° and x and y are both nonnegative angles, what is equal to ?
A 0
B
C 1
D
E Cannot be determined from the information given.
SOLUTION:
If x + y = 90º, then x = 90º – y , and can be rewritten as . Let y = 60º.
Try a second angle. Let y = 45º.
Therefore, = 1, and the correct answer is C.
65. Identify the equation represented by the graph.
A y = sin 4x
B y = sin 2x
C y = 2 sin 2x
D y = 4 sin x
SOLUTION:
From the graph, it appears that the amplitude is 2 and the period is π. Use the period to find b.
So, the sine function represented by the graph could be y = 2 sin 2x. Therefore, the correct answer is C.
eSolutions Manual - Powered by Cognero Page 23
4-4 Graphing Sine and Cosine Functions

Describe how the graphs of f (x) and g (x) are related. Then find the amplitude of g (x), and sketch two periods of both functions on the same coordinate axes.
1. f (x) = sin x; g(x) = sin x
SOLUTION:
The graph of g(x) is the graph of f (x) compressed vertically. The amplitude of g(x) is or .
Create a table listing the coordinates of the x-intercepts and extrema for f (x) = sin x for one period, 2 , on the
interval [0, 2 ]. Then use the amplitude of g(x) to find corresponding points on its graph.
Sketch the curve through the indicated points for each function. Then repeat the pattern to complete a second period.
Functions x-intercept Maximum x-intercept Minimum x-intercept
f (x) = sin x (0, 0)
( , 0)
(2π, 0)
g(x) = sin x
(0, 0)
( , 0)
(2π, 0)
3. f (x) = cos x; g(x) = 6 cos x
SOLUTION:
The graph of g(x) is the graph of f (x) expanded vertically. The amplitude of g(x) is or 6.
Create a table listing the coordinates of the x-intercepts and extrema for f (x) = cos x for one period, 2 , on the
interval [0, 2 ]. Then use the amplitude of g(x) to find corresponding points on its graph.
Sketch the curve through the indicated points for each function. Then repeat the pattern to complete a second period.
Functions Maximum x-intercept Minimum x-intercept Maximum
f (x) = cos x
g(x) = 6 cos x
Describe how the graphs of f (x) and g (x) are related. Then find the period of g (x), and sketch at least oneperiod of both functions on the same coordinate axes.
5. f (x) = sin x; g(x) = sin 4x
SOLUTION:
The graph of g(x) is the graph of f (x) compressed horizontally. The period of g(x) is or . To find
corresponding points on the graph of g(x), change the x-coordinates of those key points on f (x) so that they range
from 0 to , increasing by increments of or .
Sketch the curve through the indicated points for each function. Then repeat the pattern to complete a second period.
Functions x-intercept Maximum x-intercept Minimum x-intercept
f (x) = sin x (0, 0)
(π, 0)
(2π, 0)
g(x) = sin 4x (0, 0)
7. f (x) = cos x; g(x) = cos 0.2x
SOLUTION:
The graph of g(x) is the graph of f (x) expanded horizontally. The period of g(x) is or . To find
corresponding points on the graph of g(x), change the x-coordinates of those key points on f (x) so that they range
from 0 to , increasing by increments of or .
Sketch the curve through the indicated points for each function. Then repeat the pattern to complete a second period.
Functions Maximum x-intercept Minimum x-intercept Maximum
f (x) = cos x (0, 1)
g(x) = cos x
(0, 1)
9. VOICES The contralto vocal type includes the deepest female singing voice. Some contraltos can sing as low as the E below middle C (E3), which has a frequency of 165 hertz. Write an equation for a sine function that models the initial behavior of the sound wave associated with E3 having an amplitude of 0.15.
SOLUTION:
The general form of the equation will be y = a sin bt, where t is the time in seconds. Because the amplitude is 0.15, a = 0.15. This means that a = ±0.15.
The period is the reciprocal of the frequency or . Use this value to find b.
Sample answer: One sine function that models the initial behavior is y = 0.15 sin 330 t.
Write a sine function that can be used to model the initial behavior of a sound wave with the frequency and amplitude given.
11. f = 932, a = 0.25
SOLUTION:
The general form of the equation is y = a sin bt, where t is the time in seconds. Because the amplitude is 0.25, =
0.25. This means that a = ±0.25.
The period is the reciprocal of the frequency or . Use this value to find b.
Using the positive values of a and b, one sine function that models the initial behavior is y = 0.25 sin 1864 t.
13. f = 623, a = 0.2
SOLUTION:
The general form of the equation is y = a sin bt, where t is the time in seconds. Because the amplitude is 0.2, =
0.2. This means that a = ±0.2.
The period is the reciprocal of the frequency or . Use this value to find b.
Using the positive values of a and b, one sine function that models the initial behavior is y = 0.2 sin 1246 t.
State the amplitude, period, frequency, phase shift, and vertical shift of each function. Then graph two periods of the function.
15.
SOLUTION:
In this function, a = 1, b = 1, c = , and d = 0. Because d = 0, there is no vertical shift.
Graph y = 3 cos x shifted units to the right.
17. y = sin 3x – 2
SOLUTION: In this function, a = 1, b = 3, c = 0, and d = –2.
Graph y = sin 3x shifted 2 units down.
19.
SOLUTION:
In this function, a = 1, b = 1, c = , and d = 4.
.
Graph y = sin x shifted units to the right and 4 units up.
21. TIDES The table shown below provides data for the first high and low tides of the day for a certain bay during oneday in June.
a. Determine the amplitude, period, phase shift, and vertical shift of a sinusoidal function that models the height of the tide. Let x represent the number of hours that the high or low tide occurred after midnight and y represent the height of the wave in feet. b. Write a sinusoidal function that models the data. c. According to your model, what was the height of the tide at 8:45 P.M. that night?
SOLUTION: a. Sample answer: Use a sinusoidal function of the form y = a cos (bx + c) + d to model the data. First, find the amplitude a, which is half of the distance between the heights of the high and low tides.
The vertical shift d is the average of the heights of the high and low tides.
A sinusoid completes half of a period in the time that it takes to go from its maximum to its minimum value. One
period is twice this time. The first high tide occurs at 4:25 A.M. or x = 4.417 and the first low tide occurs at 10:55
A.M. or x = 10.917.
Because the period of a sinusoidal function is you can write Therefore,
The maximum data value occurs when x ≈ 4.417. Since y = cos x attains its first maximum when x = 0, we must
apply a phase shift of 4.417 − 0 or 4.417 units. Use this value to find c.
b. Write a function using the values for a, b, c, and d. Use b =
c. To find the height of the water at 8:45 P.M. that night, evaluate the model for x = 20.75.
Therefore, the tide was about 7.28 feet high at 8:45 P.M. that night.
GRAPHING CALCULATOR Find the values of x in the interval – < x < that make each equation or inequality true. (Hint: Use the intersection function.)
23. –sin x = cos x
SOLUTION:
Graph y = −sin x and y = cos x on the same graphing calculator screen on (−π, π). Use the intersect feature under the CALC menu to determine where the two graphs intersect.
The graphs intersect at about −0.7854 or − and about 2.356 or . Therefore, on –π < x < π, –sin x = cos x
when x = − and .
25. sin x + cos x = 0
SOLUTION:
Graph y = sin x + cos x on (−π, π). Use the zero feature under the CALC menu to determine the zeros of the function.
There are zeros at about −0.785 or − or and about 2.356 or . Therefore, on – < x < , sin x + cos x = 0
when x =
27. sin x cos x > 1
SOLUTION:
Graph y = sin x cos x and y = 1 on (− , ). Use the intersect feature under the CALC menu to determine on what interval(s) sin x cos x > 1.
The graphs do not intersect. Therefore, y = sin x cos x is not greater than y = 1 for any values of x on – < x < .
29. CAROUSELS A wooden horse on a carousel moves up and down as the carousel spins. When the ride ends, the horse usually stops in a vertical position different from where it started. The position y of the horse after t seconds can be modeled by y = 1.5 sin (2t + c), where the phase shift c must be continuously adjusted to compensate for the
different starting positions. If during one ride the horse reached a maximum height after seconds, find the
equation that models the horse’s position.
SOLUTION: First, find the period of y = 1.5 sin (2t + c).
Since the period is π, the function will reach a maximum height at radians. The phase shift is the difference
between the horizontal position of the function at and radians, which is radians. Substitute and b into
the phase shift formula to find c.
Therefore, the equation is
Write an equation that corresponds to each graph.
31.
SOLUTION: Sample answer: There is an x-intercept at 0, so one equation that corresponds to this graph is y = a sin (bx + c) + d. Half of the distance from the maximum to the minimum value of the function is 3. So, the amplitude is 3. It appears that the function completes one period on [0, π]. Find b.
The midline appears to be at y = 0, so there does not appear to be any vertical shift. Therefore, one equation that corresponds to this graph is y = 3 sin (2x).
33.
SOLUTION: Sample answer: Because there is a y-intercept at 3, one equation that corresponds to this graph is y = a cos (bx + c)+ d. Half of the distance from the maximum to the minimum value of the function is 4 ÷ 2 or 2. So, the amplitude is 2.
It appears that the function completes one period on Find b.
The midline appears to be at y = 1, so there is a vertical shift 1 unit up. Therefore, one equation that corresponds to this graph is y = 2 cos 4x + 1.
Write an equation for a sinusoidal function with the given period and amplitude that passes through the given point.
35. period: ; amplitude: 5; point:
SOLUTION: Use the period to find b.
Sample answer: One sinusoidal function in which a = 5 and b = 2 is y = 5 cos 2x. Evaluate the function for
The function passes through . Therefore, a sinusoidal function with period π and amplitude 5 that passes
through the point is y = 5 cos 2x.
37. period: ; amplitude: ; point:
SOLUTION: Use the period to find b.
Sample answer: One sinusoidal function in which a = 1.5 and b = 4 is y = 1.5 cos 4x. Evaluate the function for
The function passes through . Therefore, a sinusoidal function with period and amplitude 1.5 that passes
through the point is y = 1.5 cos 4x.
39. MULTIPLE REPRESENTATIONS In this problem, you will investigate the change in the graph of a sinusoidal function of the form y = sin x or y = cos x when multiplied by a polynomial function. a. GRAPHICAL Use a graphing calculator to sketch the graphs of y = 2x, y = –2x, and y = 2x cos x on the same coordinate plane, on the interval [–20, 20]. b. VERBAL Describe the behavior of the graph of y = 2x cos x in relation to the graphs of y = 2x and y = –2x.
c. GRAPHICAL Use a graphing calculator to sketch the graphs of y = x2, y = –x
2, and y = x
2 sin x on the same
coordinate plane, on the interval [–20, 20].
d. VERBAL Describe the behavior of the graph of y = x2 sin x in relation to the graphs of y = x
2 and y = –x
2.
e. ANALYTICAL Make a conjecture as to the behavior of the graph of a sinusoidal function of the form y = sin x or y = cos x when multiplied by polynomial function of the form y = f (x).
SOLUTION: a.
b. The graph of y = 2x cos x oscillates between the graphs of y = 2x and y = –2x. c.
d. The graph of y = x
2 sin x oscillates between the graphs of y = x
2 and y = –x
2.
e . The graph of y = f (x) sin x or y = f (x) cos x will oscillate between the graphs of y = f (x) and y = –f (x).
REASONING Determine whether each statement is true or false . Explain your reasoning.
41. Every sine function of the form y = a sin (bx + c) + d can be written as a cosine function of the form y = a cos (bx + c) + d.
SOLUTION: True; sample answer: The graph of cosine is a horizontal translation of the sine graph. Therefore, a cosine function can be written from any sine function using the same amplitude and period by applying the necessary phase shift.
43. CHALLENGE How many zeros does y = cos 1500x have on the interval 0 ≤ x ≤ 2 ?
SOLUTION: Find the period of y = cos 1500x.
Graph y = cos 1500x on .
The graph of y = cos 1500x has two x-intercepts for one cycle, so the function has 2 zeros per cycle. Find the
number of cycles for y = cos 1500x on [0, 2 ].
So, the graph of y = cos 1500x will complete 1500 cycles on [0, 2 ]. Because there are two zeros per cycle, y =
cos 1500x will have 1500(2) or 3000 zeros on [0, 2 ].
45. Writing in Math The Power Tower ride in Sandusky, Ohio, is shown below. Along the side of each tower is a string of lights that send a continuous pulse of light up and down each tower at a constant rate. Explain why the distance d of this light from the ground over time t cannot be represented by a sinusoidal function.
SOLUTION: Sample answer: Although the pulse of light can be represented as a function with a period, it is not a sinusoidal function because the distance the pulse of light is from the ground changes at a constant rate. As a result, the graph of this function would resemble the graph below.
The given point lies on the terminal side of an angle θ in standard position. Find the values of the six
trigonometric functions of θ. 47. (8, −2)
SOLUTION: Use the values of x and y to find r.
Use x = 8, y = –2, and r = to write the six trigonometric ratios.
49. (4, 5)
SOLUTION: Use the values of x and y to find r.
Use x = 4, y = 5, and r = to write the six trigonometric ratios.
Write each degree measure in radians as a multiple of π and each radian measure in degrees.
51. −420°
SOLUTION:
To convert a degree measure to radians, multiply by
53.
SOLUTION:
To convert a radian measure to degrees, multiply by
State the number of possible real zeros and turning points of each function. Then determine all of the real zeros by factoring.
55. f (x) = x3 + 2x
2 – 8x
SOLUTION: The degree of f (x) is 3, so it will have at most three real zeros and two turning points.
So, the zeros are −4, 0, and 2.
57. f (x) = x5 + 2x
4 – 4x
3 – 8x
2
SOLUTION: The degree of f (x) is 5, so it will have at most five real zeros and four turning points.
So, the zeros are −2, 0, and 2.
Determine whether f has an inverse function. If it does, find the inverse function and state any restrictions on its domain.
59. f (x) = −x – 2
SOLUTION:
Graph f (x) = −x – 2.
The graph of f passes the horizontal line test. Therefore, f is a one-to-one function and has an inverse function. From
the graph, you can see that f has domain (– , ) and range (– , ). Now find f–1
.
Because f–1
and f are the same function, the domain and range of f are equal to the domain and range of f–1
,
respectively. Therefore, it is not necessary to restrict the domain of f–1
.
61. f (x) = (x – 3)2 – 7
SOLUTION:
Graph f (x) = (x – 3)2 – 7.
The graph of f does not pass the horizontal line test. Therefore, f is not a one-to-one function and does not have an inverse function.
63. SAT/ACT If x + y = 90° and x and y are both nonnegative angles, what is equal to ?
A 0
B
C 1
D
E Cannot be determined from the information given.
SOLUTION:
If x + y = 90º, then x = 90º – y , and can be rewritten as . Let y = 60º.
Try a second angle. Let y = 45º.
Therefore, = 1, and the correct answer is C.
65. Identify the equation represented by the graph.
A y = sin 4x
B y = sin 2x
C y = 2 sin 2x
D y = 4 sin x
SOLUTION:
From the graph, it appears that the amplitude is 2 and the period is π. Use the period to find b.
So, the sine function represented by the graph could be y = 2 sin 2x. Therefore, the correct answer is C.
eSolutions Manual - Powered by Cognero Page 24
4-4 Graphing Sine and Cosine Functions

Describe how the graphs of f (x) and g (x) are related. Then find the amplitude of g (x), and sketch two periods of both functions on the same coordinate axes.
1. f (x) = sin x; g(x) = sin x
SOLUTION:
The graph of g(x) is the graph of f (x) compressed vertically. The amplitude of g(x) is or .
Create a table listing the coordinates of the x-intercepts and extrema for f (x) = sin x for one period, 2 , on the
interval [0, 2 ]. Then use the amplitude of g(x) to find corresponding points on its graph.
Sketch the curve through the indicated points for each function. Then repeat the pattern to complete a second period.
Functions x-intercept Maximum x-intercept Minimum x-intercept
f (x) = sin x (0, 0)
( , 0)
(2π, 0)
g(x) = sin x
(0, 0)
( , 0)
(2π, 0)
3. f (x) = cos x; g(x) = 6 cos x
SOLUTION:
The graph of g(x) is the graph of f (x) expanded vertically. The amplitude of g(x) is or 6.
Create a table listing the coordinates of the x-intercepts and extrema for f (x) = cos x for one period, 2 , on the
interval [0, 2 ]. Then use the amplitude of g(x) to find corresponding points on its graph.
Sketch the curve through the indicated points for each function. Then repeat the pattern to complete a second period.
Functions Maximum x-intercept Minimum x-intercept Maximum
f (x) = cos x
g(x) = 6 cos x
Describe how the graphs of f (x) and g (x) are related. Then find the period of g (x), and sketch at least oneperiod of both functions on the same coordinate axes.
5. f (x) = sin x; g(x) = sin 4x
SOLUTION:
The graph of g(x) is the graph of f (x) compressed horizontally. The period of g(x) is or . To find
corresponding points on the graph of g(x), change the x-coordinates of those key points on f (x) so that they range
from 0 to , increasing by increments of or .
Sketch the curve through the indicated points for each function. Then repeat the pattern to complete a second period.
Functions x-intercept Maximum x-intercept Minimum x-intercept
f (x) = sin x (0, 0)
(π, 0)
(2π, 0)
g(x) = sin 4x (0, 0)
7. f (x) = cos x; g(x) = cos 0.2x
SOLUTION:
The graph of g(x) is the graph of f (x) expanded horizontally. The period of g(x) is or . To find
corresponding points on the graph of g(x), change the x-coordinates of those key points on f (x) so that they range
from 0 to , increasing by increments of or .
Sketch the curve through the indicated points for each function. Then repeat the pattern to complete a second period.
Functions Maximum x-intercept Minimum x-intercept Maximum
f (x) = cos x (0, 1)
g(x) = cos x
(0, 1)
9. VOICES The contralto vocal type includes the deepest female singing voice. Some contraltos can sing as low as the E below middle C (E3), which has a frequency of 165 hertz. Write an equation for a sine function that models the initial behavior of the sound wave associated with E3 having an amplitude of 0.15.
SOLUTION:
The general form of the equation will be y = a sin bt, where t is the time in seconds. Because the amplitude is 0.15, a = 0.15. This means that a = ±0.15.
The period is the reciprocal of the frequency or . Use this value to find b.
Sample answer: One sine function that models the initial behavior is y = 0.15 sin 330 t.
Write a sine function that can be used to model the initial behavior of a sound wave with the frequency and amplitude given.
11. f = 932, a = 0.25
SOLUTION:
The general form of the equation is y = a sin bt, where t is the time in seconds. Because the amplitude is 0.25, =
0.25. This means that a = ±0.25.
The period is the reciprocal of the frequency or . Use this value to find b.
Using the positive values of a and b, one sine function that models the initial behavior is y = 0.25 sin 1864 t.
13. f = 623, a = 0.2
SOLUTION:
The general form of the equation is y = a sin bt, where t is the time in seconds. Because the amplitude is 0.2, =
0.2. This means that a = ±0.2.
The period is the reciprocal of the frequency or . Use this value to find b.
Using the positive values of a and b, one sine function that models the initial behavior is y = 0.2 sin 1246 t.
State the amplitude, period, frequency, phase shift, and vertical shift of each function. Then graph two periods of the function.
15.
SOLUTION:
In this function, a = 1, b = 1, c = , and d = 0. Because d = 0, there is no vertical shift.
Graph y = 3 cos x shifted units to the right.
17. y = sin 3x – 2
SOLUTION: In this function, a = 1, b = 3, c = 0, and d = –2.
Graph y = sin 3x shifted 2 units down.
19.
SOLUTION:
In this function, a = 1, b = 1, c = , and d = 4.
.
Graph y = sin x shifted units to the right and 4 units up.
21. TIDES The table shown below provides data for the first high and low tides of the day for a certain bay during oneday in June.
a. Determine the amplitude, period, phase shift, and vertical shift of a sinusoidal function that models the height of the tide. Let x represent the number of hours that the high or low tide occurred after midnight and y represent the height of the wave in feet. b. Write a sinusoidal function that models the data. c. According to your model, what was the height of the tide at 8:45 P.M. that night?
SOLUTION: a. Sample answer: Use a sinusoidal function of the form y = a cos (bx + c) + d to model the data. First, find the amplitude a, which is half of the distance between the heights of the high and low tides.
The vertical shift d is the average of the heights of the high and low tides.
A sinusoid completes half of a period in the time that it takes to go from its maximum to its minimum value. One
period is twice this time. The first high tide occurs at 4:25 A.M. or x = 4.417 and the first low tide occurs at 10:55
A.M. or x = 10.917.
Because the period of a sinusoidal function is you can write Therefore,
The maximum data value occurs when x ≈ 4.417. Since y = cos x attains its first maximum when x = 0, we must
apply a phase shift of 4.417 − 0 or 4.417 units. Use this value to find c.
b. Write a function using the values for a, b, c, and d. Use b =
c. To find the height of the water at 8:45 P.M. that night, evaluate the model for x = 20.75.
Therefore, the tide was about 7.28 feet high at 8:45 P.M. that night.
GRAPHING CALCULATOR Find the values of x in the interval – < x < that make each equation or inequality true. (Hint: Use the intersection function.)
23. –sin x = cos x
SOLUTION:
Graph y = −sin x and y = cos x on the same graphing calculator screen on (−π, π). Use the intersect feature under the CALC menu to determine where the two graphs intersect.
The graphs intersect at about −0.7854 or − and about 2.356 or . Therefore, on –π < x < π, –sin x = cos x
when x = − and .
25. sin x + cos x = 0
SOLUTION:
Graph y = sin x + cos x on (−π, π). Use the zero feature under the CALC menu to determine the zeros of the function.
There are zeros at about −0.785 or − or and about 2.356 or . Therefore, on – < x < , sin x + cos x = 0
when x =
27. sin x cos x > 1
SOLUTION:
Graph y = sin x cos x and y = 1 on (− , ). Use the intersect feature under the CALC menu to determine on what interval(s) sin x cos x > 1.
The graphs do not intersect. Therefore, y = sin x cos x is not greater than y = 1 for any values of x on – < x < .
29. CAROUSELS A wooden horse on a carousel moves up and down as the carousel spins. When the ride ends, the horse usually stops in a vertical position different from where it started. The position y of the horse after t seconds can be modeled by y = 1.5 sin (2t + c), where the phase shift c must be continuously adjusted to compensate for the
different starting positions. If during one ride the horse reached a maximum height after seconds, find the
equation that models the horse’s position.
SOLUTION: First, find the period of y = 1.5 sin (2t + c).
Since the period is π, the function will reach a maximum height at radians. The phase shift is the difference
between the horizontal position of the function at and radians, which is radians. Substitute and b into
the phase shift formula to find c.
Therefore, the equation is
Write an equation that corresponds to each graph.
31.
SOLUTION: Sample answer: There is an x-intercept at 0, so one equation that corresponds to this graph is y = a sin (bx + c) + d. Half of the distance from the maximum to the minimum value of the function is 3. So, the amplitude is 3. It appears that the function completes one period on [0, π]. Find b.
The midline appears to be at y = 0, so there does not appear to be any vertical shift. Therefore, one equation that corresponds to this graph is y = 3 sin (2x).
33.
SOLUTION: Sample answer: Because there is a y-intercept at 3, one equation that corresponds to this graph is y = a cos (bx + c)+ d. Half of the distance from the maximum to the minimum value of the function is 4 ÷ 2 or 2. So, the amplitude is 2.
It appears that the function completes one period on Find b.
The midline appears to be at y = 1, so there is a vertical shift 1 unit up. Therefore, one equation that corresponds to this graph is y = 2 cos 4x + 1.
Write an equation for a sinusoidal function with the given period and amplitude that passes through the given point.
35. period: ; amplitude: 5; point:
SOLUTION: Use the period to find b.
Sample answer: One sinusoidal function in which a = 5 and b = 2 is y = 5 cos 2x. Evaluate the function for
The function passes through . Therefore, a sinusoidal function with period π and amplitude 5 that passes
through the point is y = 5 cos 2x.
37. period: ; amplitude: ; point:
SOLUTION: Use the period to find b.
Sample answer: One sinusoidal function in which a = 1.5 and b = 4 is y = 1.5 cos 4x. Evaluate the function for
The function passes through . Therefore, a sinusoidal function with period and amplitude 1.5 that passes
through the point is y = 1.5 cos 4x.
39. MULTIPLE REPRESENTATIONS In this problem, you will investigate the change in the graph of a sinusoidal function of the form y = sin x or y = cos x when multiplied by a polynomial function. a. GRAPHICAL Use a graphing calculator to sketch the graphs of y = 2x, y = –2x, and y = 2x cos x on the same coordinate plane, on the interval [–20, 20]. b. VERBAL Describe the behavior of the graph of y = 2x cos x in relation to the graphs of y = 2x and y = –2x.
c. GRAPHICAL Use a graphing calculator to sketch the graphs of y = x2, y = –x
2, and y = x
2 sin x on the same
coordinate plane, on the interval [–20, 20].
d. VERBAL Describe the behavior of the graph of y = x2 sin x in relation to the graphs of y = x
2 and y = –x
2.
e. ANALYTICAL Make a conjecture as to the behavior of the graph of a sinusoidal function of the form y = sin x or y = cos x when multiplied by polynomial function of the form y = f (x).
SOLUTION: a.
b. The graph of y = 2x cos x oscillates between the graphs of y = 2x and y = –2x. c.
d. The graph of y = x
2 sin x oscillates between the graphs of y = x
2 and y = –x
2.
e . The graph of y = f (x) sin x or y = f (x) cos x will oscillate between the graphs of y = f (x) and y = –f (x).
REASONING Determine whether each statement is true or false . Explain your reasoning.
41. Every sine function of the form y = a sin (bx + c) + d can be written as a cosine function of the form y = a cos (bx + c) + d.
SOLUTION: True; sample answer: The graph of cosine is a horizontal translation of the sine graph. Therefore, a cosine function can be written from any sine function using the same amplitude and period by applying the necessary phase shift.
43. CHALLENGE How many zeros does y = cos 1500x have on the interval 0 ≤ x ≤ 2 ?
SOLUTION: Find the period of y = cos 1500x.
Graph y = cos 1500x on .
The graph of y = cos 1500x has two x-intercepts for one cycle, so the function has 2 zeros per cycle. Find the
number of cycles for y = cos 1500x on [0, 2 ].
So, the graph of y = cos 1500x will complete 1500 cycles on [0, 2 ]. Because there are two zeros per cycle, y =
cos 1500x will have 1500(2) or 3000 zeros on [0, 2 ].
45. Writing in Math The Power Tower ride in Sandusky, Ohio, is shown below. Along the side of each tower is a string of lights that send a continuous pulse of light up and down each tower at a constant rate. Explain why the distance d of this light from the ground over time t cannot be represented by a sinusoidal function.
SOLUTION: Sample answer: Although the pulse of light can be represented as a function with a period, it is not a sinusoidal function because the distance the pulse of light is from the ground changes at a constant rate. As a result, the graph of this function would resemble the graph below.
The given point lies on the terminal side of an angle θ in standard position. Find the values of the six
trigonometric functions of θ. 47. (8, −2)
SOLUTION: Use the values of x and y to find r.
Use x = 8, y = –2, and r = to write the six trigonometric ratios.
49. (4, 5)
SOLUTION: Use the values of x and y to find r.
Use x = 4, y = 5, and r = to write the six trigonometric ratios.
Write each degree measure in radians as a multiple of π and each radian measure in degrees.
51. −420°
SOLUTION:
To convert a degree measure to radians, multiply by
53.
SOLUTION:
To convert a radian measure to degrees, multiply by
State the number of possible real zeros and turning points of each function. Then determine all of the real zeros by factoring.
55. f (x) = x3 + 2x
2 – 8x
SOLUTION: The degree of f (x) is 3, so it will have at most three real zeros and two turning points.
So, the zeros are −4, 0, and 2.
57. f (x) = x5 + 2x
4 – 4x
3 – 8x
2
SOLUTION: The degree of f (x) is 5, so it will have at most five real zeros and four turning points.
So, the zeros are −2, 0, and 2.
Determine whether f has an inverse function. If it does, find the inverse function and state any restrictions on its domain.
59. f (x) = −x – 2
SOLUTION:
Graph f (x) = −x – 2.
The graph of f passes the horizontal line test. Therefore, f is a one-to-one function and has an inverse function. From
the graph, you can see that f has domain (– , ) and range (– , ). Now find f–1
.
Because f–1
and f are the same function, the domain and range of f are equal to the domain and range of f–1
,
respectively. Therefore, it is not necessary to restrict the domain of f–1
.
61. f (x) = (x – 3)2 – 7
SOLUTION:
Graph f (x) = (x – 3)2 – 7.
The graph of f does not pass the horizontal line test. Therefore, f is not a one-to-one function and does not have an inverse function.
63. SAT/ACT If x + y = 90° and x and y are both nonnegative angles, what is equal to ?
A 0
B
C 1
D
E Cannot be determined from the information given.
SOLUTION:
If x + y = 90º, then x = 90º – y , and can be rewritten as . Let y = 60º.
Try a second angle. Let y = 45º.
Therefore, = 1, and the correct answer is C.
65. Identify the equation represented by the graph.
A y = sin 4x
B y = sin 2x
C y = 2 sin 2x
D y = 4 sin x
SOLUTION:
From the graph, it appears that the amplitude is 2 and the period is π. Use the period to find b.
So, the sine function represented by the graph could be y = 2 sin 2x. Therefore, the correct answer is C.
eSolutions Manual - Powered by Cognero Page 25
4-4 Graphing Sine and Cosine Functions