4 10 noise - trpa
TRANSCRIPT

NOISE
B o u l d e r B a y C o m m u n i t y E n h a n c e m e n t P r o g r a m P r o j e c t E I S
N O V E M B E R 4 , 2 0 0 9 H A U G E B R U E C K A S S O C I A T E S P A G E 4 . 1 0 - 1
4.10 NOISE
Noise impact in urban settings comes from different sources. Some sources are activities essential for
health and safety reasons, such as noise from emergency vehicles, garbage collection and construction
and maintenance equipment. Other sources such as traffic, stem from the movement of people and goods,
activities that are essential to the viability of a community. Although these and other noise producing
activities are necessary, the noise they produce is often undesirable. Simply put noise is defined as any
unwanted sound.
The following analysis discusses the potential noise impacts that stem from activities that occur within the
project area, and potential noise levels generated from activities that occur outside of the project area
(e.g., traffic noise from SR 28) that may impact land uses proposed within the project area. This section
also provides information on the existing noise environment and proposes mitigation measures, where
necessary, to ensure compliance with state and local noise criteria.
ENVIRONMENTAL SETTING
Regional Setting
The project site is located within Washoe County on the Nevada and California state border. This portion
of Washoe County consists of residential, commercial, light industrial, gaming, and other recreational
uses including hiking, biking, skiing, and various lake activities. The primary sources of noise in this area
are generated from vehicular traffic along State Route 28 (SR 28) and other nearby roads.
Acoustic Terminology1
Acoustics is the science of sound, while sound may be thought of as mechanical energy of a vibrating
object transmitted by pressure waves through a medium to human (or animal) ears. If variations in
pressure waves occur frequently enough (at least 20 times per second), then these waves can be heard as
what we call sound. The actual number of pressure variations per second is called the frequency of
sound, and is expressed as cycles per second or Hertz (Hz).
Noise is the subjective reaction to different types of sounds. Noise is typically defined as (airborne)
sound that is loud, unpleasant, unexpected or undesired, and may therefore be classified as a more
specific group of sounds. Perceptions of sound and noise are highly subjective as it is sometimes said:
one person's music is another's headache.
Measuring sound directly in terms of pressure requires a very large range of numbers. To avoid the use of
such a large range of numbers in evaluating sound, the decibel scale was devised. The decibel scale uses
the hearing threshold (20 micropascals), as a point of reference, defined as 0 dB. Other sound pressures
are then compared to this reference pressure, and a logarithm is used to keep the numbers in a practical
range. The decibel scale allows a million-fold increase in pressure to be expressed as 120 dB, and
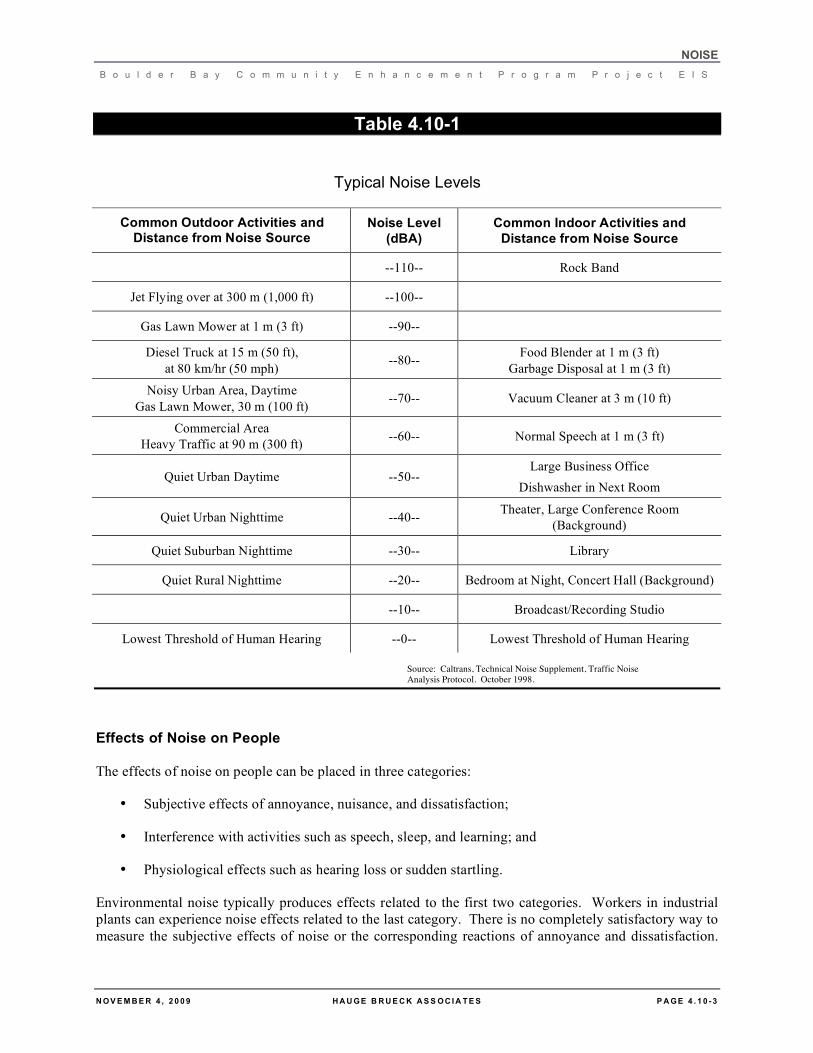
changes in levels (dB) correspond closely to human perception of relative loudness (see Table 4.10-1).
1 For an explanation of these terms, see Appendix Y-1: "Acoustical Terminology"

NOISE
B o u l d e r B a y C o m m u n i t y E n h a n c e m e n t P r o g r a m P r o j e c t E I S
N O V E M B E R 4 , 2 0 0 9 H A U G E B R U E C K A S S O C I A T E S P A G E 4 . 1 0 - 2
The perceived loudness of sounds is dependent upon many factors, including sound pressure level and
frequency content. However, within the usual range of environmental noise levels (e.g., the decibel
scale), perception of loudness is relatively predictable, and can be approximated by A-weighted sound
levels. There is a strong correlation between A-weighted sound levels (expressed as dBA) and the way the
human ear perceives sound. For this reason, the A-weighted sound level has become the standard tool of
environmental noise assessment. All noise levels reported in this section are in terms of A-weighted
levels.
The decibel scale is logarithmic, not linear. In other words, two sound levels 10 dB apart differ in
acoustic energy by a factor of 10. Using A-weighted sound levels, an increase of 10 dBA is generally
perceived as a doubling in loudness. For example, a 70 dBA sound is half as loud as an 80 dBA sound,
and twice as loud as a 60 dBA sound. If you doubled the traffic on a highway, you would increase the
noise level by approximately 3 dBA.
Community noise is commonly described in terms of the ambient noise level, which is defined as the all-
encompassing noise level associated with a given environment. A common statistical tool to measure the
ambient noise level is the average, or equivalent, sound level (Leq), which corresponds to a steady-state A
weighted sound level containing the same total energy as a time varying signal over a given time period
(usually one hour). The Leq is the foundation of the composite noise descriptor, Community Noise
Equivalent Level (CNEL), and shows very good correlation with community response to noise. The
Tahoe Regional Planning Agency (TRPA) has adopted environmental thresholds for the Lake Tahoe
Region. The noise standards, or "Thresholds" as they are commonly referred to, apply maximum
numerical CNEL values for various land use categories and transportation corridors. A more detailed
discussion of TRPA standards is provided in the “Regulatory Setting” section below.
The CNEL is the 24-hour average noise level of all hourly Leq measurements with a 10 dB penalty added
to the levels between 2200 (10:00 p.m.) and 0700 (7:00 a.m.) hours and for the purposes of TRPA
calculations, a 5 dB penalty added to the levels between 1900 (7:00 p.m.) and 2200 (10:00 p.m.) hours to
reflect people’s sensitivity to noise during the nighttime and evening hours. Because CNEL represents a
24-hour average, it tends to disguise short-term variations in the noise environment.
Table 4.10-1 lists several examples of the noise levels associated with common situations.
Noise sources that produce ambient noise levels in the vicinity of the project area are associated almost
exclusively with traffic on SR 28. There are noise sensitive land uses in the project area and immediate
vicinity including homes and recreational users (i.e., hiker, cyclist, etc.). Temporary noise associated
with construction may be prevalent in the area, but these noises would be limited to the time and duration
of construction activities.
Vibration is an oscillatory motion, which can be described in terms of displacement, velocity, or
acceleration. The displacement for a vibrating floor is simply the distance that a point on the floor moves
away from its static position. The velocity represents the instantaneous speed of the floor movement and
acceleration is the rate of change of the speed. The response of humans, buildings, and equipment to
vibration is normally described using velocity or acceleration.
Vibration amplitudes are usually expressed as either peak particle velocity (PPV) or the root mean square
(RMS) velocity. The PPV is defined as the maximum instantaneous peak of the vibration signal. The
RMS of a signal is the average of the squared amplitude of the signal. PPV will be used in this analysis to
evaluate the potential of building damage associated with blasting or other high vibration construction
activities.
NOISE
B o u l d e r B a y C o m m u n i t y E n h a n c e m e n t P r o g r a m P r o j e c t E I S
N O V E M B E R 4 , 2 0 0 9 H A U G E B R U E C K A S S O C I A T E S P A G E 4 . 1 0 - 3
Table 4.10-1
Typical Noise Levels
Common Outdoor Activities and Distance from Noise Source
Noise Level
(dBA)
Common Indoor Activities and
Distance from Noise Source
--110-- Rock Band
Jet Flying over at 300 m (1,000 ft) --100--
Gas Lawn Mower at 1 m (3 ft) --90--
Diesel Truck at 15 m (50 ft),
at 80 km/hr (50 mph) --80--
Food Blender at 1 m (3 ft)
Garbage Disposal at 1 m (3 ft)
Noisy Urban Area, Daytime
Gas Lawn Mower, 30 m (100 ft) --70-- Vacuum Cleaner at 3 m (10 ft)
Commercial Area
Heavy Traffic at 90 m (300 ft) --60-- Normal Speech at 1 m (3 ft)
Quiet Urban Daytime --50-- Large Business Office
Dishwasher in Next Room
Quiet Urban Nighttime --40-- Theater, Large Conference Room
(Background)
Quiet Suburban Nighttime --30-- Library
Quiet Rural Nighttime --20-- Bedroom at Night, Concert Hall (Background)
--10-- Broadcast/Recording Studio
Lowest Threshold of Human Hearing --0-- Lowest Threshold of Human Hearing
Source: Caltrans, Technical Noise Supplement, Traffic Noise
Analysis Protocol. October 1998.
Effects of Noise on People
The effects of noise on people can be placed in three categories:
• Subjective effects of annoyance, nuisance, and dissatisfaction;
• Interference with activities such as speech, sleep, and learning; and
• Physiological effects such as hearing loss or sudden startling.
Environmental noise typically produces effects related to the first two categories. Workers in industrial
plants can experience noise effects related to the last category. There is no completely satisfactory way to
measure the subjective effects of noise or the corresponding reactions of annoyance and dissatisfaction.

NOISE
B o u l d e r B a y C o m m u n i t y E n h a n c e m e n t P r o g r a m P r o j e c t E I S
N O V E M B E R 4 , 2 0 0 9 H A U G E B R U E C K A S S O C I A T E S P A G E 4 . 1 0 - 4
A wide variation in individual thresholds of annoyance exists and different tolerances to noise tend to
develop based on an individual’s past experiences with noise.
Thus, an important way of predicting a human reaction to a new noise environment is the way it compares
to the existing environment to which one has adapted: the so-called ambient noise level. In general, the
more a new noise exceeds the previously existing ambient noise level, the less acceptable the new noise
will be judged by those hearing it.
With regard to increases in A-weighted noise level, the following relationships occur:
• Except in carefully controlled laboratory experiments, a change of 1 dBA cannot be perceived;
• A change in noise levels of 3 dBA is considered a just-perceivable difference;
• A change in level of at least 5 dBA is required before any noticeable change in human response
would be expected; and
• A 10 dBA change is subjectively heard as approximately a doubling in loudness, and can cause
an adverse response.
Stationary point sources of noise (i.e., HVAC systems, idling vehicles, etc.) attenuate (lessen) at a rate of
approximately 6 dB each time the distance from the noise source is doubled, depending on environmental
conditions (i.e., atmospheric conditions, placement of vegetative or manufactured noise barriers, etc.).
Widely distributed noises, such as a large industrial facility spread over many acres, or a street with
moving vehicles, would typically attenuate at a lower rate, between 3 dB and 4.5 dB per doubling of
distance.
Major Noise Sources in the Project Vicinity
Transportation
Vehicle traffic on SR 28 and other local roadways has been identified as the primary noise source
within the project vicinity. To determine existing traffic noise levels at identified noise sensitive
land uses within the project vicinity, j.c. brennan & associates, Inc. used the Federal Highway
Administration Highway Traffic Noise Prediction Model (FHWA-RD-77-108). The FHWA
Model is based upon standard noise factors for automobiles, medium trucks and heavy trucks, and
includes inputs to document vehicle volume, speed, roadway configuration, distance to the
receiver, and the acoustical characteristics of the site. The FHWA model inputs consisted of
existing traffic volumes obtained from Fehr & Peers Transportation Engineers and j.c. brennan &
associates, Inc. site observations. A compete listing of the FHWA model inputs is provided in
Appendix Y-2.
Table 4.10-2 shows the predicted existing traffic noise levels in terms of the Community Noise
Equivalent Level descriptor (CNEL) at a standard distance of 100 feet from the centerlines of the
existing immediate project-area roadways for existing conditions, as well as distances to existing
traffic noise contours. The modeled CNEL values generated by the FHWA model only represent
the noise associated with traffic and do not account for noise associated with other noise sources
in the vicinity. Other noise sources are discussed below. The extent by which existing land uses
in the project vicinity are affected by existing traffic noise depends on their respective proximity
to the roadways and their individual sensitivity to noise.

NOISE
B o u l d e r B a y C o m m u n i t y E n h a n c e m e n t P r o g r a m P r o j e c t E I S
N O V E M B E R 4 , 2 0 0 9 H A U G E B R U E C K A S S O C I A T E S P A G E 4 . 1 0 - 5
Table 4.10-2
Modeled Existing Baseline Traffic Noise Levels
Distance to CNEL Contours (feet)
Roadway Segment
Traffic Noise Level @ 100
feet Traffic Noise
Level @ 301 feet 60 dB 55 dB
SR 28 W. of Mount Rose 62 dB CNEL 55 dB CNEL 131 281
SR 28 E. of Mount Rose 61 dB CNEL 54 dB CNEL 125 270
SR 28 W. of Lakeshore 61 dB CNEL 54 dB CNEL 124 266
SR 28 E. of Lakeshore 61 dB CNEL 54 dB CNEL 111 240
SR 28 N. of Reservoir Rd 61 dB CNEL 54 dB CNEL 117 253
SR 28 S. of Reservoir Rd. 61 dB CNEL 54 dB CNEL 115 248
SR 28 W. of Biltmore Drive 61 dB CNEL 54 dB CNEL 116 249
SR 28 E. of Biltmore Drive 61 dB CNEL 54 dB CNEL 116 250
SR 28 W. of Stateline Rd 61 dB CNEL 54 dB CNEL 118 255
SR 28 E. of Stateline Rd 61 dB CNEL 54 dB CNEL 116 250
SR 28 W. of Coon St. 61 dB CNEL 54 dB CNEL 121 260
SR 28 E. of Coon St. 61 dB CNEL 54 dB CNEL 116 250
SR 28 W. of SR 267 61 dB CNEL 54 dB CNEL 125 269
SR 28 E. of SR 267 62 dB CNEL 55 dB CNEL 139 299
SR 267 N. of SR 28 60 dB CNEL 53 dB CNEL 96 207
Lakeshore S. of SR 28 52 dB CNEL N/A 29 62
Pinion N. of SR 28 43 dB CNEL N/A 8 17
Reservoir Rd W. of SR 28 46 dB CNEL N/A 11 24
Reservoir Rd W. of Wassou Rd. 37 dB CNEL N/A 3 6
Reservoir Rd E. of Wassou Rd. 47 dB CNEL N/A 13 27
Wassou Rd S. of Reservoir Rd. 47 dB CNEL N/A 13 29
Wassou Rd N. of Reservoir Rd. 37 dB CNEL N/A 3 7
Stateline Rd N. of SR 28 46 dB CNEL N/A 12 27
Stateline Rd S. of SR 28 43 dB CNEL N/A 7 16
Stateline Rd N. of Cove St. 46 dB CNEL N/A 13 27
Source: j.c. brennan & associates, Inc. 2009
1 Distances are reference distances from centerline of roadway.
N/A Not applicable since it is not a transportation corridor defined by TRPA
FHWA RD77-102 Traffic Noise Prediction Model., Inputs from Fehr & Peers Traffic Consultants
NOISE
B o u l d e r B a y C o m m u n i t y E n h a n c e m e n t P r o g r a m P r o j e c t E I S
N O V E M B E R 4 , 2 0 0 9 H A U G E B R U E C K A S S O C I A T E S P A G E 4 . 1 0 - 6
Non-Transportation
Mixed-use developments, hotels and casinos, and other commercial land uses along the SR 28
corridor inherently have noise producing components associated with their operations. Noise
sources associated with these types of land uses include, but are not limited to:
• HVAC Systems • Cooling Towers/Evaporative Condensers
• Loading Docks • Lift Stations
• Emergency Generators • Outdoor Public Address Systems
Noise-Sensitive Land Uses in the Project Vicinity
Noise sensitive land uses in the immediate project vicinity consist of single-family and multi-family
residential, and to some extent office uses. These land uses are more sensitive to changes in ambient
noise levels.
Existing Ambient Noise Levels
To quantify existing ambient noise levels in the vicinity of the project area, j.c. brennan & associates,
Inc., conducted continuous 24-hour noise level measurements at three locations within the project area, on
Wednesday August 6th
– Thursday August 7th
, 2008. The intent of the 24-hour continuous noise level
measurements was to determine the existing background noise levels on, and within the project vicinity.
The results of the noise level measurements are shown in Table 4.10-3. Continuous noise monitoring
results are presented graphically in Appendix Y-3. The noise measurement sites are shown on Figure
4.10-1.
Equipment used for the noise measurements included Larson Davis Laboratories (LDL) Model 820
precision integrating sound level meters. The meters were calibrated before and after use with an LDL
CAL200 acoustical calibrator to ensure the accuracy of the measurements. The measurement system
meets all pertinent specifications of the American National Standards Institute (ANSI) for precision sound
level measurement equipment.
A description of each of the noise measurement sites is as follows:
Site A - This site was located on Lake View Avenue. This site represents existing residential uses
on Lake View Avenue, adjacent to the west property line of the project area. Traffic on SR 28
was the dominant noise source at this location.
Site B - This site was located west of the project site, and on the northern portion Stateline Road.
This site represents existing residential uses along Stateline Road, and is adjacent to the west
property line of the project area. Noise sources at this location included HVAC systems at the
Tahoe Biltmore and traffic within the existing parking area for the Tahoe Biltmore.
Site C - This site is located on the eastern portion of the project area, and adjacent to SR 28. This
site represents the proposed building façade for Building A which is to be located approximately
90 feet from SR 28 centerline. Traffic on SR 28 was the dominant noise source at this location.

NOISE
B o u l d e r B a y C o m m u n i t y E n h a n c e m e n t P r o g r a m P r o j e c t E I S
N O V E M B E R 4 , 2 0 0 9 H A U G E B R U E C K A S S O C I A T E S P A G E 4 . 1 0 - 7
Table 4.10-3
Existing Ambient Noise Monitoring Results for Continuous Noise Measurement Sites, Boulder Bay – Stateline, Nevada
Site Description GPS Coordinate Plan Area #
CNEL Standard
Measurement Date/Day
Measured CNEL
Attainment? CNEL Delta
A Lakeview Ave. 39° 13’ 46.92” N
120° 00’ 19.04” W 032 60 dB
Aug. 6-7, 2008
Wed/Thurs. 53.8 dB Yes - 6 dB
B North end of Stateline Rd. 39° 13’ 42.08” N
120° 00’ 20.13” W 032 60 dB
Aug. 6-7, 2008
Wed/Thurs. 57.6 dB Yes - 2 dB
C @ 90’ from SR 28 39° 13’ 47.31” N
120° 00’ 13.73” W 032 60 dB
Aug. 6-7, 2008
Wed/Thurs. 61.5 dB No* + 2 dB
Source: j.c. brennan & associates, Inc. 2008-2009
* This noise measurement site was located inside of the SR 28 300 foot corridor.

NOISE
B o u l d e r B a y C o m m u n i t y E n h a n c e m e n t P r o g r a m P r o j e c t E I S
N O V E M B E R 4 , 2 0 0 9 H A U G E B R U E C K A S S O C I A T E S P A G E 4 . 1 0 - 8
Figure 4.10-1 Noise Measurement Sites
REGULATORY SETTING
Tahoe Regional Planning Agency Plan Area Criteria
The Tahoe Regional Planning Agency (TRPA) has adopted environmental thresholds for the Lake Tahoe
Region. The noise standards, or "Thresholds" as they are commonly referred to, are numerical CNEL
values for various land use categories and transportation corridors. TRPA’s CNEL standards include
noise from all sources within a sample area and are based on not-to-exceed noise levels at any place or
time during a 24-hour period within the applicable Plan Area or Transportation Corridor.

NOISE
B o u l d e r B a y C o m m u n i t y E n h a n c e m e n t P r o g r a m P r o j e c t E I S
N O V E M B E R 4 , 2 0 0 9 H A U G E B R U E C K A S S O C I A T E S P A G E 4 . 1 0 - 9
The CNEL is the 24-hour average noise level of all hourly Leq measurements with a 10 dB penalty added
to the levels between 2200 (10:00 p.m.) and 0700 (7:00 a.m.) hours and for the purposes of TRPA
calculations, a 5 dB penalty added to the levels between 1900 (7:00 p.m.) and 2200 (10:00 p.m.) hours to
reflect people’s sensitivity to noise during the nighttime and evening hours.
As a form of zoning, the TRPA has divided the Lake Tahoe Region into more than 175 separate Plan
Areas. Boundaries for each of the Plan Areas have been established based on similar land uses and the
unique character of each geographic area. For each Plan Area, a "Statement" is made as to how that
particular area should be regulated to achieve regional environmental and land use objectives. As a part
of each Statement, an outdoor CNEL standard is established. The project site is located within Plan Area
032 (North Stateline Casino Core) and a small portion of Plan Area 034 (Crystal Bay). The project site is
bordered to the east and west by Plan Area 031 (Brockway) and 033 (Stateline Point) and to the north by
034 (Crystal Bay). The Plan Area Statement for Plan Area 032 defers to the North Stateline Community
Plan noise level criteria. The adjoining Plan Area noise level criteria are shown in Table 4.10-4.
Table 4.10-4
Project and Adjoining Plan Area Statement Noise Level Criteria
Plan Area # Plan Area Name TRPA Noise Level Criteria
031 Brockway 55 dB CNEL for entire Plan Area
032 (Project Site) North Stateline Community Plan See discussion below for the North Stateline
Community Plan
033 Stateline Point 50 dB CNEL for Plan Area,
55 dB CNEL for Highway 28 corridor.
034 (Project Site) Crystal Bay 50 dB CNEL for Plan Area,
55 dB CNEL for Highway 28 corridor.
Tahoe Regional Planning Agency North Stateline Community Plan Criteria
The North Stateline Community Plan has adopted a CNEL standard of 60 dB for the entire Plan Area,
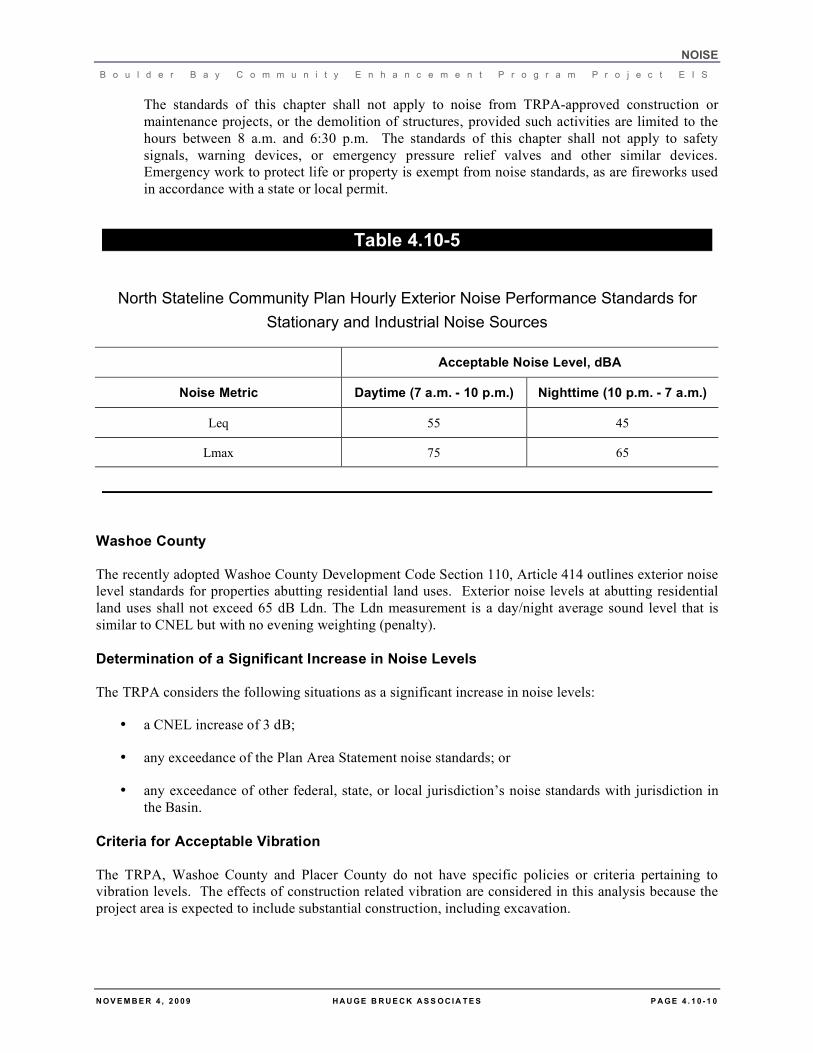
including the State Route 28 corridor. The Community Plan has also established hourly exterior noise
level performance standards for stationary or industrial noise sources. These criteria are shown in Table
4.10-5. These criteria are based upon hourly average (Leq) and maximum (Lmax) noise level descriptors.
The hourly average (Leq) and the maximum (Lmax) noise level descriptors have been found to provide
good correlation to stationary noise sources.
Tahoe Regional Planning Agency Noise Ordinance Criteria:
Chapter 23 of the TRPA Code of Ordinances establishes single event noise level criteria for aircraft,
marine craft, motor vehicles, off-road vehicles and over-snow vehicles. The ordinance also establishes
community noise level standards. TRPA’s Code Section 23.8 provides exemptions to noise limitations
for TRPA approved construction projects. The following is contained in Section 23.8:
NOISE
B o u l d e r B a y C o m m u n i t y E n h a n c e m e n t P r o g r a m P r o j e c t E I S
N O V E M B E R 4 , 2 0 0 9 H A U G E B R U E C K A S S O C I A T E S P A G E 4 . 1 0 - 1 0
The standards of this chapter shall not apply to noise from TRPA-approved construction or
maintenance projects, or the demolition of structures, provided such activities are limited to the
hours between 8 a.m. and 6:30 p.m. The standards of this chapter shall not apply to safety
signals, warning devices, or emergency pressure relief valves and other similar devices.
Emergency work to protect life or property is exempt from noise standards, as are fireworks used
in accordance with a state or local permit.
Table 4.10-5
North Stateline Community Plan Hourly Exterior Noise Performance Standards for
Stationary and Industrial Noise Sources
Acceptable Noise Level, dBA
Noise Metric Daytime (7 a.m. - 10 p.m.) Nighttime (10 p.m. - 7 a.m.)
Leq 55 45
Lmax 75 65
Washoe County
The recently adopted Washoe County Development Code Section 110, Article 414 outlines exterior noise
level standards for properties abutting residential land uses. Exterior noise levels at abutting residential
land uses shall not exceed 65 dB Ldn. The Ldn measurement is a day/night average sound level that is
similar to CNEL but with no evening weighting (penalty).
Determination of a Significant Increase in Noise Levels
The TRPA considers the following situations as a significant increase in noise levels:
• a CNEL increase of 3 dB;
• any exceedance of the Plan Area Statement noise standards; or
• any exceedance of other federal, state, or local jurisdiction’s noise standards with jurisdiction in
the Basin.
Criteria for Acceptable Vibration
The TRPA, Washoe County and Placer County do not have specific policies or criteria pertaining to
vibration levels. The effects of construction related vibration are considered in this analysis because the
project area is expected to include substantial construction, including excavation.

NOISE
B o u l d e r B a y C o m m u n i t y E n h a n c e m e n t P r o g r a m P r o j e c t E I S
N O V E M B E R 4 , 2 0 0 9 H A U G E B R U E C K A S S O C I A T E S P A G E 4 . 1 0 - 1 1
Human and structural response to different vibration levels is influenced by a number of factors, including
ground type, distance between source and receptor, duration, and the number of perceived vibration
events. Table 4.10-6, which was developed by Caltrans, shows the vibration levels which would
normally be required to result in damage to structures. The vibration levels are presented in terms of peak
particle velocity in inches per second.
Table 4.10-6
Effects of Various Vibration Levels on People and Buildings
Peak Particle Velocity
inches/second
Peak Particle Velocity
mm/second Human Reaction Effect on Buildings
0.0-0.006 0.15 Imperceptible by people Vibrations unlikely to cause damage
of any type
0.006-0.02 0.5 Range of Threshold of
perception
Vibrations unlikely to cause damage
of any type
0.08 2.0 Vibrations clearly perceptible
Recommended upper level of which
ruins and ancient monuments should
be subjected
0.1 2.54
Level at which continuous
vibrations begin to annoy
people
Virtually no risk of architectural
damage to normal buildings
0.2 5.0 Vibrations annoying to people
in buildings
Threshold at which there is a risk of
architectural damage to normal
dwellings
1.0 25.4 Architectural Damage
2.0 50.4 Structural Damage to Residential
Buildings
6.0 151.0 Structural Damage to Commercial
Buildings
Source: Survey of Earth-borne Vibrations due to Highway
Construction and Highway Traffic, Caltrans 1976
Table 4.10-6 indicates that the threshold for damage to structures ranges from 2 to 6 in/sec. One-half this
minimum threshold or 1 in/sec p.p.v. is considered a safe criterion that would protect against architectural
or structural damage. The general threshold at which human annoyance could occur is noted as 0.1 in/sec
p.p.v.
NOISE
B o u l d e r B a y C o m m u n i t y E n h a n c e m e n t P r o g r a m P r o j e c t E I S
N O V E M B E R 4 , 2 0 0 9 H A U G E B R U E C K A S S O C I A T E S P A G E 4 . 1 0 - 1 2
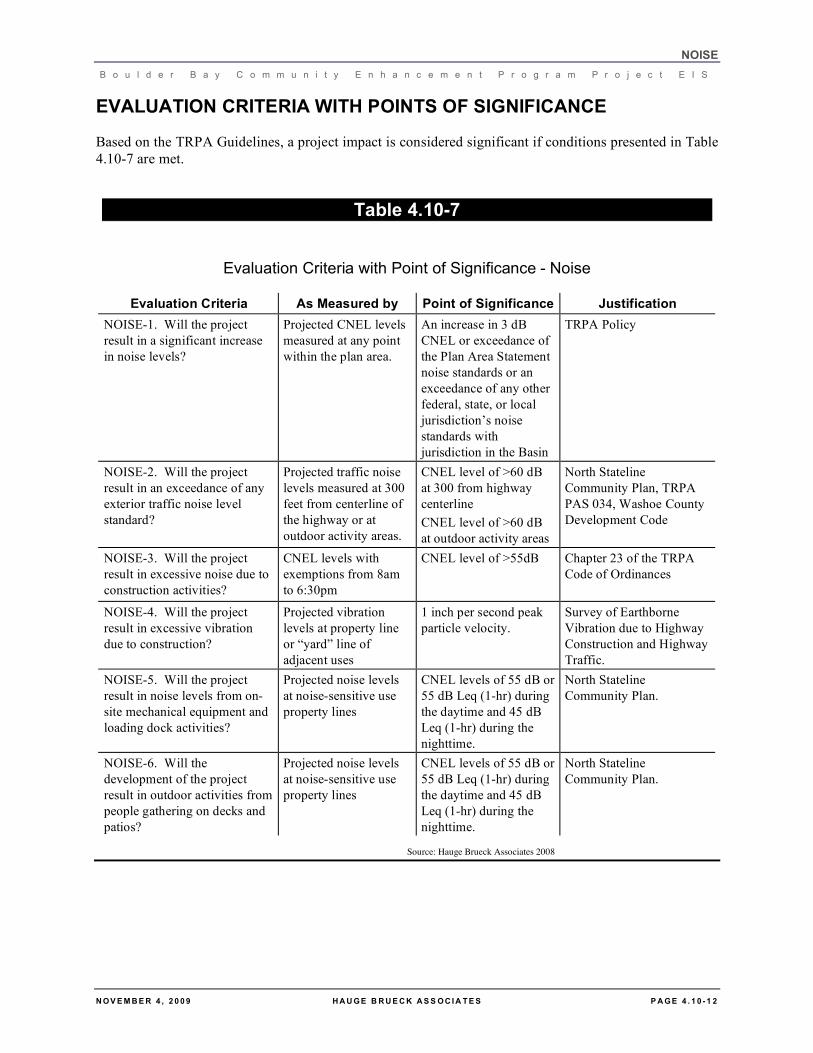
EVALUATION CRITERIA WITH POINTS OF SIGNIFICANCE
Based on the TRPA Guidelines, a project impact is considered significant if conditions presented in Table
4.10-7 are met.
Table 4.10-7
Evaluation Criteria with Point of Significance - Noise
Evaluation Criteria As Measured by Point of Significance Justification
NOISE-1. Will the project
result in a significant increase
in noise levels?
Projected CNEL levels
measured at any point
within the plan area.
An increase in 3 dB
CNEL or exceedance of
the Plan Area Statement
noise standards or an
exceedance of any other
federal, state, or local
jurisdiction’s noise
standards with
jurisdiction in the Basin
TRPA Policy
NOISE-2. Will the project
result in an exceedance of any
exterior traffic noise level
standard?
Projected traffic noise
levels measured at 300
feet from centerline of
the highway or at
outdoor activity areas.
CNEL level of >60 dB
at 300 from highway
centerline
CNEL level of >60 dB
at outdoor activity areas
North Stateline
Community Plan, TRPA
PAS 034, Washoe County
Development Code
NOISE-3. Will the project
result in excessive noise due to
construction activities?
CNEL levels with
exemptions from 8am
to 6:30pm
CNEL level of >55dB Chapter 23 of the TRPA
Code of Ordinances
NOISE-4. Will the project
result in excessive vibration
due to construction?
Projected vibration
levels at property line
or “yard” line of
adjacent uses
1 inch per second peak
particle velocity.
Survey of Earthborne
Vibration due to Highway
Construction and Highway
Traffic.
NOISE-5. Will the project
result in noise levels from on-
site mechanical equipment and
loading dock activities?
Projected noise levels
at noise-sensitive use
property lines
CNEL levels of 55 dB or
55 dB Leq (1-hr) during
the daytime and 45 dB
Leq (1-hr) during the
nighttime.
North Stateline
Community Plan.
NOISE-6. Will the
development of the project
result in outdoor activities from
people gathering on decks and
patios?
Projected noise levels
at noise-sensitive use
property lines
CNEL levels of 55 dB or
55 dB Leq (1-hr) during
the daytime and 45 dB
Leq (1-hr) during the
nighttime.
North Stateline
Community Plan.
Source: Hauge Brueck Associates 2008

NOISE
B o u l d e r B a y C o m m u n i t y E n h a n c e m e n t P r o g r a m P r o j e c t E I S
N O V E M B E R 4 , 2 0 0 9 H A U G E B R U E C K A S S O C I A T E S P A G E 4 . 1 0 - 1 3
ENVIRONMENTAL IMPACTS AND MITIGATION MEASURES
IMPACT: NOISE-1: Will the project result in a significant increase in traffic noise levels?
Analysis: No Impact; Alternative A
Alternative A will not result in changes to traffic levels or operation of the existing land
uses. Therefore, no changes to existing noise levels will occur.
Mitigation: No mitigation is required.
Analysis: Significant Impact: Alternatives B, C, and D
As documented in Tables 4.10-8 through 4.10-13, Alternatives B, C & D will result in
significant increases in traffic noise levels along Stateline Road between SR 28 and Cove
Street of between +3 dB and +4 dB CNEL.
To assess noise impacts due to project-related traffic increases on the existing local
roadway network, traffic noise levels were predicted at a representative distance for
Existing Plus Project (Alt C), Cumulative Plus Project (Alt C), and for each of the action
Alternatives (B, D and E).
The FHWA traffic noise prediction model was used to predict traffic noise levels at a
representative distance of 100 feet from the roadway centerline. Table 4.10-8 shows the
predicted traffic noise level increases on the local roadway network for Existing and
Existing Plus Project (Alt. C) conditions. Table 4.10-9 shows the predicted traffic noise
level increases on the local roadway network for Cumulative and the Cumulative Plus
Project (Alt. C) conditions.
Tables 4.10-10 through 4.10-13 show the predicted traffic noise level increases for
Alternatives B and D under both existing and cumulative conditions.
Mitigation: NOISE-1: Use of Alternative Pavement
A 4 dB reduction in noise is possible with the use of alternative pavement treatments. As
a part of the project design, Boulder Bay will repave Stateline Road between SR 28 and
Cove Street using rubberized asphalt or other noise reducing road surfaces that have
shown acceptable noise reductions.
After
Mitigation: Less than Significant: Alternatives B, C and D
Implementation of mitigation measure Noise-1 will reduce the impact to a less than
significant level.
Analysis: Less than Significant Impact; Alternative E
As documented in Tables 4.10-14 and 4.10-15, Alternative E will not result in a
noticeable change to existing noise levels. Therefore, this impact is considered to be less
than significant.
Mitigation: No mitigation is required.

NOISE
B o u l d e r B a y C o m m u n i t y E n h a n c e m e n t P r o g r a m P r o j e c t E I S
N O V E M B E R 4 , 2 0 0 9 H A U G E B R U E C K A S S O C I A T E S P A G E 4 . 1 0 - 1 4
Table 4.10-8
Modeled Existing and Existing + Project (Alternative C) Traffic Noise Levels
Traffic Noise Levels (CNEL, dBA) Distance to Existing
Contours (feet) Distance to Existing + Project Contours (feet)
Roadway Segment TRPA CNEL Std Distance1 Existing
Existing +
Project Change 60 CNEL 55 CNEL 60 CNEL 55 CNEL
SR 28 W. of Mount Rose 55 dB 100 feet 62 62 0 131 281 129 279
SR 28 E. of Mount Rose 55 dB 100 feet 61 61 0 125 270 124 268
SR 28 W. of Lakeshore 55 dB 100 feet 61 61 0 124 266 122 263
SR 28 E. of Lakeshore 55 dB 100 feet 61 61 0 111 240 110 238
SR 28 N. of Reservoir
Rd/Wellness
60 dB 100 feet 61 61 0 117 253 118 254
SR 28 S. of Reservoir
Rd./Wellness
60 dB 100 feet 61 61 0 115 248 116 250
SR 28 W. of Stateline Rd 60 dB 100 feet 61 61 0 118 255 117 252
SR 28 E. of Stateline Rd 60 dB 100 feet 61 61 0 116 250 116 251
SR 28 W. of Coon St. 55 dB 100 feet 61 61 0 121 260 120 258
SR 28 E. of Coon St. 55 dB 100 feet 61 61 0 116 250 119 255
SR 28 W. of SR 267 55 dB 100 feet 61 61 0 125 269 124 268
SR 28 E. of SR 267 55 dB 100 feet 62 62 0 139 299 138 297
SR 267 N. of SR 28 55 dB 100 feet 60 60 0 96 207 96 206
Lakeshore S. of SR 28 55 dB 100 feet 52 52 0 29 62 28 61
Pinion N. of SR 28 60 dB 100 feet 43 42 -1 8 17 7 14
Stateline Rd N. of SR 28 60 dB 100 feet 46 49 +3 12 27 18 38
Stateline Rd S. of SR 28 55 dB 100 feet 43 43 0 7 16 7 16
Stateline Rd N. of Cove St. 60 dB 100 feet 46 43 -3 13 27 7 15
Source – j.c. brennan & associates, Inc. – 2008
1 Distances are reference distances from centerline of roadway.

NOISE
B o u l d e r B a y C o m m u n i t y E n h a n c e m e n t P r o g r a m P r o j e c t E I S
N O V E M B E R 4 , 2 0 0 9 H A U G E B R U E C K A S S O C I A T E S P A G E 4 . 1 0 - 1 5
Table 4.10-9
Modeled Cumulative and Cumulative + Project (Alternative C) Traffic Noise Levels
Traffic Noise Levels (CNEL, dBA) Distance to Cumulative
Contours (feet) Distance to Cumulative
+ Project Contours (feet)
Roadway Segment TRPA CNEL Std Distance1 Cumulative
Cumulative
+ Project Change 60 CNEL 55 CNEL 60 CNEL 55 CNEL
SR 28 W. of Mount Rose 55 dB 100 feet 62 63 0 145 313 149 320
SR 28 E. of Mount Rose 55 dB 100 feet 62 62 0 136 293 138 298
SR 28 W. of Lakeshore 55 dB 100 feet 62 62 0 137 296 140 303
SR 28 E. of Lakeshore 55 dB 100 feet 61 62 +1 124 267 127 273
SR 28 N. of Reservoir
Rd/Wellness 60 dB
100 feet 62
62 0 133 287 136 294
SR 28 S. of Reservoir
Rd./Wellness 60 dB
100 feet 62
62 0 133 287 135 290
SR 28 W. of Stateline Rd 60 dB 100 feet 62 62 0 134 289 136 292
SR 28 E. of Stateline Rd 60 dB 100 feet 62 62 0 133 288 135 291
SR 28 W. of Coon St. 55 dB 100 feet 62 62 0 137 294 138 297
SR 28 E. of Coon St. 55 dB 100 feet 62 62 0 136 292 137 295
SR 28 W. of SR 267 55 dB 100 feet 62 62 0 144 310 136 293
SR 28 E. of SR 267 55 dB 100 feet 63 63 0 164 354 157 338
SR 267 N. of SR 28 55 dB 100 feet 61 61 0 109 235 108 234
Lakeshore S. of SR 28 55 dB 100 feet 52 53 +1 31 67 32 68
Pinion N. of SR 28 60 dB 100 feet 42 42 0 7 14 7 14
Stateline Rd N. of SR 28 60 dB 100 feet 45 49 +4 11 23 18 38
Stateline Rd S. of SR 28 55 dB 100 feet 43 43 0 7 16 7 16
Stateline Rd N. of Cove St. 60 dB 100 feet 46 43 -3 11 24 7 15
Source – j.c. brennan & associates, Inc. – 2008
1 Distances are reference distances from centerline of roadway.

NOISE
B o u l d e r B a y C o m m u n i t y E n h a n c e m e n t P r o g r a m P r o j e c t E I S
N O V E M B E R 4 , 2 0 0 9 H A U G E B R U E C K A S S O C I A T E S P A G E 4 . 1 0 - 1 6
Table 4.10-10
Modeled Existing and Existing + Alternative B Traffic Noise Levels
Traffic Noise Levels (CNEL, dBA) Distance to Existing
Contours (feet) Distance to Existing + Alt
B Contours (feet)
Roadway Segment TRPA CNEL Std Distance1 Existing
Existing +
Alt B Change 60 CNEL 55 CNEL 60 CNEL 55 CNEL
SR 28 W. of Mount Rose 55 dB 100 feet 62 62 0 131 281 133 287
SR 28 E. of Mount Rose 55 dB 100 feet 61 62 +1 125 270 127 273
SR 28 W. of Lakeshore 55 dB 100 feet 61 62 +1 124 266 126 271
SR 28 E. of Lakeshore 55 dB 100 feet 61 61 0 111 240 111 239
SR 28 N. of Reservoir Rd 60 dB 100 feet 61 61 0 117 253 122 264
SR 28 S. of Reservoir Rd 60 dB 100 feet 61 61 0 115 248 118 255
SR 28 W. of Stateline Rd 60 dB 100 feet 61 61 0 118 255 121 261
SR 28 E. of Stateline Rd 60 dB 100 feet 61 61 0 116 250 118 254
SR 28 W. of Coon St. 55 dB 100 feet 61 61 0 121 260 124 266
SR 28 E. of Coon St. 55 dB 100 feet 61 61 0 116 250 1423 264
SR 28 W. of SR 267 55 dB 100 feet 61 62 +1 125 269 127 273
SR 28 E. of SR 267 55 dB 100 feet 62 62 0 139 299 142 305
SR 267 N. of SR 28 55 dB 100 feet 60 60 0 96 207 98 210
Lakeshore S. of SR 28 55 dB 100 feet 52 52 0 29 62 29 63
Pinion N. of SR 28 60 dB 100 feet 43 42 -1 8 17 7 14
Stateline Rd N. of SR 28 60 dB 100 feet 46 48 .+2 12 27 15 32
Stateline Rd S. of SR 28 55 dB 100 feet 43 43 0 7 16 7 16
Stateline Rd N. of Cove St. 60 dB 100 feet 46 48 +2 13 27 15 33
Source – j.c. brennan & associates, Inc. – 2008
1 Distances are reference distances from centerline of roadway.

NOISE
B o u l d e r B a y C o m m u n i t y E n h a n c e m e n t P r o g r a m P r o j e c t E I S
N O V E M B E R 4 , 2 0 0 9 H A U G E B R U E C K A S S O C I A T E S P A G E 4 . 1 0 - 1 7
Table 4.10-11
Modeled Cumulative and Cumulative + Alternative B Traffic Noise Levels
Traffic Noise Levels (CNEL, dBA) Distance to Cumulative
Contours (feet)
Distance to Cumulative
+ Alt B Contours (feet)
Roadway Segment TRPA CNEL Std Distance1 Cumulative
Cumulative
+ Alt B Change 60 CNEL 55 CNEL 60 CNEL 55 CNEL
SR 28 W. of Mount Rose 55 dB 100 feet 62 63 +1 145 313 152 328
SR 28 E. of Mount Rose 55 dB 100 feet 62 62 0 136 293 141 303
SR 28 W. of Lakeshore 55 dB 100 feet 62 62 0 137 296 144 311
SR 28 E. of Lakeshore 55 dB 100 feet 61 62 +1 124 267 130 280
SR 28 N. of Reservoir
Rd/Wellness 60 dB
100 feet 62
62 0 133 287 141 305
SR 28 S. of Reservoir
Rd./Wellness 60 dB
100 feet 62
62 0 133 287 137 294
SR 28 W. of Stateline Rd 60 dB 100 feet 62 62 0 134 289 140 301
SR 28 E. of Stateline Rd 60 dB 100 feet 62 62 0 133 288 137 294
SR 28 W. of Coon St. 55 dB 100 feet 62 62 0 137 294 142 305
SR 28 E. of Coon St. 55 dB 100 feet 62 62 0 136 292 141 303
SR 28 W. of SR 267 55 dB 100 feet 62 63 +1 144 310 147 316
SR 28 E. of SR 267 55 dB 100 feet 63 63 0 164 354 170 366
SR 267 N. of SR 28 55 dB 100 feet 61 61 0 109 235 111 240
Lakeshore S. of SR 28 55 dB 100 feet 52 53 +1 31 67 33 70
Pinion N. of SR 28 60 dB 100 feet 42 42 0 7 14 7 14
Stateline Rd N. of SR 28 60 dB 100 feet 45 48 +3 11 23 15 32
Stateline Rd S. of SR 28 55 dB 100 feet 43 43 0 7 16 7 16
Stateline Rd N. of Cove St. 60 dB 100 feet 46 48 +2 11 24 15 32
Source – j.c. brennan & associates, Inc. – 2008
1 Distances are reference distances from centerline of roadway.
NOISE
B o u l d e r B a y C o m m u n i t y E n h a n c e m e n t P r o g r a m P r o j e c t E I S
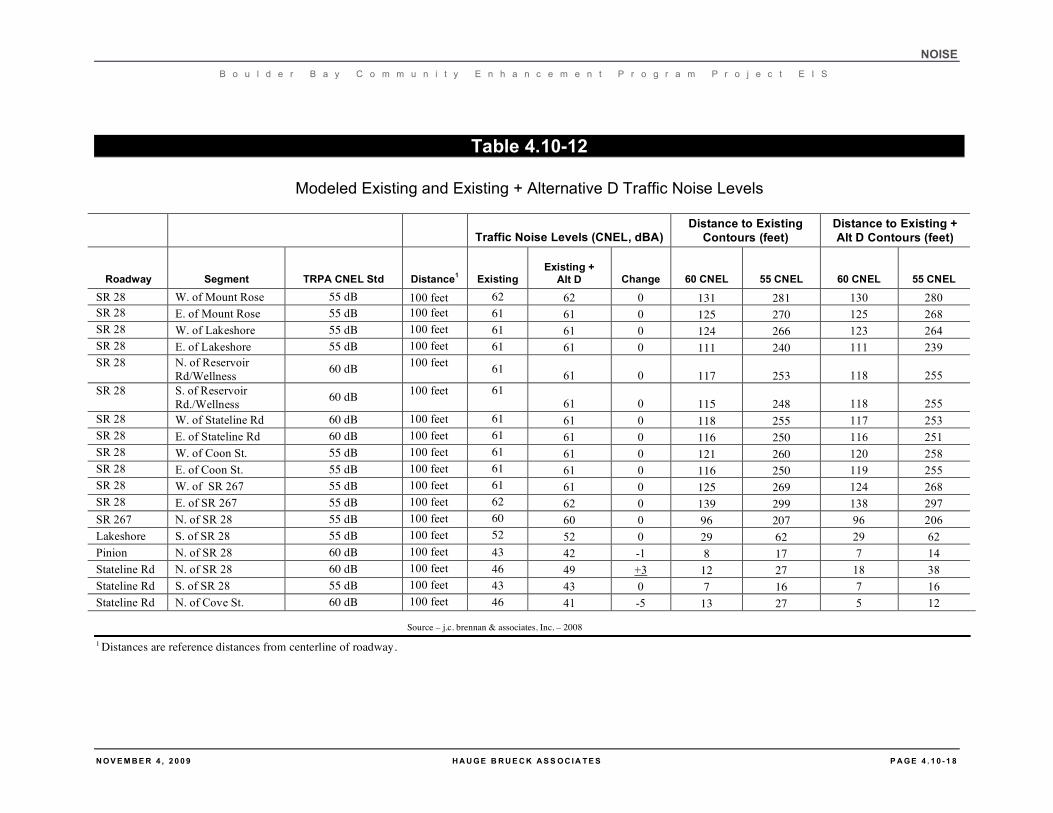
N O V E M B E R 4 , 2 0 0 9 H A U G E B R U E C K A S S O C I A T E S P A G E 4 . 1 0 - 1 8
Table 4.10-12
Modeled Existing and Existing + Alternative D Traffic Noise Levels
Traffic Noise Levels (CNEL, dBA) Distance to Existing
Contours (feet)
Distance to Existing +
Alt D Contours (feet)
Roadway Segment TRPA CNEL Std Distance1 Existing
Existing +
Alt D Change 60 CNEL 55 CNEL 60 CNEL 55 CNEL
SR 28 W. of Mount Rose 55 dB 100 feet 62 62 0 131 281 130 280
SR 28 E. of Mount Rose 55 dB 100 feet 61 61 0 125 270 125 268
SR 28 W. of Lakeshore 55 dB 100 feet 61 61 0 124 266 123 264
SR 28 E. of Lakeshore 55 dB 100 feet 61 61 0 111 240 111 239
SR 28 N. of Reservoir
Rd/Wellness 60 dB
100 feet 61
61 0 117 253 118 255
SR 28 S. of Reservoir
Rd./Wellness 60 dB
100 feet 61
61 0 115 248 118 255
SR 28 W. of Stateline Rd 60 dB 100 feet 61 61 0 118 255 117 253
SR 28 E. of Stateline Rd 60 dB 100 feet 61 61 0 116 250 116 251
SR 28 W. of Coon St. 55 dB 100 feet 61 61 0 121 260 120 258
SR 28 E. of Coon St. 55 dB 100 feet 61 61 0 116 250 119 255
SR 28 W. of SR 267 55 dB 100 feet 61 61 0 125 269 124 268
SR 28 E. of SR 267 55 dB 100 feet 62 62 0 139 299 138 297
SR 267 N. of SR 28 55 dB 100 feet 60 60 0 96 207 96 206
Lakeshore S. of SR 28 55 dB 100 feet 52 52 0 29 62 29 62
Pinion N. of SR 28 60 dB 100 feet 43 42 -1 8 17 7 14
Stateline Rd N. of SR 28 60 dB 100 feet 46 49 +3 12 27 18 38
Stateline Rd S. of SR 28 55 dB 100 feet 43 43 0 7 16 7 16
Stateline Rd N. of Cove St. 60 dB 100 feet 46 41 -5 13 27 5 12
Source – j.c. brennan & associates, Inc. – 2008
1 Distances are reference distances from centerline of roadway.

NOISE
B o u l d e r B a y C o m m u n i t y E n h a n c e m e n t P r o g r a m P r o j e c t E I S
N O V E M B E R 4 , 2 0 0 9 H A U G E B R U E C K A S S O C I A T E S P A G E 4 . 1 0 - 1 9
Table 4.10-13
Modeled Cumulative and Cumulative + Alternative D Traffic Noise Levels
Traffic Noise Levels (CNEL, dBA) Distance to Cumulative
Contours (feet) Distance to Cumulative + Alt D Contours (feet)
Roadway Segment TRPA CNEL Std Distance1 Cumulative
Cumulative
+ Alt D Change 60 CNEL 55 CNEL 60 CNEL 55 CNEL
SR 28 W. of Mount Rose 55 dB 100 feet 62 63 +1 145 313 149 321
SR 28 E. of Mount Rose 55 dB 100 feet 62 62 0 136 293 139 298
SR 28 W. of Lakeshore 55 dB 100 feet 62 62 0 137 296 141 304
SR 28 E. of Lakeshore 55 dB 100 feet 61 62 +1 124 267 127 274
SR 28 N. of Reservoir
Rd/Wellness 60 dB
100 feet 62
62 0 133 287 137 295
SR 28 S. of Reservoir
Rd./Wellness 60 dB
100 feet 62
62 0 133 287 137 294
SR 28 W. of Stateline Rd 60 dB 100 feet 62 62 0 134 289 136 293
SR 28 E. of Stateline Rd 60 dB 100 feet 62 62 0 133 288 135 291
SR 28 W. of Coon St. 55 dB 100 feet 62 62 0 137 294 139 299
SR 28 E. of Coon St. 55 dB 100 feet 62 62 0 136 292 137 295
SR 28 W. of SR 267 55 dB 100 feet 62 62 0 144 310 145 311
SR 28 E. of SR 267 55 dB 100 feet 63 63 0 164 354 166 357
SR 267 N. of SR 28 55 dB 100 feet 61 61 0 109 235 110 236
Lakeshore S. of SR 28 55 dB 100 feet 52 53 +1 31 67 32 69
Pinion N. of SR 28 60 dB 100 feet 42 42 0 7 14 7 14
Stateline Rd N. of SR 28 60 dB 100 feet 45 49 +4 11 23 18 38
Stateline Rd S. of SR 28 55 dB 100 feet 43 43 0 7 16 7 16
Stateline Rd N. of Cove St. 60 dB 100 feet 46 41 -5 11 24 5 12
Source – j.c. brennan & associates, Inc. – 2008
1 Distances are reference distances from centerline of roadway.

NOISE
B o u l d e r B a y C o m m u n i t y E n h a n c e m e n t P r o g r a m P r o j e c t E I S
N O V E M B E R 4 , 2 0 0 9 H A U G E B R U E C K A S S O C I A T E S P A G E 4 . 1 0 - 2 0
Table 4.10-14
Modeled Existing and Existing + Alternative E Traffic Noise Levels
Traffic Noise Levels (CNEL, dBA) Distance to Existing
Contours (feet) Distance to Existing + Alt E Contours (feet)
Roadway Segment TRPA CNEL Std Distance1 Existing
Existing +
Alt E Change 60 CNEL 55 CNEL 60 CNEL 55 CNEL
SR 28 W. of Mount Rose 55 dB 100 feet 62 62 0 131 281 135 290
SR 28 E. of Mount Rose 55 dB 100 feet 61 62 +1 125 270 128 275
SR 28 W. of Lakeshore 55 dB 100 feet 61 61 0 124 266 118 254
SR 28 E. of Lakeshore 55 dB 100 feet 61 60 -1 111 240 105 226
SR 28 N. of Reservoir
Rd/Wellness 60 dB
100 feet 61
61 0 117 253 124 266
SR 28 S. of Reservoir
Rd./Wellness 60 dB
100 feet 61
61 0 115 248 118 254
SR 28 W. of Stateline Rd 60 dB 100 feet 61 61 0 118 255 122 263
SR 28 E. of Stateline Rd 60 dB 100 feet 61 61 0 116 250 120 259
SR 28 W. of Coon St. 55 dB 100 feet 61 61 0 121 260 125 269
SR 28 E. of Coon St. 55 dB 100 feet 61 61 0 116 250 124 266
SR 28 W. of SR 267 55 dB 100 feet 61 62 +1 125 269 127 273
SR 28 E. of SR 267 55 dB 100 feet 62 62 0 139 299 142 306
SR 267 N. of SR 28 55 dB 100 feet 60 60 0 96 207 97 209
Lakeshore S. of SR 28 55 dB 100 feet 52 52 0 29 62 30 64
Pinion N. of SR 28 60 dB 100 feet 43 42 -1 8 17 7 14
Stateline Rd N. of SR 28 60 dB 100 feet 46 44 -2 12 27 9 20
Stateline Rd S. of SR 28 55 dB 100 feet 43 43 0 7 16 7 16
Stateline Rd N. of Cove St. 60 dB 100 feet 46 41 -5 13 27 5 11
Source – j.c. brennan & associates, Inc. – 2008
1 Distances are reference distances from centerline of roadway.

NOISE
B o u l d e r B a y C o m m u n i t y E n h a n c e m e n t P r o g r a m P r o j e c t E I S
N O V E M B E R 4 , 2 0 0 9 H A U G E B R U E C K A S S O C I A T E S P A G E 4 . 1 0 - 2 1
Table 4.10-15
Modeled Cumulative and Cumulative + Alternative E Traffic Noise Levels
Traffic Noise Levels (CNEL, dBA) Distance to Cumulative
Contours (feet)
Distance to Cumulative
+ Alt E Contours (feet)
Roadway Segment TRPA CNEL Std Distance1 Cumulative
Cumulative
+ Alt E Change 60 CNEL 55 CNEL 60 CNEL 55 CNEL
SR 28 W. of Mount Rose 55 dB 100 feet 62 63 +1 145 313 153 331
SR 28 E. of Mount Rose 55 dB 100 feet 62 62 0 136 293 141 305
SR 28 W. of Lakeshore 55 dB 100 feet 62 62 0 137 296 145 313
SR 28 E. of Lakeshore 55 dB 100 feet 61 62 +1 124 267 131 282
SR 28 N. of Reservoir
Rd/Wellness 60 dB
100 feet 62
62 0 133 287 142 305
SR 28 S. of Reservoir
Rd./Wellness 60 dB
100 feet 62
62 0 133 287 137 294
SR 28 W. of Stateline Rd 60 dB 100 feet 62 62 0 134 289 140 303
SR 28 E. of Stateline Rd 60 dB 100 feet 62 62 0 133 288 138 298
SR 28 W. of Coon St. 55 dB 100 feet 62 62 0 137 294 143 309
SR 28 E. of Coon St. 55 dB 100 feet 62 62 0 136 292 142 305
SR 28 W. of SR 267 55 dB 100 feet 62 63 +1 144 310 147 317
SR 28 E. of SR 267 55 dB 100 feet 63 63 0 164 354 170 366
SR 267 N. of SR 28 55 dB 100 feet 61 61 0 109 235 112 240
Lakeshore S. of SR 28 55 dB 100 feet 52 53 +1 31 67 33 71
Pinion N. of SR 28 60 dB 100 feet 42 42 0 7 14 7 14
Stateline Rd N. of SR 28 60 dB 100 feet 45 44 -1 11 23 9 20
Stateline Rd S. of SR 28 55 dB 100 feet 43 43 0 7 16 7 16
Stateline Rd N. of Cove St. 60 dB 100 feet 46 41 -5 11 24 5 11
Source – j.c. brennan & associates, Inc. – 2008
1 Distances are reference distances from centerline of roadway.

NOISE
B o u l d e r B a y C o m m u n i t y E n h a n c e m e n t P r o g r a m P r o j e c t E I S
N O V E M B E R 4 , 2 0 0 9 H A U G E B R U E C K A S S O C I A T E S P A G E 4 . 1 0 - 2 2
IMPACT: NOISE-2: Will the project result in an exceedance of an exterior traffic noise level
standard at on-site residential, condominium, time-share or hotel uses?
Analysis: No Impact: Alternative A
This alternative will not result in additional development and therefore, will not result in
changes to existing noise levels.
Mitigation: No mitigation is required.
Analysis: Less than Significant Impact: Alternatives B, C, D and E
To assess noise impacts from roadway traffic to sensitive receptors located at on-site
residential housing facilities, the predicted future traffic noise levels and distances to the
60 dB CNEL contours shown in Tables 4.10-9, 4.10-11, 4.10-13, and 4.10-15 were used.
For each of these alternatives, the primary outdoor activity areas, including the balconies.
pool, and pedestrian village areas will be located outside of the 60 dB CNEL contours.
Therefore, this impact is considered to be less than significant.
Mitigation: No mitigation is required.
IMPACT: NOISE-3: Will the project result in excessive noise due to construction activities?
Analysis: No Impact: Alternative A
Alternative A will not result in additional construction activities.
Mitigation: No mitigation is required.
Analysis: Less than Significant Impact: Alternative B
Alternative B will include limited construction activities, including interior remodeling of
existing buildings and the construction of three single-family residential units. Therefore,
construction will not result in excessive noise due to construction activities.
Mitigation: No mitigation is required.
Analysis: Significant Impact: Alternatives C, D and E
Substantial construction activities will occur under Alternatives C, D and E.
Construction staging areas for equipment and materials will be located within the project
area, but are not defined. The construction noise control program prepared for Boulder
Bay by SMC Contracting, Inc. (see Chapter 2.5) proposes construction activities outside
of the exempt hours of operation contained within the TRPA noise ordinance.
Construction noise levels outside of the exempt hours that exceed Plan Area CNEL
standards will result in significant noise impacts.
During the construction phases of the project, noise from construction activities will add
to the noise environment in the immediate project vicinity. Activities involved in
construction will generate maximum noise levels, as indicated in Table 4.10-16, ranging
from 76 to 95 dB at distances of 50 to 100 feet. Construction activities will be temporary
in nature and are anticipated to occur during normal daytime working hours.
Noise will also be generated during the construction phase by increased truck traffic on
area roadways. A significant project-generated noise source will be truck traffic
associated with transport of heavy materials and equipment to and from construction
sites. This noise increase will be of short duration, and will likely occur primarily during

NOISE
B o u l d e r B a y C o m m u n i t y E n h a n c e m e n t P r o g r a m P r o j e c t E I S
N O V E M B E R 4 , 2 0 0 9 H A U G E B R U E C K A S S O C I A T E S P A G E 4 . 1 0 - 2 3
daytime hours. Based on predicted construction related noise levels, this impact is
considered to be significant.
Table 4.10-16
Construction Equipment Noise
Type of Equipment Maximum Level
Backhoe 78 dB at 50 feet
Compactor 83 dB at 50 feet
Compressor (air) 78 dB at 50 feet
Concrete Saw 90 dB at 50 feet
Dozer 82 dB at 50 feet
Dump Truck 76 dB at 50 feet
Excavator 81 dB at 50 feet
Generator 81 dB at 50 feet
Jackhammer 89 dB at 50 feet
Pneumatic Tools 85 dB at 50 feet
Pile Driving* 95 dB at 100 feet
Source: Roadway Construction Noise Model User’s Guide. Federal Highway
Administration. FHWA-HEP-05-054. January 2006 and
* j.c. brennan & associates, Inc. Staff noise measurements, 2007
Mitigation: NOISE-3A: Time of Day Construction Restrictions and Noise Barriers
Restrict construction activities between the hours of 8:00 a.m. and 6:30 p.m. The project
applicant shall work with a qualified noise consultant to determine the appropriate
heights, lengths and configurations of the temporary noise barriers, as well as the
appropriate barrier materials.
NOISE-3B: Equipment Location Guidance
Locate fixed construction equipment such as compressors and generators as far as
possible from sensitive receptors (e.g., residential land uses). Shroud or shield all impact
tools, and muffle or shield all intake and exhaust ports on power construction equipment.
NOISE-3C: Noise Complaint Coordination and Response
Designate a disturbance coordinator and conspicuously post this person’s number around
the project site and in adjacent public spaces. The disturbance coordinator will receive
all public complaints about construction noise disturbances and will be responsible for
determining the cause of the complaint, reporting all complaints to the TRPA, and
implement any feasible measures to be taken to alleviate the problem. If temporary noise
barriers are required, the project applicant shall work with a qualified noise consultant to
determine the appropriate heights, lengths and configurations of the temporary noise
barriers, as well as the appropriate barrier materials.

NOISE
B o u l d e r B a y C o m m u n i t y E n h a n c e m e n t P r o g r a m P r o j e c t E I S
N O V E M B E R 4 , 2 0 0 9 H A U G E B R U E C K A S S O C I A T E S P A G E 4 . 1 0 - 2 4
After
Mitigation: Less than Significant Impact: Alternatives C, D and E
Implementation of mitigation measures 3A, 3B, and 3C will reduce the impact to a less
than significant level.
IMPACT: NOISE-4: Will the project result in excessive vibration at buildings in the
immediate vicinity of the project site due to construction activities?
Analysis: No Impact; Alternative A
This alternative will not result in additional construction activities. Therefore, no
vibration impacts will occur.
Mitigation: No mitigation is required.
Analysis: Less than Significant Impact: Alternatives B, C, D and E
Construction activities occurring under Alternatives B, C, D and E will produce vibration
impacts. These vibration impacts could result in human annoyance and building
structural damage. Human annoyance occurs when construction vibration rises
significantly above the threshold of perception. Building damage can take the form of
cosmetic or structural. Table 4.10-17 shows the typical vibration levels produced by
construction equipment that will be used within the Boulder Bay project area. Based upon
comparison of Table 4.10-17 (Vibration Levels for Varying Construction Equipment) to
Table 4.10-6 (Effects of Vibration Levels on People and Buildings), it is not expected
that vibration levels will exceed a peak particle velocity of 0.5 inches per second within
the project area. Therefore, this impact is considered to be less than significant
Mitigation: No mitigation is required.
Table 4.10-17
Vibration Levels for Varying Construction Equipment
Type of Equipment Peak Particle Velocity @ 25 feet Approx. Velocity Level @ 25 feet
Large Bulldozer 0.089 (inches/second) 87 (VdB)
Loaded Trucks 0.076 (inches/second) 86 (VdB)
Small Bulldozer 0.003 (inches/second) 58 (VdB)
Auger/drill Rigs 0.089 (inches/second) 87 (VdB)
Jackhammer 0.035 (inches/second) 79 (VdB)
Vibratory Hammer 0.070 (inches/second) 85 (VdB)
Vibratory Compactor/roller 0.210 (inches/second) 94 (VdB)
Source: Federal Transit Administration, Transit Noise and
Vibration Impact Assessment Guidelines, May 2006
NOISE
B o u l d e r B a y C o m m u n i t y E n h a n c e m e n t P r o g r a m P r o j e c t E I S
N O V E M B E R 4 , 2 0 0 9 H A U G E B R U E C K A S S O C I A T E S P A G E 4 . 1 0 - 2 5
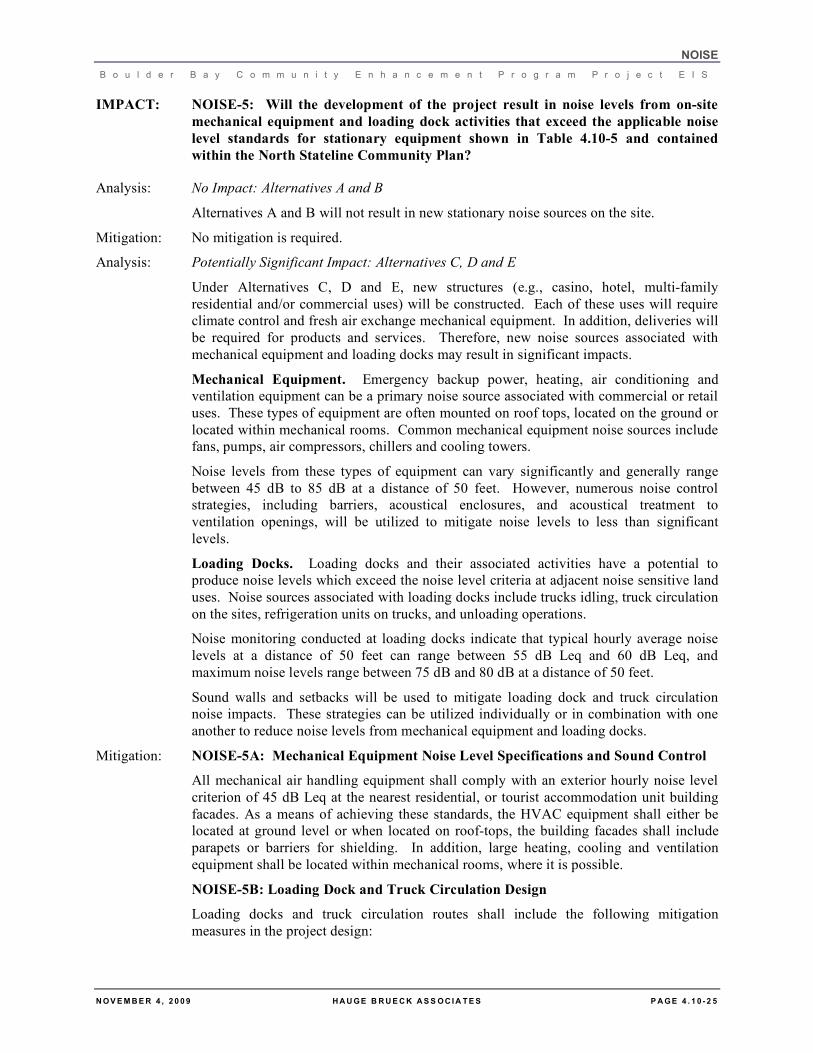
IMPACT: NOISE-5: Will the development of the project result in noise levels from on-site
mechanical equipment and loading dock activities that exceed the applicable noise
level standards for stationary equipment shown in Table 4.10-5 and contained
within the North Stateline Community Plan?
Analysis: No Impact: Alternatives A and B
Alternatives A and B will not result in new stationary noise sources on the site.
Mitigation: No mitigation is required.
Analysis: Potentially Significant Impact: Alternatives C, D and E
Under Alternatives C, D and E, new structures (e.g., casino, hotel, multi-family
residential and/or commercial uses) will be constructed. Each of these uses will require
climate control and fresh air exchange mechanical equipment. In addition, deliveries will
be required for products and services. Therefore, new noise sources associated with
mechanical equipment and loading docks may result in significant impacts.
Mechanical Equipment. Emergency backup power, heating, air conditioning and
ventilation equipment can be a primary noise source associated with commercial or retail
uses. These types of equipment are often mounted on roof tops, located on the ground or
located within mechanical rooms. Common mechanical equipment noise sources include
fans, pumps, air compressors, chillers and cooling towers.
Noise levels from these types of equipment can vary significantly and generally range
between 45 dB to 85 dB at a distance of 50 feet. However, numerous noise control
strategies, including barriers, acoustical enclosures, and acoustical treatment to
ventilation openings, will be utilized to mitigate noise levels to less than significant
levels.
Loading Docks. Loading docks and their associated activities have a potential to
produce noise levels which exceed the noise level criteria at adjacent noise sensitive land
uses. Noise sources associated with loading docks include trucks idling, truck circulation
on the sites, refrigeration units on trucks, and unloading operations.
Noise monitoring conducted at loading docks indicate that typical hourly average noise
levels at a distance of 50 feet can range between 55 dB Leq and 60 dB Leq, and
maximum noise levels range between 75 dB and 80 dB at a distance of 50 feet.
Sound walls and setbacks will be used to mitigate loading dock and truck circulation
noise impacts. These strategies can be utilized individually or in combination with one
another to reduce noise levels from mechanical equipment and loading docks.
Mitigation: NOISE-5A: Mechanical Equipment Noise Level Specifications and Sound Control
All mechanical air handling equipment shall comply with an exterior hourly noise level
criterion of 45 dB Leq at the nearest residential, or tourist accommodation unit building
facades. As a means of achieving these standards, the HVAC equipment shall either be
located at ground level or when located on roof-tops, the building facades shall include
parapets or barriers for shielding. In addition, large heating, cooling and ventilation
equipment shall be located within mechanical rooms, where it is possible.
NOISE-5B: Loading Dock and Truck Circulation Design
Loading docks and truck circulation routes shall include the following mitigation
measures in the project design:

NOISE
B o u l d e r B a y C o m m u n i t y E n h a n c e m e n t P r o g r a m P r o j e c t E I S
N O V E M B E R 4 , 2 0 0 9 H A U G E B R U E C K A S S O C I A T E S P A G E 4 . 1 0 - 2 6
• Loading docks shall maintain a minimum distance of 100 feet from residential
property lines and include shielding by building facades.
• Circulation routes for large trucks shall be located a minimum of 50-feet from the
residential property lines.
After
Mitigation: Less than Significant Impact: Alternatives C, D and E
Implementation of mitigation measures Noise 5A and 5B will reduce the impact to a less
than significant level.
IMPACT: NOISE-6: Will the development of the project result in outdoor activities from
people gathering on decks and patios that exceed the applicable noise level
standards for stationary noise sources shown in Table 4.10-5 and contained within
the North Stateline Community Plan?
Analysis: No Impact; Alternatives A and B
Alternatives A and B will not result in additional balconies or decks for people to gather
on the site.
Mitigation: No mitigation is required.
Analysis: Less than Significant Impact: Alternatives C, D and E
Based upon the following analysis, it is not expected that Boulder Bay guests gathering
outside on decks and patios will exceed the noise level standards of the North Stateline
Community Plan.
As a means of addressing balcony occupancies and associated noise levels, j.c. brennan &
associates, Inc. utilized observations and noise measurements conducted by j.c. brennan
& associates at the Hyatt Regency in Incline Village. The observations were conducted
hourly between 3:00 pm and 10:00 pm on Saturday, September, 01, 2007 (Labor Day
Weekend). The room configurations at the Hyatt Regency in Incline Village include a
tower which does not contain balconies, timeshare units which have balconies/decks, and
cottages which also have balconies/decks. Observations were conducted throughout the
Timeshare and Cottage units located on the Hyatt Regency Resort. Observations were
conducted twice per hour for the 3:00 p.m., 6:00 p.m., 7:00 p.m., 8:00 p.m., 9:00 p.m. and
10:00 p.m. hours. The deck occupancies were observed for 77 timeshare units and 46
cottage units. During the observation period approximately 80 to 90 percent of the
timeshare units and cottages units were either occupied or had lights on, which indicated
that they were occupied for that evening.
During the observations, j.c. brennan & associates, Inc. conducted noise level
measurements of the occupied decks. During the noise measurements the background
noise environment from parking areas and distant traffic were the primary contributors to
the noise levels. However, occasional maximum noise levels from normal conversations
were captured, and were approximately 55 dB at 15 feet. However, the average or
median noise levels were generally less than 45 dB Leq. Therefore, the anticipated noise
levels from outdoor activities at the Boulder Bay hotel and residential uses is considered
to be less than significant.
Mitigation: No mitigation is required.
NOISE
B o u l d e r B a y C o m m u n i t y E n h a n c e m e n t P r o g r a m P r o j e c t E I S
N O V E M B E R 4 , 2 0 0 9 H A U G E B R U E C K A S S O C I A T E S P A G E 4 . 1 0 - 2 7
CUMULATIVE IMPACTS AND MITIGATION MEASURES
IMPACT: NOISE-C1: Will the project have significant cumulative short-term construction
noise impacts to the noise environment?
Analysis: No Impact: Alternative A
This alternative will not include any additional development that will result in increased
traffic or on-site noise levels.
Mitigation: No mitigation is required.
Analysis: Less than Significant Impact: Alternatives B, C, D and E
Alternatives B, C, D and E include outdoor construction activities. Construction of other
nearby projects could also result in exceedances of local noise standards. However,
construction noise occurring during the daytime hours is exempt from the applicable
standards, provided that construction equipment is properly fitted with feasible noise
control devices. In addition, mitigation measures have been provided for construction
noise associated with this project, and based on TRPA regulations, other projects in the
area will also be required to include construction noise mitigation measures. Since the
project must adhere to the requirements of the exemption for construction noise and will
implement construction noise mitigation measures, the project will not contribute to a
substantial increase in noise levels and would not have a cumulatively considerable
impact.
Mitigation: No mitigation is required.
IMPACT: NOISE-C2: Will the project have significant cumulative increase in noise levels due
to on-site stationary noise sources?
Analysis: No Impact: Alternative A
This alternative will not include any additional development that will result in increased
traffic or on-site noise levels.
Mitigation: No mitigation is required.
Analysis: Less than Significant Impact: Alternatives B, C, D and E
Each of these alternatives result in on-site noise sources such as heating and ventilation
equipment, emergency power supplies and on-site human activities. There are no other
known projects in the vicinity of the project site that would add new stationary noise
sources. The project will implement mitigation measures for Impacts NOISE-5 and
NOISE-6 related to on-site stationary noise sources. These mitigation measures are
expected to reduce the impacts to a less than significant level. Also, noise levels
associated with the existing uses on the site include the same types of noise sources
associated with the project. The newer technology of HVAC equipment, emergency
generators and mechanical equipment are considerably quieter than equipment which is
currently in use on the site. Therefore, it is expected that the overall noise levels
NOISE
B o u l d e r B a y C o m m u n i t y E n h a n c e m e n t P r o g r a m P r o j e c t E I S
N O V E M B E R 4 , 2 0 0 9 H A U G E B R U E C K A S S O C I A T E S P A G E 4 . 1 0 - 2 8
associated with these types of new noise sources will be less than those currently in use
on the project site.
Mitigation: No mitigation is required.
IMPACT: NOISE-C3: Will the project have significant cumulative increase in noise levels due
to traffic on the local street network?
Analysis: No Impact: Alternative A
This alternative will not include any additional development that will result in increased
traffic or on-site noise levels.
Mitigation: No mitigation is required.
Analysis: Less than Significant Impact: Alternatives B, C, D and E
Each of these alternatives will result in increased traffic noise on portions of the local
street network. Other known projects in the north shore of the Lake Tahoe Basin will
also contribute to the overall increase in traffic and associated traffic noise levels. The
project shows a significant increase in traffic noise levels along Stateline Road. The
project proposes mitigation for that roadway segment where a significant increase in
traffic noise levels will occur. Tables 4.10-9, 4.10-11, 4.10-13, and 4.10-15 document
cumulative traffic noise levels. A comparison of cumulative traffic noise levels without
the project (that includes other foreseeable projects within the basin) to the cumulative
traffic noise levels with the project demonstrates that there is not a significant increase in
noise levels identified along any other roadways due to the project. Therefore, this
impact is considered to be less than significant.
Mitigation: No mitigation is required.
REFERENCES
Boulder Bay Community Enhancement Program Project Draft EIS, Transportation, Parking and
Circulation, Fehr & Peers Transportation Consultants May 2009.
Federal Highway Administration (FHWA RD 77-108) Traffic Noise Prediction Model, Federal Highway
Administration (23 CFR 772), December 1978.
R.W. Hendriks, California Vehicle Noise Emissions Levels, FHWA/CA/TL-87/03, Office of
Transportation Laboratory, California, Department of Transportation, Sacramento, California, January
1987.
Survey of Earth-borne Vibrations due to Highway Construction and Highway Traffic, California
Department of Transportation, 1976.
Roadway Construction Noise Model User’s Guide, Federal Highway Administration, FHWA – HEP- 05-
054, January 2006.