3rd quarter report (un-audited) 2014
TRANSCRIPT
D.G. Khan Cement Company Limited
2014
3rd Quarter Report(Un-audited)
March 31,
01
ContentsCorporate profile 02
Directors’ Report 03
Condensed Interim Balance Sheet 06
Condensed Interim Profit and Loss Account 08
Condensed Interim Statement of Comprehensive Income 09
Condensed Interim Cash Flow Statement 10
Condensed Interim Statement of Changes in Equity 11
Notes to the Condensed Interim Financial Information 12
D.G Khan Cement Company Limited and its Subsidiary
Directors’ Report 23
Condensed Interim Consolidated Balance Sheet 24
Condensed Interim Consolidated Profit and Loss Account 26
Condensed Interim Consolidated Statement of
Comprehensive Income 27
Condensed Interim Consolidated Cash Flow Statement 28
Condensed Interim Consolidated Statement of Changes in Equity 29
Notes to the Condensed Interim Consolidated
Financial Information 30
D.G Khan Cement Company Limited
D.G
. Kh
an
Ce
me
nt
Co
mp
an
y Li
mite
d3r
d Q
ua
rte
r 201
4
02
Board of Directors Mrs. Naz Mansha Chairperson Mian Raza Mansha Chief Executive Mr. Khalid Niaz Khawaja Mr. Khalid Qadeer Qureshi Mr. Farid Noor Ali Fazal Mr. Shahzad Ahmad Malik Ms. Nabiha Shahnawaz Cheema
Audit Committee Mr. Khalid Niaz Khawaja Member/chairman Mr. Khalid Qadeer Qureshi Member Ms. Nabiha Shahnawaz Cheema Member
Human Resource & Mian Raza Mansha MemberRemuneration Committee Mr. Khalid Qadeer Qureshi Member/Chairman Ms. Nabiha Shahnawaz Cheema Member
Chief Financial Officer Mr. Inayat Ullah Niazi
Company Secretary Mr. Khalid Mahmood Chohan
Bankers Allied Bank Limited KASB Bank Limited Askari Bank Limited MCB Bank Limited Bank Alfalah Limited Meezan Bank Limited Bank Al-Habib Limited National Bank of Pakistan Bank Islami Pakistan Limited NIB Bank Limited Barclays Bank Plc Samba Bank Limited Citibank N.A. Soneri Bank Limited Deutsche Bank AG Standard Chartered Bank Dubai Islamic Bank (Pakistan) Limited Faysal Bank Limited Silk Bank Limited HSBC Bank Middle East Limited The Bank of Punjab Habib Bank Limited Limited United Bank Limited Habib Metropolitan Bank
External Auditors A.F. Ferguson & Co., Chartered Accountants
Cost Auditors Qadeer & Company, Chartered Accountants
Legal Advisors Mr. Shahid Hamid, Bar-at-Law
Registered Office Nishat House, 53-A, Lawrence Road, Lahore-Pakistan Phone: 92-42-36367812-20 UAN: 111 11 33 33 Fax: 92-42-36367414 Email: [email protected] web site: www.dgcement.com
Factory 1. Khofli Sattai, Distt., Dera Ghazi Khan-Pakistan Phone: 92-641-460025-7 Fax: 92-641-462392 Email: [email protected]
2. 12, K.M. Choa Saidan Shah Road, Khairpur, Tehsil Kallar Kahar, Distt. Chakwal-Pakistan Phone: 92-543-650215-8 Fax: 92-543-650231
Company Profile
D.G
. Kha
n C
em
en
t Co
mp
an
y Limite
d3rd
Qu
arte
r 2014
03
Directors’ RpeortNINE MONTHS FY14
D.G
. Kh
an
Ce
me
nt
Co
mp
an
y Li
mite
d3r
d Q
ua
rte
r 201
4
The Directors of your company are pleased to present their report on the Nine Months ended on March 31, 2014 alongwith the financial statement for the said period.
Political front is volatile and stern. Widespread differences are creating a messy atmosphere. Law and Order and safety of citizens is still the biggest challenge. Long disconnection of electricity is aggravat-ing the situation. Ceasing of power lifeline brings many-fold adverse impacts like shut down of industry, loss in GDP, increase in unemployment, loss of governmental tax revenues, criminal activities etc.
SBP kept the rate of 10 percent as discount rate in March’14 MPS owing to some positive indications by some economic signals. However, balance of payment and governmental borrowing are still not at desirable level. According to SBP LSM is showing improvement, which is supported by an increase in credit to the private sector. According to SBP inflation may remain in the range of 8.5 - 9.5 during current fiscal year. FX reserves of country crossed USD 10 billion mark.
During Q3FY14 the industrial despatches were comparatively better than the preceding last two quarters. Industrial exports were however on declining trend. About 2% increase in local despatches and 2.5% decrease in export despatches is observed in industry when compared with despatches of comparative period, while overall 1% nominal increase is observed.
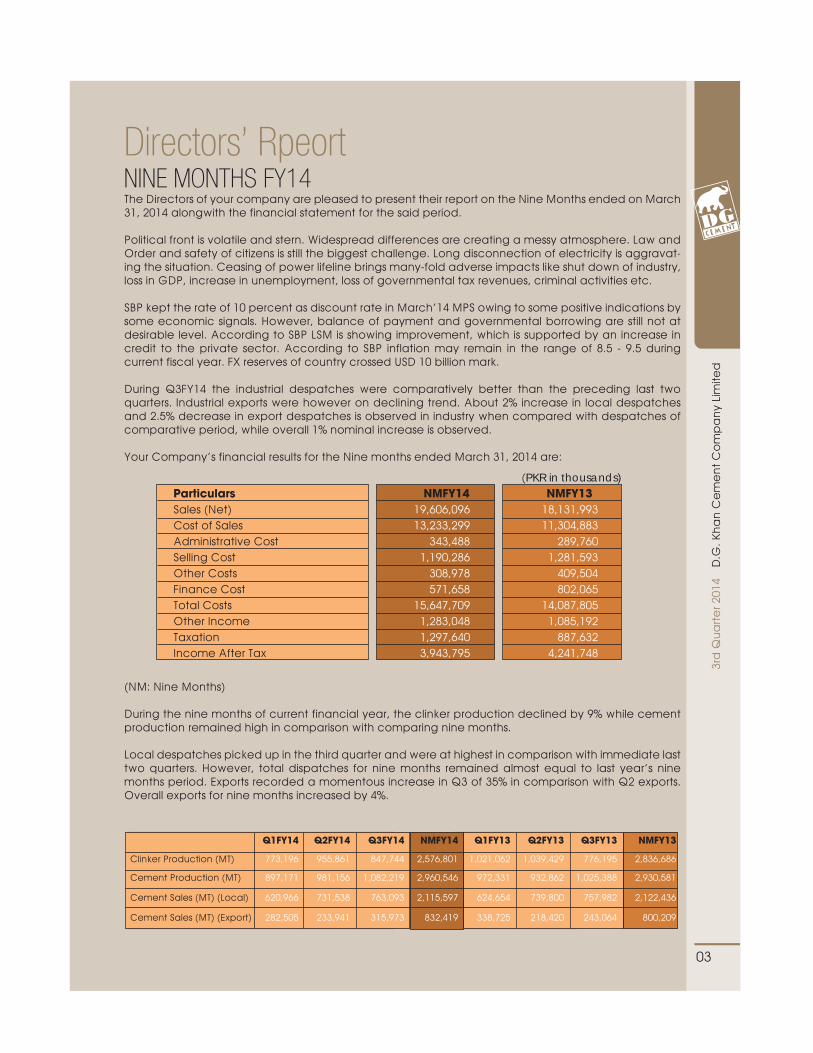
Your Company’s financial results for the Nine months ended March 31, 2014 are:
(NM: Nine Months)
During the nine months of current financial year, the clinker production declined by 9% while cement production remained high in comparison with comparing nine months.
Local despatches picked up in the third quarter and were at highest in comparison with immediate last two quarters. However, total dispatches for nine months remained almost equal to last year’s nine months period. Exports recorded a momentous increase in Q3 of 35% in comparison with Q2 exports. Overall exports for nine months increased by 4%.
(PKR in thousands) Particulars NMFY14 NMFY13 Sales (Net) 19,606,096 18,131,993 Cost of Sales 13,233,299 11,304,883 Administrative Cost 343,488 289,760 Selling Cost 1,190,286 1,281,593 Other Costs 308,978 409,504 Finance Cost 571,658 802,065 Total Costs 15,647,709 14,087,805 Other Income 1,283,048 1,085,192 Taxation 1,297,640 887,632 Income After Tax 3,943,795 4,241,748
Q1FY14 Q2FY14 Q3FY14 NMFY14 Q1FY13 Q2FY13 Q3FY13 NMFY13
Clinker Production (MT) 773,196 955,861 847,744 2,576,801 1,021,062 1,039,429 776,195 2,836,686
Cement Production (MT) 897,171 981,156 1,082,219 2,960,546 972,331 932,862 1,025,388 2,930,581
Cement Sales (MT) (Local) 620,966 731,538 763,093 2,115,597 624,654 739,800 757,982 2,122,436
Cement Sales (MT) (Export) 282,505 233,941 315,973 832,419 338,725 218,420 243,064 800,209
04
D.G
. Kha
n C
em
en
t Co
mp
an
y Limite
d3rd
Qu
arte
r 2014
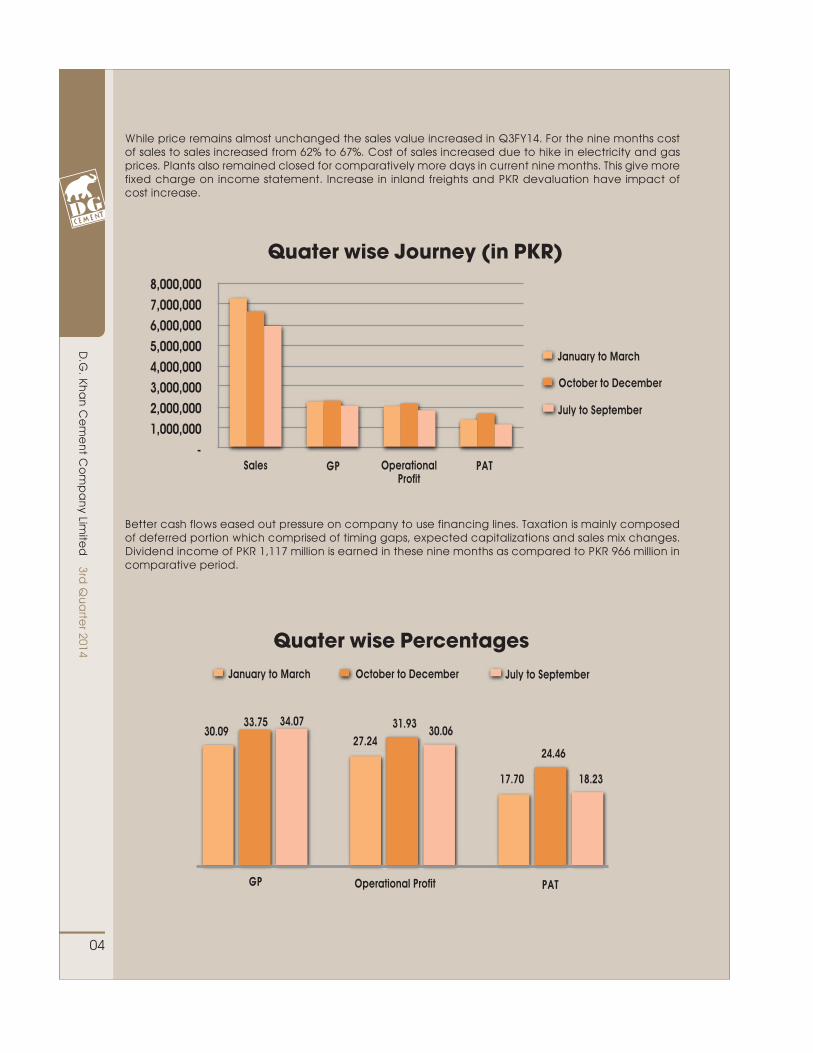
While price remains almost unchanged the sales value increased in Q3FY14. For the nine months cost of sales to sales increased from 62% to 67%. Cost of sales increased due to hike in electricity and gas prices. Plants also remained closed for comparatively more days in current nine months. This give more fixed charge on income statement. Increase in inland freights and PKR devaluation have impact of cost increase.
Better cash flows eased out pressure on company to use financing lines. Taxation is mainly composed of deferred portion which comprised of timing gaps, expected capitalizations and sales mix changes. Dividend income of PKR 1,117 million is earned in these nine months as compared to PKR 966 million in comparative period.
Quater wise Journey (in PKR)8,000,0007,000,0006,000,0005,000,0004,000,0003,000,0002,000,0001,000,000
-Sales GP Operational
ProfitPAT
January to March
October to December
July to September
Quater wise Percentages
GP Operational Profit PAT
24.46
18.2317.70
31.9330.06
27.24
33.75 34.0730.09
January to March October to December July to September
05
D.G
. Kh
an
Ce
me
nt
Co
mp
an
y Li
mite
d3r
d Q
ua
rte
r 201
4
It is expected that the trend of Q3FY14 will prevail in the last quarter of this financial year. Prices are expected to remain favourable. Governmental projects if materliased may have a positive impact on sales. Exports are expected to be low due to lesser margins than in local market. Exports markets are now becoming less attractive in terms of profitability. PKR appreciation is expected to cast negative shadow on exports as well and this may halt our exports. Any further increase in inflation and power prices will have negative marks on income. However, as coal prices are now depressed combined with weakened USD for imports may produce positive impression on company’s income. It is expected that cement demand will increase locally due to infrastructure development and on materialsation of government’s announced mega projects. Our RDF projects of Lahore and Multan Green will be viable once WAPDA electricity connection is estab-lished. We have plans to produce electricity from RDF through biogas mechanism which will be used for running of these RDF plants. For this purpose we have hired international consultants. Workings are in progress for our local expansion plans.
We appreciate the efforts of our employees and value our customers’ patronage and loyalty.
For and on behalf of the board
Mian Raza ManshaChief Executive Officer
Lahore: April 24, 2014

CONDENSED INTERIM UNCONSOLIDATEDBALANCE SHEET
D.G
. Kha
n C
em
en
t Co
mp
an
y Limite
d3rd
Qu
arte
r 2014
06
Chief Executive
31 March, 30 June 2014 2013 unaudited audited (re-stated) Note ----(Rupees in thousand)----
EQUITY AND LIABILITIES CAPITAL AND RESERVES Authorised capital - 950,000,000 (30 June 2013: 950,000,000) ordinary shares of Rs 10 each 9,500,000 9,500,000 - 50,000,000 (30 June 2013: 50,000,000) preference shares of Rs 10 each 500,000 500,000 10,000,000 10,000,000
Issued, subscribed and paid up capital 438,119,119 (June 30, 2013: 438,119,119) ordinary shares of Rs 10 each 4,381,191 4,381,191 Reserves 37,759,266 33,785,204 Accumulated profit 12,419,841 9,790,403 54,560,298 47,956,798
NON-CURRENT LIABILITIES
Long term finances 5 1,579,952 2,899,187 Long term deposits 68,706 65,383 Retirement and other benefits 188,368 153,020 Deferred taxation 4,342,818 3,144,738 6,179,844 6,262,328
CURRENT LIABILITIES
Trade and other payables 3,272,940 2,286,351 Accrued markup 96,053 125,830 Short term borrowing-secured 3,695,891 5,420,290 Current portion of non-current liabilities 845,874 1,440,032 Provision for taxation 35,090 35,090 7,945,848 9,307,593
CONTINGENCIES AND COMMITMENTS 6
68,685,990 63,526,719
The annexed notes 1 to 16 form an integral part of this condensed interim financial information.
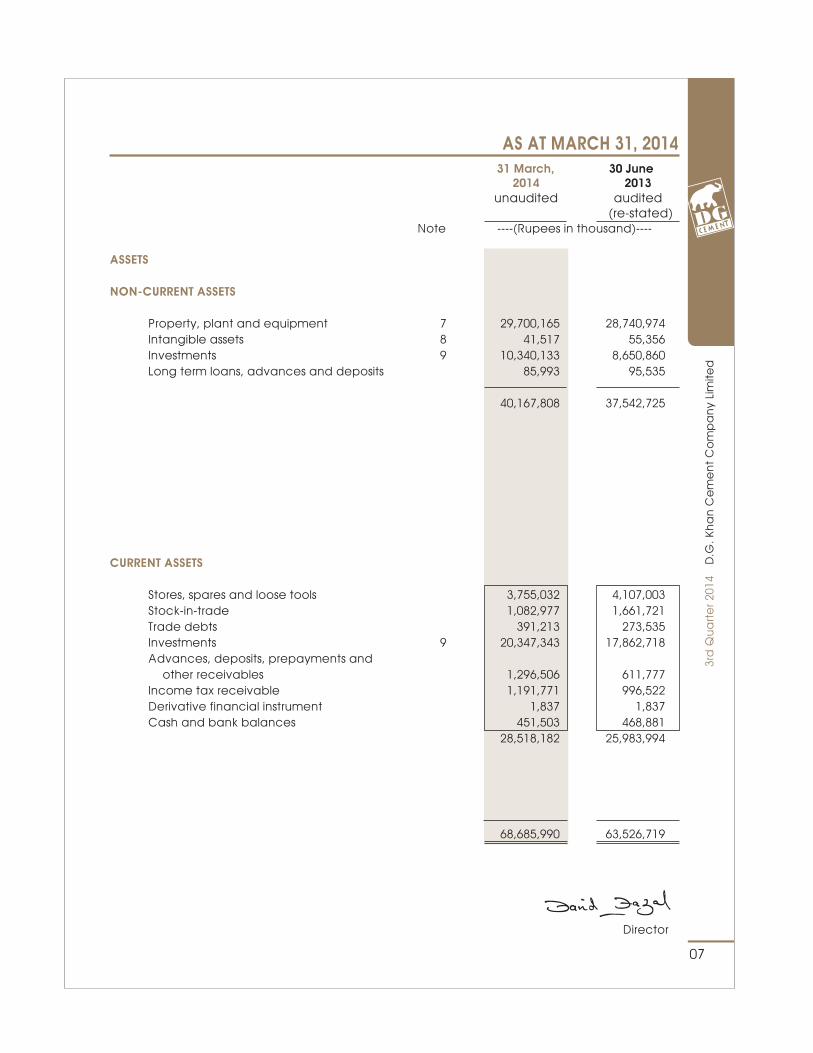
AS AT MARCH 31, 2014 31 March, 30 June 2014 2013 unaudited audited (re-stated) Note ----(Rupees in thousand)----
ASSETS
NON-CURRENT ASSETS
Property, plant and equipment 7 29,700,165 28,740,974 Intangible assets 8 41,517 55,356 Investments 9 10,340,133 8,650,860 Long term loans, advances and deposits 85,993 95,535
40,167,808 37,542,725
CURRENT ASSETS
Stores, spares and loose tools 3,755,032 4,107,003 Stock-in-trade 1,082,977 1,661,721 Trade debts 391,213 273,535 Investments 9 20,347,343 17,862,718 Advances, deposits, prepayments and other receivables 1,296,506 611,777 Income tax receivable 1,191,771 996,522 Derivative financial instrument 1,837 1,837 Cash and bank balances 451,503 468,881 28,518,182 25,983,994
68,685,990 63,526,719
07
D.G
. Kh
an
Ce
me
nt
Co
mp
an
y Li
mite
d3r
d Q
ua
rte
r 201
4
Director
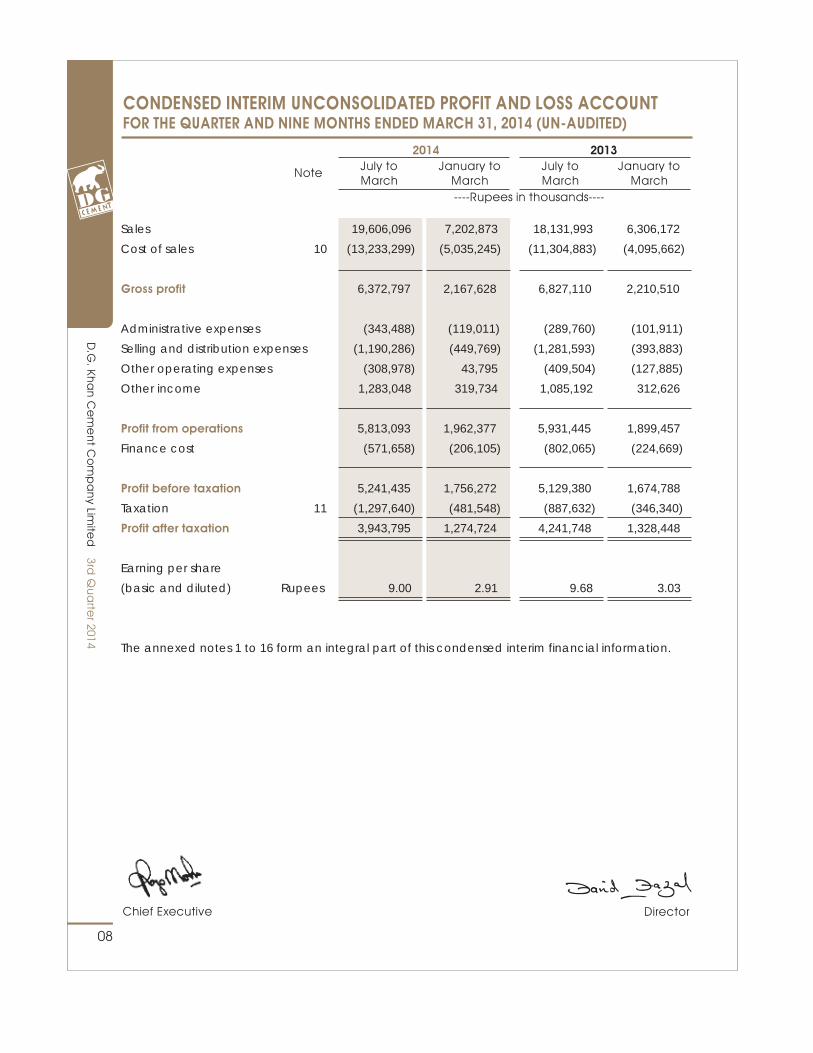
Sales 19,606,096 7,202,873 18,131,993 6,306,172
Cost of sales 10 (13,233,299) (5,035,245) (11,304,883) (4,095,662)
Gross profit 6,372,797 2,167,628 6,827,110 2,210,510
Administrative expenses (343,488) (119,011) (289,760) (101,911)
Selling and distribution expenses (1,190,286) (449,769) (1,281,593) (393,883)
Other operating expenses (308,978) 43,795 (409,504) (127,885)
Other income 1,283,048 319,734 1,085,192 312,626
Profit from operations 5,813,093 1,962,377 5,931,445 1,899,457
Finance cost (571,658) (206,105) (802,065) (224,669)
Profit before taxation 5,241,435 1,756,272 5,129,380 1,674,788
Taxation 11 (1,297,640) (481,548) (887,632) (346,340)
Profit after taxation 3,943,795 1,274,724 4,241,748 1,328,448
Earning per share
(basic and diluted) Rupees 9.00 2.91 9.68 3.03
The annexed notes 1 to 16 form an integral part of this condensed interim financial information.
CONDENSED INTERIM UNCONSOLIDATED PROFIT AND LOSS ACCOUNTFOR THE QUARTER AND NINE MONTHS ENDED MARCH 31, 2014 (UN-AUDITED)
D.G
. Kha
n C
em
en
t Co
mp
an
y Limite
d
08
----Rupees in thousands----
Note July to March
January to March
July to March
January to March
20132014
3rd Q
ua
rter 2014
Chief Executive Director
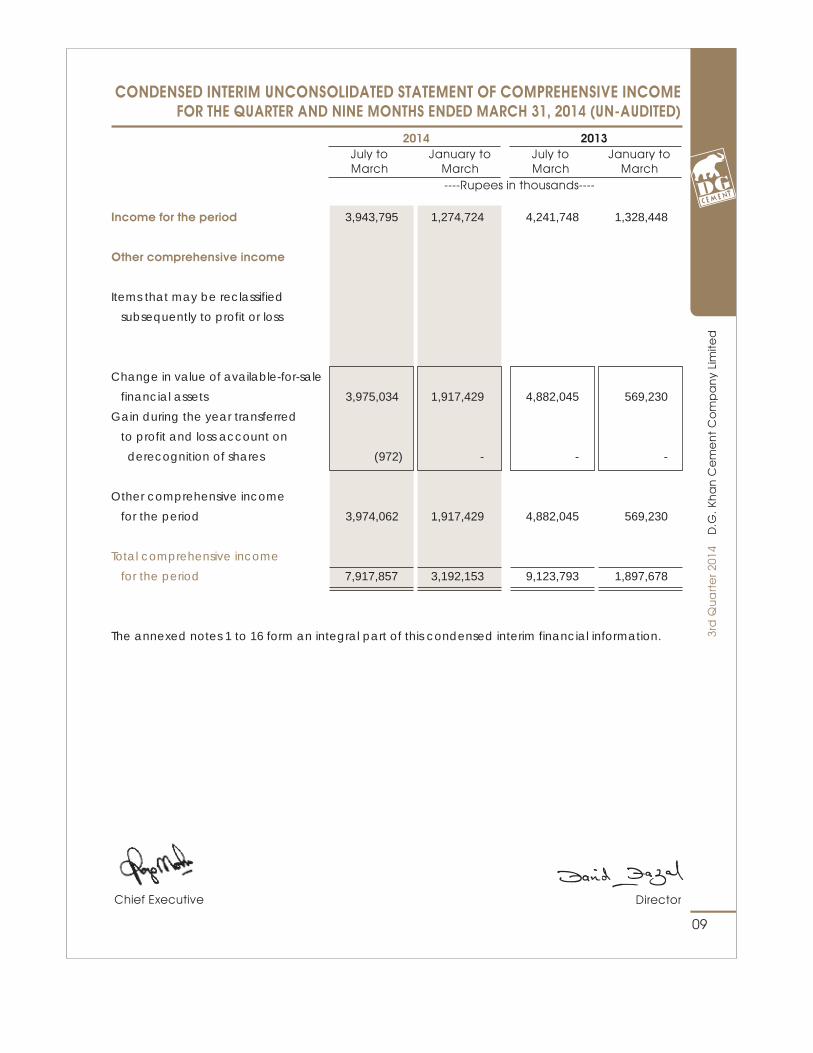
CONDENSED INTERIM UNCONSOLIDATED STATEMENT OF COMPREHENSIVE INCOMEFOR THE QUARTER AND NINE MONTHS ENDED MARCH 31, 2014 (UN-AUDITED)
09
D.G
. Kh
an
Ce
me
nt
Co
mp
an
y Li
mite
d
----Rupees in thousands----
July to March
January to March
July to March
January to March
20132014
Income for the period 3,943,795 1,274,724 4,241,748 1,328,448
Other comprehensive income
Items that may be reclassified
subsequently to profit or loss
Change in value of available-for-sale
financial assets 3,975,034 1,917,429 4,882,045 569,230
Gain during the year transferred
to profit and loss account on
derecognition of shares (972) - - -
Other comprehensive income
for the period 3,974,062 1,917,429 4,882,045 569,230
Total comprehensive income
for the period 7,917,857 3,192,153 9,123,793 1,897,678
The annexed notes 1 to 16 form an integral part of this condensed interim financial information.
3rd
Qu
art
er 2
014
Chief Executive Director
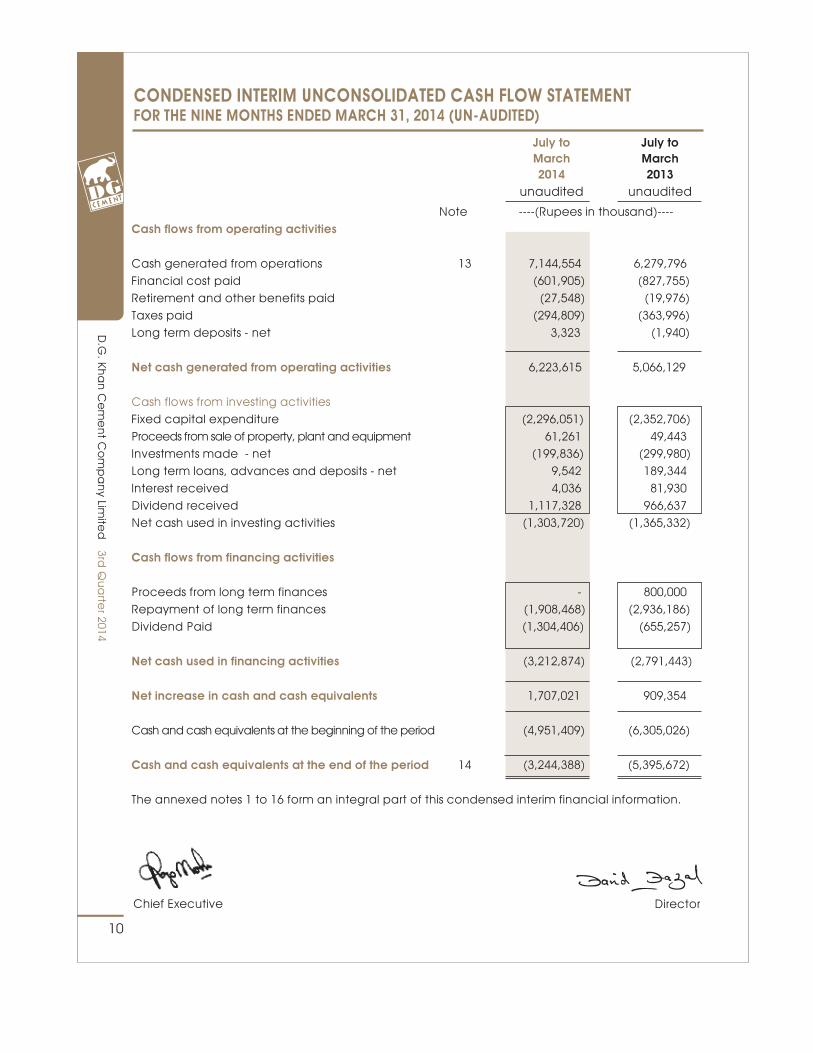
CONDENSED INTERIM UNCONSOLIDATED CASH FLOW STATEMENTFOR THE NINE MONTHS ENDED MARCH 31, 2014 (UN-AUDITED)
10
July to July to March March 2014 2013 unaudited unaudited
Note ----(Rupees in thousand)----Cash flows from operating activities
Cash generated from operations 13 7,144,554 6,279,796Financial cost paid (601,905) (827,755)Retirement and other benefits paid (27,548) (19,976)Taxes paid (294,809) (363,996)Long term deposits - net 3,323 (1,940)
Net cash generated from operating activities 6,223,615 5,066,129
Cash flows from investing activitiesFixed capital expenditure (2,296,051) (2,352,706)Proceeds from sale of property, plant and equipment 61,261 49,443Investments made - net (199,836) (299,980)Long term loans, advances and deposits - net 9,542 189,344Interest received 4,036 81,930Dividend received 1,117,328 966,637Net cash used in investing activities (1,303,720) (1,365,332)
Cash flows from financing activities
Proceeds from long term finances - 800,000Repayment of long term finances (1,908,468) (2,936,186)Dividend Paid (1,304,406) (655,257)
Net cash used in financing activities (3,212,874) (2,791,443)
Net increase in cash and cash equivalents 1,707,021 909,354
Cash and cash equivalents at the beginning of the period (4,951,409) (6,305,026)
Cash and cash equivalents at the end of the period 14 (3,244,388) (5,395,672)
The annexed notes 1 to 16 form an integral part of this condensed interim financial information.
D.G
. Kha
n C
em
en
t Co
mp
an
y Limite
d3rd
Qu
arte
r 2014
Chief Executive Director
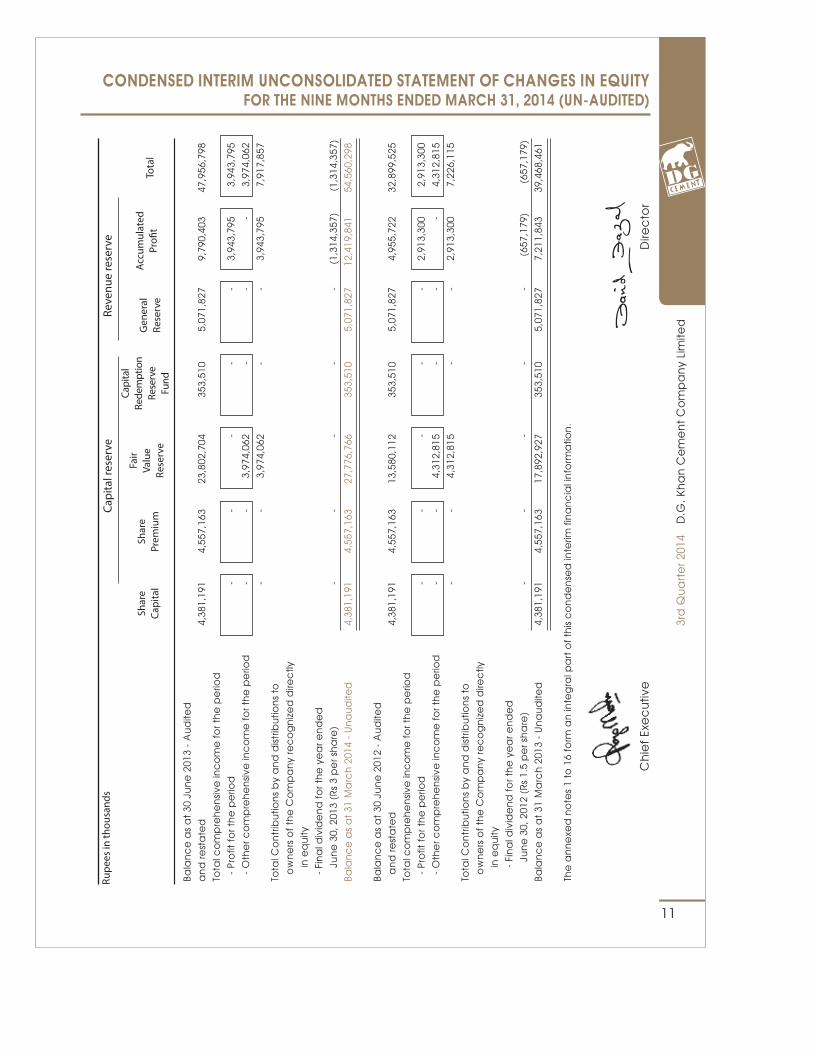
CONDENSED INTERIM UNCONSOLIDATED STATEMENT OF CHANGES IN EQUITY FOR THE NINE MONTHS ENDED MARCH 31, 2014 (UN-AUDITED)
11
Capi
tal r
eser
veRe
venu
e re
serv
e
Bala
nc
e a
s a
t 30
Ju
ne
201
3 -
Au
dite
da
nd
rest
ate
d
4,38
1,19
1 4,
557,
163
23,8
02,7
04
353,
510
5,07
1,82
7 9,
790,
403
47,9
56,7
98To
tal c
om
pre
he
nsiv
e in
co
me
for t
he
pe
riod
-
Pro
fit fo
r th
e p
erio
d
- -
- -
- 3,
943,
795
3,94
3,79
5
- O
the
r co
mp
reh
en
sive
inc
om
e fo
r th
e p
erio
d
- -
3,97
4,06
2 -
- -
3,97
4,06
2
- -
3,97
4,06
2 -
- 3,
943,
795
7,91
7,85
7To
tal C
on
trib
utio
ns
by
an
d d
istrib
utio
ns
to
o
wn
ers
of t
he
Co
mp
an
y re
co
gn
ize
d d
irec
tly
in
eq
uity
-
Fin
al d
ivid
en
d fo
r th
e y
ea
r en
de
d
Jun
e 3
0, 2
013
(Rs
3 p
er s
ha
re)
-
- -
- -
(1,3
14,3
57)
(1,3
14,3
57)
Bala
nc
e a
s a
t 31
Ma
rch
201
4 -
Un
au
dite
d
4,38
1,19
1 4,
557,
163
27,7
76,7
66
353,
510
5,07
1,82
7 12
,419
,841
54
,560
,298
Bala
nc
e a
s a
t 30
Ju
ne
201
2 -
Au
dite
d
an
d re
sta
ted
4,
381,
191
4,55
7,16
3 13
,580
,112
35
3,51
0 5,
071,
827
4,95
5,72
2 32
,899
,525
Tota
l co
mp
reh
en
sive
inc
om
e fo
r th
e p
erio
d
-
Pro
fit fo
r th
e p
erio
d
- -
- -
- 2,
913,
300
2,91
3,30
0
- O
the
r co
mp
reh
en
sive
inc
om
e fo
r th
e p
erio
d
- -
4,31
2,81
5 -
- -
4,31
2,81
5
- -
4,31
2,81
5 -
- 2,
913,
300
7,22
6,11
5To
tal C
on
trib
utio
ns
by
an
d d
istrib
utio
ns
to
ow
ne
rs o
f th
e C
om
pa
ny
rec
og
niz
ed
dire
ctly
in e
qu
ity
-
Fin
al d
ivid
en
d fo
r th
e y
ea
r en
de
d
J
un
e 3
0, 2
012
(Rs
1.5
pe
r sh
are
) -
- -
- -
(657
,179
) (6
57,1
79)
Bala
nc
e a
s a
t 31
Ma
rch
201
3 -
Un
au
dite
d
4,38
1,19
1 4,
557,
163
17,8
92,9
27
353,
510
5,07
1,82
7 7,
211,
843
39,4
68,4
61
Th
e a
nn
exe
d n
ote
s 1
to 1
6 fo
rm a
n in
teg
ral p
art
of t
his
co
nd
en
sed
inte
rim fi
na
nc
ial i
nfo
rma
tion
.
Fair
Valu
eRe
serv
e
Shar
ePr
emiu
mSh
are
Capi
tal
Capi
tal
Rede
mpt
ion
Rese
rve
Fund
Gen
eral
Rese
rve
Accu
mul
ated
Pro�
tTo
tal
Rupe
es in
thou
sand
s
D.G
. Kh
an
Ce
me
nt
Co
mp
an
y Li
mite
d3r
d Q
ua
rte
r 201
4
Ch
ief E
xec
utiv
eD
irec
tor
NOTES TO AND FORMING PART OF THE CONDENSED INTERIM UNCONSOLIDATEDFINANCIAL INFORMATION FOR THE QUARTER AND NINE MONTHS ENDED MARCH 31, 2014 (UN-AUDITED)
12
1. Status and nature of business
D. G. Khan Cement Company Limited ("the Company") is a public limited company incorporated in Pakistan and is listed on Karachi, Lahore and Islamabad Stock Exchanges. It is principally engaged in production and sale of Clinker, Ordinary Portland and Sulphate Resistant Cement. The registered office of the company is situated at 53-A Lawrence Road, Lahore.
2. Basis of preparation
This condensed interim financial information is un-audited and is being submitted to the members as required by section 245 of the Companies Ordinance, 1984. The condensed interim financial information has been prepared in accordance with the requirements of the International Accounting Standard (IAS) 34 'Interim Financial Reporting' and provisions of and directives issued under the Companies Ordinance, 1984. In case where requirements differ, the provisions of or directives issued under the Companies Ordinance, 1984 have been followed. The figures for the nine months ended March 31, 2014 have, however, been subjected to limited scope review by the auditors as required by the Code of Corporate Governance. This condensed interim financial information does not include all the information required for annual financial statements and therefore, should be read in conjunction with the annual financial statements for the year ended June 30, 2013, which have been prepared in accordance with approved accounting standards as applicable in Pakistan.
3. Significant accounting policies
3.1 The accounting policies adopted for the preparation of this condensed interim financial information are the same as those applied in the preparation of preceding annual published financial statements of the Company for the year ended June 30, 2013 except for the adoption of a new accounting policy referred to in note 3.3.1.
3.2 Initial application of standards, amendments or an interpretation to existing standards
The following amendments to existing standards have been published that are applicable to the Company’s financial statements covering annual periods, beginning on or after the following dates:
3.3 Amendments to published standards effective in current year
Certain standards, amendments and interpretations to approved accounting standards are effective for accounting periods beginning on July 01, 2013 but are considered not to be relevant or to have any significant effect on the Company’s operations and are, therefore, not detailed in this condensed interim financial information except for IAS 19 (Amendment), ‘Employee Benefits’. The impact of this amendment on the condensed interim financial information is as follows:
3.3.1 Change in accounting policy IAS 19 (revised) - 'Employee Benefits' effective for annual periods beginning on or after January 01, 2013 amends the accounting for employee benefits. The standard requires
D.G
. Kha
n C
em
en
t Co
mp
an
y Limite
d3rd
Qu
arte
r 2014
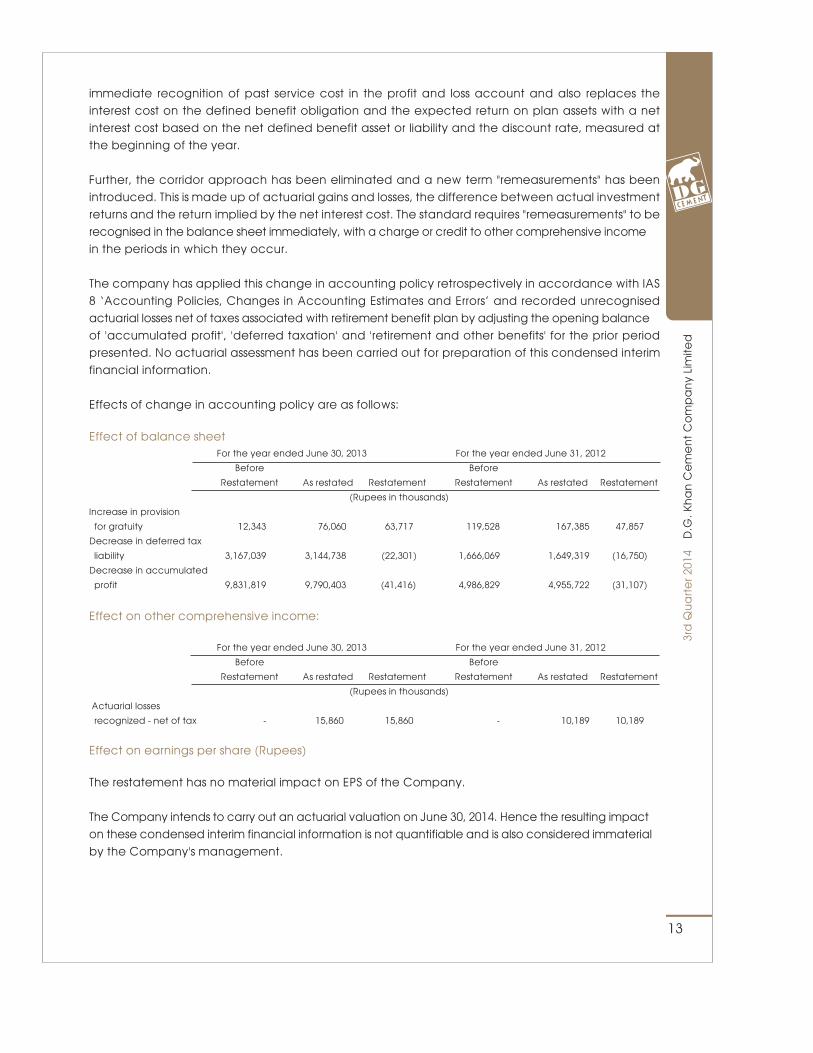
immediate recognition of past service cost in the profit and loss account and also replaces the interest cost on the defined benefit obligation and the expected return on plan assets with a net interest cost based on the net defined benefit asset or liability and the discount rate, measured at the beginning of the year.
Further, the corridor approach has been eliminated and a new term "remeasurements" has been introduced. This is made up of actuarial gains and losses, the difference between actual investment returns and the return implied by the net interest cost. The standard requires "remeasurements" to be recognised in the balance sheet immediately, with a charge or credit to other comprehensive income in the periods in which they occur.
The company has applied this change in accounting policy retrospectively in accordance with IAS 8 ‘Accounting Policies, Changes in Accounting Estimates and Errors’ and recorded unrecognised actuarial losses net of taxes associated with retirement benefit plan by adjusting the opening balance of 'accumulated profit', 'deferred taxation' and 'retirement and other benefits' for the prior period presented. No actuarial assessment has been carried out for preparation of this condensed interim financial information.
Effects of change in accounting policy are as follows: Effect of balance sheet For the year ended June 30, 2013 For the year ended June 31, 2012
Before Before
Restatement As restated Restatement Restatement As restated Restatement
(Rupees in thousands)
Increase in provision
for gratuity 12,343 76,060 63,717 119,528 167,385 47,857
Decrease in deferred tax
liability 3,167,039 3,144,738 (22,301) 1,666,069 1,649,319 (16,750)
Decrease in accumulated
profit 9,831,819 9,790,403 (41,416) 4,986,829 4,955,722 (31,107)
Effect on other comprehensive income:
For the year ended June 30, 2013 For the year ended June 31, 2012
Before Before
Restatement As restated Restatement Restatement As restated Restatement
(Rupees in thousands)
Actuarial losses
recognized - net of tax - 15,860 15,860 - 10,189 10,189
Effect on earnings per share (Rupees)
The restatement has no material impact on EPS of the Company.
The Company intends to carry out an actuarial valuation on June 30, 2014. Hence the resulting impact on these condensed interim financial information is not quantifiable and is also considered immaterial by the Company's management.
13
D.G
. Kh
an
Ce
me
nt
Co
mp
an
y Li
mite
d3r
d Q
ua
rte
r 201
4
14
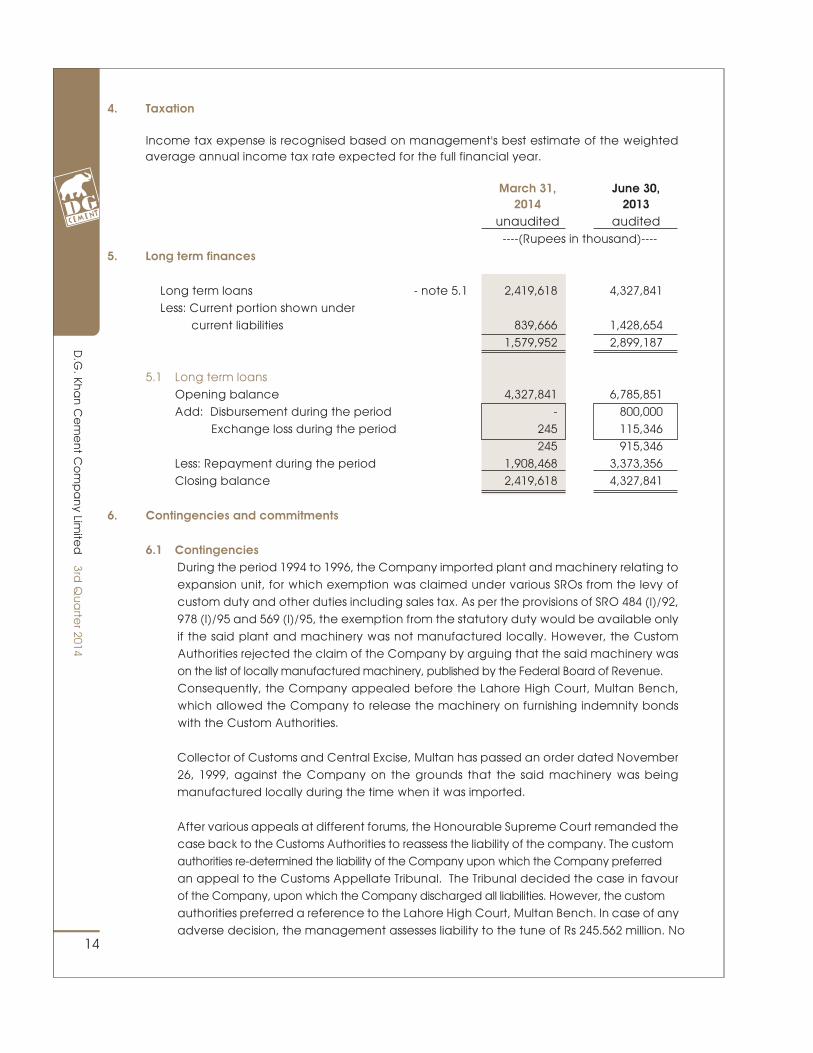
4. Taxation
Income tax expense is recognised based on management's best estimate of the weighted average annual income tax rate expected for the full financial year.
March 31, June 30, 2014 2013 unaudited audited ----(Rupees in thousand)---- 5. Long term finances
Long term loans - note 5.1 2,419,618 4,327,841 Less: Current portion shown under current liabilities 839,666 1,428,654 1,579,952 2,899,187
5.1 Long term loans Opening balance 4,327,841 6,785,851 Add: Disbursement during the period - 800,000 Exchange loss during the period 245 115,346 245 915,346 Less: Repayment during the period 1,908,468 3,373,356 Closing balance 2,419,618 4,327,841
6. Contingencies and commitments
6.1 Contingencies During the period 1994 to 1996, the Company imported plant and machinery relating to
expansion unit, for which exemption was claimed under various SROs from the levy of custom duty and other duties including sales tax. As per the provisions of SRO 484 (I)/92, 978 (I)/95 and 569 (I)/95, the exemption from the statutory duty would be available only if the said plant and machinery was not manufactured locally. However, the Custom Authorities rejected the claim of the Company by arguing that the said machinery was on the list of locally manufactured machinery, published by the Federal Board of Revenue. Consequently, the Company appealed before the Lahore High Court, Multan Bench, which allowed the Company to release the machinery on furnishing indemnity bonds with the Custom Authorities.
Collector of Customs and Central Excise, Multan has passed an order dated November 26, 1999, against the Company on the grounds that the said machinery was being manufactured locally during the time when it was imported.
After various appeals at different forums, the Honourable Supreme Court remanded the case back to the Customs Authorities to reassess the liability of the company. The custom authorities re-determined the liability of the Company upon which the Company preferred an appeal to the Customs Appellate Tribunal. The Tribunal decided the case in favour of the Company, upon which the Company discharged all liabilities. However, the custom authorities preferred a reference to the Lahore High Court, Multan Bench. In case of any adverse decision, the management assesses liability to the tune of Rs 245.562 million. No
D.G
. Kha
n C
em
en
t Co
mp
an
y Limite
d3rd
Qu
arte
r 2014
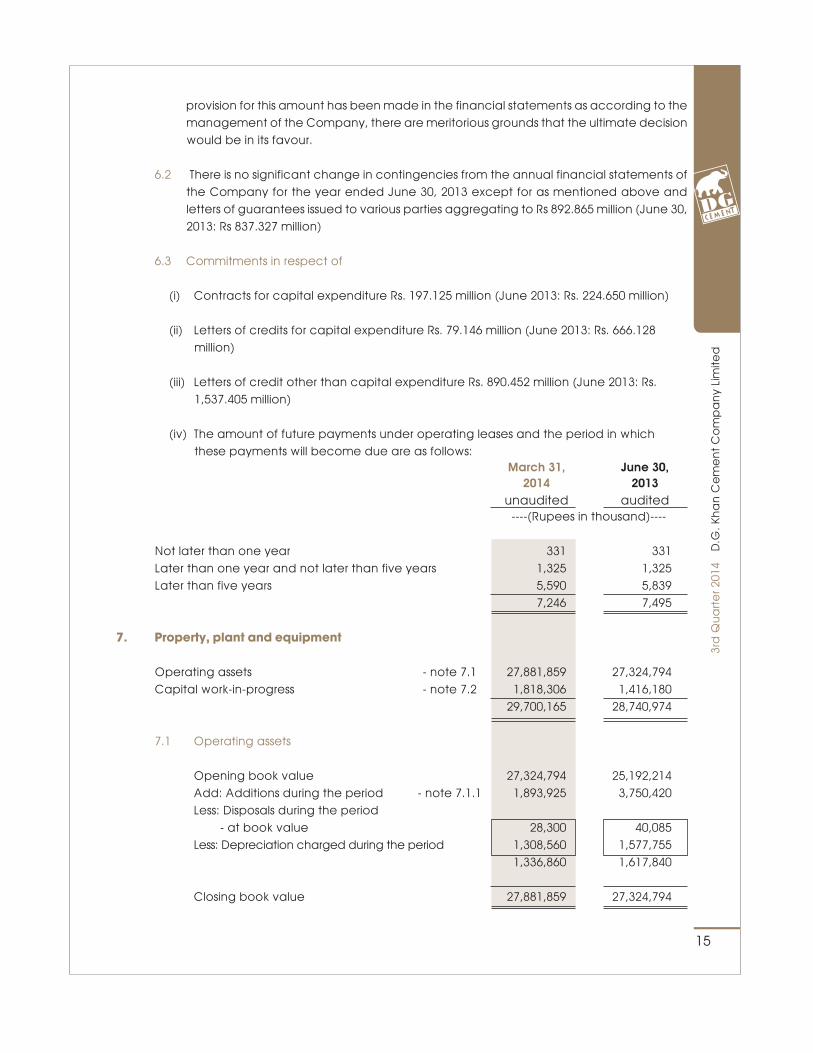
provision for this amount has been made in the financial statements as according to the management of the Company, there are meritorious grounds that the ultimate decision would be in its favour.
6.2 There is no significant change in contingencies from the annual financial statements of the Company for the year ended June 30, 2013 except for as mentioned above and letters of guarantees issued to various parties aggregating to Rs 892.865 million (June 30, 2013: Rs 837.327 million)
6.3 Commitments in respect of
(i) Contracts for capital expenditure Rs. 197.125 million (June 2013: Rs. 224.650 million)
(ii) Letters of credits for capital expenditure Rs. 79.146 million (June 2013: Rs. 666.128 million)
(iii) Letters of credit other than capital expenditure Rs. 890.452 million (June 2013: Rs. 1,537.405 million)
(iv) The amount of future payments under operating leases and the period in which these payments will become due are as follows:
March 31, June 30, 2014 2013 unaudited audited ----(Rupees in thousand)----
Not later than one year 331 331 Later than one year and not later than five years 1,325 1,325 Later than five years 5,590 5,839 7,246 7,495
7. Property, plant and equipment
Operating assets - note 7.1 27,881,859 27,324,794 Capital work-in-progress - note 7.2 1,818,306 1,416,180 29,700,165 28,740,974
7.1 Operating assets
Opening book value 27,324,794 25,192,214 Add: Additions during the period - note 7.1.1 1,893,925 3,750,420 Less: Disposals during the period - at book value 28,300 40,085 Less: Depreciation charged during the period 1,308,560 1,577,755 1,336,860 1,617,840
Closing book value 27,881,859 27,324,794
15
D.G
. Kh
an
Ce
me
nt
Co
mp
an
y Li
mite
d3r
d Q
ua
rte
r 201
4
16
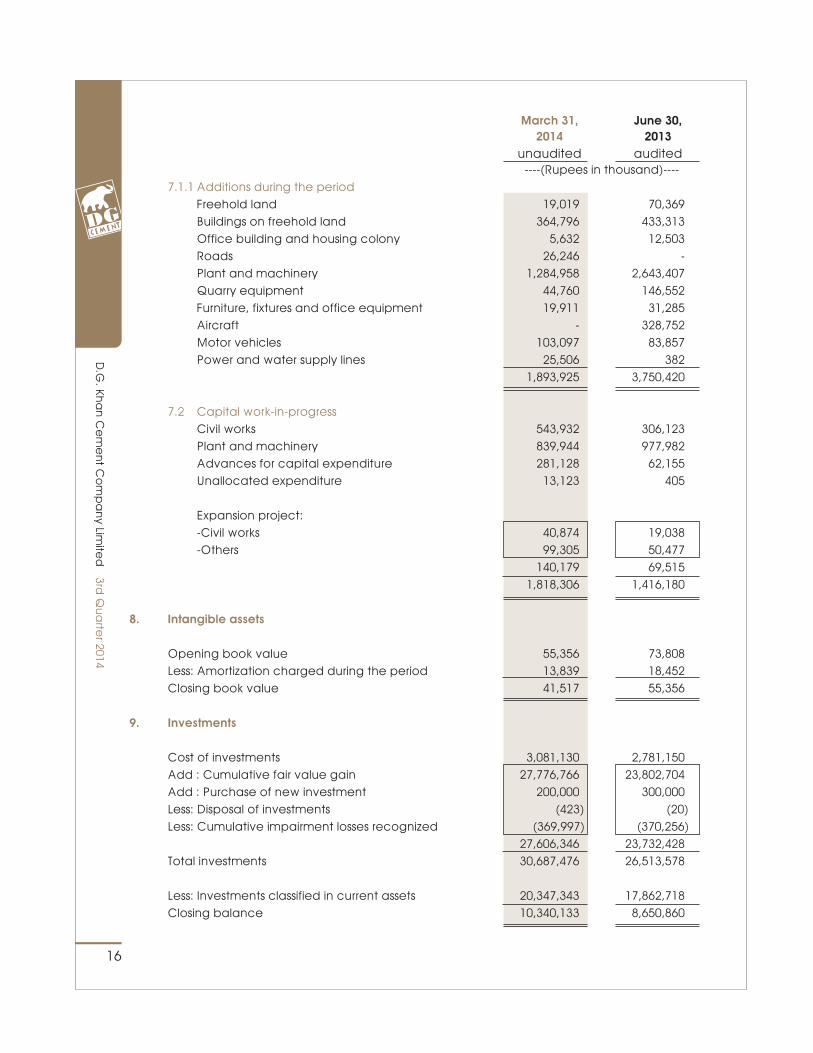
March 31, June 30, 2014 2013 unaudited audited ----(Rupees in thousand)---- 7.1.1 Additions during the period Freehold land 19,019 70,369 Buildings on freehold land 364,796 433,313 Office building and housing colony 5,632 12,503 Roads 26,246 - Plant and machinery 1,284,958 2,643,407 Quarry equipment 44,760 146,552 Furniture, fixtures and office equipment 19,911 31,285 Aircraft - 328,752 Motor vehicles 103,097 83,857 Power and water supply lines 25,506 382 1,893,925 3,750,420
7.2 Capital work-in-progress Civil works 543,932 306,123 Plant and machinery 839,944 977,982 Advances for capital expenditure 281,128 62,155 Unallocated expenditure 13,123 405
Expansion project: -Civil works 40,874 19,038 -Others 99,305 50,477 140,179 69,515 1,818,306 1,416,180
8. Intangible assets
Opening book value 55,356 73,808 Less: Amortization charged during the period 13,839 18,452 Closing book value 41,517 55,356
9. Investments
Cost of investments 3,081,130 2,781,150 Add : Cumulative fair value gain 27,776,766 23,802,704 Add : Purchase of new investment 200,000 300,000 Less: Disposal of investments (423) (20) Less: Cumulative impairment losses recognized (369,997) (370,256) 27,606,346 23,732,428 Total investments 30,687,476 26,513,578
Less: Investments classified in current assets 20,347,343 17,862,718 Closing balance 10,340,133 8,650,860
D.G
. Kha
n C
em
en
t Co
mp
an
y Limite
d3rd
Qu
arte
r 2014
17
----Rupees in thousands----
July to March
January to March
July to March
January to March
20132014
D.G
. Kh
an
Ce
me
nt
Co
mp
an
y Li
mite
d3r
d Q
ua
rte
r 201
4
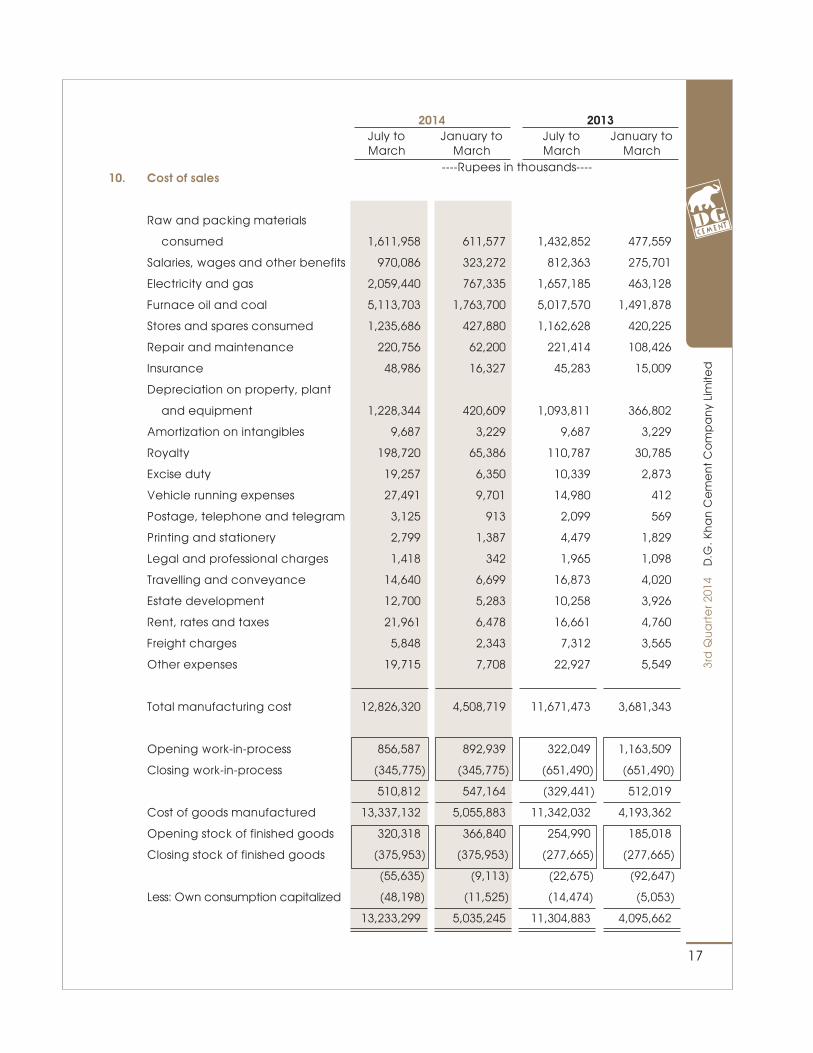
10. Cost of sales
Raw and packing materials
consumed 1,611,958 611,577 1,432,852 477,559
Salaries, wages and other benefits 970,086 323,272 812,363 275,701
Electricity and gas 2,059,440 767,335 1,657,185 463,128
Furnace oil and coal 5,113,703 1,763,700 5,017,570 1,491,878
Stores and spares consumed 1,235,686 427,880 1,162,628 420,225
Repair and maintenance 220,756 62,200 221,414 108,426
Insurance 48,986 16,327 45,283 15,009
Depreciation on property, plant
and equipment 1,228,344 420,609 1,093,811 366,802
Amortization on intangibles 9,687 3,229 9,687 3,229
Royalty 198,720 65,386 110,787 30,785
Excise duty 19,257 6,350 10,339 2,873
Vehicle running expenses 27,491 9,701 14,980 412
Postage, telephone and telegram 3,125 913 2,099 569
Printing and stationery 2,799 1,387 4,479 1,829
Legal and professional charges 1,418 342 1,965 1,098
Travelling and conveyance 14,640 6,699 16,873 4,020
Estate development 12,700 5,283 10,258 3,926
Rent, rates and taxes 21,961 6,478 16,661 4,760
Freight charges 5,848 2,343 7,312 3,565
Other expenses 19,715 7,708 22,927 5,549
Total manufacturing cost 12,826,320 4,508,719 11,671,473 3,681,343
Opening work-in-process 856,587 892,939 322,049 1,163,509
Closing work-in-process (345,775) (345,775) (651,490) (651,490)
510,812 547,164 (329,441) 512,019
Cost of goods manufactured 13,337,132 5,055,883 11,342,032 4,193,362
Opening stock of finished goods 320,318 366,840 254,990 185,018
Closing stock of finished goods (375,953) (375,953) (277,665) (277,665)
(55,635) (9,113) (22,675) (92,647)
Less: Own consumption capitalized (48,198) (11,525) (14,474) (5,053)
13,233,299 5,035,245 11,304,883 4,095,662
18
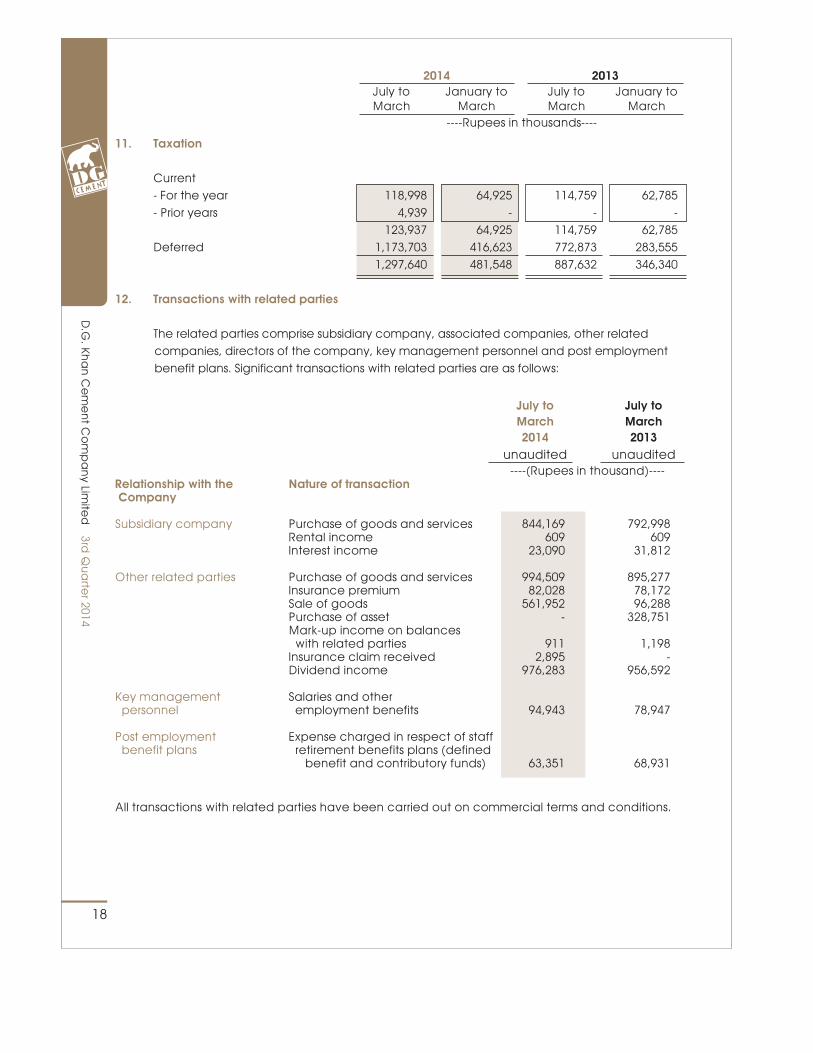
11. Taxation
Current - For the year 118,998 64,925 114,759 62,785 - Prior years 4,939 - - - 123,937 64,925 114,759 62,785 Deferred 1,173,703 416,623 772,873 283,555 1,297,640 481,548 887,632 346,340
12. Transactions with related parties
The related parties comprise subsidiary company, associated companies, other related companies, directors of the company, key management personnel and post employment benefit plans. Significant transactions with related parties are as follows:
July to July to March March 2014 2013 unaudited unaudited ----(Rupees in thousand)----Relationship with the Nature of transaction Company
Subsidiary company Purchase of goods and services 844,169 792,998 Rental income 609 609 Interest income 23,090 31,812
Other related parties Purchase of goods and services 994,509 895,277 Insurance premium 82,028 78,172 Sale of goods 561,952 96,288 Purchase of asset - 328,751 Mark-up income on balances with related parties 911 1,198 Insurance claim received 2,895 - Dividend income 976,283 956,592
Key management Salaries and other personnel employment benefits 94,943 78,947
Post employment Expense charged in respect of staff benefit plans retirement benefits plans (defined benefit and contributory funds) 63,351 68,931
All transactions with related parties have been carried out on commercial terms and conditions.
D.G
. Kha
n C
em
en
t Co
mp
an
y Limite
d3rd
Qu
arte
r 2014
----Rupees in thousands----
July to March
January to March
July to March
January to March
20132014
19
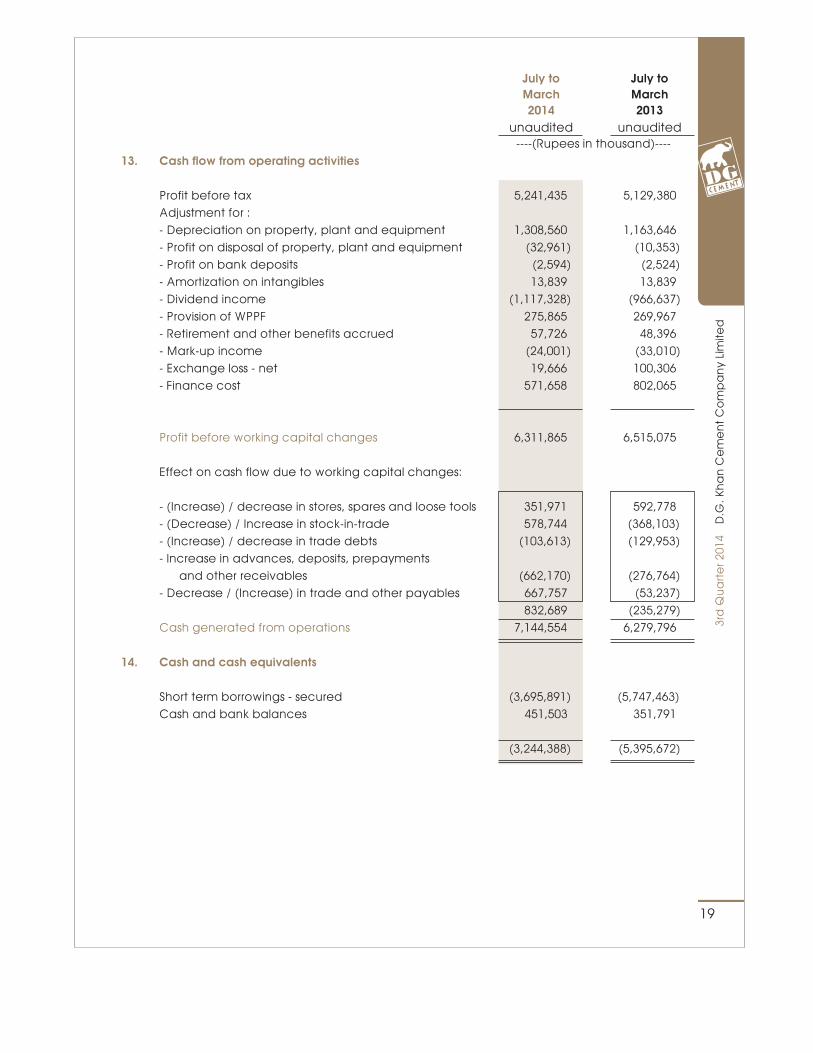
July to July to March March 2014 2013 unaudited unaudited ----(Rupees in thousand)----13. Cash flow from operating activities
Profit before tax 5,241,435 5,129,380 Adjustment for : - Depreciation on property, plant and equipment 1,308,560 1,163,646 - Profit on disposal of property, plant and equipment (32,961) (10,353) - Profit on bank deposits (2,594) (2,524) - Amortization on intangibles 13,839 13,839 - Dividend income (1,117,328) (966,637) - Provision of WPPF 275,865 269,967 - Retirement and other benefits accrued 57,726 48,396 - Mark-up income (24,001) (33,010) - Exchange loss - net 19,666 100,306 - Finance cost 571,658 802,065
Profit before working capital changes 6,311,865 6,515,075
Effect on cash flow due to working capital changes:
- (Increase) / decrease in stores, spares and loose tools 351,971 592,778 - (Decrease) / Increase in stock-in-trade 578,744 (368,103) - (Increase) / decrease in trade debts (103,613) (129,953) - Increase in advances, deposits, prepayments and other receivables (662,170) (276,764) - Decrease / (Increase) in trade and other payables 667,757 (53,237) 832,689 (235,279) Cash generated from operations 7,144,554 6,279,796
14. Cash and cash equivalents
Short term borrowings - secured (3,695,891) (5,747,463) Cash and bank balances 451,503 351,791
(3,244,388) (5,395,672)
D.G
. Kh
an
Ce
me
nt
Co
mp
an
y Li
mite
d3r
d Q
ua
rte
r 201
4
20
15. Date of authorization for issue
This interim financial information was authorized for issue on April 24, 2014 by the Board of Directors of the Company.
16. Corresponding figures
In order to comply with the requirements of International Accounting Standard 34 - 'Interim Financial Reporting', the condensed interim balance sheet and condensed interim statement of changes in equity have been compared with the balances of annual audited financial statements of preceding financial year, whereas, the condensed interim profit and loss account,
condensed interim statement of comprehensive income and condensed interim cash flow statement have been compared with the balances of comparable period of immediately preceding financial year.
D.G
. Kha
n C
em
en
t Co
mp
an
y Limite
d3rd
Qu
arte
r 2014
Chief Executive Director
ConsolidatedFinancial Statements
22
D.G
. Kha
n C
em
en
t Co
mp
an
y Limite
d G
rou
p3rd
Qu
arte
r 2014
23
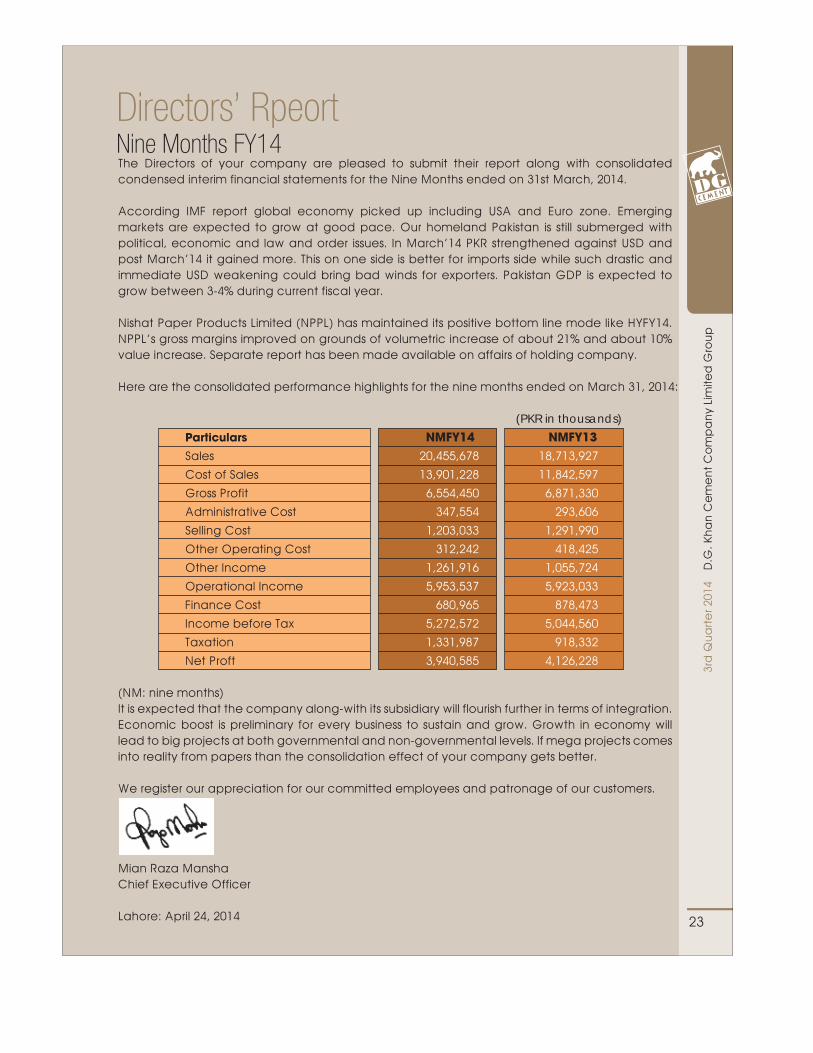
Directors’ RpeortNine Months FY14The Directors of your company are pleased to submit their report along with consolidated condensed interim financial statements for the Nine Months ended on 31st March, 2014.
According IMF report global economy picked up including USA and Euro zone. Emerging markets are expected to grow at good pace. Our homeland Pakistan is still submerged with political, economic and law and order issues. In March’14 PKR strengthened against USD and post March’14 it gained more. This on one side is better for imports side while such drastic and immediate USD weakening could bring bad winds for exporters. Pakistan GDP is expected to grow between 3-4% during current fiscal year.
Nishat Paper Products Limited (NPPL) has maintained its positive bottom line mode like HYFY14. NPPL’s gross margins improved on grounds of volumetric increase of about 21% and about 10% value increase. Separate report has been made available on affairs of holding company.
Here are the consolidated performance highlights for the nine months ended on March 31, 2014:
(PKR in thousands)
Particulars NMFY14 NMFY13 Sales 20,455,678 18,713,927
Cost of Sales 13,901,228 11,842,597
Gross Profit 6,554,450 6,871,330
Administrative Cost 347,554 293,606
Selling Cost 1,203,033 1,291,990
Other Operating Cost 312,242 418,425
Other Income 1,261,916 1,055,724
Operational Income 5,953,537 5,923,033
Finance Cost 680,965 878,473
Income before Tax 5,272,572 5,044,560
Taxation 1,331,987 918,332
Net Proft 3,940,585 4,126,228
(NM: nine months)It is expected that the company along-with its subsidiary will flourish further in terms of integration. Economic boost is preliminary for every business to sustain and grow. Growth in economy will lead to big projects at both governmental and non-governmental levels. If mega projects comes into reality from papers than the consolidation effect of your company gets better.
We register our appreciation for our committed employees and patronage of our customers.
Mian Raza ManshaChief Executive Officer
Lahore: April 24, 2014
D.G
. Kh
an
Ce
me
nt
Co
mp
an
y Li
mite
d G
rou
p3r
d Q
ua
rte
r 201
4
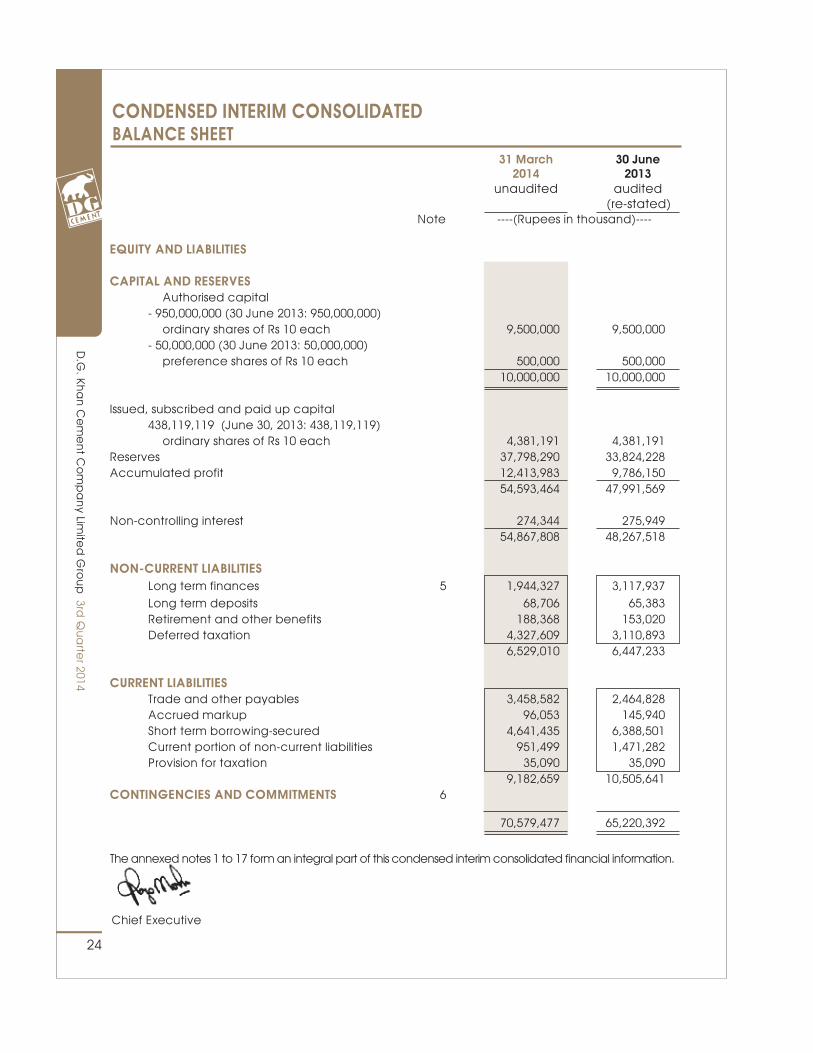
CONDENSED INTERIM CONSOLIDATEDBALANCE SHEET
24
Chief Executive
31 March 30 June 2014 2013 unaudited audited (re-stated) Note ----(Rupees in thousand)----
EQUITY AND LIABILITIES
CAPITAL AND RESERVES Authorised capital - 950,000,000 (30 June 2013: 950,000,000) ordinary shares of Rs 10 each 9,500,000 9,500,000 - 50,000,000 (30 June 2013: 50,000,000) preference shares of Rs 10 each 500,000 500,000 10,000,000 10,000,000
Issued, subscribed and paid up capital 438,119,119 (June 30, 2013: 438,119,119) ordinary shares of Rs 10 each 4,381,191 4,381,191Reserves 37,798,290 33,824,228Accumulated profit 12,413,983 9,786,150 54,593,464 47,991,569
Non-controlling interest 274,344 275,949 54,867,808 48,267,518
NON-CURRENT LIABILITIES Long term finances 5 1,944,327 3,117,937 Long term deposits 68,706 65,383 Retirement and other benefits 188,368 153,020 Deferred taxation 4,327,609 3,110,893 6,529,010 6,447,233
CURRENT LIABILITIES Trade and other payables 3,458,582 2,464,828 Accrued markup 96,053 145,940 Short term borrowing-secured 4,641,435 6,388,501 Current portion of non-current liabilities 951,499 1,471,282 Provision for taxation 35,090 35,090 9,182,659 10,505,641CONTINGENCIES AND COMMITMENTS 6
70,579,477 65,220,392
The annexed notes 1 to 17 form an integral part of this condensed interim consolidated financial information.
D.G
. Kha
n C
em
en
t Co
mp
an
y Limite
d G
rou
p3rd
Qu
arte
r 2014
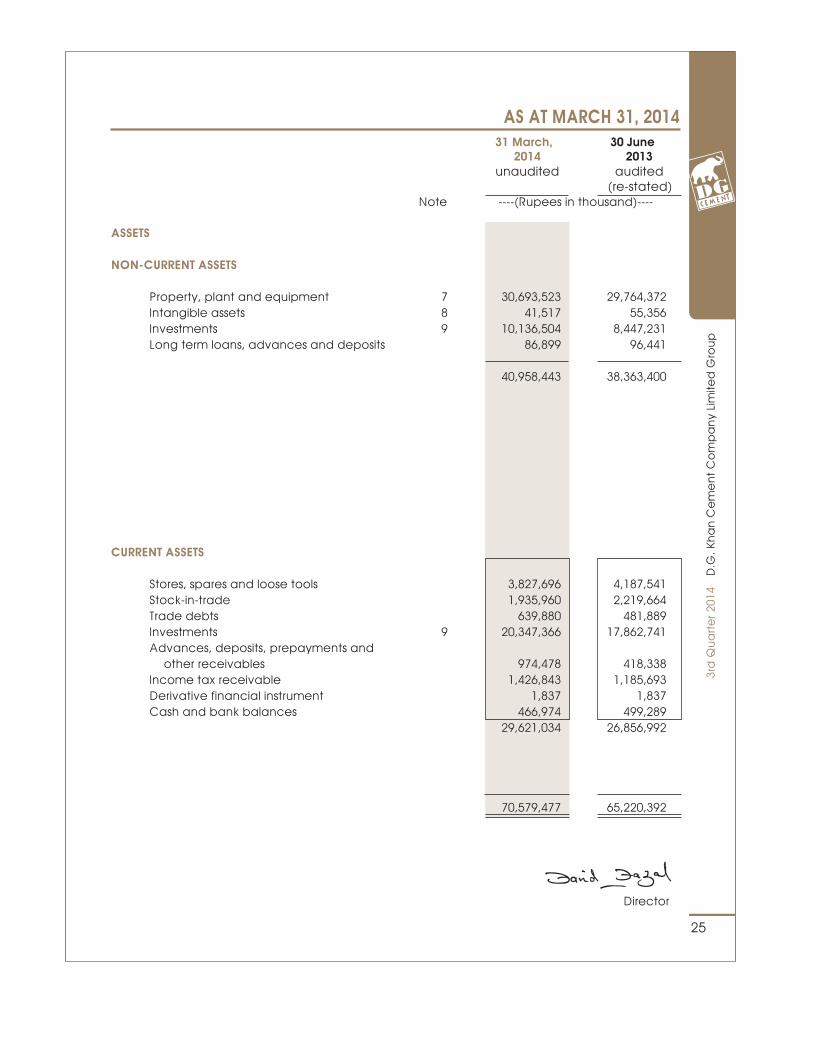
AS AT MARCH 31, 2014 31 March, 30 June 2014 2013 unaudited audited (re-stated) Note ----(Rupees in thousand)----
ASSETS
NON-CURRENT ASSETS
Property, plant and equipment 7 30,693,523 29,764,372 Intangible assets 8 41,517 55,356 Investments 9 10,136,504 8,447,231 Long term loans, advances and deposits 86,899 96,441
40,958,443 38,363,400
CURRENT ASSETS
Stores, spares and loose tools 3,827,696 4,187,541 Stock-in-trade 1,935,960 2,219,664 Trade debts 639,880 481,889 Investments 9 20,347,366 17,862,741 Advances, deposits, prepayments and other receivables 974,478 418,338 Income tax receivable 1,426,843 1,185,693 Derivative financial instrument 1,837 1,837 Cash and bank balances 466,974 499,289 29,621,034 26,856,992
70,579,477 65,220,392
25
D.G
. Kh
an
Ce
me
nt
Co
mp
an
y Li
mite
d G
rou
p3r
d Q
ua
rte
r 201
4
Director
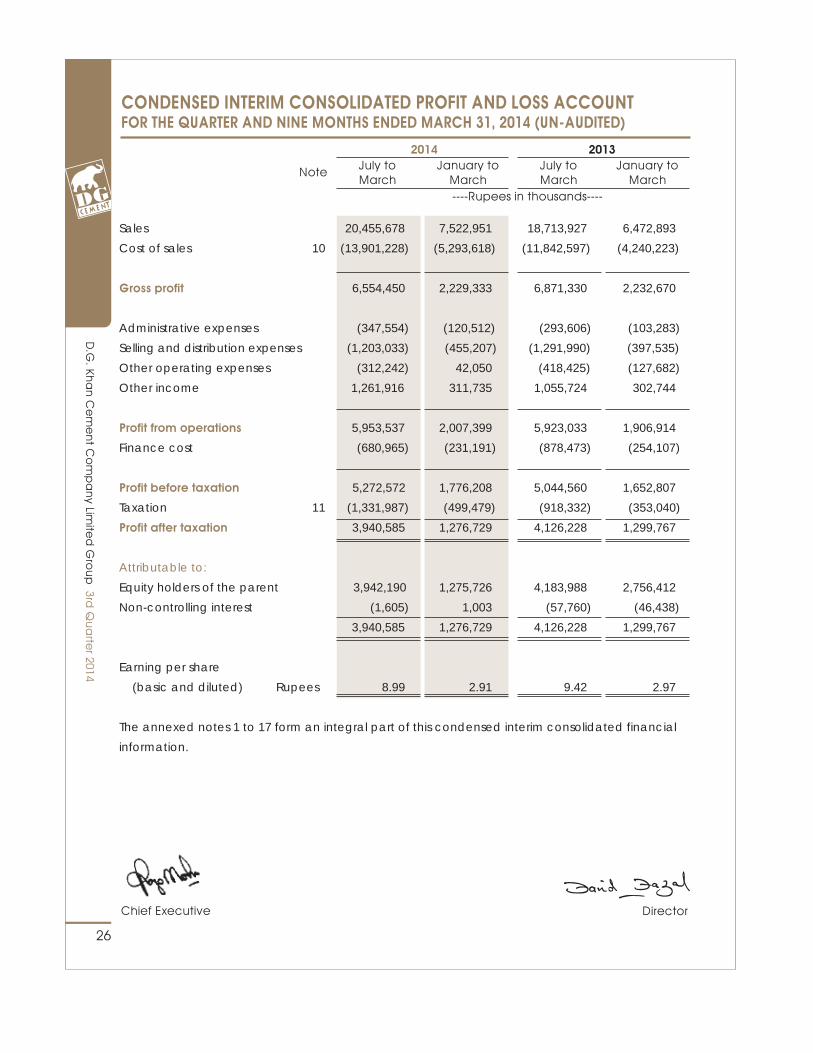
CONDENSED INTERIM CONSOLIDATED PROFIT AND LOSS ACCOUNTFOR THE QUARTER AND NINE MONTHS ENDED MARCH 31, 2014 (UN-AUDITED)
26
----Rupees in thousands----
Note July to March
January to March
July to March
January to March
20132014
Sales 20,455,678 7,522,951 18,713,927 6,472,893
Cost of sales 10 (13,901,228) (5,293,618) (11,842,597) (4,240,223)
Gross profit 6,554,450 2,229,333 6,871,330 2,232,670
Administrative expenses (347,554) (120,512) (293,606) (103,283)
Selling and distribution expenses (1,203,033) (455,207) (1,291,990) (397,535)
Other operating expenses (312,242) 42,050 (418,425) (127,682)
Other income 1,261,916 311,735 1,055,724 302,744
Profit from operations 5,953,537 2,007,399 5,923,033 1,906,914
Finance cost (680,965) (231,191) (878,473) (254,107)
Profit before taxation 5,272,572 1,776,208 5,044,560 1,652,807
Taxation 11 (1,331,987) (499,479) (918,332) (353,040)
Profit after taxation 3,940,585 1,276,729 4,126,228 1,299,767
Attributable to:
Equity holders of the parent 3,942,190 1,275,726 4,183,988 2,756,412
Non-controlling interest (1,605) 1,003 (57,760) (46,438)
3,940,585 1,276,729 4,126,228 1,299,767
Earning per share
(basic and diluted) Rupees 8.99 2.91 9.42 2.97
The annexed notes 1 to 17 form an integral part of this condensed interim consolidated financial
information.
D.G
. Kha
n C
em
en
t Co
mp
an
y Limite
d G
rou
p3rd
Qu
arte
r 2014
Chief Executive Director
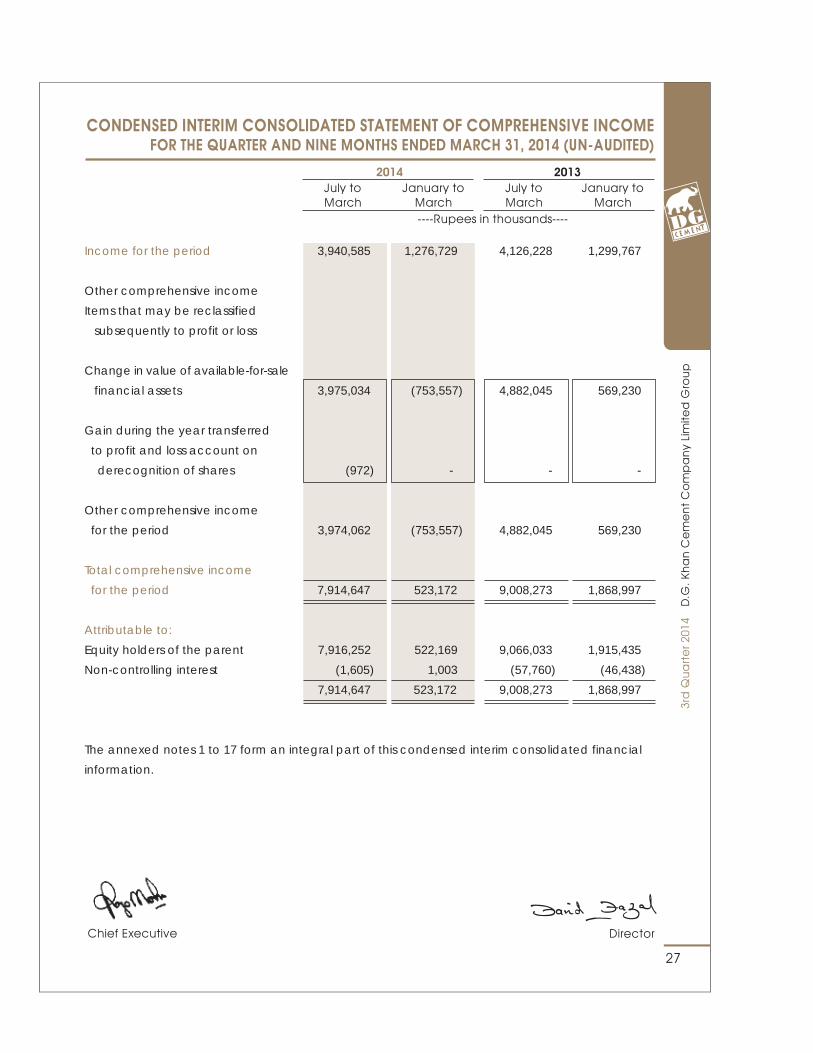
CONDENSED INTERIM CONSOLIDATED STATEMENT OF COMPREHENSIVE INCOMEFOR THE QUARTER AND NINE MONTHS ENDED MARCH 31, 2014 (UN-AUDITED)
27
----Rupees in thousands----
July to March
January to March
July to March
January to March
20132014
Income for the period 3,940,585 1,276,729 4,126,228 1,299,767
Other comprehensive income
Items that may be reclassified
subsequently to profit or loss
Change in value of available-for-sale
financial assets 3,975,034 (753,557) 4,882,045 569,230
Gain during the year transferred
to profit and loss account on
derecognition of shares (972) - - -
Other comprehensive income
for the period 3,974,062 (753,557) 4,882,045 569,230
Total comprehensive income
for the period 7,914,647 523,172 9,008,273 1,868,997
Attributable to:
Equity holders of the parent 7,916,252 522,169 9,066,033 1,915,435
Non-controlling interest (1,605) 1,003 (57,760) (46,438)
7,914,647 523,172 9,008,273 1,868,997
The annexed notes 1 to 17 form an integral part of this condensed interim consolidated financial
information.
D.G
. Kh
an
Ce
me
nt
Co
mp
an
y Li
mite
d G
rou
p3r
d Q
ua
rte
r 201
4
Chief Executive Director
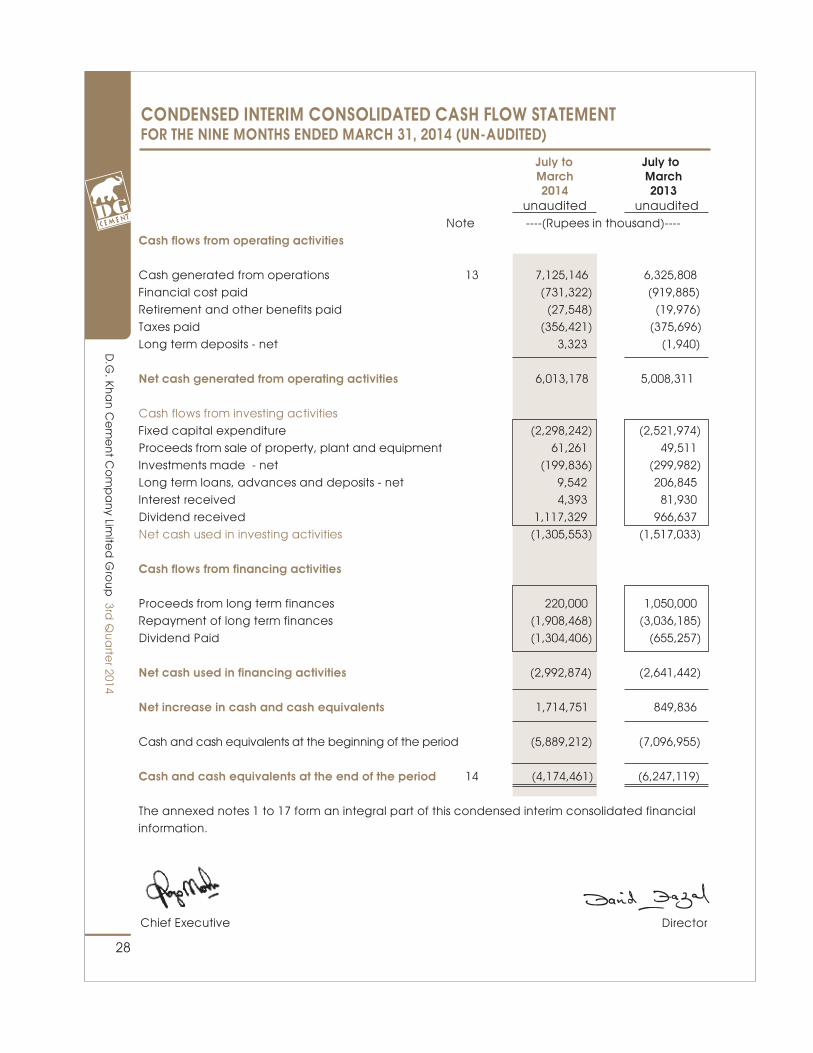
CONDENSED INTERIM CONSOLIDATED CASH FLOW STATEMENTFOR THE NINE MONTHS ENDED MARCH 31, 2014 (UN-AUDITED)
28
July to July to March March 2014 2013 unaudited unaudited Note ----(Rupees in thousand)---- Cash flows from operating activities
Cash generated from operations 13 7,125,146 6,325,808Financial cost paid (731,322) (919,885)Retirement and other benefits paid (27,548) (19,976)Taxes paid (356,421) (375,696)Long term deposits - net 3,323 (1,940)
Net cash generated from operating activities 6,013,178 5,008,311
Cash flows from investing activitiesFixed capital expenditure (2,298,242) (2,521,974)Proceeds from sale of property, plant and equipment 61,261 49,511Investments made - net (199,836) (299,982)Long term loans, advances and deposits - net 9,542 206,845Interest received 4,393 81,930Dividend received 1,117,329 966,637Net cash used in investing activities (1,305,553) (1,517,033)
Cash flows from financing activities
Proceeds from long term finances 220,000 1,050,000Repayment of long term finances (1,908,468) (3,036,185)Dividend Paid (1,304,406) (655,257)
Net cash used in financing activities (2,992,874) (2,641,442)
Net increase in cash and cash equivalents 1,714,751 849,836
Cash and cash equivalents at the beginning of the period (5,889,212) (7,096,955)
Cash and cash equivalents at the end of the period 14 (4,174,461) (6,247,119)
The annexed notes 1 to 17 form an integral part of this condensed interim consolidated financial information.
D.G
. Kha
n C
em
en
t Co
mp
an
y Limite
d G
rou
p3rd
Qu
arte
r 2014
Chief Executive Director
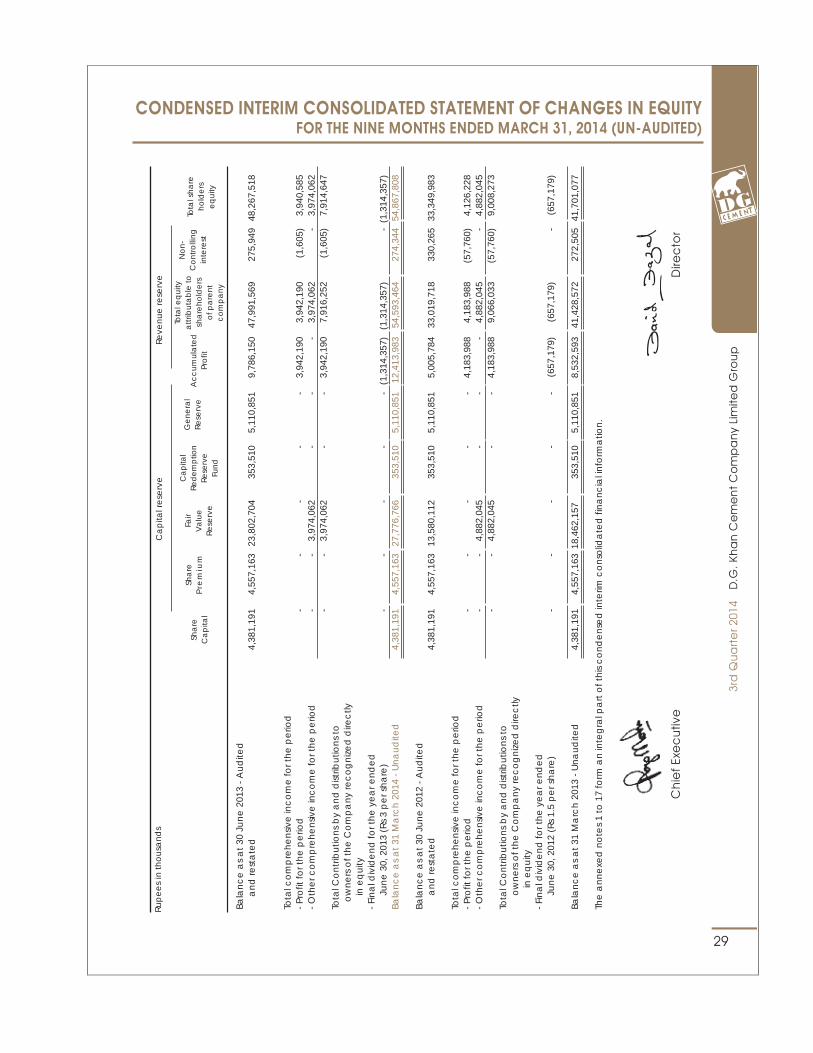
CONDENSED INTERIM CONSOLIDATED STATEMENT OF CHANGES IN EQUITYFOR THE NINE MONTHS ENDED MARCH 31, 2014 (UN-AUDITED)
29
Bala
nce
as
at
30 J
une
201
3 - A
udite
d
and
rest
ate
d
4,38
1,19
1 4,
557,
163
23,8
02,7
04
353,
510
5,11
0,85
1 9,
786,
150
47,9
91,5
69
275,
949
48,2
67,5
18
Tota
l co
mp
rehe
nsiv
e in
co
me
for t
he p
erio
d- P
rofit
for t
he p
erio
d
- -
- -
- 3,
942,
190
3,94
2,19
0 (1
,605
) 3,
940,
585
- Oth
er c
om
pre
hens
ive
inc
om
e fo
r the
pe
riod
-
- 3,
974,
062
- -
- 3,
974,
062
- 3,
974,
062
- -
3,97
4,06
2 -
- 3,
942,
190
7,91
6,25
2 (1
,605
) 7,
914,
647
Tota
l Co
ntrib
utio
ns b
y a
nd d
istrib
utio
ns t
o
o
wne
rs o
f the
Co
mp
any
rec
og
nize
d d
irec
tly
in
eq
uity
- Fin
al d
ivid
end
for t
he y
ea
r end
ed
Ju
ne 3
0, 2
013
(Rs
3 p
er s
hare
) -
- -
- -
(1,3
14,3
57)
(1,3
14,3
57)
- (1
,314
,357
)Ba
lanc
e a
s a
t 31
Ma
rch
2014
- U
naud
ited
4,
381,
191
4,55
7,16
3 27
,776
,766
35
3,51
0 5,
110,
851
12,4
13,9
83
54,5
93,4
64
274,
344
54,8
67,8
08
Bala
nce
as
at
30 J
une
201
2 - A
udite
d
and
rest
ate
d
4,38
1,19
1 4,
557,
163
13,5
80,1
12
353,
510
5,11
0,85
1 5,
005,
784
33,0
19,7
18
330,
265
33,3
49,9
83
Tota
l co
mp
rehe
nsiv
e in
co
me
for t
he p
erio
d- P
rofit
for t
he p
erio
d
- -
- -
- 4,
183,
988
4,18
3,98
8 (5
7,76
0)
4,12
6,22
8- O
the
r co
mp
rehe
nsiv
e in
co
me
for t
he p
erio
d
- -
4,88
2,04
5 -
- -
4,88
2,04
5 -
4,88
2,04
5
-
- 4,
882,
045
- -
4,18
3,98
8 9,
066,
033
(57,
760)
9,
008,
273
Tota
l Co
ntrib
utio
ns b
y a
nd d
istrib
utio
ns t
o
o
wne
rs o
f the
Co
mp
any
rec
og
nize
d d
irec
tly
in e
qui
ty- F
ina
l div
ide
nd fo
r the
ye
ar e
nde
d
Ju
ne 3
0, 2
012
(Rs
1.5
pe
r sha
re)
- -
- -
- (6
57,1
79)
(657
,179
) -
(657
,179
)
Bala
nce
as
at
31 M
arc
h 20
13 -
Una
udite
d
4,38
1,19
1 4,
557,
163
18,4
62,1
57
353,
510
5,11
0,85
1 8,
532,
593
41,4
28,5
72
272,
505
41,7
01,0
77
The
ann
exe
d n
ote
s 1
to 1
7 fo
rm a
n in
teg
ral p
art
of t
his
co
nde
nse
d in
terim
co
nso
lida
ted
fina
ncia
l inf
orm
atio
n.
Ca
pita
l re
serv
eRe
venu
e re
serv
eRu
pe
es
in th
ous
and
s
Sha
reP
rem
ium
Fair
Va
lue
Rese
rve
Ca
pita
lRe
dem
ptio
nRe
serv
eFu
nd
Ge
nera
lRe
serv
eA
cc
umul
ate
dPr
ofit
Tota
l sha
reho
lde
rs
eq
uity
Sha
reC
ap
ital
Tota
l eq
uity
attr
ibut
ab
le to
sha
reho
lde
rs
ofp
are
nt
co
mp
any
No
n-C
ont
rolli
ngin
tere
st
D.G
. Kh
an
Ce
me
nt
Co
mp
an
y Li
mite
d G
rou
p3r
d Q
ua
rte
r 201
4
Ch
ief E
xec
utiv
eD
irec
tor
NOTES TO AND FORMING PART OF THE CONDENSED INTERIM CONSOLIDATEDFINANCIAL INFORMATION FOR THE QUARTER AND NINE MONTHS ENDED MARCH 31, 2014 (UN-AUDITED)
30
1. Legal status and nature of business
The group comprises of: - D. G. Khan Cement Company Limited, the parent company; and - Nishat Paper Products Company Limited, the subsidiary company.
The parent company is a public limited company incorporated in Pakistan and is listed on Karachi, Lahore and Islamabad Stock Exchanges. It is principally engaged in production and sale of Clinker, Ordinary Portland and Sulphate Resistant Cement. The registered office of the Company is situated at 53-A Lawrence Road, Lahore.
The subsidiary company is an unlisted public limited company incorporated in Pakistan under the Companies Ordinance 1984 on July 23, 2004. It is principally engaged in manufacture and sale of paper products and packaging material.
2. Basis of preparation
This condensed interim financial information is un-audited and is being submitted to the members as required by section 245 of the Companies Ordinance, 1984. The condensed interim financial information has been prepared in accordance with the requirements of the International Accounting Standard (IAS) 34 'Interim Financial Reporting' and provisions of and directives issued under the Companies Ordinance, 1984. In case where requirements differ, the provisions of or directives issued under the Companies Ordinance, 1984 have been followed. The figures for the nine months ended March 31, 2014 have, however, been subjected to limited scope review by the auditors as required by the Code of Corporate Governance. This condensed interim financial information does not include all the information required for annual financial statements and therefore, should be read in conjunction with the annual financial statements for the year ended June 30, 2013, which have been prepared in accordance with approved accounting standards as applicable in Pakistan.
3. Significant accounting policies
3.1 The accounting policies adopted for the preparation of this condensed interim financial information are the same as those applied in the preparation of preceding annual published financial statements of the Company for the year ended June 30, 2013 except for the adoption of a new accounting policy referred to in note 3.3.1.
3.2 Initial application of standards, amendments or an interpretation to existing standards
The following amendments to existing standards have been published that are applicable to the Company’s financial statements covering annual periods, beginning on or after the following dates:
3.3 Amendments to published standards effective in current year
Certain standards, amendments and interpretations to approved accounting standards are effective for accounting periods beginning on July 01, 2013 but are considered not to be relevant or to have any significant effect on the Company’s operations and are, therefore, not detailed in this condensed interim financial
D.G
. Kha
n C
em
en
t Co
mp
an
y Limite
d G
rou
p3rd
Qu
arte
r 2014
information except for IAS 19 (Amendment), ‘Employee Benefits’. The impact of this amendment on the condensed interim financial information is as follows:
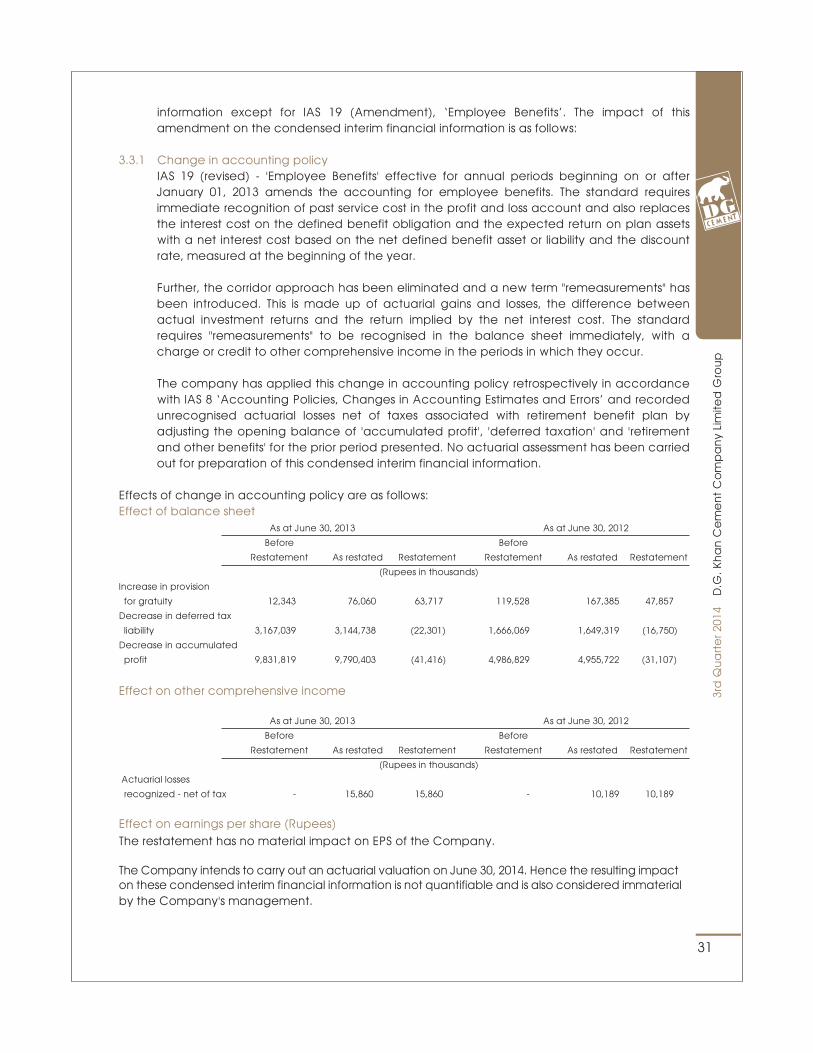
3.3.1 Change in accounting policy IAS 19 (revised) - 'Employee Benefits' effective for annual periods beginning on or after
January 01, 2013 amends the accounting for employee benefits. The standard requires immediate recognition of past service cost in the profit and loss account and also replaces the interest cost on the defined benefit obligation and the expected return on plan assets with a net interest cost based on the net defined benefit asset or liability and the discount rate, measured at the beginning of the year.
Further, the corridor approach has been eliminated and a new term "remeasurements" has been introduced. This is made up of actuarial gains and losses, the difference between actual investment returns and the return implied by the net interest cost. The standard requires "remeasurements" to be recognised in the balance sheet immediately, with a charge or credit to other comprehensive income in the periods in which they occur.
The company has applied this change in accounting policy retrospectively in accordance with IAS 8 ‘Accounting Policies, Changes in Accounting Estimates and Errors’ and recorded unrecognised actuarial losses net of taxes associated with retirement benefit plan by adjusting the opening balance of 'accumulated profit', 'deferred taxation' and 'retirement and other benefits' for the prior period presented. No actuarial assessment has been carried out for preparation of this condensed interim financial information.
Effects of change in accounting policy are as follows:Effect of balance sheet As at June 30, 2013 As at June 30, 2012
Before Before
Restatement As restated Restatement Restatement As restated Restatement
(Rupees in thousands)
Increase in provision
for gratuity 12,343 76,060 63,717 119,528 167,385 47,857
Decrease in deferred tax
liability 3,167,039 3,144,738 (22,301) 1,666,069 1,649,319 (16,750)
Decrease in accumulated
profit 9,831,819 9,790,403 (41,416) 4,986,829 4,955,722 (31,107)
Effect on other comprehensive income
As at June 30, 2013 As at June 30, 2012
Before Before
Restatement As restated Restatement Restatement As restated Restatement
(Rupees in thousands)
Actuarial losses
recognized - net of tax - 15,860 15,860 - 10,189 10,189
Effect on earnings per share (Rupees)
The restatement has no material impact on EPS of the Company. The Company intends to carry out an actuarial valuation on June 30, 2014. Hence the resulting impact on these condensed interim financial information is not quantifiable and is also considered immaterial by the Company's management.
31
D.G
. Kh
an
Ce
me
nt
Co
mp
an
y Li
mite
d G
rou
p3r
d Q
ua
rte
r 201
4
32
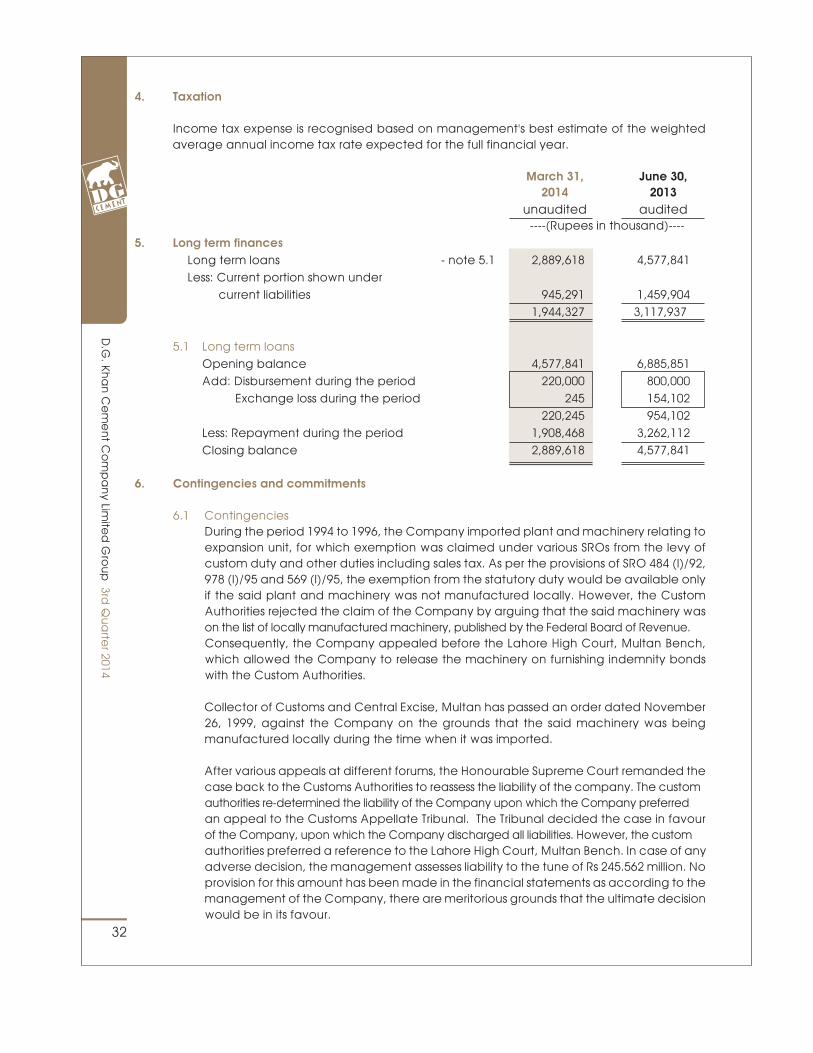
4. Taxation
Income tax expense is recognised based on management's best estimate of the weighted average annual income tax rate expected for the full financial year.
March 31, June 30, 2014 2013 unaudited audited ----(Rupees in thousand)----5. Long term finances Long term loans - note 5.1 2,889,618 4,577,841 Less: Current portion shown under current liabilities 945,291 1,459,904 1,944,327 3,117,937 5.1 Long term loans Opening balance 4,577,841 6,885,851 Add: Disbursement during the period 220,000 800,000 Exchange loss during the period 245 154,102 220,245 954,102 Less: Repayment during the period 1,908,468 3,262,112 Closing balance 2,889,618 4,577,841
6. Contingencies and commitments
6.1 Contingencies During the period 1994 to 1996, the Company imported plant and machinery relating to
expansion unit, for which exemption was claimed under various SROs from the levy of custom duty and other duties including sales tax. As per the provisions of SRO 484 (I)/92, 978 (I)/95 and 569 (I)/95, the exemption from the statutory duty would be available only if the said plant and machinery was not manufactured locally. However, the Custom Authorities rejected the claim of the Company by arguing that the said machinery was on the list of locally manufactured machinery, published by the Federal Board of Revenue. Consequently, the Company appealed before the Lahore High Court, Multan Bench, which allowed the Company to release the machinery on furnishing indemnity bonds with the Custom Authorities.
Collector of Customs and Central Excise, Multan has passed an order dated November 26, 1999, against the Company on the grounds that the said machinery was being manufactured locally during the time when it was imported.
After various appeals at different forums, the Honourable Supreme Court remanded the case back to the Customs Authorities to reassess the liability of the company. The custom authorities re-determined the liability of the Company upon which the Company preferred an appeal to the Customs Appellate Tribunal. The Tribunal decided the case in favour of the Company, upon which the Company discharged all liabilities. However, the custom authorities preferred a reference to the Lahore High Court, Multan Bench. In case of any adverse decision, the management assesses liability to the tune of Rs 245.562 million. No provision for this amount has been made in the financial statements as according to the management of the Company, there are meritorious grounds that the ultimate decision would be in its favour.
D.G
. Kha
n C
em
en
t Co
mp
an
y Limite
d G
rou
p3rd
Qu
arte
r 2014
33
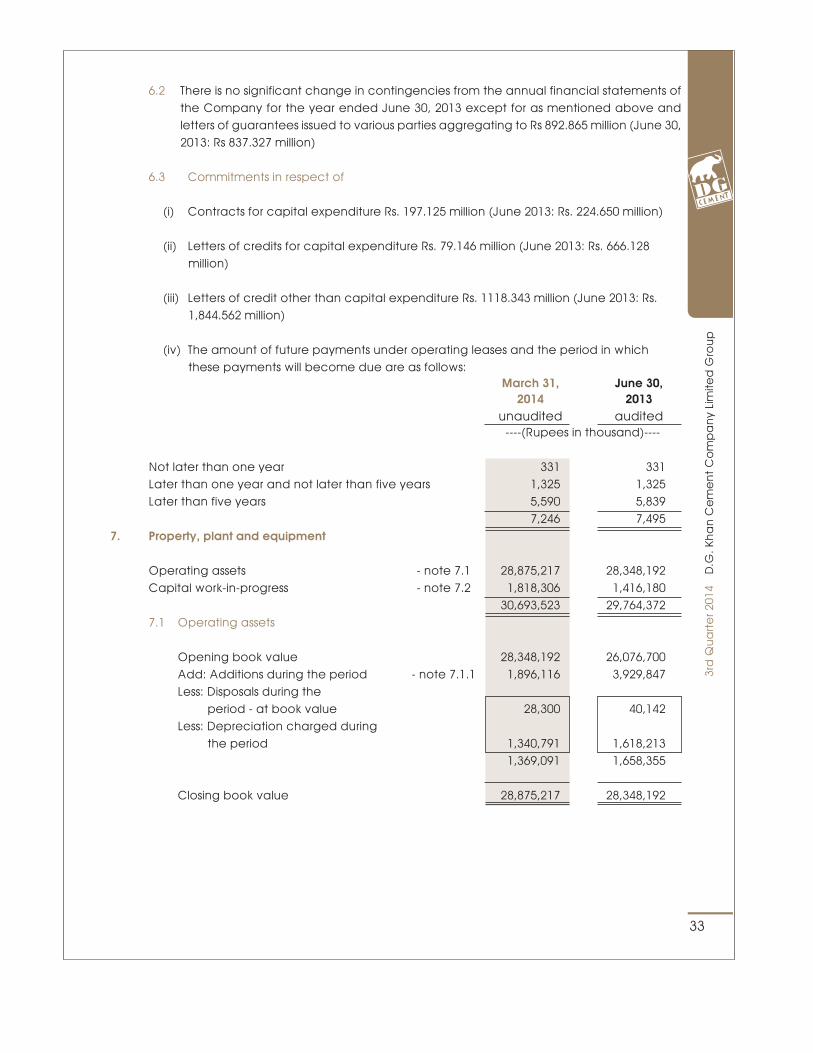
6.2 There is no significant change in contingencies from the annual financial statements of the Company for the year ended June 30, 2013 except for as mentioned above and letters of guarantees issued to various parties aggregating to Rs 892.865 million (June 30, 2013: Rs 837.327 million)
6.3 Commitments in respect of
(i) Contracts for capital expenditure Rs. 197.125 million (June 2013: Rs. 224.650 million)
(ii) Letters of credits for capital expenditure Rs. 79.146 million (June 2013: Rs. 666.128 million)
(iii) Letters of credit other than capital expenditure Rs. 1118.343 million (June 2013: Rs. 1,844.562 million)
(iv) The amount of future payments under operating leases and the period in which these payments will become due are as follows:
March 31, June 30, 2014 2013 unaudited audited ----(Rupees in thousand)----
Not later than one year 331 331 Later than one year and not later than five years 1,325 1,325 Later than five years 5,590 5,839 7,246 7,4957. Property, plant and equipment Operating assets - note 7.1 28,875,217 28,348,192 Capital work-in-progress - note 7.2 1,818,306 1,416,180 30,693,523 29,764,372 7.1 Operating assets
Opening book value 28,348,192 26,076,700 Add: Additions during the period - note 7.1.1 1,896,116 3,929,847 Less: Disposals during the period - at book value 28,300 40,142 Less: Depreciation charged during the period 1,340,791 1,618,213 1,369,091 1,658,355
Closing book value 28,875,217 28,348,192
D.G
. Kh
an
Ce
me
nt
Co
mp
an
y Li
mite
d G
rou
p3r
d Q
ua
rte
r 201
4
34
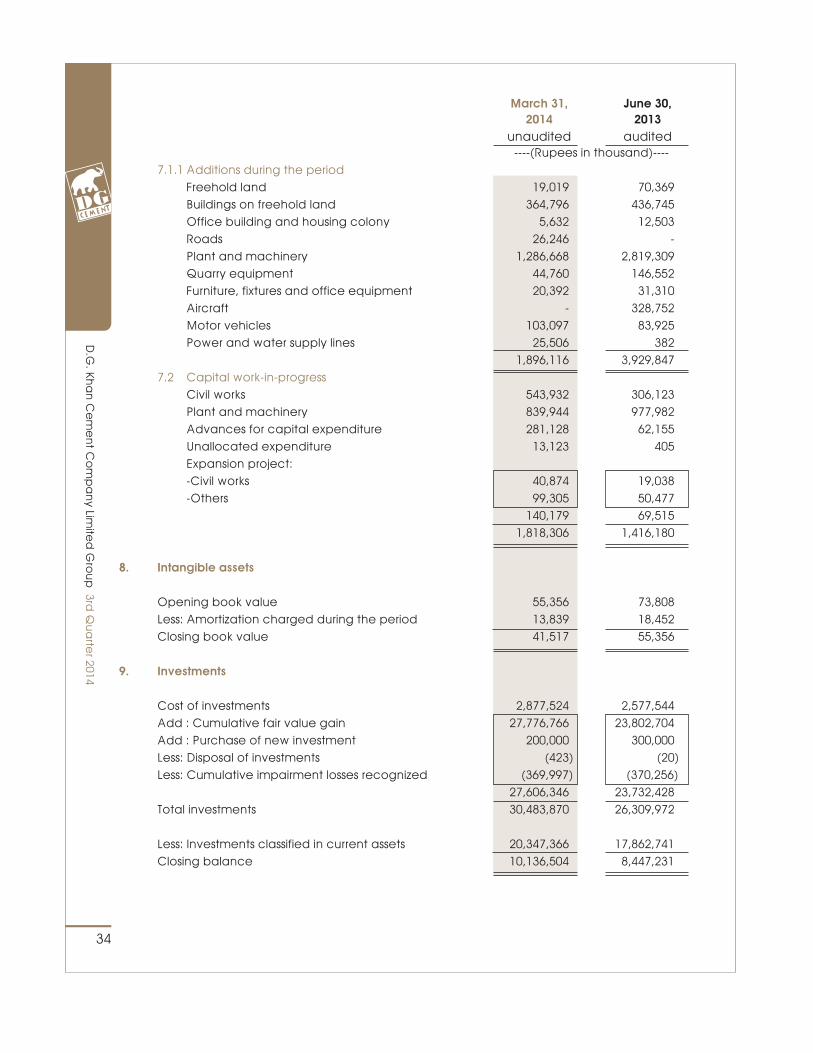
March 31, June 30, 2014 2013 unaudited audited ----(Rupees in thousand)---- 7.1.1 Additions during the period Freehold land 19,019 70,369 Buildings on freehold land 364,796 436,745 Office building and housing colony 5,632 12,503 Roads 26,246 - Plant and machinery 1,286,668 2,819,309 Quarry equipment 44,760 146,552 Furniture, fixtures and office equipment 20,392 31,310 Aircraft - 328,752 Motor vehicles 103,097 83,925 Power and water supply lines 25,506 382 1,896,116 3,929,847 7.2 Capital work-in-progress Civil works 543,932 306,123 Plant and machinery 839,944 977,982 Advances for capital expenditure 281,128 62,155 Unallocated expenditure 13,123 405 Expansion project: -Civil works 40,874 19,038 -Others 99,305 50,477 140,179 69,515 1,818,306 1,416,180
8. Intangible assets
Opening book value 55,356 73,808 Less: Amortization charged during the period 13,839 18,452 Closing book value 41,517 55,356
9. Investments
Cost of investments 2,877,524 2,577,544 Add : Cumulative fair value gain 27,776,766 23,802,704 Add : Purchase of new investment 200,000 300,000 Less: Disposal of investments (423) (20) Less: Cumulative impairment losses recognized (369,997) (370,256) 27,606,346 23,732,428 Total investments 30,483,870 26,309,972
Less: Investments classified in current assets 20,347,366 17,862,741 Closing balance 10,136,504 8,447,231
D.G
. Kha
n C
em
en
t Co
mp
an
y Limite
d G
rou
p3rd
Qu
arte
r 2014
35
D.G
. Kh
an
Ce
me
nt
Co
mp
an
y Li
mite
d G
rou
p3r
d Q
ua
rte
r 201
4
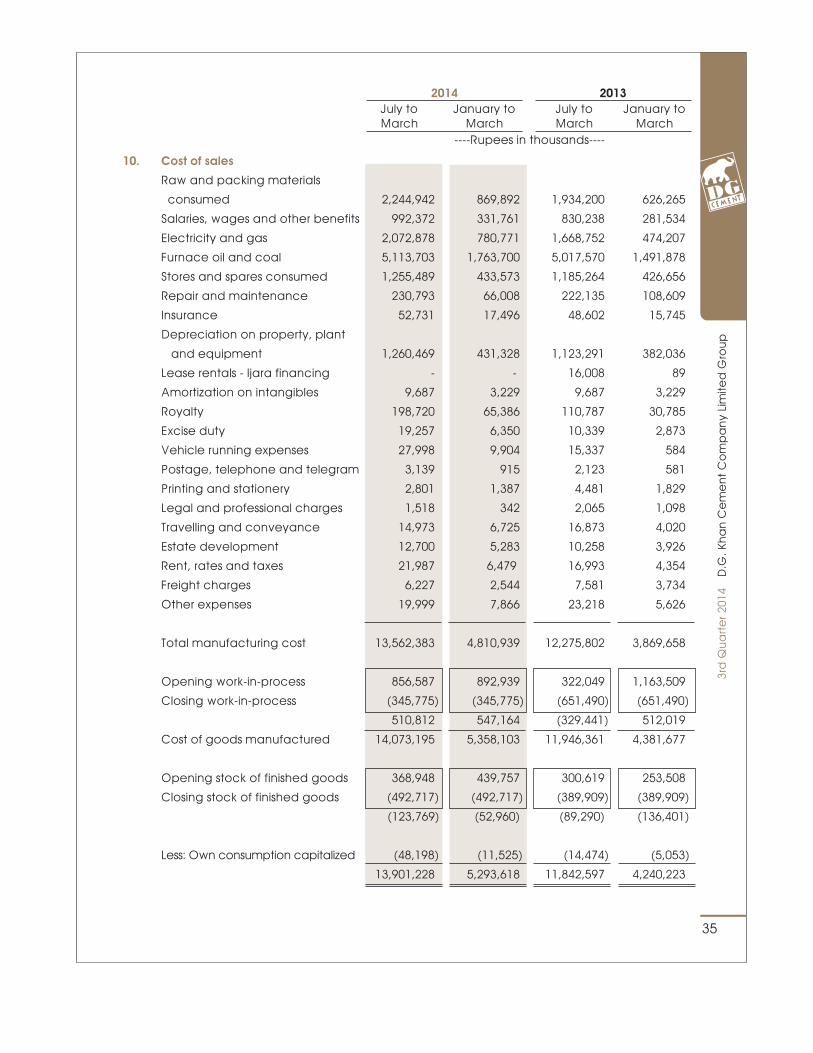
10. Cost of sales
Raw and packing materials
consumed 2,244,942 869,892 1,934,200 626,265
Salaries, wages and other benefits 992,372 331,761 830,238 281,534
Electricity and gas 2,072,878 780,771 1,668,752 474,207
Furnace oil and coal 5,113,703 1,763,700 5,017,570 1,491,878
Stores and spares consumed 1,255,489 433,573 1,185,264 426,656
Repair and maintenance 230,793 66,008 222,135 108,609
Insurance 52,731 17,496 48,602 15,745
Depreciation on property, plant
and equipment 1,260,469 431,328 1,123,291 382,036
Lease rentals - Ijara financing - - 16,008 89
Amortization on intangibles 9,687 3,229 9,687 3,229
Royalty 198,720 65,386 110,787 30,785
Excise duty 19,257 6,350 10,339 2,873
Vehicle running expenses 27,998 9,904 15,337 584
Postage, telephone and telegram 3,139 915 2,123 581
Printing and stationery 2,801 1,387 4,481 1,829
Legal and professional charges 1,518 342 2,065 1,098
Travelling and conveyance 14,973 6,725 16,873 4,020
Estate development 12,700 5,283 10,258 3,926
Rent, rates and taxes 21,987 6,479 16,993 4,354
Freight charges 6,227 2,544 7,581 3,734
Other expenses 19,999 7,866 23,218 5,626
Total manufacturing cost 13,562,383 4,810,939 12,275,802 3,869,658
Opening work-in-process 856,587 892,939 322,049 1,163,509
Closing work-in-process (345,775) (345,775) (651,490) (651,490)
510,812 547,164 (329,441) 512,019
Cost of goods manufactured 14,073,195 5,358,103 11,946,361 4,381,677
Opening stock of finished goods 368,948 439,757 300,619 253,508
Closing stock of finished goods (492,717) (492,717) (389,909) (389,909)
(123,769) (52,960) (89,290) (136,401)
Less: Own consumption capitalized (48,198) (11,525) (14,474) (5,053)
13,901,228 5,293,618 11,842,597 4,240,223
----Rupees in thousands----
July to March
January to March
July to March
January to March
20132014
36
D.G
. Kha
n C
em
en
t Co
mp
an
y Limite
d G
rou
p3rd
Qu
arte
r 2014
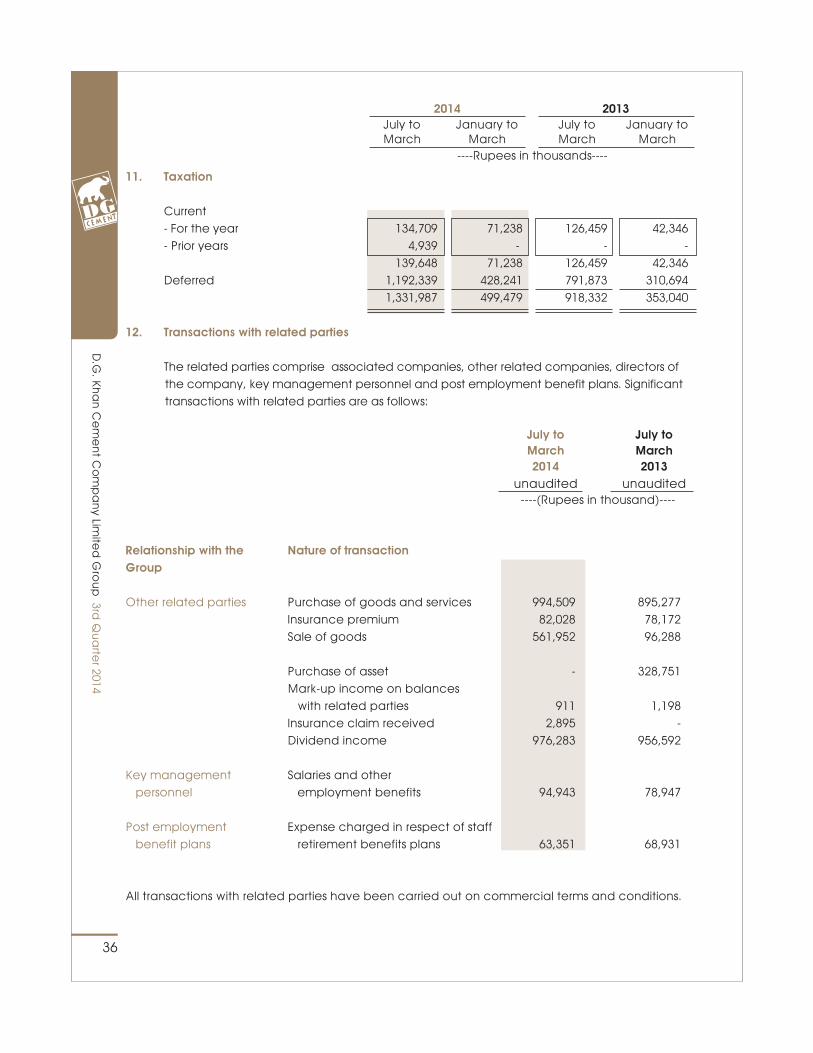
11. Taxation
Current - For the year 134,709 71,238 126,459 42,346 - Prior years 4,939 - - - 139,648 71,238 126,459 42,346 Deferred 1,192,339 428,241 791,873 310,694 1,331,987 499,479 918,332 353,040 12. Transactions with related parties
The related parties comprise associated companies, other related companies, directors of the company, key management personnel and post employment benefit plans. Significant transactions with related parties are as follows:
July to July to March March 2014 2013 unaudited unaudited ----(Rupees in thousand)----
Relationship with the Nature of transactionGroup
Other related parties Purchase of goods and services 994,509 895,277 Insurance premium 82,028 78,172 Sale of goods 561,952 96,288
Purchase of asset - 328,751 Mark-up income on balances with related parties 911 1,198 Insurance claim received 2,895 - Dividend income 976,283 956,592
Key management Salaries and other personnel employment benefits 94,943 78,947
Post employment Expense charged in respect of staff benefit plans retirement benefits plans 63,351 68,931
All transactions with related parties have been carried out on commercial terms and conditions.
----Rupees in thousands----
July to March
January toMarch
July to March
January toMarch
20132014
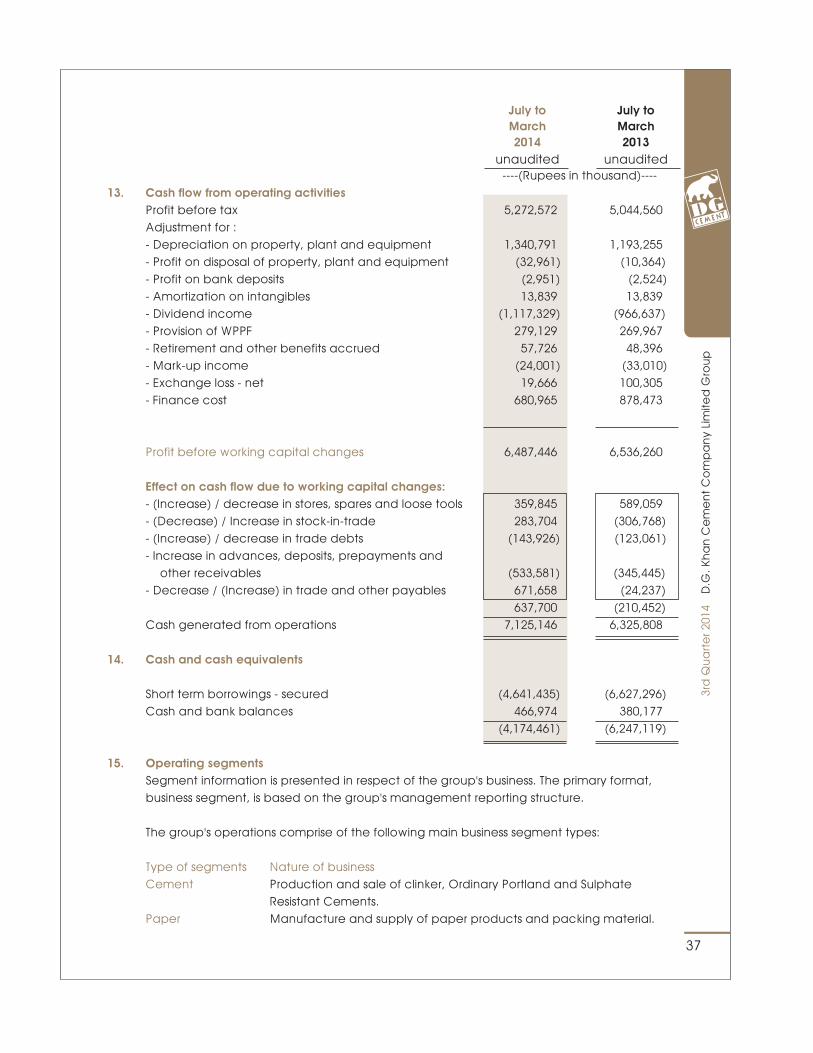
July to July to March March 2014 2013 unaudited unaudited ----(Rupees in thousand)----13. Cash flow from operating activities Profit before tax 5,272,572 5,044,560 Adjustment for : - Depreciation on property, plant and equipment 1,340,791 1,193,255 - Profit on disposal of property, plant and equipment (32,961) (10,364) - Profit on bank deposits (2,951) (2,524) - Amortization on intangibles 13,839 13,839 - Dividend income (1,117,329) (966,637) - Provision of WPPF 279,129 269,967 - Retirement and other benefits accrued 57,726 48,396 - Mark-up income (24,001) (33,010) - Exchange loss - net 19,666 100,305 - Finance cost 680,965 878,473
Profit before working capital changes 6,487,446 6,536,260
Effect on cash flow due to working capital changes: - (Increase) / decrease in stores, spares and loose tools 359,845 589,059 - (Decrease) / Increase in stock-in-trade 283,704 (306,768) - (Increase) / decrease in trade debts (143,926) (123,061) - Increase in advances, deposits, prepayments and other receivables (533,581) (345,445) - Decrease / (Increase) in trade and other payables 671,658 (24,237) 637,700 (210,452) Cash generated from operations 7,125,146 6,325,808
14. Cash and cash equivalents
Short term borrowings - secured (4,641,435) (6,627,296) Cash and bank balances 466,974 380,177 (4,174,461) (6,247,119)
15. Operating segments Segment information is presented in respect of the group's business. The primary format, business segment, is based on the group's management reporting structure.
The group's operations comprise of the following main business segment types:
Type of segments Nature of business Cement Production and sale of clinker, Ordinary Portland and Sulphate Resistant Cements. Paper Manufacture and supply of paper products and packing material.
37
D.G
. Kh
an
Ce
me
nt
Co
mp
an
y Li
mite
d G
rou
p3r
d Q
ua
rte
r 201
4
38
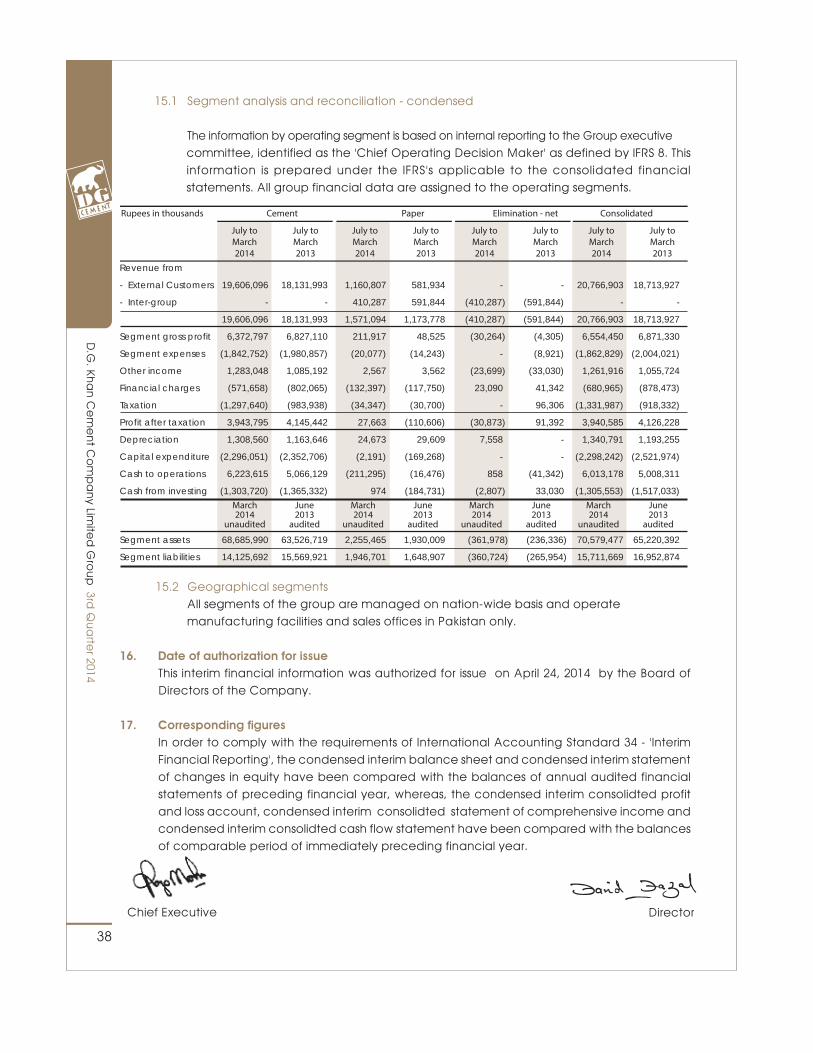
15.1 Segment analysis and reconciliation - condensed
The information by operating segment is based on internal reporting to the Group executive committee, identified as the 'Chief Operating Decision Maker' as defined by IFRS 8. This information is prepared under the IFRS's applicable to the consolidated financial statements. All group financial data are assigned to the operating segments.
D.G
. Kha
n C
em
en
t Co
mp
an
y Limite
d G
rou
p3rd
Qu
arte
r 2014
15.2 Geographical segments All segments of the group are managed on nation-wide basis and operate
manufacturing facilities and sales offices in Pakistan only. 16. Date of authorization for issue This interim financial information was authorized for issue on April 24, 2014 by the Board of
Directors of the Company.
17. Corresponding figures In order to comply with the requirements of International Accounting Standard 34 - 'Interim
Financial Reporting', the condensed interim balance sheet and condensed interim statement of changes in equity have been compared with the balances of annual audited financial statements of preceding financial year, whereas, the condensed interim consolidted profit and loss account, condensed interim consolidted statement of comprehensive income and condensed interim consolidted cash flow statement have been compared with the balances of comparable period of immediately preceding financial year.
Rupees in thousands
Cement
Paper
Elimination - net
Consolidated
July toMarch2014
July toMarch2013
March2014
unaudited
June2013
audited
July toMarch2014
July toMarch2013
July toMarch2014
July toMarch2013
July toMarch2014
July toMarch2013
Revenue from
- External Customers 19,606,096 18,131,993 1,160,807 581,934 - - 20,766,903 18,713,927
- Inter-group - - 410,287 591,844 (410,287) (591,844) - -
19,606,096 18,131,993 1,571,094 1,173,778 (410,287) (591,844) 20,766,903 18,713,927
Segment gross profit 6,372,797 6,827,110 211,917 48,525 (30,264) (4,305) 6,554,450 6,871,330
Segment expenses (1,842,752) (1,980,857) (20,077) (14,243) - (8,921) (1,862,829) (2,004,021)
Other income 1,283,048 1,085,192 2,567 3,562 (23,699) (33,030) 1,261,916 1,055,724
Financial charges (571,658) (802,065) (132,397) (117,750) 23,090 41,342 (680,965) (878,473)
Taxation (1,297,640) (983,938) (34,347) (30,700) - 96,306 (1,331,987) (918,332)
Profit after taxation 3,943,795 4,145,442 27,663 (110,606) (30,873) 91,392 3,940,585 4,126,228
Depreciation 1,308,560 1,163,646 24,673 29,609 7,558 - 1,340,791 1,193,255
Capital expenditure (2,296,051) (2,352,706) (2,191) (169,268) - - (2,298,242) (2,521,974)
Cash to operations 6,223,615 5,066,129 (211,295) (16,476) 858 (41,342) 6,013,178 5,008,311
Cash from investing (1,303,720) (1,365,332) 974 (184,731) (2,807) 33,030 (1,305,553) (1,517,033)
Segment assets 68,685,990 63,526,719 2,255,465 1,930,009 (361,978) (236,336) 70,579,477 65,220,392
Segment liabilities 14,125,692 15,569,921 1,946,701 1,648,907 (360,724) (265,954) 15,711,669 16,952,874
March2014
unaudited
June2013
audited
March2014
unaudited
June2013
audited
March2014
unaudited
June2013
audited
Chief Executive Director
39
D.G
. Kh
an
Ce
me
nt
Co
mp
an
y Li
mite
d G
rou
p3r
d Q
ua
rte
r 201
4
Notes
40
D.G
. Kha
n C
em
en
t Co
mp
an
y Limite
d G
rou
p3rd
Qu
arte
r 2014
Notes

Nishat House, 53-A, Lawrence Road, Lahore-Pakistan.UAN:+92-42-111-11-33-33
D.G. KHAN CEMENT COMPANY LIMITED
VE
RS
AT
ILE
P
h: +
92 4
2 37
12 1
920