3_mgr_countrypaper%20_cambodia
TRANSCRIPT
i
SOUTH-SOUTH ECONOMIC COOPERATION EXPLORING MEKONG-GANGA RELATIONSHIP
Country Paper
Trade and Investment between Cambodia
and India
Prepared by Neak Samsen & Ouk Chansopheap
September, 2005
Supported by
ii
TABLE OF CONTENTS
Page
1. Introduction............................................................................................. 1
2. External Trade and Inward Investment of Cambodia............................... 2
2.1 External Trade ...................................................................................... 2
2.1.1 Direction of Trade ............................................................................. 2
2.1.2 Composition of Trade ....................................................................... 4
2.2 Inward FDI ........................................................................................... 6
2.2.1 Sending Countries.............................................................................. 6
2.2.2 Distribution of FDI ........................................................................... 7
3. External Trade and Outward Investment of India ................................... 8
3.1 External Trade ...................................................................................... 8
3.2 Destination of Outward FDI................................................................ 11
3.3 Composition of Outward FDI ............................................................. 12
4. Trade and Investment Relationships between Cambodia and India.......... 13
4.1 Historical Background.......................................................................... 13
4.2 Recent Relationship .............................................................................. 14
4.2.1 Trade Agreement between Cambodia and India............................... 14
4.2.2 Visit of Indian Prime Minister in 2002 .............................................. 15
4.2.3 The Look East Policy and South-South Economic Cooperation ..... 15
4.2.4 Volume of Trade................................................................................ 16
4.2.5 Composition of Trade ....................................................................... 18
4.2.6 Indian Investment in Cambodia ........................................................ 19
5. Prospects for Trade and Investment Relations between Cambodia
and India .................................................................................................. 20
5.1 Prospects for Trade Expansion......................................................................... 20
5.2 Areas of Trade Expansion ................................................................................ 22
5.3 Prospects for Investment Expansion ................................................................ 22
5.4 Areas of Investment Expansion........................................................................ 24
5.5 Ways to Promote Trade and Investment ......................................................... 24
6. Conclusion ............................................................................................... 23
iii
LIST OF TABLES
Page Table 1: Top Ten Export Partners of Cambodia, 1995-2004................................. 3
Table 2: Top Ten Import Partners of Cambodia, 1995-2004 ................................ 3
Table 3: Composition of Cambodian Trade, 1999-2002........................................ 5
Table 4: Approved FDI Flow in Cambodia by Origin, 2000-2004 ....................... 6
Table 5: Top Ten Investing Countries, 2004 ......................................................... 7
Table 6: Distribution of FDI Flow to Cambodia, 2000-2004 ................................ 8
Table 7: Comparison of Export and Import Growth of India and China ............ 8
Table 8: Top 10 Export Partners of India, 1995-2003............................................ 9
Table 9: Top 10 Import Partners of India, 1995-2003............................................ 10
Table 10: Top 10 Recipient Countries, 2003 ......................................................... 12
Table 11: Distribution of Indian Outward Investment by Sector, 1999-2004....... 13
Table 12: Cambodia-India Trade during Cambodia’s Central Planning
Economy and Partly Free Market Economy, 1981-1994....................... 14
Table 13: Cambodia – India Trade, 1995-2004....................................................... 17
Table 14: Top 20 Trading Partners, 2004............................................................... 17
Table 15: Composition of Cambodia Exports to India ......................................... 18
Table 16: Composition of India Exports to Cambodia ......................................... 19
Table 17: Leading Indian Industries and Cambodian Import Demand................. 21
iv
LIST OF FIGURES AND BOX
Page
Figure 1: India Exports, 1999-2002......................................................................... 8
Figure 2: China Exports, 1999-2002 ....................................................................... 8
Figure 3: India Imports, 1999-2002......................................................................... 10
Figure 4: China Imports, 1999-2002....................................................................... 10
Figure 5: India Trade Deficit, 1999-2002................................................................ 11
Figure 6: India Trade Surplus, 1999-2002............................................................... 11
Box 1: Prospects for and Areas of Trade and Investment Expansion,
Cambodia-India .......................................................................................... 23
1
1. Introduction
In terms of population, India is the second largest country in the world after China.
India’s economy has performed well in recent years after the country introduced a wide range
of reforms starting in 1991 to open and deregulate. The economy grew sharply, reaching 8
percent in 2003, following the average of 4.6 percent growth in the period 2000-2002. It is
widely anticipated that “Geese” China and India are going to surpass Japan to stand just
behind only the Unites States by 2050. For instances such studies are conducted by Morgan
and Wilson and Purushothaman in 2003 (Sen et. al, 2004). Moreover, India has been taking a
lead to improve cooperation between Southern and Southern countries after experiencing
hard fight with Northern countries. For example, recent “Look East Policy” of India
emphasizes closer link to countries in the Mekong region. Therefore, it is necessary for
Cambodia, which has long been a close friend of India, to investigate this evolvement. But,
until now there is no study on such relationship, in particular on economic relation between
the two countries.
Hence, this study examines the economic link, trade and investment, between
Cambodia and India. It focuses on two main objectives. First, it intends to explore the past
and current relationship between Cambodia and India. Secondly, it will explore a number of
potential areas in which the relationship between the two countries should be boosted to
enhance economic cooperation.
Due to its exploratory nature, this analysis depends upon secondary data and a small
sample size of stakeholder perceptions survey.1 However, collecting the necessary information
1 Stakeholders were determined based on his or her familiarity with issues on trade and investment between Cambodia and India. Stakeholders were thus identified as members of the business community in the fields of pharmaceuticals, IT and garment manufacturing; and representatives from government agencies, research institutes, universities and NGOs. Sample participants are as follows: six high-ranking university administrators (20%); four top-level managers of garment factories (15%); six general managers of pharmaceutical import companies (15%); six top level managers of IT companies (20%); two officials from the Ministry of Commerce; one representative from Embassy of India; one representative from Cambodia Chamber of Commerce; one
2
benefits greatly from various key sources such as the Ministry of Commerce of Cambodia,
Cambodian Investment Board of the Council for the Development of Cambodia, Phnom
Penh Chamber of Commerce, Ministry of Foreign Affairs of Cambodia, International
Monetary Fund, World Bank, United Nations Conference on Trade and Development
(UNCTAD) and the Embassy of India in Cambodia. And, field survey gained a lot of crucial
perceptions from those who has knowledge and/or experience about relations between the
two countries.
To examine economic relationship, the paper is organized as follows. Section two
describes the external trade of and inward investment to Cambodia. It also emphasizes trade
and investment policies of Cambodia. Section three provides information on external trade
and outward FDI from India. Section four outlines the economic cooperation between two
countries. Section five explores the future prospects for the two countries, and section six
draws concluding remarks.
2. External Trade and Inward Investment of Cambodia
2.1 External Trade
2.1.1 Direction of Trade
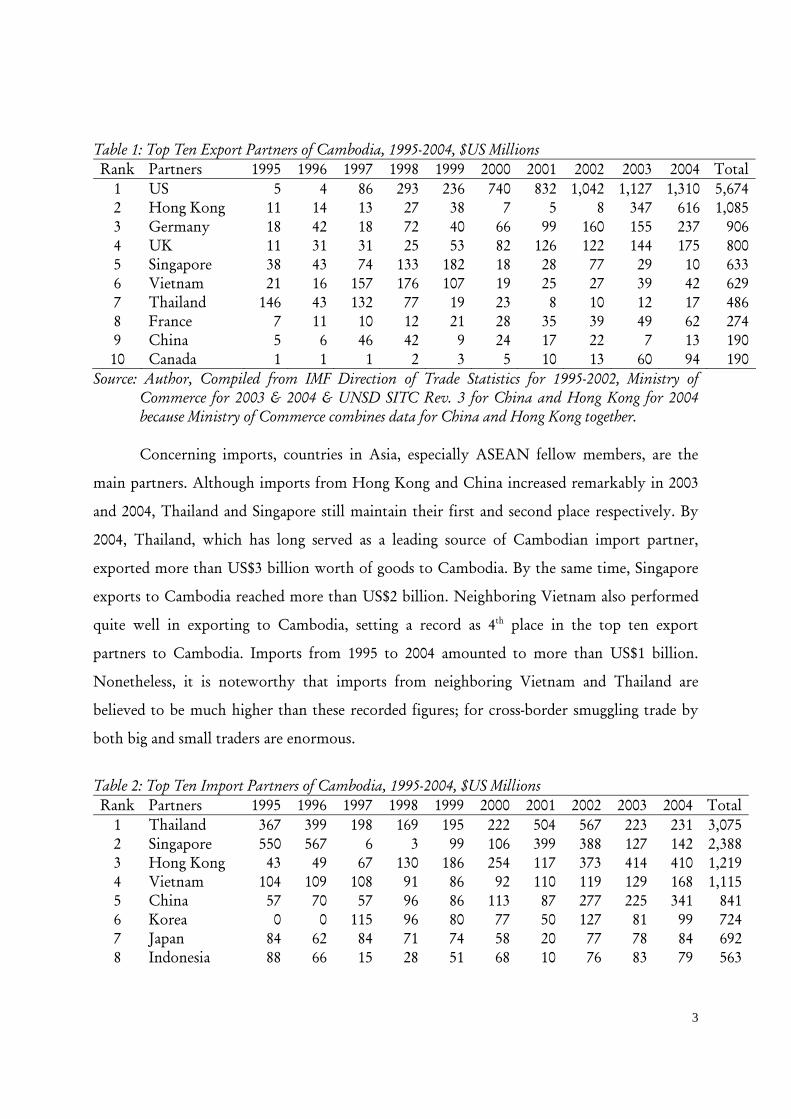
In terms of export accumulation, the United States has remained the first destination
of Cambodian exports for the 1995-2004 period. Exports to the US started increasing in 1998
when export figures were recorded at nearly US$300 million, then jumped to more than US$
1 billion annually after 2001. Hong Kong, which had absorbed few exports from Cambodia
prior to 2002, came in second due to a sudden export rise in 2003 and 2004. Germany was
ranked third, replacing Singapore, due to growing German demand for Cambodian exports of
apparel and footwear products during last three years.
representative from the Cambodian Investment Board; one representative from Indian trading company; one representative from the NGO community; and one representative from research institute (25%).
3
Table 1: Top Ten Export Partners of Cambodia, 1995-2004, $US Millions Rank Partners 1995 1996 1997 1998 1999 2000 2001 2002 2003 2004 Total
1 US 5 4 86 293 236 740 832 1,042 1,127 1,310 5,674 2 Hong Kong 11 14 13 27 38 7 5 8 347 616 1,085 3 Germany 18 42 18 72 40 66 99 160 155 237 906 4 UK 11 31 31 25 53 82 126 122 144 175 800 5 Singapore 38 43 74 133 182 18 28 77 29 10 633 6 Vietnam 21 16 157 176 107 19 25 27 39 42 629 7 Thailand 146 43 132 77 19 23 8 10 12 17 486 8 France 7 11 10 12 21 28 35 39 49 62 274 9 China 5 6 46 42 9 24 17 22 7 13 190 10 Canada 1 1 1 2 3 5 10 13 60 94 190
Source: Author, Compiled from IMF Direction of Trade Statistics for 1995-2002, Ministry of Commerce for 2003 & 2004 & UNSD SITC Rev. 3 for China and Hong Kong for 2004 because Ministry of Commerce combines data for China and Hong Kong together. Concerning imports, countries in Asia, especially ASEAN fellow members, are the
main partners. Although imports from Hong Kong and China increased remarkably in 2003
and 2004, Thailand and Singapore still maintain their first and second place respectively. By
2004, Thailand, which has long served as a leading source of Cambodian import partner,
exported more than US$3 billion worth of goods to Cambodia. By the same time, Singapore
exports to Cambodia reached more than US$2 billion. Neighboring Vietnam also performed
quite well in exporting to Cambodia, setting a record as 4th place in the top ten export
partners to Cambodia. Imports from 1995 to 2004 amounted to more than US$1 billion.
Nonetheless, it is noteworthy that imports from neighboring Vietnam and Thailand are
believed to be much higher than these recorded figures; for cross-border smuggling trade by
both big and small traders are enormous.
Table 2: Top Ten Import Partners of Cambodia, 1995-2004, $US Millions Rank Partners 1995 1996 1997 1998 1999 2000 2001 2002 2003 2004 Total
1 Thailand 367 399 198 169 195 222 504 567 223 231 3,075 2 Singapore 550 567 6 3 99 106 399 388 127 142 2,388 3 Hong Kong 43 49 67 130 186 254 117 373 414 410 1,219 4 Vietnam 104 109 108 91 86 92 110 119 129 168 1,115 5 China 57 70 57 96 86 113 87 277 225 341 841 6 Korea 0 0 115 96 80 77 50 127 81 99 724 7 Japan 84 62 84 71 74 58 20 77 78 84 692 8 Indonesia 88 66 15 28 51 68 10 76 83 79 563
4
9 Malaysia 85 58 1 1 50 64 19 60 78 77 494 10 France 67 53 41 41 42 39 13 63 38 45 441
Source: The Same as Table 1.
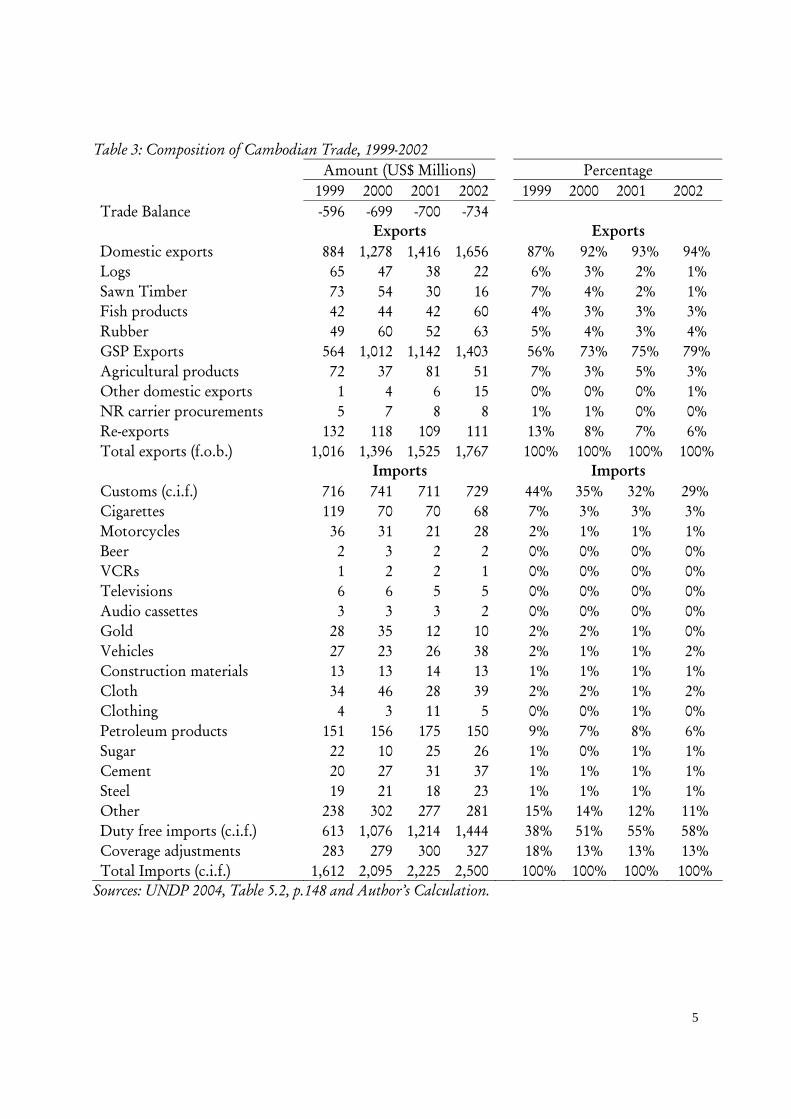
2.1.2 Composition of Trade
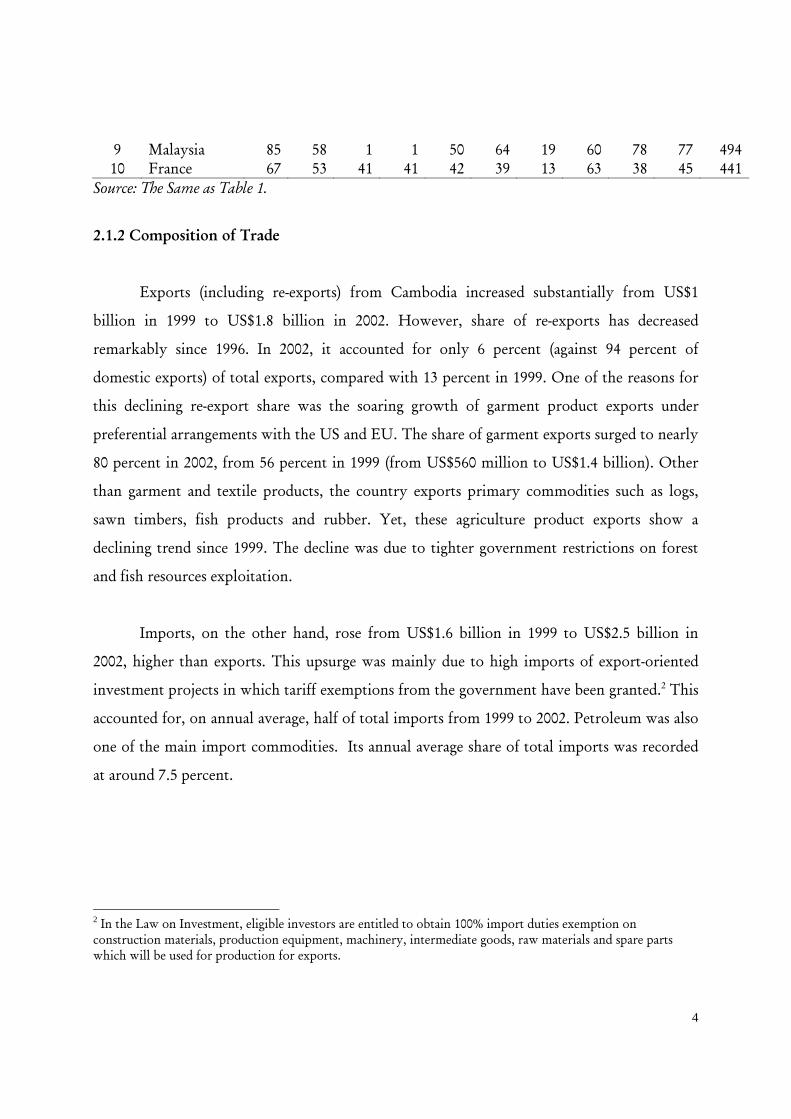
Exports (including re-exports) from Cambodia increased substantially from US$1
billion in 1999 to US$1.8 billion in 2002. However, share of re-exports has decreased
remarkably since 1996. In 2002, it accounted for only 6 percent (against 94 percent of
domestic exports) of total exports, compared with 13 percent in 1999. One of the reasons for
this declining re-export share was the soaring growth of garment product exports under
preferential arrangements with the US and EU. The share of garment exports surged to nearly
80 percent in 2002, from 56 percent in 1999 (from US$560 million to US$1.4 billion). Other
than garment and textile products, the country exports primary commodities such as logs,
sawn timbers, fish products and rubber. Yet, these agriculture product exports show a
declining trend since 1999. The decline was due to tighter government restrictions on forest
and fish resources exploitation.
Imports, on the other hand, rose from US$1.6 billion in 1999 to US$2.5 billion in
2002, higher than exports. This upsurge was mainly due to high imports of export-oriented
investment projects in which tariff exemptions from the government have been granted.2 This
accounted for, on annual average, half of total imports from 1999 to 2002. Petroleum was also
one of the main import commodities. Its annual average share of total imports was recorded
at around 7.5 percent.
2 In the Law on Investment, eligible investors are entitled to obtain 100% import duties exemption on construction materials, production equipment, machinery, intermediate goods, raw materials and spare parts which will be used for production for exports.
5
Table 3: Composition of Cambodian Trade, 1999-2002 Amount (US$ Millions) Percentage 1999 2000 2001 2002 1999 2000 2001 2002 Trade Balance -596 -699 -700 -734 Exports Exports Domestic exports 884 1,278 1,416 1,656 87% 92% 93% 94% Logs 65 47 38 22 6% 3% 2% 1% Sawn Timber 73 54 30 16 7% 4% 2% 1% Fish products 42 44 42 60 4% 3% 3% 3% Rubber 49 60 52 63 5% 4% 3% 4% GSP Exports 564 1,012 1,142 1,403 56% 73% 75% 79% Agricultural products 72 37 81 51 7% 3% 5% 3% Other domestic exports 1 4 6 15 0% 0% 0% 1% NR carrier procurements 5 7 8 8 1% 1% 0% 0% Re-exports 132 118 109 111 13% 8% 7% 6% Total exports (f.o.b.) 1,016 1,396 1,525 1,767 100% 100% 100% 100% Imports Imports Customs (c.i.f.) 716 741 711 729 44% 35% 32% 29% Cigarettes 119 70 70 68 7% 3% 3% 3% Motorcycles 36 31 21 28 2% 1% 1% 1% Beer 2 3 2 2 0% 0% 0% 0% VCRs 1 2 2 1 0% 0% 0% 0% Televisions 6 6 5 5 0% 0% 0% 0% Audio cassettes 3 3 3 2 0% 0% 0% 0% Gold 28 35 12 10 2% 2% 1% 0% Vehicles 27 23 26 38 2% 1% 1% 2% Construction materials 13 13 14 13 1% 1% 1% 1% Cloth 34 46 28 39 2% 2% 1% 2% Clothing 4 3 11 5 0% 0% 1% 0% Petroleum products 151 156 175 150 9% 7% 8% 6% Sugar 22 10 25 26 1% 0% 1% 1% Cement 20 27 31 37 1% 1% 1% 1% Steel 19 21 18 23 1% 1% 1% 1% Other 238 302 277 281 15% 14% 12% 11% Duty free imports (c.i.f.) 613 1,076 1,214 1,444 38% 51% 55% 58% Coverage adjustments 283 279 300 327 18% 13% 13% 13% Total Imports (c.i.f.) 1,612 2,095 2,225 2,500 100% 100% 100% 100%
Sources: UNDP 2004, Table 5.2, p.148 and Author’s Calculation.
6
2.2 Inward FDI
2.2.1 Sending Countries
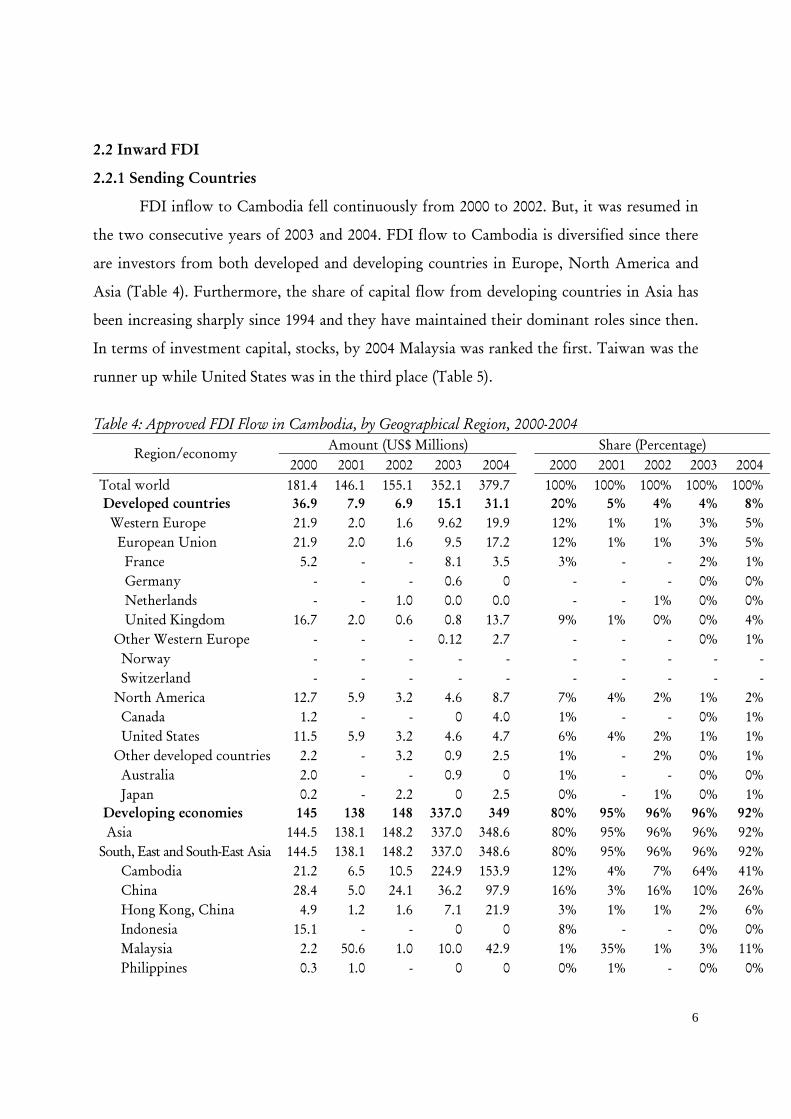
FDI inflow to Cambodia fell continuously from 2000 to 2002. But, it was resumed in
the two consecutive years of 2003 and 2004. FDI flow to Cambodia is diversified since there
are investors from both developed and developing countries in Europe, North America and
Asia (Table 4). Furthermore, the share of capital flow from developing countries in Asia has
been increasing sharply since 1994 and they have maintained their dominant roles since then.
In terms of investment capital, stocks, by 2004 Malaysia was ranked the first. Taiwan was the
runner up while United States was in the third place (Table 5).
Table 4: Approved FDI Flow in Cambodia, by Geographical Region, 2000-2004
Amount (US$ Millions) Share (Percentage) Region/economy 2000 2001 2002 2003 2004 2000 2001 2002 2003 2004
Total world 181.4 146.1 155.1 352.1 379.7 100% 100% 100% 100% 100% Developed countries 36.9 7.9 6.9 15.1 31.1 20% 5% 4% 4% 8% Western Europe 21.9 2.0 1.6 9.62 19.9 12% 1% 1% 3% 5% European Union 21.9 2.0 1.6 9.5 17.2 12% 1% 1% 3% 5% France 5.2 - - 8.1 3.5 3% - - 2% 1% Germany - - - 0.6 0 - - - 0% 0% Netherlands - - 1.0 0.0 0.0 - - 1% 0% 0% United Kingdom 16.7 2.0 0.6 0.8 13.7 9% 1% 0% 0% 4% Other Western Europe - - - 0.12 2.7 - - - 0% 1% Norway - - - - - - - - - - Switzerland - - - - - - - - - - North America 12.7 5.9 3.2 4.6 8.7 7% 4% 2% 1% 2% Canada 1.2 - - 0 4.0 1% - - 0% 1% United States 11.5 5.9 3.2 4.6 4.7 6% 4% 2% 1% 1% Other developed countries 2.2 - 3.2 0.9 2.5 1% - 2% 0% 1% Australia 2.0 - - 0.9 0 1% - - 0% 0% Japan 0.2 - 2.2 0 2.5 0% - 1% 0% 1% Developing economies 145 138 148 337.0 349 80% 95% 96% 96% 92% Asia 144.5 138.1 148.2 337.0 348.6 80% 95% 96% 96% 92% South, East and South-East Asia 144.5 138.1 148.2 337.0 348.6 80% 95% 96% 96% 92% Cambodia 21.2 6.5 10.5 224.9 153.9 12% 4% 7% 64% 41% China 28.4 5.0 24.1 36.2 97.9 16% 3% 16% 10% 26% Hong Kong, China 4.9 1.2 1.6 7.1 21.9 3% 1% 1% 2% 6% Indonesia 15.1 - - 0 0 8% - - 0% 0% Malaysia 2.2 50.6 1.0 10.0 42.9 1% 35% 1% 3% 11% Philippines 0.3 1.0 - 0 0 0% 1% - 0% 0%
7
Republic of Korea 19.4 2.1 79.0 4.0 8.9 11% 1% 51% 1% 2% Singapore 8.1 - 1.0 6.8 5.9 4% - 1% 2% 2% Taiwan Province of China 18.9 57.0 6.8 35.3 15.6 10% 39% 4% 10% 4% Thailand 26.0 14.7 - 12.7 1.6 14% 10% - 4% 0% Viet Nam - - 24.2 0 0 - - 16% 0% 0%
Sources: UNCTAD FDI Database for 2000-2002 & CDC Provided Data for 2003 & 2004 and Author’s Calculation. Table 5: Top 10 Investing Countries, 2004
Rank Region/economy FDI stock (US$ Millions) Share 1 Malaysia 1,916.1 31.3% 2 Taiwan Province of China 552.0 9.0% 3 United States 446.8 7.3% 4 China 426.6 7.0% 5 Republic of Korea 300.7 4.9% 6 Hong Kong, China 266.0 4.3% 7 Singapore 238.3 3.9% 8 Thailand 213.0 3.5% 9 France 204.4 3.3% 10 United Kingdom 109.2 1.8%
Source: Author’s Calculation Based on Data in Table 4.
2.2.2 Distribution of FDI
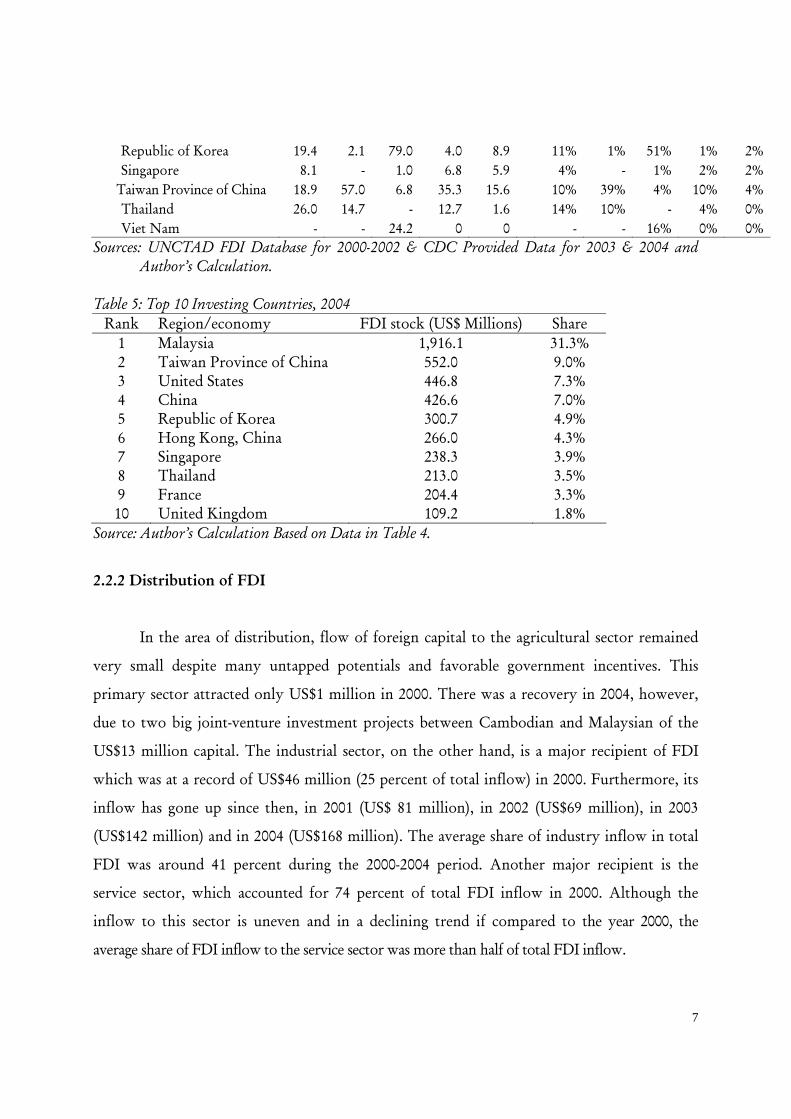
In the area of distribution, flow of foreign capital to the agricultural sector remained
very small despite many untapped potentials and favorable government incentives. This
primary sector attracted only US$1 million in 2000. There was a recovery in 2004, however,
due to two big joint-venture investment projects between Cambodian and Malaysian of the
US$13 million capital. The industrial sector, on the other hand, is a major recipient of FDI
which was at a record of US$46 million (25 percent of total inflow) in 2000. Furthermore, its
inflow has gone up since then, in 2001 (US$ 81 million), in 2002 (US$69 million), in 2003
(US$142 million) and in 2004 (US$168 million). The average share of industry inflow in total
FDI was around 41 percent during the 2000-2004 period. Another major recipient is the
service sector, which accounted for 74 percent of total FDI inflow in 2000. Although the
inflow to this sector is uneven and in a declining trend if compared to the year 2000, the
average share of FDI inflow to the service sector was more than half of total FDI inflow.
8
Table 6: Distribution of FDI Flow to Cambodia, 2000-2004. Amount (US$ Millions) Percentage 2000 2001 2002 2003 2004 2000 2001 2002 2003 2004 Total FDI inflow 181.4 146.1 155.1 351.7 378.6 100% 100% 100% 100% 100% Primary 1.3 .. .. 0 13.3 1% .. .. 0% 4% Secondary 46.1 80.7 68.9 141.6 167.9 25% 55% 44% 40% 44% Tertiary 134.1 65.3 86.2 210.1 197.4 74% 45% 56% 60% 52%
Source: The Same as Table 4.
3 External Trade and Outward Investment of India
3.1 External Trade
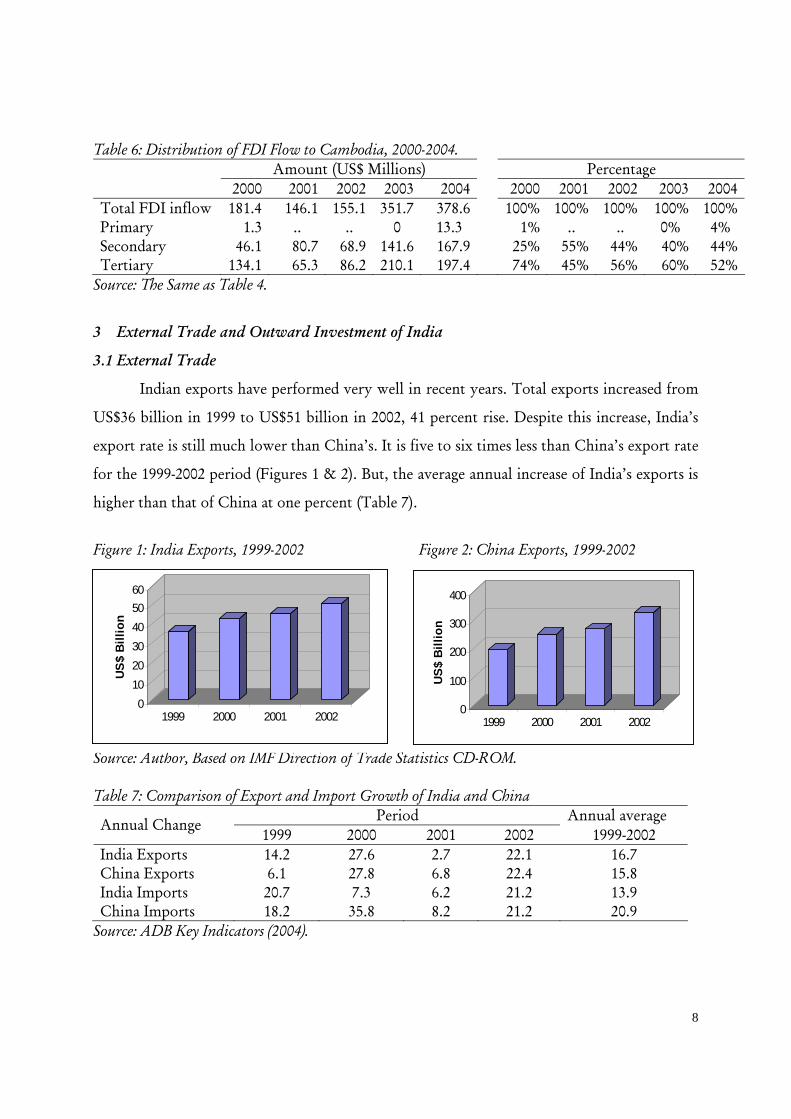
Indian exports have performed very well in recent years. Total exports increased from
US$36 billion in 1999 to US$51 billion in 2002, 41 percent rise. Despite this increase, India’s
export rate is still much lower than China’s. It is five to six times less than China’s export rate
for the 1999-2002 period (Figures 1 & 2). But, the average annual increase of India’s exports is
higher than that of China at one percent (Table 7).
Figure 1: India Exports, 1999-2002 Figure 2: China Exports, 1999-2002 Source: Author, Based on IMF Direction of Trade Statistics CD-ROM. Table 7: Comparison of Export and Import Growth of India and China
Period Annual average Annual Change 1999 2000 2001 2002 1999-2002
India Exports 14.2 27.6 2.7 22.1 16.7 China Exports 6.1 27.8 6.8 22.4 15.8 India Imports 20.7 7.3 6.2 21.2 13.9 China Imports 18.2 35.8 8.2 21.2 20.9
Source: ADB Key Indicators (2004).
0102030405060
US$
Billi
on
1999 2000 2001 2002 0
100
200
300
400
US
$ B
illio
n
1999 2000 2001 2002
9
Markets of developed countries are the main destinations of exports from India. Nine
out of the top ten Indian export partners are advanced economies. The US is the main buyer
of exports from India. Its annual average imports were 8.3 billion dollars during the 1995-2003
period. Exports to these top ten countries accounted for nearly 60 percent of total exports of
US$368,490 billion, of which the US got a 20 percent share.
Table 8: Top 10 Export Partners of India, 1995-2003 Rank Export Partner 1995 1996 1997 1998 1999 2000 2001 2002 2003 Total Share
1 United States
5,305
6,184
6,742
7,103
8,100
9,083
9,355
11,318
11,375
74,565 20.2%
2 United Kingdom
1,881
2,011
2,120
1,928
1,990
2,233
2,467
2,553
3,221
20,406 5.5%
3 United Arab Emirates
1,306
1,491
1,638
1,824
2,029
2,469
1,679
1,846
5,039
19,321 5.2%
4 China,P.R.:Hong Kong
1,821
1,765
1,915
1,893
2,353
2,608
2,088
2,272
1,688
18,403 5.0%
5 Germany
1,841
1,857
1,916
1,870
1,767
1,865
2,037
2,164
2,987
18,304 5.0%
6 Japan
2,130
2,078
1,925
1,714
1,677
1,767
2,011
1,900
2,513
17,716 4.8%
7 Italy
974
913
1,070
1,070
1,104
1,262
1,357
1,357
1,280
10,386 2.8%
8 Belgium
n.a.
n.a.
1,185
1,270
1,348
1,445
1,371
1,514
2,098
10,231 2.8%
9 Bangladesh
960
832
807
943
726
860
1,087
1,042
2,918
10,176 2.8%
10 France
683
710
753
819
890
999
1,047
1,091
1,719
8,710 2.4% Sources: IMF Direction of Trade Statistics CD-ROM for 1995-2002 & UNSD Comtrade Statistics Database for 2003.
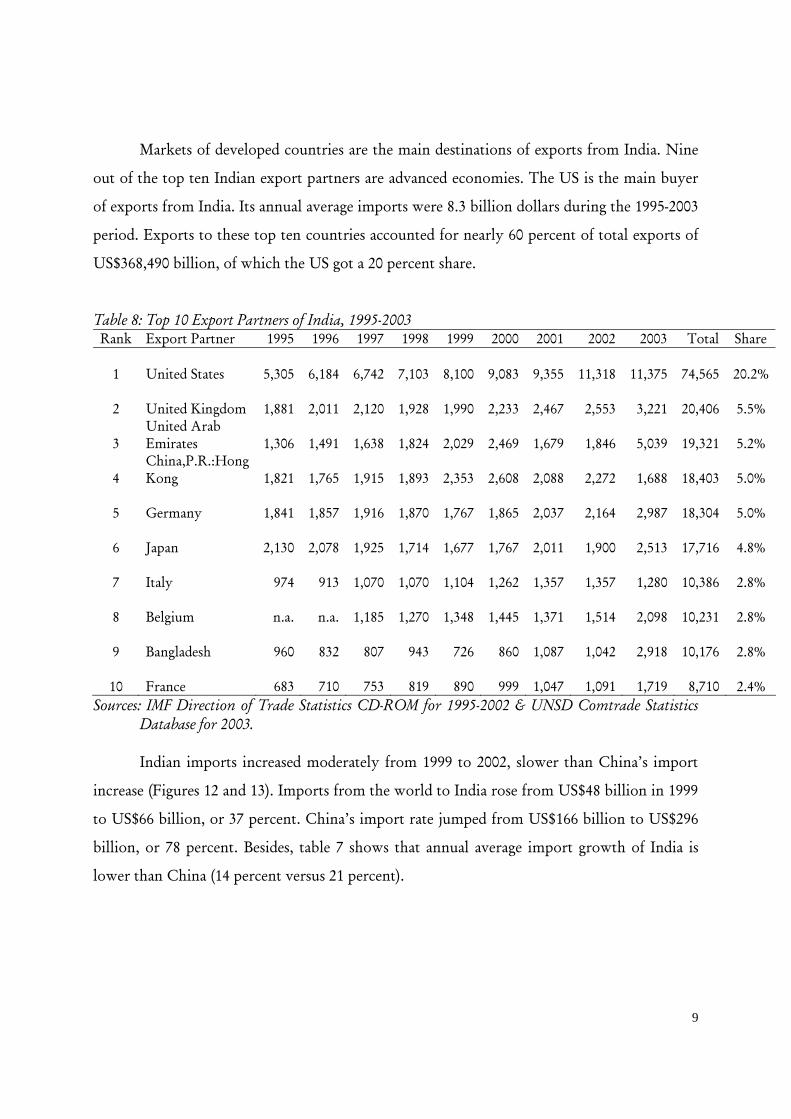
Indian imports increased moderately from 1999 to 2002, slower than China’s import
increase (Figures 12 and 13). Imports from the world to India rose from US$48 billion in 1999
to US$66 billion, or 37 percent. China’s import rate jumped from US$166 billion to US$296
billion, or 78 percent. Besides, table 7 shows that annual average import growth of India is
lower than China (14 percent versus 21 percent).
10
Figure 3: India Imports, 1999-2002 Figure 4: China Imports, 1999-2002 Source: The Same as Figure 1.
On the import side, developed countries are also main partners of India. Nine out of
ten top import partners of India are advanced economies; six main import partners are in the
top ten of main export partners of India (United States, United Kingdom, Belgium, Germany,
Japan, and United Arab Emirates). The United States, which is the first trading partner of
India, accounted nearly 8 percent of total Indian imports. United Kingdom, Belgium and
Germany all took the share of around 5 percent of total Indian import. Import from these top
ten countries accounted for nearly 40 percent of total imports.
Table 9: Top 10 Import Partners of India, 1995-2003 Rank Import Partner 1995 1996 1997 1998 1999 2000 2001 2002 2003 Total Share
1 United States
3,344
3,187
3,709
3,660
3,583
3,152
4,141
4,508
4,975
34,258 7.6%
2 United Kingdom
1,683
1,948
2,366
2,577
2,686
3,053
2,824
2,913
3,195
23,246 5.1%
3 Belgium
n.a.
n.a.
2,564
2,825
3,480
3,073
2,966
4,226
3,928
23,062 5.1%
4 Germany
2,713
2,738
2,604
2,238
1,916
1,780
2,272
2,511
2,883
21,657 4.8%
5 Japan
2,234
2,134
2,156
2,386
2,518
2,016
2,134
2,056
2,636
20,268 4.5%
6 Switzerland
787
929
2,262
2,867
2,684
3,020
427
453
3,270
16,699 3.7%
7 Saudi Arabia
1,860
2,428
2,574
2,001
2,720
1,220
1,316
1,400
729
16,248 3.6%
8 Singapore
966
974
1,164
1,338
1,497
1,482
3,018
2,914
2,060
15,413 3.4%
9 China,P.R.: Mainland
811
702
1,029
1,102
1,240
1,449
2,094
2,940
4,005
15,371 3.4%
10 United Arab Emirates
1,594
1,657
1,769
1,736
2,181
1,078
1,163
1,237
2,035
14,449 3.2%
Source: The Same as Table 8.
0
20
40
60
80
US$
Bill
ion
1999 2000 2001 20020
50100150200250300
US$B
illio
n
1999 2000 2001 2002
11
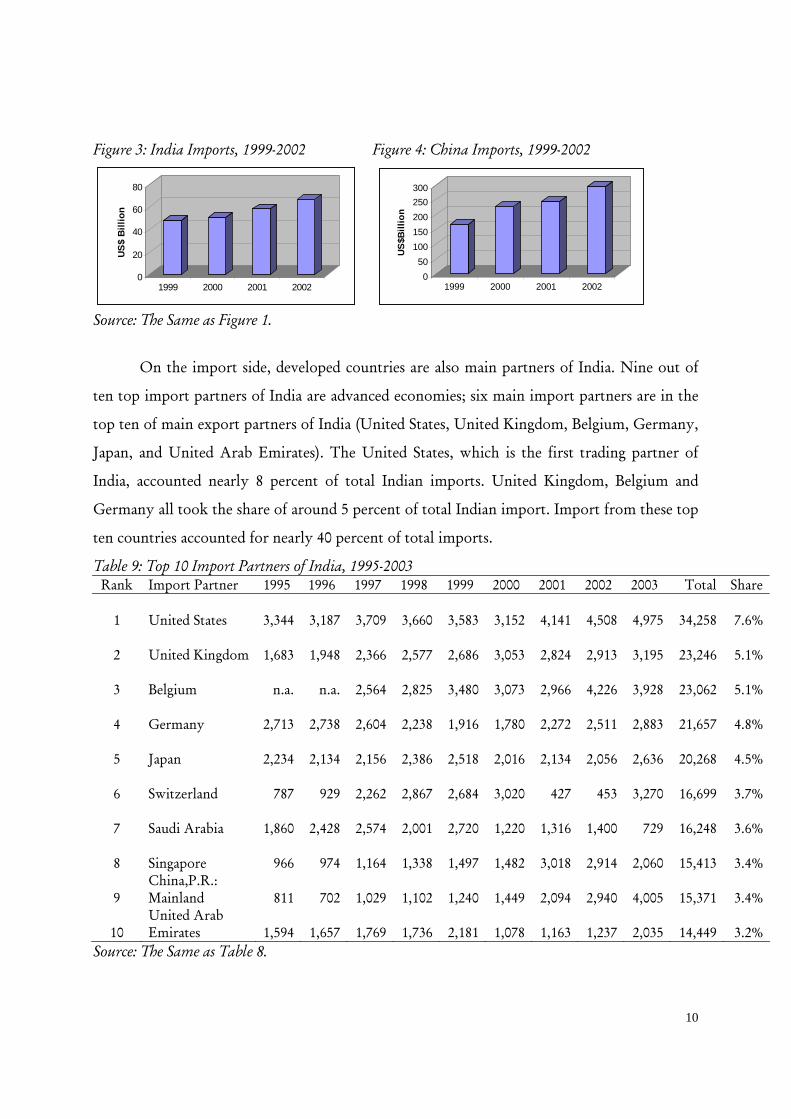
On the one hand, increases in exports and imports in the Indian economy reflect the
revival of economic activities with the world and shows that the country has liberalized its
economy. On the other hand, trade liberalization has led to a rising trade deficit. Figure 14
indicates that the trade deficit increased from US$12 billion in 1999 to US$15 billion in 2002.
China, by contrast, exports much more than it imports, leading to a trade surplus of US$26
billion annually for four consecutive years from1999 to 2002.
Figure 5: India Trade Deficit, 1999-2002 Figure 6: China Trade Surplus, 1999-2002 Source: The Same as Figure 1.
3.2 Destination of Outward FDI
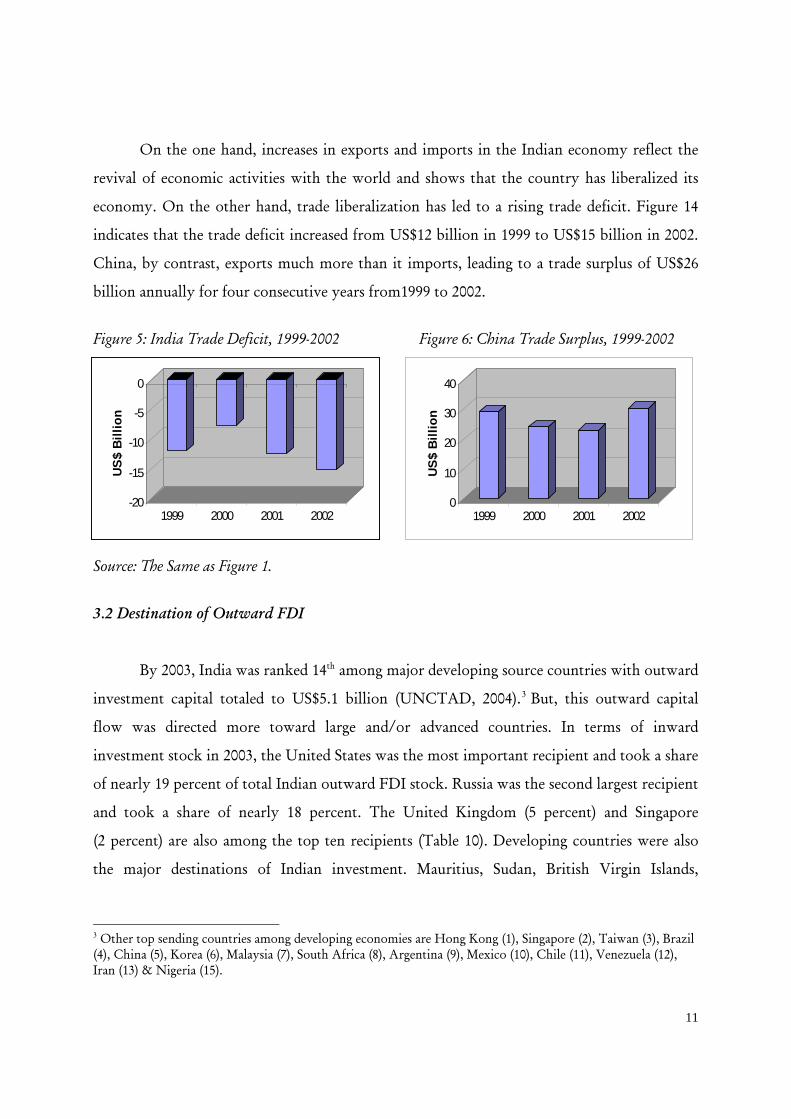
By 2003, India was ranked 14th among major developing source countries with outward
investment capital totaled to US$5.1 billion (UNCTAD, 2004).3 But, this outward capital
flow was directed more toward large and/or advanced countries. In terms of inward
investment stock in 2003, the United States was the most important recipient and took a share
of nearly 19 percent of total Indian outward FDI stock. Russia was the second largest recipient
and took a share of nearly 18 percent. The United Kingdom (5 percent) and Singapore
(2 percent) are also among the top ten recipients (Table 10). Developing countries were also
the major destinations of Indian investment. Mauritius, Sudan, British Virgin Islands,
3 Other top sending countries among developing economies are Hong Kong (1), Singapore (2), Taiwan (3), Brazil (4), China (5), Korea (6), Malaysia (7), South Africa (8), Argentina (9), Mexico (10), Chile (11), Venezuela (12), Iran (13) & Nigeria (15).
-20
-15
-10
-5
0
US$
Billi
on
1999 2000 2001 20020
10
20
30
40
US$
Billi
on
1999 2000 2001 2002
12
Bermuda and Vietnam took 3rd, 4th, 5th, 8th and 9th place in the top ten recipient list of India.
These countries together have absorbed 31 percent of total Indian outflows.
Table10: Top 10 Recipient Countries, 2003
Rank Region/economy FDI stock (US$ Millions) Share (%)
1 United States 1,864.8 18.8 2 Russian Federation 1,748.8 17.6 3 Mauritius 912.6 9.2 4 Sudan 912.0 9.2 5 British Virgin Islands 782.0 7.9 6 United Kingdom 543.2 5.5 7 Hong Kong, China 473.1 4.8 8 Bermuda 276.3 2.8 9 Viet Nam 228.9 2.3 10 Singapore 213.2 2.1
Source: UNCTAD (2004), Table 2.
3.3 Composition of Outward FDI
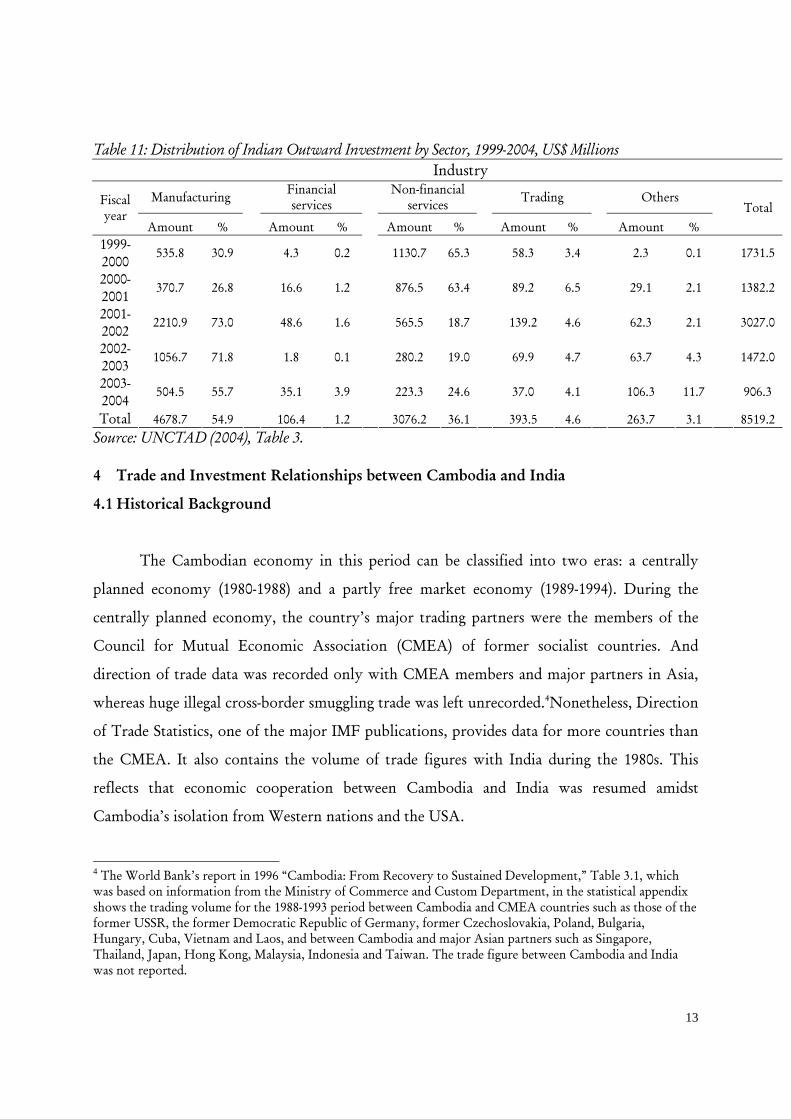
Outward FDI from India dominantly focuses on manufacturing sector. FDI outward
accumulation in table 11 showed that by 2004 the manufacturing sector accounted for 55
percent (US$4.7 billion) of total outward FDI. In particular, it goes to manufacturing of
pharmaceutical products where Indian has played key roles in global market. The non-
financial sector was also a substantial recipient, accounted about 36 percent of total outward
FDI. Furthermore, according to UNCTAD (2004), Indian investment in services was shifted
from locations in developing countries in the 1980s to developed countries in the 1990s.
Indian companies established their operations in more advanced countries such as the United
Kingdom and the United States, replacing the traditional locations of Singapore, Thailand, Sri
Lanka and Malaysia.
13
Table 11: Distribution of Indian Outward Investment by Sector, 1999-2004, US$ Millions Industry
Manufacturing Financial services
Non-financial services Trading Others Fiscal
year Amount % Amount % Amount % Amount % Amount %
Total
1999-2000
535.8 30.9 4.3 0.2 1130.7 65.3 58.3 3.4 2.3 0.1 1731.5
2000-2001
370.7 26.8 16.6 1.2 876.5 63.4 89.2 6.5 29.1 2.1 1382.2
2001-2002
2210.9 73.0 48.6 1.6 565.5 18.7 139.2 4.6 62.3 2.1 3027.0
2002-2003
1056.7 71.8 1.8 0.1 280.2 19.0 69.9 4.7 63.7 4.3 1472.0
2003-2004
504.5 55.7 35.1 3.9 223.3 24.6 37.0 4.1 106.3 11.7 906.3
Total 4678.7 54.9 106.4 1.2 3076.2 36.1 393.5 4.6 263.7 3.1 8519.2
Source: UNCTAD (2004), Table 3. 4 Trade and Investment Relationships between Cambodia and India
4.1 Historical Background
The Cambodian economy in this period can be classified into two eras: a centrally
planned economy (1980-1988) and a partly free market economy (1989-1994). During the
centrally planned economy, the country’s major trading partners were the members of the
Council for Mutual Economic Association (CMEA) of former socialist countries. And
direction of trade data was recorded only with CMEA members and major partners in Asia,
whereas huge illegal cross-border smuggling trade was left unrecorded.4Nonetheless, Direction
of Trade Statistics, one of the major IMF publications, provides data for more countries than
the CMEA. It also contains the volume of trade figures with India during the 1980s. This
reflects that economic cooperation between Cambodia and India was resumed amidst
Cambodia’s isolation from Western nations and the USA.
4 The World Bank’s report in 1996 “Cambodia: From Recovery to Sustained Development,” Table 3.1, which was based on information from the Ministry of Commerce and Custom Department, in the statistical appendix shows the trading volume for the 1988-1993 period between Cambodia and CMEA countries such as those of the former USSR, the former Democratic Republic of Germany, former Czechoslovakia, Poland, Bulgaria, Hungary, Cuba, Vietnam and Laos, and between Cambodia and major Asian partners such as Singapore, Thailand, Japan, Hong Kong, Malaysia, Indonesia and Taiwan. The trade figure between Cambodia and India was not reported.
14
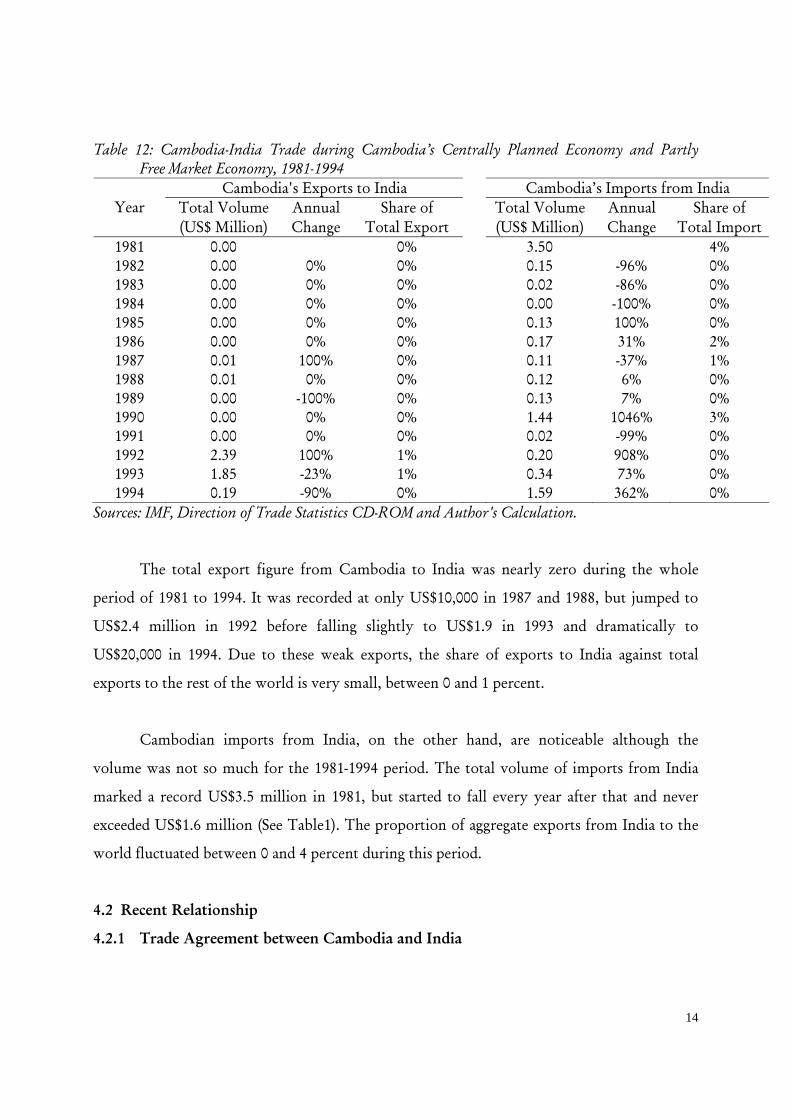
Table 12: Cambodia-India Trade during Cambodia’s Centrally Planned Economy and Partly Free Market Economy, 1981-1994
Cambodia's Exports to India Cambodia’s Imports from India Total Volume Annual Share of Total Volume Annual Share of Year (US$ Million) Change Total Export (US$ Million) Change Total Import
1981 0.00 0% 3.50 4% 1982 0.00 0% 0% 0.15 -96% 0% 1983 0.00 0% 0% 0.02 -86% 0% 1984 0.00 0% 0% 0.00 -100% 0% 1985 0.00 0% 0% 0.13 100% 0% 1986 0.00 0% 0% 0.17 31% 2% 1987 0.01 100% 0% 0.11 -37% 1% 1988 0.01 0% 0% 0.12 6% 0% 1989 0.00 -100% 0% 0.13 7% 0% 1990 0.00 0% 0% 1.44 1046% 3% 1991 0.00 0% 0% 0.02 -99% 0% 1992 2.39 100% 1% 0.20 908% 0% 1993 1.85 -23% 1% 0.34 73% 0% 1994 0.19 -90% 0% 1.59 362% 0%
Sources: IMF, Direction of Trade Statistics CD-ROM and Author's Calculation. The total export figure from Cambodia to India was nearly zero during the whole
period of 1981 to 1994. It was recorded at only US$10,000 in 1987 and 1988, but jumped to
US$2.4 million in 1992 before falling slightly to US$1.9 in 1993 and dramatically to
US$20,000 in 1994. Due to these weak exports, the share of exports to India against total
exports to the rest of the world is very small, between 0 and 1 percent.
Cambodian imports from India, on the other hand, are noticeable although the
volume was not so much for the 1981-1994 period. The total volume of imports from India
marked a record US$3.5 million in 1981, but started to fall every year after that and never
exceeded US$1.6 million (See Table1). The proportion of aggregate exports from India to the
world fluctuated between 0 and 4 percent during this period.
4.2 Recent Relationship
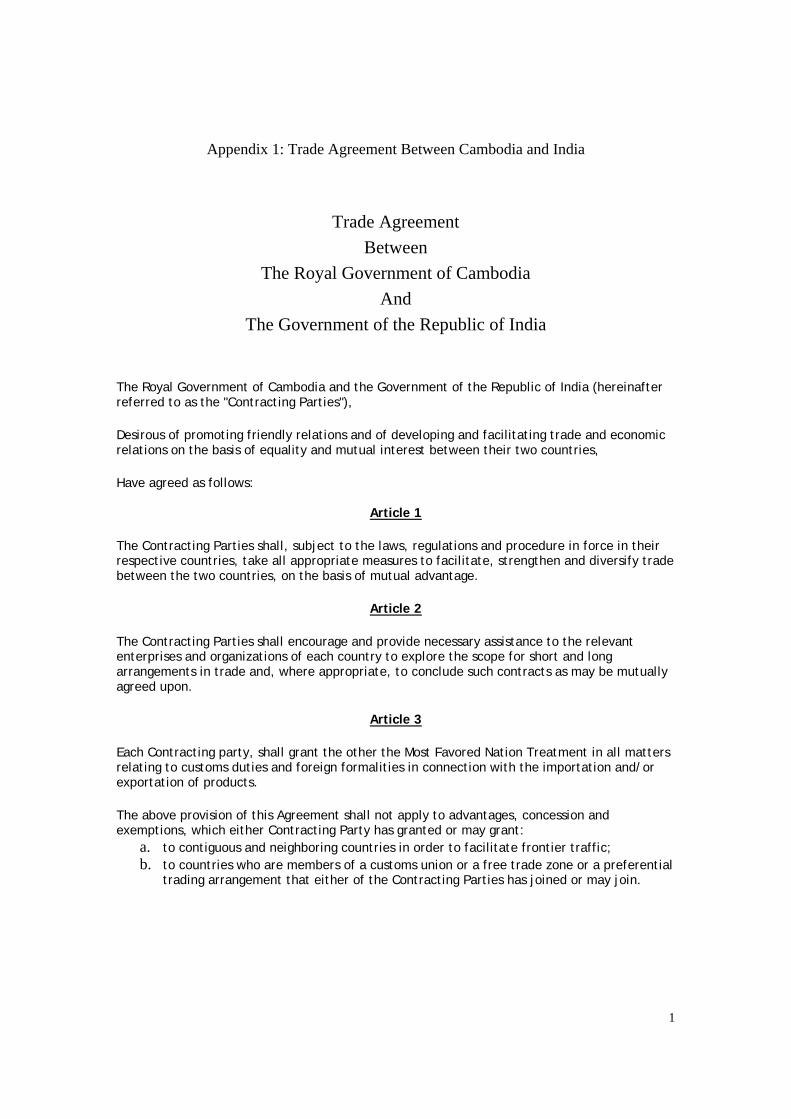
4.2.1 Trade Agreement between Cambodia and India
15
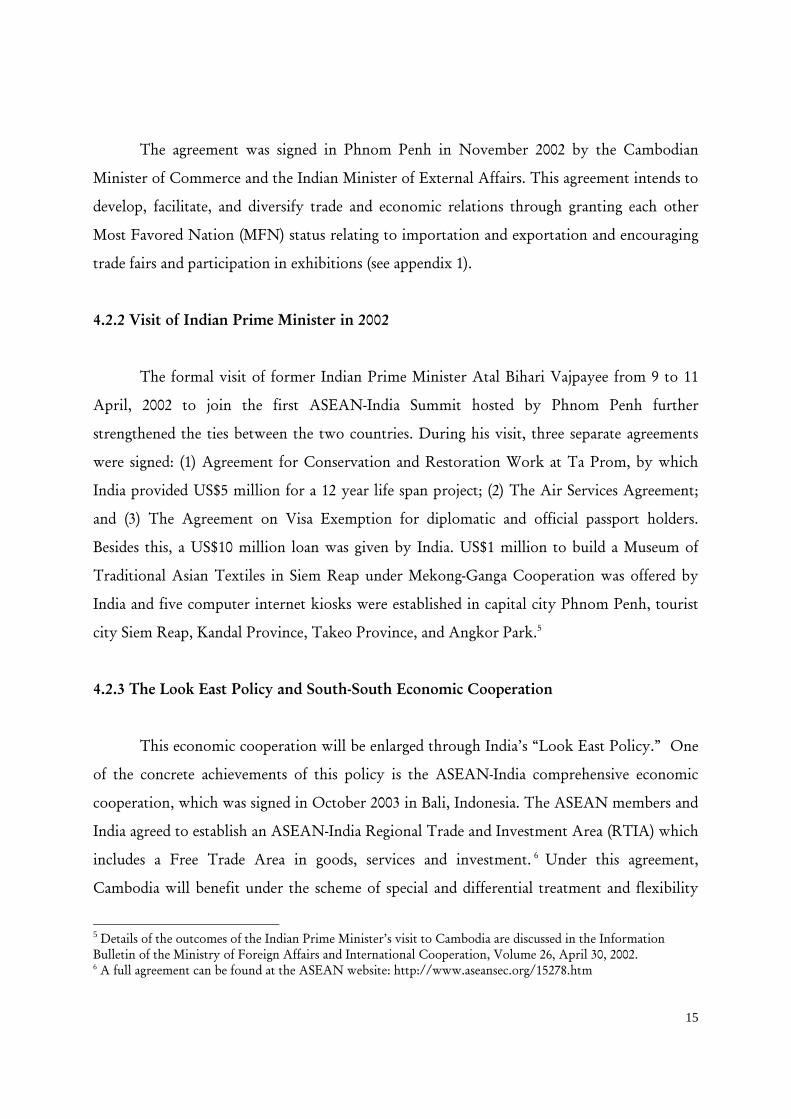
The agreement was signed in Phnom Penh in November 2002 by the Cambodian
Minister of Commerce and the Indian Minister of External Affairs. This agreement intends to
develop, facilitate, and diversify trade and economic relations through granting each other
Most Favored Nation (MFN) status relating to importation and exportation and encouraging
trade fairs and participation in exhibitions (see appendix 1).
4.2.2 Visit of Indian Prime Minister in 2002
The formal visit of former Indian Prime Minister Atal Bihari Vajpayee from 9 to 11
April, 2002 to join the first ASEAN-India Summit hosted by Phnom Penh further
strengthened the ties between the two countries. During his visit, three separate agreements
were signed: (1) Agreement for Conservation and Restoration Work at Ta Prom, by which
India provided US$5 million for a 12 year life span project; (2) The Air Services Agreement;
and (3) The Agreement on Visa Exemption for diplomatic and official passport holders.
Besides this, a US$10 million loan was given by India. US$1 million to build a Museum of
Traditional Asian Textiles in Siem Reap under Mekong-Ganga Cooperation was offered by
India and five computer internet kiosks were established in capital city Phnom Penh, tourist
city Siem Reap, Kandal Province, Takeo Province, and Angkor Park.5
4.2.3 The Look East Policy and South-South Economic Cooperation
This economic cooperation will be enlarged through India’s “Look East Policy.” One
of the concrete achievements of this policy is the ASEAN-India comprehensive economic
cooperation, which was signed in October 2003 in Bali, Indonesia. The ASEAN members and
India agreed to establish an ASEAN-India Regional Trade and Investment Area (RTIA) which
includes a Free Trade Area in goods, services and investment. 6 Under this agreement,
Cambodia will benefit under the scheme of special and differential treatment and flexibility
5 Details of the outcomes of the Indian Prime Minister’s visit to Cambodia are discussed in the Information Bulletin of the Ministry of Foreign Affairs and International Cooperation, Volume 26, April 30, 2002. 6 A full agreement can be found at the ASEAN website: http://www.aseansec.org/15278.htm
16
for new ASEAN members. India will also gain advantages in supplying Cambodian demand at
preferential tariff rates (which is yet to be finalized). However, ASEAN and India have agreed
in 2003 in Bali of Indonesia, under the Early Harvest Programme, to implement a progressive
reduction in tariffs on 105 products commencing from November 2004 until tariff elimination
by October 2010.
The leading role of India in establishing, maintaining, improving, and widening ties
among developing countries will indeed become another impetus for trade and investment
links. This trend can be evidenced by the establishment of G20 after the collapse of the
Cancun meeting of the WTO.
4.2.4 Volume of Trade
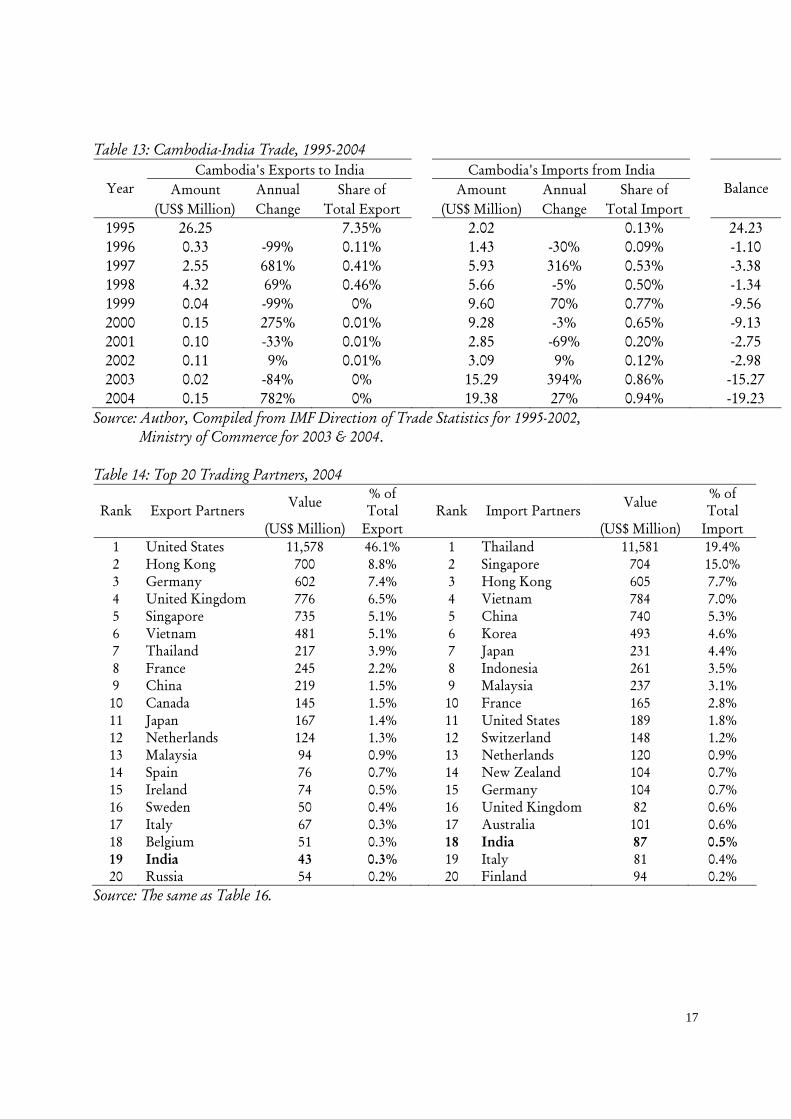
Although Cambodian external trade surged dramatically, trade with India remained
very small, uneven and relatively weak. Total exports from Cambodia to India was recorded
at US$26 million in 1995, and then decreased substantially over the following years to less
than US$1 million in annual averages during 1996-2004. On the other hand, exports from
India to Cambodia were rather good in the 1995-2004 period with an annual average of about
US$7 million. Similar to exports from Cambodia to India, unevenness also appeared in
distribution of imports from India to Cambodia during this period. Nevertheless, the overall
trade balance was in favor of India during the entire period, except in 1995. In terms of export
and import accumulation, by 2004 India is ranked number 18 as an export destination of
Cambodia and ranked 19 among 20 source countries for Cambodia’s imports.
17
Table 13: Cambodia-India Trade, 1995-2004 Cambodia's Exports to India Cambodia's Imports from India
Amount Annual Share of Amount Annual Share of Year (US$ Million) Change Total Export (US$ Million) Change Total Import
Balance
1995 26.25 7.35% 2.02 0.13% 24.23 1996 0.33 -99% 0.11% 1.43 -30% 0.09% -1.10 1997 2.55 681% 0.41% 5.93 316% 0.53% -3.38 1998 4.32 69% 0.46% 5.66 -5% 0.50% -1.34 1999 0.04 -99% 0% 9.60 70% 0.77% -9.56 2000 0.15 275% 0.01% 9.28 -3% 0.65% -9.13 2001 0.10 -33% 0.01% 2.85 -69% 0.20% -2.75 2002 0.11 9% 0.01% 3.09 9% 0.12% -2.98 2003 0.02 -84% 0% 15.29 394% 0.86% -15.27 2004 0.15 782% 0% 19.38 27% 0.94% -19.23
Source: Author, Compiled from IMF Direction of Trade Statistics for 1995-2002, Ministry of Commerce for 2003 & 2004. Table 14: Top 20 Trading Partners, 2004
Value % of Total Value % of
Total Rank Export Partners (US$ Million) Export
Rank Import Partners (US$ Million) Import
1 United States 11,578 46.1% 1 Thailand 11,581 19.4% 2 Hong Kong 700 8.8% 2 Singapore 704 15.0% 3 Germany 602 7.4% 3 Hong Kong 605 7.7% 4 United Kingdom 776 6.5% 4 Vietnam 784 7.0% 5 Singapore 735 5.1% 5 China 740 5.3% 6 Vietnam 481 5.1% 6 Korea 493 4.6% 7 Thailand 217 3.9% 7 Japan 231 4.4% 8 France 245 2.2% 8 Indonesia 261 3.5% 9 China 219 1.5% 9 Malaysia 237 3.1% 10 Canada 145 1.5% 10 France 165 2.8% 11 Japan 167 1.4% 11 United States 189 1.8% 12 Netherlands 124 1.3% 12 Switzerland 148 1.2% 13 Malaysia 94 0.9% 13 Netherlands 120 0.9% 14 Spain 76 0.7% 14 New Zealand 104 0.7% 15 Ireland 74 0.5% 15 Germany 104 0.7% 16 Sweden 50 0.4% 16 United Kingdom 82 0.6% 17 Italy 67 0.3% 17 Australia 101 0.6% 18 Belgium 51 0.3% 18 India 87 0.5% 19 India 43 0.3% 19 Italy 81 0.4% 20 Russia 54 0.2% 20 Finland 94 0.2%
Source: The same as Table 16.
18
4.2.5 Composition of Trade
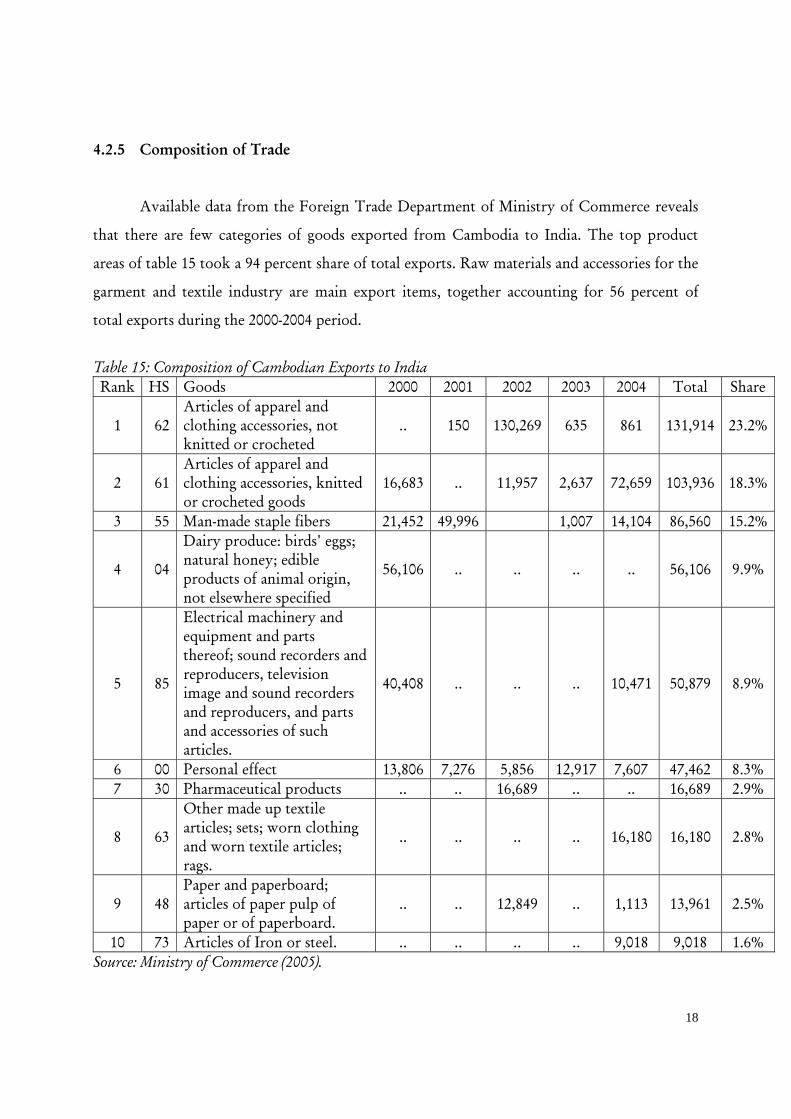
Available data from the Foreign Trade Department of Ministry of Commerce reveals
that there are few categories of goods exported from Cambodia to India. The top product
areas of table 15 took a 94 percent share of total exports. Raw materials and accessories for the
garment and textile industry are main export items, together accounting for 56 percent of
total exports during the 2000-2004 period.
Table 15: Composition of Cambodian Exports to India Rank HS Goods 2000 2001 2002 2003 2004 Total Share
1 62 Articles of apparel and clothing accessories, not knitted or crocheted
.. 150 130,269 635 861 131,914 23.2%
2 61 Articles of apparel and clothing accessories, knitted or crocheted goods
16,683 .. 11,957 2,637 72,659 103,936 18.3%
3 55 Man-made staple fibers 21,452 49,996 1,007 14,104 86,560 15.2%
4 04
Dairy produce: birds' eggs; natural honey; edible products of animal origin, not elsewhere specified
56,106 .. .. .. .. 56,106 9.9%
5 85
Electrical machinery and equipment and parts thereof; sound recorders and reproducers, television image and sound recorders and reproducers, and parts and accessories of such articles.
40,408 .. .. .. 10,471 50,879 8.9%
6 00 Personal effect 13,806 7,276 5,856 12,917 7,607 47,462 8.3% 7 30 Pharmaceutical products .. .. 16,689 .. .. 16,689 2.9%
8 63
Other made up textile articles; sets; worn clothing and worn textile articles; rags.
.. .. .. .. 16,180 16,180 2.8%
9 48 Paper and paperboard; articles of paper pulp of paper or of paperboard.
.. .. 12,849 .. 1,113 13,961 2.5%
10 73 Articles of Iron or steel. .. .. .. .. 9,018 9,018 1.6% Source: Ministry of Commerce (2005).
19
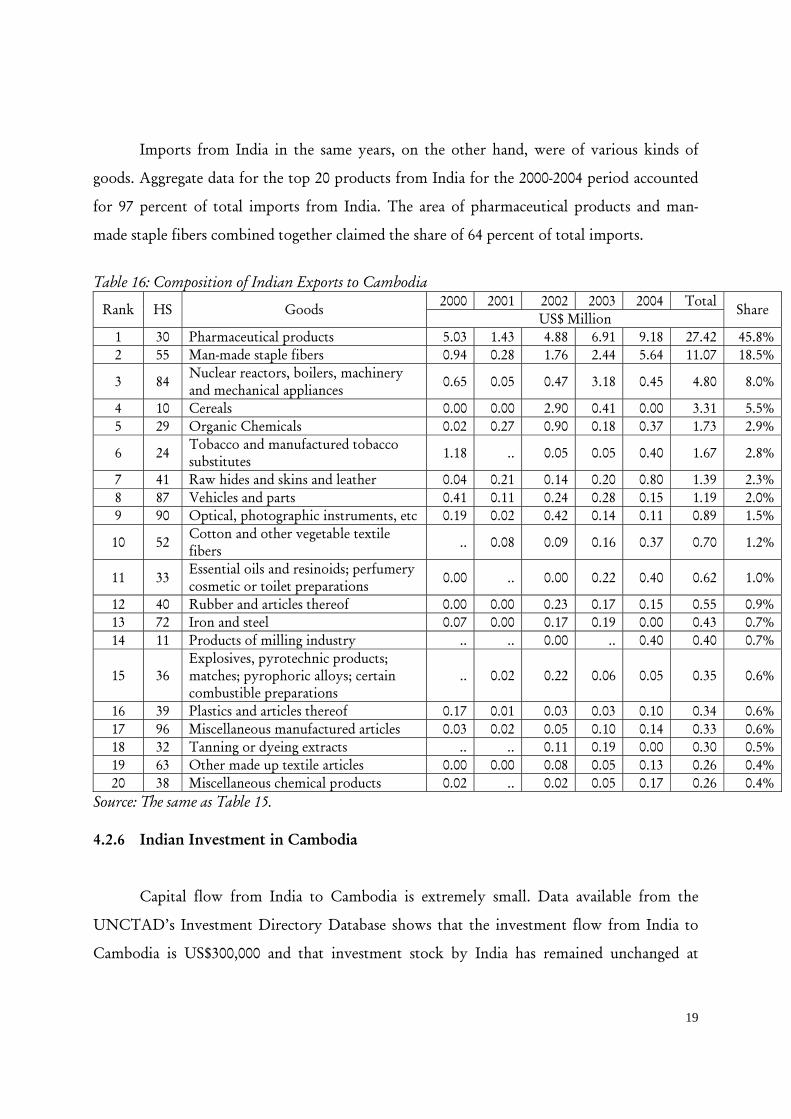
Imports from India in the same years, on the other hand, were of various kinds of
goods. Aggregate data for the top 20 products from India for the 2000-2004 period accounted
for 97 percent of total imports from India. The area of pharmaceutical products and man-
made staple fibers combined together claimed the share of 64 percent of total imports.
Table 16: Composition of Indian Exports to Cambodia
2000 2001 2002 2003 2004 Total Rank HS Goods US$ Million
Share
1 30 Pharmaceutical products 5.03 1.43 4.88 6.91 9.18 27.42 45.8% 2 55 Man-made staple fibers 0.94 0.28 1.76 2.44 5.64 11.07 18.5%
3 84 Nuclear reactors, boilers, machinery and mechanical appliances 0.65 0.05 0.47 3.18 0.45 4.80 8.0%
4 10 Cereals 0.00 0.00 2.90 0.41 0.00 3.31 5.5% 5 29 Organic Chemicals 0.02 0.27 0.90 0.18 0.37 1.73 2.9%
6 24 Tobacco and manufactured tobacco substitutes 1.18 .. 0.05 0.05 0.40 1.67 2.8%
7 41 Raw hides and skins and leather 0.04 0.21 0.14 0.20 0.80 1.39 2.3% 8 87 Vehicles and parts 0.41 0.11 0.24 0.28 0.15 1.19 2.0% 9 90 Optical, photographic instruments, etc 0.19 0.02 0.42 0.14 0.11 0.89 1.5%
10 52 Cotton and other vegetable textile fibers .. 0.08 0.09 0.16 0.37 0.70 1.2%
11 33 Essential oils and resinoids; perfumery cosmetic or toilet preparations 0.00 .. 0.00 0.22 0.40 0.62 1.0%
12 40 Rubber and articles thereof 0.00 0.00 0.23 0.17 0.15 0.55 0.9% 13 72 Iron and steel 0.07 0.00 0.17 0.19 0.00 0.43 0.7% 14 11 Products of milling industry .. .. 0.00 .. 0.40 0.40 0.7%
15 36 Explosives, pyrotechnic products; matches; pyrophoric alloys; certain combustible preparations
.. 0.02 0.22 0.06 0.05 0.35 0.6%
16 39 Plastics and articles thereof 0.17 0.01 0.03 0.03 0.10 0.34 0.6% 17 96 Miscellaneous manufactured articles 0.03 0.02 0.05 0.10 0.14 0.33 0.6% 18 32 Tanning or dyeing extracts .. .. 0.11 0.19 0.00 0.30 0.5% 19 63 Other made up textile articles 0.00 0.00 0.08 0.05 0.13 0.26 0.4% 20 38 Miscellaneous chemical products 0.02 .. 0.02 0.05 0.17 0.26 0.4%
Source: The same as Table 15. 4.2.6 Indian Investment in Cambodia
Capital flow from India to Cambodia is extremely small. Data available from the
UNCTAD’s Investment Directory Database shows that the investment flow from India to
Cambodia is US$300,000 and that investment stock by India has remained unchanged at
20
US$300,000 (Figure 20) since 1995. Its share of total Indian capital outflow and Cambodian
capital inflow is negligible, and it is far less than the real potential between the two countries
if geographical conditions and cultural similarities are taken into consideration.
5. Prospects for Trade and Investment Relations between Cambodia and India
This chapter is derived from a combination of the author’s background paper of trade
and investment between Cambodia and India and the findings from a stakeholders’ perception
survey.7 This survey reflects Cambodian perspectives from different businessmen, government
agencies and academia who have been contacted for intensive individual discussions.
5.1 Prospects for Trade Expansion
More than 80 percent of respondents in the field survey indicated that total trade
between Cambodia and India has yet to reach its potential. The prospects for trade
relationships between Cambodia and India are positive for two main reasons. One reason is a
continuous expansion of economic relationships between the Cambodian government and the
Indian government through bilateral, regional and multilateral arrangements. Through the
framework of the India-ASEAN Economic Partnership Agreement, progressive tariff
reduction under the Early Harvest Program, which started in November 2004 and is expected
to be completed by October 2010, will help to boost trade. Furthermore, tariff reduction and
elimination for a wider range of products has been realised after the two parties concluded
their negotiations in June 2005. On the side of trade in services and investment, negotiations
are on the way and are scheduled to be completed by 2007. Through the framework of the
world trading system WTO, Cambodia and India will indeed improve their trading activities
under the WTO rules and regulations and by respective commitments with WTO. The
second main reason is that complementary trade between the two countries is expected to
7 The background paper is “Exploring Mekong-Ganga Cooperation: Trade and Investment between Cambodia and India”; the field survey report is “Relations between Cambodia and India: Stakeholder Perception Survey Report”.
21
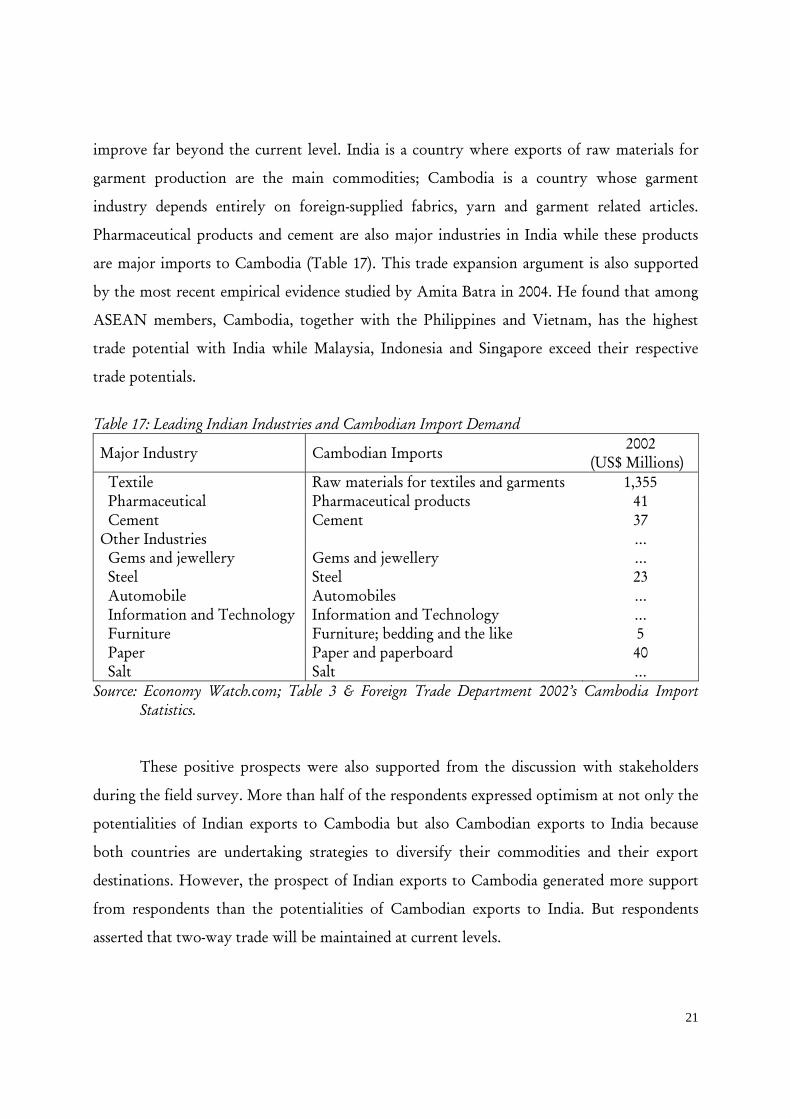
improve far beyond the current level. India is a country where exports of raw materials for
garment production are the main commodities; Cambodia is a country whose garment
industry depends entirely on foreign-supplied fabrics, yarn and garment related articles.
Pharmaceutical products and cement are also major industries in India while these products
are major imports to Cambodia (Table 17). This trade expansion argument is also supported
by the most recent empirical evidence studied by Amita Batra in 2004. He found that among
ASEAN members, Cambodia, together with the Philippines and Vietnam, has the highest
trade potential with India while Malaysia, Indonesia and Singapore exceed their respective
trade potentials.
Table 17: Leading Indian Industries and Cambodian Import Demand
Major Industry Cambodian Imports 2002 (US$ Millions)
Textile Raw materials for textiles and garments 1,355 Pharmaceutical Pharmaceutical products 41 Cement Cement 37 Other Industries … Gems and jewellery Gems and jewellery … Steel Steel 23 Automobile Automobiles … Information and Technology Information and Technology … Furniture Furniture; bedding and the like 5 Paper Paper and paperboard 40 Salt Salt …
Source: Economy Watch.com; Table 3 & Foreign Trade Department 2002’s Cambodia Import Statistics.
These positive prospects were also supported from the discussion with stakeholders
during the field survey. More than half of the respondents expressed optimism at not only the
potentialities of Indian exports to Cambodia but also Cambodian exports to India because
both countries are undertaking strategies to diversify their commodities and their export
destinations. However, the prospect of Indian exports to Cambodia generated more support
from respondents than the potentialities of Cambodian exports to India. But respondents
asserted that two-way trade will be maintained at current levels.
22
All respondents from the pharmaceutical industry in our sample believed that trade
will grow beyond current levels. Additionally, although the representatives of the four
garment factories in our sample reported that they individually have never traded with India,
three out of four said that general trade will not decrease due to India’s expansion in other
areas of trade. The majority of respondents from the remaining three groups also expressed
positive expectations on exports from India to Cambodia rather than exports from Cambodia
to India.
5.2 Areas of Trade Expansion
Many of the suggestions from the field survey revealed that Indian industrial export-
based production to Cambodia should receive more attention whereas Cambodian primary
products should be promoted the other way around. Moreover, respondents from the
garment sector believed the potential in garment trade with India is unlikely to be realized
given the substantial influence of China, Taiwan and Indonesia on the supply side and from
EU and US on the demand side. More explicitly, Indian trading companies can likely compete
in Cambodia’s market with an array of goods, according to many respondents across the
sample. Indeed, pharmaceutical products from India have the greatest potential in gaining a
bigger market share. Other potential products are children’s books, higher education books,
textiles, agricultural water pumps, chemical fertilizers and consumer products. Products with
less potential are automobiles, dyes and paints, food products and stationery. It is suggested
that Cambodia, on the other hand, strengthen its focus on exports such as cashew nuts and
green beans. Other products with diminished potential include rubber, tropical fruits, black
pepper, corn, handicrafts, gems, and jewelry.
5.3 Prospects for Investment Expansion
Prospects for investment relationships, however, are limited for several reasons.
Firstly, the destination of Indian outward FDI seemed to shift from Asian countries to more
23
advanced countries in Western Europe and North America. Secondly, distribution by sector
of FDI focuses more on the IT industry where Indian transnational corporations (TNCs) used
merger and acquisition modes of entry. Thirdly, desires of Indian TNCs, suggested by
UNCTAD (2004), are for things such as access to markets, natural resources, distribution
networks, foreign technologies and strategic assets like brand names but these are things that
Cambodia lacks. Fourthly, comparative advantages of both countries are almost the same, just
slightly different in level. Finally, with the ASEAN-India comprehensive economic
agreement, investment agreements were not so much emphasized. Hence, in terms of
investment, it seemed the two countries are in competitive rather than in complementary
positions.
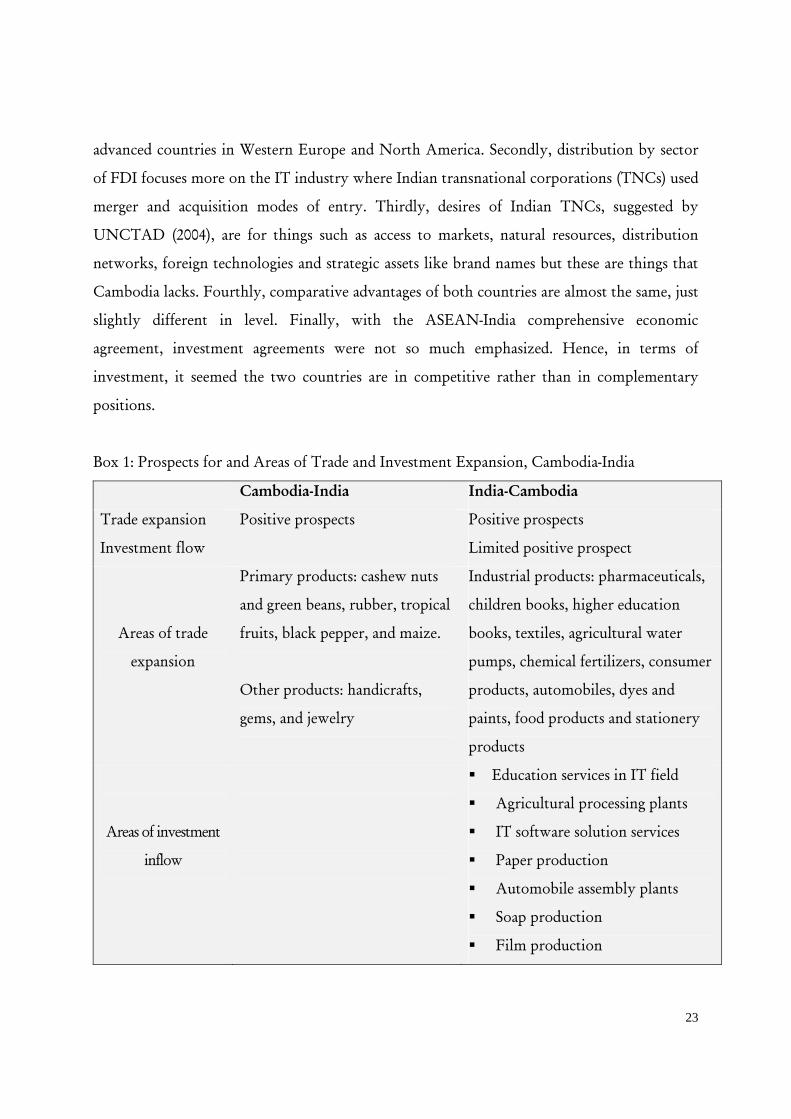
Box 1: Prospects for and Areas of Trade and Investment Expansion, Cambodia-India
Cambodia-India India-Cambodia
Trade expansion Positive prospects Positive prospects
Investment flow Limited positive prospect
Areas of trade
expansion
Primary products: cashew nuts
and green beans, rubber, tropical
fruits, black pepper, and maize.
Other products: handicrafts,
gems, and jewelry
Industrial products: pharmaceuticals,
children books, higher education
books, textiles, agricultural water
pumps, chemical fertilizers, consumer
products, automobiles, dyes and
paints, food products and stationery
products
Areas of investment
inflow
Education services in IT field
Agricultural processing plants
IT software solution services
Paper production
Automobile assembly plants
Soap production
Film production
24
5.4 Areas of Investment Expansion
Given the strengths of India in IT and software development, it is suggested that (in
particular respondents from universities and IT companies) India open training institutes in
Cambodia either within the university system or as independent, vocational training centers.
Agricultural processing is ranked second as a possible investment option while IT software
companies are ranked third, as suggested by field work findings. Investing in the hotel
industry is ranked fourth. Other areas of investment cited were paper production, automobile
assembly plants, soap production and film production.
5.5 Ways to Promote Trade and Investment
Survey respondents can be grouped according to four schools of thought on ways to
promote trade between Cambodia and India.
The first school of thought is based on the idea that initiatives should be government
based; to arrange a free trade agreement and investment protections bilaterally in order to
pave the way for private sector growth. Trade exhibitions are another possibility for both
governments. However, in the early stages of participating in exhibitions, the focus should be
more on bringing businessmen together to meet each other rather than having exhibitions
where consumers meet businessmen.
The second school of thought sees the promotion of tourism as an anchor whereby
encouraging Indians to visit Cambodia can serve as a precondition to expanding trade and
encouraging investment.
The third school of thought is based on the assertion that the private sector, especially
chambers of commerce of both countries, can autonomously achieve trade and investment as
both governments have limited initiative.
25
The fourth school of thought states that respective domestic barriers must be gradually
removed in order to improve trade and investment. Respondents emphasized this need more
for Cambodia than India. In terms of trade expansion, it was articulated that Cambodia
should have a wider variety of commodities for export beyond garments. Trade facilitation
should be in place to ease export and import activities. For investment promotion, legal
frameworks and low production costs were identified as key determinants to this process.
6. Conclusion
The economic relationships between Cambodia and India in the past and in the most
recent years have remained very weak although the two countries enjoy good relations and
have common cultural features. Two-way trade is minimal. Investment from India to
Cambodia is even more disappointing.
However, there are opportunities for expansion in the future due to their actual
potentialities and foreseeable closer economic cooperation between the two. In the area of
trade, both countries have opened their markets. Cambodia can expand its exports of primary
commodities to supply Indian markets. India has great potential in increasing exports in
textiles, pharmaceuticals, cement, automobile components and machinery to Cambodia.
Indian investors should seek investment opportunities in the pharmaceutical industry, IT-
related services and education services. Yet, capturing these actual potentialities will be
realized if better trade facilitation and investment climate are in place.
26
References
Asian Development Bank. 2004. Key indicators. Manila: ADB. Amita, B. 2004. India’s global trade potential: the gravity model approach. ICRIER Working paper No. 151. Indian Council for Research on International Economic Relations. Available at http://www.icrier.res.in/wp151.pdf EconomyWatch.com. 2005. Indian economy overview. Available at http://www.economywatch.com/ International Monetary Fund. 2003. Direction of trade statistics CD-ROM. Ministry of Foreign Affairs and International Cooperation (MOFA). 2002. Information bulletin, April 30, 2002, Volume 46. Phnom Penh: MOFA. Ministry of Commerce, Foreign Trade Department. Cambodian import and export statistics (various issues from 2000 to 2004). Neak, S., & Ouk, C. 2005. Trade and investment between Cambodia and India. A background paper prepared for Exploring Mekong-Ganga Project. Available at http://www.cuts-citee.org/PDF/perception-survey-cambodia.pdf Neak, S. 2005. Relations between Cambodia and India: stakeholder perception survey. A report prepared for Exploring Mekong-Ganga Project. Available at http://www.cuts-citee.org/PDF/perception-survey-cambodia.pdf Sen, R., Asher M.G. & Rajan, R.S. 2004. ASEAN-India economic relations: current status and future prospects. RIS Discussion papers 73. Available at http://www.ris.org.in/ UNCTAD. 2005. World investment directory online database: Cambodia. Available at http://www.unctad.org/Templates/Page.asp?intItemID=3198&lang=1. ________ . 2004. India’s outward FDI: a giant awakening? http://www.unctad.org/ sections/dite_dir/docs//diteiiab20041_en.pdf. United Nation Statistical Department. 2005. Comtrade Statistics Database. World Bank. 1996. Cambodia: from recovery to sustained development. The World Bank East Asia and Pacific Region, Country Department I.
1
Appendix 1: Trade Agreement Between Cambodia and India
Trade Agreement Between
The Royal Government of Cambodia And
The Government of the Republic of India
The Royal Government of Cambodia and the Government of the Republic of India (hereinafter referred to as the "Contracting Parties"), Desirous of promoting friendly relations and of developing and facilitating trade and economic relations on the basis of equality and mutual interest between their two countries, Have agreed as follows:
Article 1
The Contracting Parties shall, subject to the laws, regulations and procedure in force in their respective countries, take all appropriate measures to facilitate, strengthen and diversify trade between the two countries, on the basis of mutual advantage.
Article 2 The Contracting Parties shall encourage and provide necessary assistance to the relevant enterprises and organizations of each country to explore the scope for short and long arrangements in trade and, where appropriate, to conclude such contracts as may be mutually agreed upon.
Article 3 Each Contracting party, shall grant the other the Most Favored Nation Treatment in all matters relating to customs duties and foreign formalities in connection with the importation and/or exportation of products. The above provision of this Agreement shall not apply to advantages, concession and exemptions, which either Contracting Party has granted or may grant:
a. to contiguous and neighboring countries in order to facilitate frontier traffic; b. to countries who are members of a customs union or a free trade zone or a preferential
trading arrangement that either of the Contracting Parties has joined or may join.
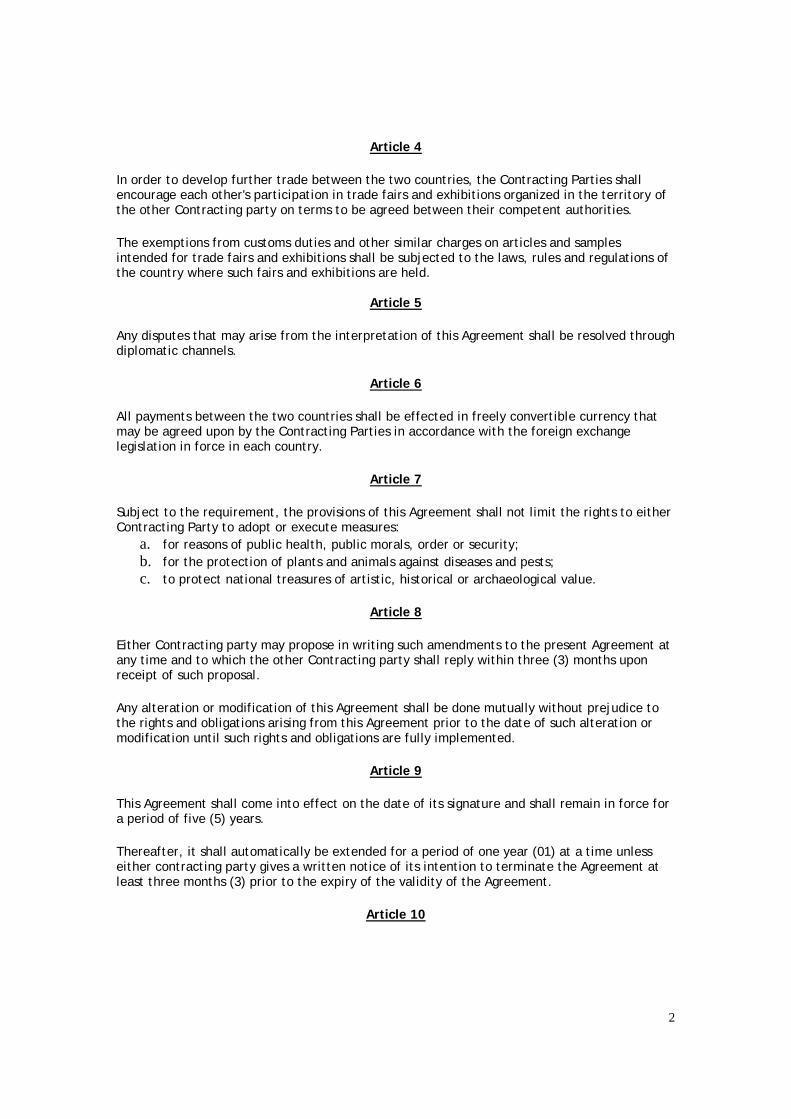
2
Article 4 In order to develop further trade between the two countries, the Contracting Parties shall encourage each other's participation in trade fairs and exhibitions organized in the territory of the other Contracting party on terms to be agreed between their competent authorities. The exemptions from customs duties and other similar charges on articles and samples intended for trade fairs and exhibitions shall be subjected to the laws, rules and regulations of the country where such fairs and exhibitions are held.
Article 5
Any disputes that may arise from the interpretation of this Agreement shall be resolved through diplomatic channels.
Article 6 All payments between the two countries shall be effected in freely convertible currency that may be agreed upon by the Contracting Parties in accordance with the foreign exchange legislation in force in each country.
Article 7 Subject to the requirement, the provisions of this Agreement shall not limit the rights to either Contracting Party to adopt or execute measures:
a. for reasons of public health, public morals, order or security; b. for the protection of plants and animals against diseases and pests; c. to protect national treasures of artistic, historical or archaeological value.
Article 8 Either Contracting party may propose in writing such amendments to the present Agreement at any time and to which the other Contracting party shall reply within three (3) months upon receipt of such proposal. Any alteration or modification of this Agreement shall be done mutually without prejudice to the rights and obligations arising from this Agreement prior to the date of such alteration or modification until such rights and obligations are fully implemented.
Article 9 This Agreement shall come into effect on the date of its signature and shall remain in force for a period of five (5) years. Thereafter, it shall automatically be extended for a period of one year (01) at a time unless either contracting party gives a written notice of its intention to terminate the Agreement at least three months (3) prior to the expiry of the validity of the Agreement.
Article 10
3
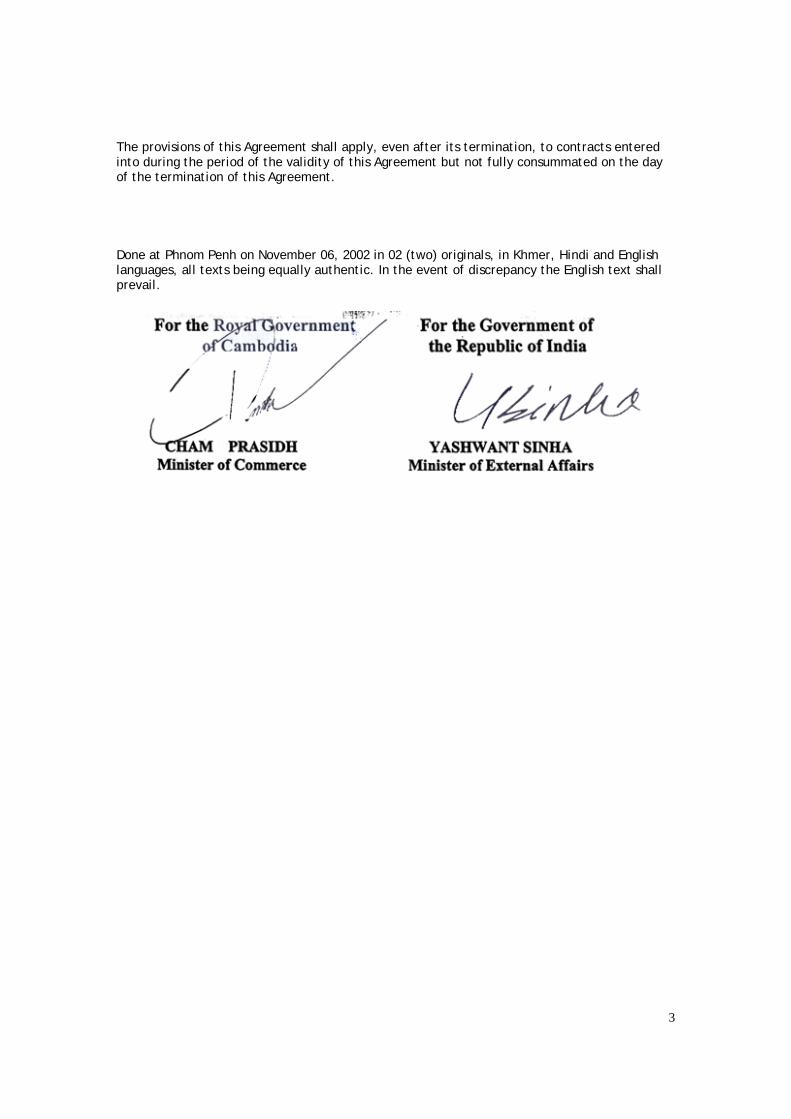
The provisions of this Agreement shall apply, even after its termination, to contracts entered into during the period of the validity of this Agreement but not fully consummated on the day of the termination of this Agreement. Done at Phnom Penh on November 06, 2002 in 02 (two) originals, in Khmer, Hindi and English languages, all texts being equally authentic. In the event of discrepancy the English text shall prevail.