3d freestanding dna nanostructure hybrid as a low-density
TRANSCRIPT

S1
3D Freestanding DNA Nanostructure Hybrid as a Low-Density High-Strength Material
Feng Zhou†, Wei Sun‡§, Chen Zhang†, Jie Shen‡§, Peng Yin*‡§, and Haitao Liu*† † Department of Chemistry, University of Pittsburgh, Pittsburgh, Pennsylvania 15260, United States ‡ Wyss Institute for Biologically Inspired Engineering, Harvard University, Boston, Massachusetts 02115, United States § Department of Systems Biology, Harvard Medical School, Boston, Massachusetts 02115, United States
Supporting Information
Estimation of the density of uranyl stained DNA tetrahedron
The average molecular weight of the deoxyribonucleic acid base is 324.5 and the DNA tetrahedron is 20 MD. The number of phosphate groups in DNA tetrahedron is about 6000. Assuming one uranyl ion (UO22+) binds to each phosphate group in DNA,s1 the molecular weight of attached uranyl ions is about 16.6 MD. The effective volume of the DNA nanostructure is assumed as the volume of the cylinder containing the DNA tetrahedron, which is 8.6 x 10⁻²² m3. Then the density of strengthened DNA tetrahedron is calculated to be 70.7 kg/m3.
Calculation of effective hardness and Young’s modulus of the free-standing DNA tetrahedron
To further understand the excellence of this free-standing nanostructure, hardness/density and stiffness/density was investigated. The effective hardness and young’s modulus of the nanostructure were defined by:
σ = F/A0
𝐸 =𝐹/𝐴!𝛥𝐿/𝐿!
Where
F is the collapsing force collected from the force mapping

S2
A0 is the effective surface area that the free-standing tetrahedrons covered; A0 = 1002*√3/4 nm2
E is the Young's modulus (modulus of elasticity) ΔL is the displacement in the linear force response before collapsing L0 is the displacement between the point-contact and unloading
Euler Buckling analysis of the Young’s modulus of the individual rod in the DNA tetrahedron
The axial load (F) on the column is the axial component of the collapsing force (FC) applied on the top apex of DNA tetrahedron from the AFM tip, which is
𝐹 = 𝐹"/√6
The critical force loaded on the column can also be calculated using Euler Buckling formula
𝐹 = 𝜋#𝐸𝐼(𝐾𝐿)#
Where E = Young’s modulus,
I = area moment of inertia of the cross section of the rod with a radius r (5.8 nm), which is 1/4π𝑟$.
L = unsupported length of DNA rod (100 nm).
K = column effective length factor. In the case of the DNA rod, the bottom end is fixed on the ground and the top end is free to move laterally, so K = 2.0.
Estimation of the capillary force on the DNA tetrahedron when drying from 9/1 (v/v) ethanol/water mixture
Two models are discussed in this manner.
1. During drying, water evaporates and exposes the apex of the DNA tetrahedron above the water meniscus (Figure S4A). In this case, the capillary force is generated by the surface tension at the liquid-gas-DNA interface, along the DNA rod, and is pointing towards the center of tetrahedron (Figure S4A inset). The downward capillary force experienced by the DNA tetrahedron is calculate as:
𝐹 = 352/3𝜋𝑑𝜎

S3
Where F is the downward fraction of capillary force on the DNA tetrahedron,
d is the diameter of the DNA rod, i.e. 11.5 nm from the TEM results,
σ is the surface tension of the 9/1 (v/v) ethanol/water solution, i.e. 23.23mN/m at 20 oC
Thus, the equation gives the downward fraction of capillary force on the DNA tetrahedron as 2.1
2. During drying, water outside of the DNA tetrahedron evaporates and leaves the DNA tetrahedron frame filled with water (Figure S4B). In this case, the capillary force is generated by the surface tension at the liquid-gas-DNA interface, on the DNA rod, and is pointing towards the center of tetrahedron. The capillary force on each DNA rod is calculated as:
𝐹 = 252/3𝑎𝜎
Where F is the capillary force on the DNA rod,
a is the length of the DNA rod, i.e. 100 nm,
σ is the surface tension of the 9/1 (v/v) ethanol/water solution, i.e. 23.23mN/m at 20 oC (Note: the composition of the liquid is expected to change during the drying process).
Thus, the equation gives the capillary force as 3.8 nN on each rod, pointing to the tetrahedron center.
Figure S1. Two cartoon models of DNA tetrahedron during the evaporation of water. (A) Water evaporates and exposes the apex of the DNA tetrahedron above the water meniscus. (B) Water outside of the DNA tetrahedron evaporates and leaves the DNA tetrahedron frame filled with water.

S4
Figure S2. (A) A large area AFM image showing the general topography of the DNA tetrahedron deposited on mica in air. (B and C) Zoomed-in views showing the structure of free-standing DNA tetrahedrons. Note: Figure S2B is magnified from Figure S2A.

S5
Figure S3. Representative TEM image and thickness plot of free-standing DNA tetrahedron. The blue arrows indicate the edge of the DNA rod and the measured thickness is 15.8 nm.

S6
Figure S4. (A) Freeze-dried DNA tetrahedron structures without staining. (B) Stained DNA tetrahedron structures without freeze drying. Note: The collapse of a soft 3D structure onto a 2D surface will produce a pattern that mimics its 2D projection, which includes pyramid-like patterns (Figure S4A).

S7
Figure S5. Individual approaching and retracting force curves of DNA tetrahedron after repeated indentation experiments (#36 to #41) capped at 5 nN in Figure 2A. Note: The force threshold cap was defined relative to the initial force value measured at ca. z = -200 nm.
-10 -8 -6 -4 -2 0-6
-4
-2
0
2
4
6
8
10
12 36
forc
e (n
N)
Z (nm)-10 -8 -6 -4 -2 0 2
-6
-4
-2
0
2
4
6
8
10
12 38
forc
e (n
N)
Z (nm)
-10 -8 -6 -4 -2 0-6
-4
-2
0
2
4
6
8
10
12 39
forc
e (n
N)
Z (nm)-10 -8 -6 -4 -2 0
-6
-4
-2
0
2
4
6
8
10
12
14 40
forc
e (n
N)
Z (nm)-10 -8 -6 -4 -2 0 2
-6
-4
-2
0
2
4
6
8
10
12 41
forc
e (n
N)
Z (nm)
-10 -8 -6 -4 -2 0 2-6
-4
-2
0
2
4
6
8
10
12 37
forc
e (n
N)
Z (nm)

S8
Figure S6. Reversible indentation of free-standing DNA tetrahedron on the same spot. Piled approaching and retracting force curves of DNA tetrahedron after repeated indentations capped at (A) 10 nN, (B) 20 nN, (C) 100 nN, (D) 200 nN, and (E) 300 nN show the reversible and irreversible compression process. The labeling inside each figure indicates the sequence of indentation experiments. Note: The force threshold cap was defined relative to the initial force value measured at ca. z = -200 nm. The AFM images of DNA tetrahedron (F) before and (G) after the whole indentation experiments show the change of topography of the same spot. (H) The cross-sectional analysis of the DNA tetrahedron before and after indentation experiments shows the decrease of height after irreversible indentation on the nanostructure.

S9
Figure S7, AFM image and cross-sectional analysis of DNA tetrahedron after indentation experiments.
S10
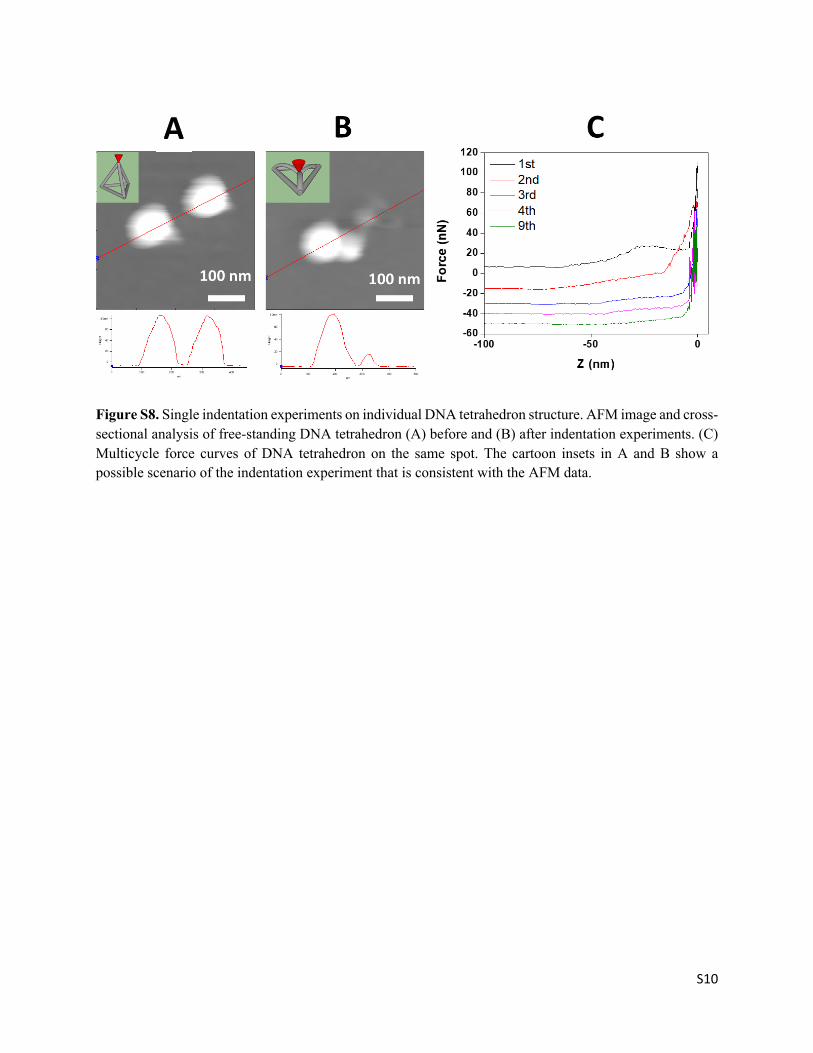
Figure S8. Single indentation experiments on individual DNA tetrahedron structure. AFM image and cross-sectional analysis of free-standing DNA tetrahedron (A) before and (B) after indentation experiments. (C) Multicycle force curves of DNA tetrahedron on the same spot. The cartoon insets in A and B show a possible scenario of the indentation experiment that is consistent with the AFM data.

S11
Figure S9. AFM image of force-mapping pre-scan (10 nN of threshold force). This data was used to confirm the location of the DNA nanostructure measured in Figure 2.

S12
REFERENCES
S1. Hayat, M. A. Stains and Cytochemical Methods. Springer US: New York, 1993; pp. 362.