3d chromatin conformation correlates with replication timing and is
TRANSCRIPT

3D chromatin conformation correlates withreplication timing and is conserved in resting cellsBenoit Moindrot1,3, Benjamin Audit2,3, Petra Klous4, Antoine Baker2,3, Claude Thermes5,
Wouter de Laat4, Philippe Bouvet1,3, Fabien Mongelard1,3 and Alain Arneodo2,3,*
1Laboratoire Joliot-Curie, 2Laboratoire de Physique, Ecole Normale Superieure de Lyon, CNRS, F-69007 Lyon,France, 3Universite de Lyon, F-69000 Lyon, France, 4Hubrecht Institute-KNAW and University Medical CenterUtrecht, Uppsalalaan 8, 3584 CT Utrecht, The Netherlands and 5Centre de Genetique Moleculaire (CNRSUPR3404), Allee de la Terrasse, 91198 Gif-sur-Yvette, France
Received June 5, 2012; Revised July 6, 2012; Accepted July 10, 2012
ABSTRACT
Although chromatin folding is known to be of func-tional importance to control the gene expressionprogram, less is known regarding its interplay withDNA replication. Here, using Circular ChromatinConformation Capture combined with high-throughput sequencing, we identified megabase-sized self-interacting domains in the nucleus of ahuman lymphoblastoid cell line, as well as incycling and resting peripheral blood mononuclearcells (PBMC). Strikingly, the boundaries of thosedomains coincide with early-initiation zones inevery cell types. Preferential interactions have beenobserved between the consecutive early-initiationzones, but also between those separated by severaltens of megabases. Thus, the 3D conformation ofchromatin is strongly correlated with the replicationtiming along the whole chromosome. We further-more provide direct clues that, in addition to thetiming value per se, the shape of the timing profileat a given locus defines its set of genomiccontacts. As this timing-related scheme of chroma-tin organization exists in lymphoblastoid cells,resting and cycling PBMC, this indicates that it ismaintained several weeks or months after theprevious S-phase. Lastly, our work highlights thatthe major chromatin changes accompanying PBMCentry into cell cycle occur while keeping largely un-changed the long-range chromatin contacts.
INTRODUCTION
The timely firing of replication origins is essential for mosteukaryotic cells to allow the proper duplication of thegenetic material during the S-phase. Replication origins
are activated according to a specific temporal programthat has been studied in various species allowing to distin-guish sequences replicated in the early S-phase from se-quences replicated later (1–15). The replication timing ismainly cell-type specific, even if some loci exhibit a strongconservation of the replication timing over different celltypes (8–14,16). The replication timing is significantlycorrelated with genomic and epigenetic features (reviewedin (17)). For instance, most of the early-replicated regionsare gene-rich, transcriptionally active and localized inopen chromatin, while the late-replicated regions aremostly found in silent, gene-poor and closed chromatin(2–8,14,18,19). The replication timing thus reflects severalgenomic, epigenetic and functional characteristics.
Besides linear features of chromatin, DNA replicationhas been related to the 3D organization of the nucleus.The replication occurs at discrete foci in the nucleus ac-cording to a specific spatiotemporal organization (20,21).Throughout the S-phase, new replication foci de novoassemble immediately next to the previously active ones(22–25), and a substantial segregation between early- andlate-replicated loci has been observed (26–29). In addition,from the observation that thousands of replication forksare only found in hundreds of discrete BrdU-labeled foci,it has been proposed that DNA sequences replicating atthe same time could gather (27,30–33), possibly throughthe anchoring of giant chromatin loops on the nuclearskeleton (reviewed in (34–36)). Courbet et al. (37)carried out elegant experiments showing that the size ofthe nuclear skeleton-anchored loops clearly depends onthe velocity of the fork and on the density of initiations.They observed that experimental slowing down of replica-tion forks is compensated for by the mobilization of latentreplication origins in the subsequent S-phase, and by theformation of smaller chromatin loops. This argues infavor of a replication-related high-order folding of chro-matin. The recent availability of replication timing data in
*To whom correspondence should be addressed. Tel: +33 4 7272 8757; Fax: + 33 4 7272 8080; Email: [email protected]
9470–9481 Nucleic Acids Research, 2012, Vol. 40, No. 19 Published online 8 August 2012doi:10.1093/nar/gks736
� The Author(s) 2012. Published by Oxford University Press.This is an Open Access article distributed under the terms of the Creative Commons Attribution Non-Commercial License (http://creativecommons.org/licenses/by-nc/3.0), which permits unrestricted non-commercial use, distribution, and reproduction in any medium, provided the original work is properly cited.
Downloaded from https://academic.oup.com/nar/article-abstract/40/19/9470/2414837by gueston 13 February 2018

several cell lines now offers the opportunity to test thisidea more systematically and to address to which extenta structural counterpart exists to the functional replicationdomains identified from the replication timing. 3Cmethodologies (38) have emerged as powerful strategiesto analyze in detail the long-range folding of chromatinand by extension, the chromosome organization in thenucleus. Different genome-wide mapping strategies havebeen developed (39), including circular chromosome con-formation capture (4C) for the highly detailed analysis ofDNA contacts made by selected loci (40,41), and Hi–C fora more global pairwise comparison of contacts between allgenomic loci (42).
Hi–C data have already been compared to the replica-tion timing of related cell lines (13,14). Ryba et al. (14)observed a tight link between the replication timing andthe Hi–C correlation matrices (principal eigenvector),showing that sequences localized near each other replicateat similar time. Moreover, Yaffe et al. (13) numbered moreinterchromosomal interactions than expected betweenregions having similar replication timing. However, theHi–C data do not always allow the direct visualization ofthe chromatin contacts for chosen loci, principally becauseof insufficient sequencing depth to cover all the combina-torial possibilities. Moreover, the normalization per-formed in the analysis of Hi–C data (42) gave as muchweight to the very-distant interactions (over tens ofmegabases) as to the more local contacts (below fewmegabases), despite the fact that the latter are the mostfrequent ones. Essential points thus remain to be ad-dressed. First, a closer analysis of the local contacts mayhighlight replication timing-related structural domains inthe nucleus. Then, a description of the contacts along thewhole chromosome will determine if each locus replicatingat the onset of the S-phase can be contacted by a givenearly-replicated viewpoint. Lastly, the comparison of thecontacts in quiescent and cycling cells will address thequestion of their long-term persistence in resting cells.
Here, we used the 4C methodology (40) in order toidentify with high precision the main partners ofmultiple early- and late-replicated regions and to deter-mine to which extent the 3D organization of chromatincan be linked to the replication timing. For this study, wefocused on a large region (20Mb) of the human genome inwhich the replication timing presents large fluctuationsthat are conserved in most examined cell types(Supplementary Figure S1). In particular, these fluctu-ations define loci replicating earlier than their immediatesurroundings (timing peaks), and conversely regionsreplicating latter than the surroundings (timing valleys).4C experiments were performed in a lymphoblastoid cellline, in resting and in cycling peripheral blood mononu-clear cells (PBMC) using 10 viewpoints in the selectedregion. We observed, and confirmed by fluorescentin-situ hybridizations (FISH) experiments, that earlytiming peaks coincide with frontiers limiting the spreadingof strong local interactions and delineating megabase-sized 3D-structural domains. In addition, at larger dis-tances, profiles of long-range interactions from timingpeaks viewpoints faithfully reproduce the replicationtiming profile, which sheds a new light on the propensity
of early- and late-replicating regions to contact otherchromosome regions. These results are robustly observedin cycling and G0-blocked cells, indicating that theobserved organization exists in G0 and does not resultfrom the ongoing DNA replication.
MATERIALS AND METHODS
Cell culture
A human lymphoblastoid cell line and PBMCwere grown at37�C with 5% CO2 in RPMI supplemented with 10% fetalbovine serum, glutamax and penicillin/streptomycin. PBMC,which are mostly lymphocytes (43), were isolated fromhealthy donors using Leucosep� (Greiner bio-one) andFicoll-Paque PLUS (GE Healthcare) according to manufac-turer’s instructions. PBMC stimulation was performed bysupplementing the culture medium with 1.5% Phytohemag-glutinin (PHAMForm, Life Technology) for 68h. Amillionstimulated PBMC were fixed with cold ethanol and stainedwith propidium iodide (20mg/ml, 30min 37�C) for cell-cycleanalysis (LSRII, FACSDivaTM, BD Biosciences).
4C protocol and sequencing
Cells were processed for 4C experiment as previouslydescribed (40,44,45) with only minor modifications. Cellswere dispatched into 7 millions cell aliquots. All aliquotswere fixed in phosphate buffered saline 10% SVF and 2%PFA (10min, RT), lysed in 10mM Tris, 10mM NaCl,0.3%NP-40 and dounced (B pestle). The cross-linked chro-matin was digested overnight with 600U of HindIII(Promega) and ligated with 150U of T4 DNA ligase(Fermentas). The templates were further cut with 50UHin1II (Fermentas) and circularized with 300U T4 DNAligase (Fermentas). DNA was purified with phenol extrac-tion followed by an ethanol precipitation, and chromatog-raphy (Roche High Pure PCR Product Purification Kit).DNA concentration was measured by fluorimetry(Quant-iTTM dsDNA Assay Kit, Broad Range, LifeTechnology). For every primer pair used, 10 PCRs wereperformed on 200 ng input DNA (for primer sequences,see Supplementary Table S1). For primer design, we useda strategy similar to that described in Splinter et al. (44) andNoordermeer et al. (45). PCR products were sequencedusing a Solexa Genome Analyser IIx or Solexa Hi-Seq2000 (76bp). Reads were first processed to identify theviewpoints and then mapped on the human genome(UCSC hg18 assembly) using Seqmap software (46). Onlyreads annealing on HindIII restriction sites were kept forsubsequent analyses.
4C analyses
The RAW 4C signal consists in the number of reads perrestriction site. For local analyses, a running mean wasapplied on the RAW signal with a window size of 20 re-striction sites. To compare local 4C profiles between celllines (Figure 1C) the running mean signal was divided bythe total number of reads corresponding to the chromo-some 5. For chromosome-wide and genome-wideanalyses, we defined a long-range interaction frequency
Nucleic Acids Research, 2012, Vol. 40, No. 19 9471
Downloaded from https://academic.oup.com/nar/article-abstract/40/19/9470/2414837by gueston 13 February 2018

(LRIF) variable that reinforces the contribution oflow-abundance densely packed reads. The LRIF signalis defined as the percentage of restriction sites coveredby reads in a 500-kb sliding window (coverage)� themean number of reads in this sliding window. Thesliding step was 100 kb. To compare the LRIF signalbetween cell lines, its value was divided by the totalnumber of reads on the chromosome 5. Maxima fromthe LRIF signal were detected using an amplitude thresh-old-based algorithm (Matlab, The Mathworks). All plotswere generated using Matlab. Heat-maps of pairwise
distances between 4C peaks were generated by quantifyingthe percentage of cases where the distances between the 4Cpeaks are <250 kb. The value of this percentage wasencoded using a green–red colormap. Matlab linkagefunction was used to perform the hierarchical clustering.
FISH experiments
We selected PBMC to perform FISH experiments, thusavoiding ambiguities due to cells in S or G2 phase exhibit-ing replication doublets. Resting PBMC were swollen in
Figure 1. 4C interaction profiles associated with replication timing in lymphoblastoid cells (A) MRT of the lymphoblastoid cell line Gm06990, in theportion 150–170Mb of human chromosome 5 (11). Early (respectively, late) replicating sequences correspond to MRT values �0 (respectively, �1).The arrowheads indicate the position of the viewpoints used for the 4C analysis. (B) Interaction frequencies profiles of the 10 viewpoints. For eachpanel, the light gray curve corresponds to the replication timing profile (right y-axis) and the colored filled curve to the 4C interaction frequencyprofile (left y-axis). The arrowheads indicate the position of the viewpoints; the thin arrows indicate sharp drops in interaction frequency coincidingwith early timing peaks; the curly brackets indicate partners of V3 and V4 viewpoints; and the dots indicate preferential partners of P viewpointscoinciding with timing peaks. (C) 4C interaction frequency is highly reproducible from one cell type to another. To normalize for differences in readnumbers, the running mean value (B) has been divided by the total number of reads mapped on chromosome 5 (red= lymphoblastoid,green=resting PBMC and blue=PHA-stimulated PBMC). Top, V4 viewpoint; bottom, P1 viewpoint. (D) Timing peaks correspond to zones ofsharp changes in 4C data interaction frequency. (Top) The position of timing peaks are marked along the MRT profile in Gm06990 (vertical bars).(Middle) space-scale representation of the 4C interaction frequencies of S- and V-viewpoints. Each horizontal line corresponds to the median value ofthe interaction frequency computed in sliding windows of size ranging from 200 kb to 1.35Mb. Due to the very large median-value dynamics, alogarithmic colormap was used (bottom).
9472 Nucleic Acids Research, 2012, Vol. 40, No. 19
Downloaded from https://academic.oup.com/nar/article-abstract/40/19/9470/2414837by gueston 13 February 2018

75mM KCl (30min, 37�C), fixed in methanol 3:1 aceticacid, and then spread on microscope glass slides. FISHprobes were generated by random priming on BACclones (Supplementary Table S2) using amino-allyldUTP. Probes were then coupled with amine-reactivealexa fluorophores (A488, A555 or A647, LifeTechnology). The specificity of BAC probes was testedby both restriction profile and hybridization on metaphasespreads. Hybridization of denatured probes (80�C, 5min)on denatured nuclei (73�C, 2min) were performed over-night at 37�C (in 50% formamide, 2�SSC, 10% dextran,10 mg single-stranded DNA, 1–3 mg human CotI). Slideswere mounted with fluoromount-G (Southern BioTech)and DAPI was used as DNA counterstain. Images werecollected using a wide-field Zeiss Axioimager (63�,Photometrics CoolSNAP HQ camera) and analyzed withImage J. The Rayleigh fits of measured distances
f x,�ð Þ ¼ x�2exp �x2
2�2
� �were performed using Matlab (� cor-
responds to the shape parameter). The mean square
physical distance is defined as r2� �¼ 2�2, according to
Yokota et al. (47).
Mean replication timing profiles and replicationU-domains
We used the mean replication timing (MRT) profiles alongthe complete human genome derived by Baker et al. (48)from Repli-Seq data (11,15). The signal analysis per-formed in (48) led to the segmentation of about half ofthe genome into replication timing domains correspondingto U-shaped MRT profiles (late-replicating core sur-rounded by two early-replicating loci). MRT profilesand U-domains coordinates for Gm06990 and K562were obtained directly from the authors.
Whole-genome Hi–C chromatin conformation dataanalysis
We used the spatial proximity maps of the human genomegenerated using Hi–C method (42). We downloaded100-kb resolution maps for Gm06990 and K562 celllines from the GEO web site (GSE18199 binnedheatmaps): http://www.ncbi.nlm.nih.gov/geo/query/acc.cgi?acc=GSE18199. Interaction counts between loci onsame chromosome were normalized by the meanintrachromosomal interaction count averaged over allpairs of loci separated by the same genomic distance. Toproperly analyze the behavior of interaction frequenciesacross timing peaks, we selected well-defined timingpeaks that are shared by two consecutive U-shaped repli-cation timing domains (48). We then extracted, from theHi–C interaction ratio matrices, two 4C-like interactionprofiles converging to the shared timing peak: the firstone coming from the leftmost U-domain border and thesecond one coming from the rightmost U-domain border.All 4C-like interaction ratio profiles were finally averagedafter rescaling the distances so that the U domain size was1 (Figure 5, top).
RESULTS
We used 4C in combination with high-throughputsequencing (4C-seq) (44) to explore the correlationbetween replication timing and chromosome 3D structure.4C is used to capture, in the whole genome, the loci inter-acting with a chosen sequence, namely the viewpoint. Wefocused on a large (20Mb) region of human chromosome5 in which the replication timing measured in Gm06990lymphoblastoid cell line presents large fluctuations and ishighly conserved in different cell types (SupplementaryFigure S1). As the replication timing of lymphoblastoidcells appears extremely similar, even when comparing es-tablished cell lines from different sources and histories(49), the replication timing of the lymphoblastoid cellline used in this study is very likely close to the one ofGm06990.The shape of the timing profile in the selected 20Mb
displays timing peaks, i.e. regions replicating earlier thantheir immediate surroundings, and conversely local timingvalleys (replicating later than their surroundings). 4Cviewpoints were then unambiguously positioned on somelocal timing peaks or in timing valleys (Figure 1A). Fiveviewpoints were selected on early peaks (P1–P5), three invery late valleys (V1, V3 and V4), one in a valley of inter-mediate timing (mid S-phase, V2) and one in a transitionfrom very early to mid S-phase (S). The local chromatinand genomic features around the viewpoints are shown inSupplementary Figure S2. A mean of 2.6 millions readsper viewpoint was generated in lymphoblastoid cells(Supplementary Table S3). About 76% of the mappedreads are located on chromosome 5 and a much lowerread density was observed in other chromosomes(Supplementary Table S4), which is in agreement withthe existence of chromosome territories. Similar propor-tions of intrachromosomal interactions were observed forthe other cell types used in the study. Within chromosome5, most contacts were local and the interaction frequenciesrapidly dropped with increasing genomic separation(Supplementary Table S3), as previously reported (39).
Early timing peaks delineate structural self-interactingdomains and preferentially contact each other
4C data were locally averaged using a running meanwithin a window of 20 HindIII sites (�100 kb). Theplots show that interaction frequencies of the valley view-points (V1, V2, V3 and V4), as well as of the S viewpoint,quickly decrease to a few percents of the maximum signalover a few megabases distance from the considered view-point (Figure 1B). This decrease does not follow a simplepattern; indeed, sharp drops can be seen. Strikingly, mostof these drops seem to be localized at, or close to, timingpeaks (Figure 1B, arrows). This suggests that contactsbetween late-replicating regions are somehow limited byintervening timing peaks. To further illustrate the exist-ence of these sharp drops in the 4C profiles, we displayed4C data using a space-scale representation. Since 4C rawsignals present strong deviations from the local mean, werepresented the median value in sliding windows of sizeranging from 200 kb to 1.35Mb. The resulting imageswere obtained by encoding the median values with a
Nucleic Acids Research, 2012, Vol. 40, No. 19 9473
Downloaded from https://academic.oup.com/nar/article-abstract/40/19/9470/2414837by gueston 13 February 2018

logarithmic color map (Figure 1D). It became apparentthat 4C signal amplitudes are larger within a domainbordered by two timing peaks, and that clear transitionsoccur at timing peaks. This analysis confirmed that timingpeaks delineate frontiers limiting the DNA contacts ofneighboring late-replicating regions, and thus sheds lighton the existence of self-interacting chromosomal domainsbordered by timing peaks. Interestingly, beyond this localregime, late-replicated loci preferentially interact withother late-replicating regions, as can be seen for thelong-range interactions of the V3 and V4 valley viewpoints(Figure 1B, curly brackets).The interaction frequencies obtained with viewpoints
localized on timing peaks (P1–P5) display profilesstrongly different from those of the valley viewpoints.P1, P2 and P4 (and to a lesser extent P3) profiles exhibitpreferential contacts with nearly every neighboring timingpeak, even with those located 10-Mb away (Figure 1B,dots), showing that they loop out the intervening late-replicating domains to contact each other (see also thespace-scale representation in Supplementary Figure S3).Although localized on an early peak, the P5 viewpointdoes not display specific contacts with other timingpeaks, which might be due to specific features of this view-point (see ‘Discussion’ section). Interestingly, whereas thecontacts between timing valleys are spread over megabases(Figure 1D, curly brackets), the contacts betweenearly timing peaks are restricted to shorter distances(Figure 1D, dots), suggesting the existence of a strongerand more specific anchoring mechanism between earlytiming peaks than between late regions.To address whether this replication-related 3D organ-
ization of chromatin is also found in non-cycling cells, weperformed similar analyses in resting PBMC, and, as acontrol, in cycling phytohemagglutinin-stimulatedPBMC (Supplementary Figure S4). For both cell types,we used the replication timing of Gm06990 cell line as areference since the timing profile in the region containingthe viewpoints is remarkably similar in different cell types(Supplementary Figure S1) and since B- and T-cells havedivergent timing on only 4.5% of the genome (49). Thelocal 4C profiles obtained with the three differentcell types remarkably superimpose on each other(Figure 1C), arguing for the existence of a robust andcommon 3D chromatin conformation. In resting andcycling PBMC, we also observed frontiers localized attiming peaks that prevent the contacts of neighboringlate-replicated regions (Figure 1C and SupplementaryFigures S5 and S6). In addition, using timing peaks asviewpoints, we noticed preferred contacts with everytiming peak. This not only confirms the preferentialcontacts between early-replicated regions as previouslyobserved (13), but more strikingly also shows that thecontact frequency profile is strongly correlated with thetiming profile in the three related cell types. Moreover,the fact that the local conformation in resting PBMC issimilar to the one in cycling cells implies that this correl-ation exists in G0 and does not result from ongoing DNAreplication. It suggests that this organization pattern isconserved all along the cell cycle.
LRIF profiles faithfully reproduce the replicationtiming profile
In 4C experiments, the measured interaction frequencieshave been shown to rapidly drop with increasing genomicdistance (50). As a consequence, only few informativeligation events can be captured while analyzing long-rangecontacts. To collect the long-range contacts, it has beenshown that the contribution of isolated reads improperlyamplified by PCR should be diminished, and the contri-bution of low-abundance densely packed reads reinforced(40). Accordingly, we defined a variable called LRIF (see‘Materials and Methods’ section) that operates such a fil-tering. While the LRIF signal is synchronous with thecoverage and the running mean defined at 500 kb(Supplementary Figure S7), it offers better signal-to-noise ratio, facilitating subsequent analyses.
All along the chromosome, the long-range contactsobtained from V1, V3 and V4 on the one hand, andfrom P1, P2, P3 and P4 on the other hand, displayopposed oscillations in the three cell types tested, i.e. Pviewpoints maxima coincided with V viewpoints minimaand vice versa (Figure 2A and B and SupplementaryFigure S8). To quantify this observation for each view-point on the whole chromosome 5, we detected long-rangecontacts by local maxima in the LRIF signal, andmeasured the pairwise distances separating each localmaximum from the closest local maximum of anotherviewpoint. As an illustration of the results, the histogramof distances between P4 and P1 peaks is centered at zero,indicating that the long-range contacts of P1 and P4 view-points overlap and that P1 and P4 viewpoints indeedinteract with the same partners (Figure 2D). On thecontrary, the V4–P1 distance distribution is clearlydepleted around zero, showing that V4 and P1 have dif-ferent distant partners (Figure 2D). To depict all thepairwise combinations, we generated a heat-mapin which a green–red colormap quantifies overlap oflong-range contacts identified from LRIF signals(Figure 2E). The unbiased hierarchical clustering per-formed revealed the existence of three groups. The firstone corresponds to viewpoints on timing peaks P1, P2,P3 and P4 that display LRIF signal in opposition ofphase with the second group that includes valley view-points V1, V3 and V4. The third group corresponds toV2, S and P5 viewpoints that display intermediate 4Cprofiles; the hierarchical clustering performed yet tendsto position them closer to early viewpoints than to lateones. Similar results were obtained with the three celllines used in this study, showing the remarkable conserva-tion of the long-range interactions frequencies (Figure 2Cand E). Taken together, we conclude that chromosomaldomains with opposite replication timing tend to segregatein nuclear space, and they do so even in non-dividing qui-escent cells.
We then asked to which extent the long-range partnersof every viewpoint coincide with timing peaks. We there-fore measured, for each viewpoint and on the wholegenome, the distances between every 4C peaks and theclosest timing peak. The obtained histograms forlymphoblastoid cells (Figure 3A) clearly show that the
9474 Nucleic Acids Research, 2012, Vol. 40, No. 19
Downloaded from https://academic.oup.com/nar/article-abstract/40/19/9470/2414837by gueston 13 February 2018

Figure 2. Chromosomal domains with opposite replication timing segregate in the nuclear space. (A) LRIF in lymphoblastoid cells for the 10viewpoints (see text and Materials and Methods’ section for the definitions). The colored filled curves correspond to the 4C profiles in a region ofchromosome 5 centered �60Mb upstream of the viewpoints. The light gray lines correspond to the replication timing in lymphoblastoid cells (11)plotted with the same y-axis as in Figure 1A. (B) Similar analysis performed with resting PBMC. (C) Comparison of LRIF values of the P1viewpoint in lymphoblastoid cells (red), resting PBMC (green) and PHA-stimulated PBMC (blue). LRIF values have been normalized for differencesin read numbers. The upper panel corresponds to the replication timing in lymphoblastoid cells. (D) Distribution of distances between the 4C peaksdetected in the LRIF profiles. We detected the 4C peaks and measured the distances between each of them and the closest 4C peak obtained withanother viewpoint. All pairwise distances were measured over the whole chromosome 5. Three distance distribution histograms are shown here asexamples (V4–P1, V4–V3 and P4–P1). A distribution centered on zero (as P4–P1) indicates that the LRIF maxima of the two viewpoints overlap.(E) To quantify the similarities between LRIF signals from different viewpoints, we calculated the percentage of occurrences where the pairwisedistances measured in (D) are <250 kb. This percentage was encoded with a green–red color map. Similar signals are green (V4/V3 and P4/P1),whereas out of phase signals are red (V4/P1). The asterisks correspond to the distribution histograms shown in (D).
Nucleic Acids Research, 2012, Vol. 40, No. 19 9475
Downloaded from https://academic.oup.com/nar/article-abstract/40/19/9470/2414837by gueston 13 February 2018

long-range contacts of the P4 viewpoint, for example, areclose to timing peaks, as the histogram is centered on zero.On the contrary, the histogram for the V3 viewpoint isdepleted in values around zero indicating that V3partners are away from timing peaks. V2 viewpointexhibits an intermediate situation: the distribution histo-gram is neither peaked nor depleted around zero. Todepict this information for all viewpoints and the threecell lines, a green–red colormap was used to show the co-incidence between timing peaks and long-range contacts(Figure 3B). Our results show that the long-range partnersof P1, P2, P3 and P4 viewpoints overlap with timing peaksfor the whole genome. Conversely, V1, V3 and V4 do notinteract with timing peaks.Overall, we observed that the LRIF profiles correlate
genome wide with replication timing. Strikingly, they alsoreproduce the replication timing signal over very large dis-tances along the chromosome 5, meaning that a giventiming peak can interact with any other timing peak ofthe whole chromosome 5. Interestingly, similar tendencycan still be observed on other chromosomes(Supplementary Figure S9), albeit with a much lowerinteraction strength (about two orders of magnitude).The fact that the interaction frequency profiles tightlyfollow the replication timing strongly argues in favor ofa replication imprint on chromatin organization.
In-situ distance measurements confirm thephysical proximity between loci corresponding toearly timing peaks
To test whether some of the contacts captured by the4C-sequencing (4C-Seq), which reflect chromatin foldingat the population level, can be observed in single cells, weperformed FISH in resting PBMC. We selected BACprobes localized in the 150–170Mb portion of humanchromosome 5. Using three colors FISH, we measuredthree different sets of physical distances, a first one (EE)
corresponding to distances between two local timingpeaks, a second set (LL) corresponding to distancesbetween two timing valleys and a third set (LE) corres-ponding to distances between a peak and a valley(Figure 4A). Results can be depicted by cumulative histo-grams. For example, as predicted by the 4C results, the d5(EE) physical distance is smaller than d17 (LE) even if bothcorrespond to a 7.6Mb genomic length (Figure 4C(3),P< 10�8, Student’s t-test with a-risk of 0.05).Furthermore, the d3 physical distance (EE) is slightlysmaller than d1 (LE) and d2 (LE) although d3 correspondsto a much larger DNA fragment than both d1 and d2(Figure 4C(1)). Likewise, d28, d29 and d30 presentsimilar physical distances although d30 (EE) correspondsto a genomic length twice larger than the LE distances d29and d30 (Figure 4C(2)). From these three examples, weconcluded that d3, d5 and d30, which correspond tophysical distances between timing-peaked regions, aresmaller than expected if the genomic separation was theonly parameter determining the 3D distance in the nucleus.
It is established that the distance histograms can beeasily fitted by a Rayleigh law (Figure 4D) that onlydepends on a single parameter � (see ‘Materials andMethods’ section). This Rayleigh parameter perfectly de-scribes the shape of the obtained histograms and can beused to define, for each probe combination, the corres-ponding mean square physical distance (47). We plottedthe mean square physical distance as a function of thegenomic separation between the probes (Figure 4E).Only the dots corresponding to EE distances are labeledin Figure 4E, but complete labels and pairwise statisticscan be found in Supplementary Figure S10. Among thedots deviating from the mean tendency, most correspondto peak-to-peak distances (d3, d30, d5, d18 and to a lesserextent d6). In particular, d3 is the smallest physicaldistance, in agreement with 4C results showing that thestrongest interaction in PBMC occurs between P3 and P4peaks (Supplementary Figure S5). This indicates that, for
Figure 3. Viewpoints localized on local timing peaks mostly interact with other timing-peaked regions. (A) Histograms of the distance between every4C peak and the closest timing peak on the whole genome. 4C peaks were detected in the whole genome, we then measured the distance betweeneach of them and the closest timing peak. The three histograms represent theses distances measured in lymphoblastoid cells for P4 (left), V3 (middle)and V2 (right) viewpoints. A distribution centered on zero (P4) indicated that the 4C peaks are close to timing peaks. n=number of 4C peaksdetected. (B) We computed the percentage of distances <250 kb and represented this value with a green–red color map. 4C signals in phase with thereplication timing are green (P4) whereas anti-correlated signals are red (V3).
9476 Nucleic Acids Research, 2012, Vol. 40, No. 19
Downloaded from https://academic.oup.com/nar/article-abstract/40/19/9470/2414837by gueston 13 February 2018

Figure 4. FISH distance measurements confirm the physical proximity between early replicated regions. (A) Physical distances measured by threecolors FISH in resting PBMC. The arrowheads correspond to the positions of the used probes (Supplementary Table S2), and the line to themeasured distances. Three sets of measurements were performed: EE between two timing peaks, LL between two timing valleys and LE between atiming peak and a timing valley. (B) Example of FISH images in resting PBMC nuclei (d1=GB, d2=BR, d3=GR, d28=BR, d29=GR,d30=GB). On both chromosomes, the physical distances separating the gravity centers of the spots were measured in PBMC nuclei. (C) Cumulativedistance measurements. (1) d3 (3Mb) is slightly smaller than d1 (1.9Mb) and d2 (1.1Mb, P< 10�3, Student’s t-test). (2) d28, d29, d30 have the samephysical distance even if d30 is 5Mb and d28/d29 are �2.5Mb. (3) d5 is smaller than d17 even if they both cover 7.6Mb (P< 10�8, Student’s t-test).(D) Relative frequency histograms of d28 distance (2.5Mb). The green lines correspond to the fit of the frequency histograms by a Rayleigh law (see‘Materials and Methods’ section). (E) Mean squared physical distance ±95% confidence interval (see ‘Materials and Methods’ section and (47)) as afunction of the genomic separation. Red dots, measurement between two timing peaks (EE); blue, between two late regions (LL); green, between apeak and a timing valley (LE). Open dots correspond to distances measured inside a single replication domain; close dots correspond to distancesmeasured between different replication domains. Here, a replication domain is defined by its two timing peak borders surrounding a late-replicatedcore. P-values shown are evaluated for few EE distances and correspond to pairwise Student’s t-tests with other measured distances with similar(±15%) genomic separation. (F) Physical distances and interaction frequencies between two probes localized within the same replication domain orbetween two adjacent replication domains. Top: corresponding distances. Middle: as in (E). Bottom: percentage of cases where measured distancesare <0.3 mm. P-values correspond to pairwise Student’s t-tests.
Nucleic Acids Research, 2012, Vol. 40, No. 19 9477
Downloaded from https://academic.oup.com/nar/article-abstract/40/19/9470/2414837by gueston 13 February 2018
the same genomic separation, the physical distancebetween two early replicated loci tends to be smallerthan the distance between a late and an early replicatedlocus. Nevertheless, some early-to-early physical distancesare not smaller than the mean tendency (d4/d11, d12 andd15). Therefore, if 4C contacts are not necessarily seen byFISH, the FISH results largely agree with those obtainedin 4C experiments.We did not detect spatial proximity between probes in
timing valleys (Figure 4E). This may be explained by thefact that contacts between timing valleys are spread overthe width of the valleys (Figure 1B, curly brackets), sug-gesting a more relax interaction pattern betweenlate-replicated regions than between timing peaks. Thismay also reflect a relative discrepancy between the estab-lishment of contacts (as probed by 4C approach) and thephysical proximity seen by 2D-FISH.The 4C profiles in PBMC indicate that timing peaks are
found at frontiers limiting the contacts of neighboringlate-replicated regions (Supplementary Figure S5). Totest whether this is also observed by FISH, we performedmeasurements around the P4 timing peak. For compar-able genomic separation, physical distances measuredacross the timing peak tend to be larger than those per-formed in the valley (Figure 4F, middle). This tendency issupported by the frequency of colocalization betweenthe probes used above in the distance measurements(Figure 4F, bottom). Probes separated by the timingpeak less frequently colocalized than probes located inthe same timing valley. These observations strengthenthe conclusion that a timing peak can limit the interactioncapabilities of a late-replicated sequence with otherregions which thus contributes to define independentmegabase-sized self-interacting structural domains in thenucleus.
DISCUSSION
In the context of DNA replication, the study of structure–function relationships in the nucleus remains challenging.Indeed, some genomic and epigenetic features are of ut-termost importance in the definition of replication origin(reviewed in (51)) while replication itself leaves some evo-lutionary imprints in the genome (16,52,53). Here, we per-formed a series of 4C-Seq and FISH experiments thatreveal to which extent the 3D conformation of chromatinis linked to the replication timing.At the local scale (1–2Mb), that is the typical size of a
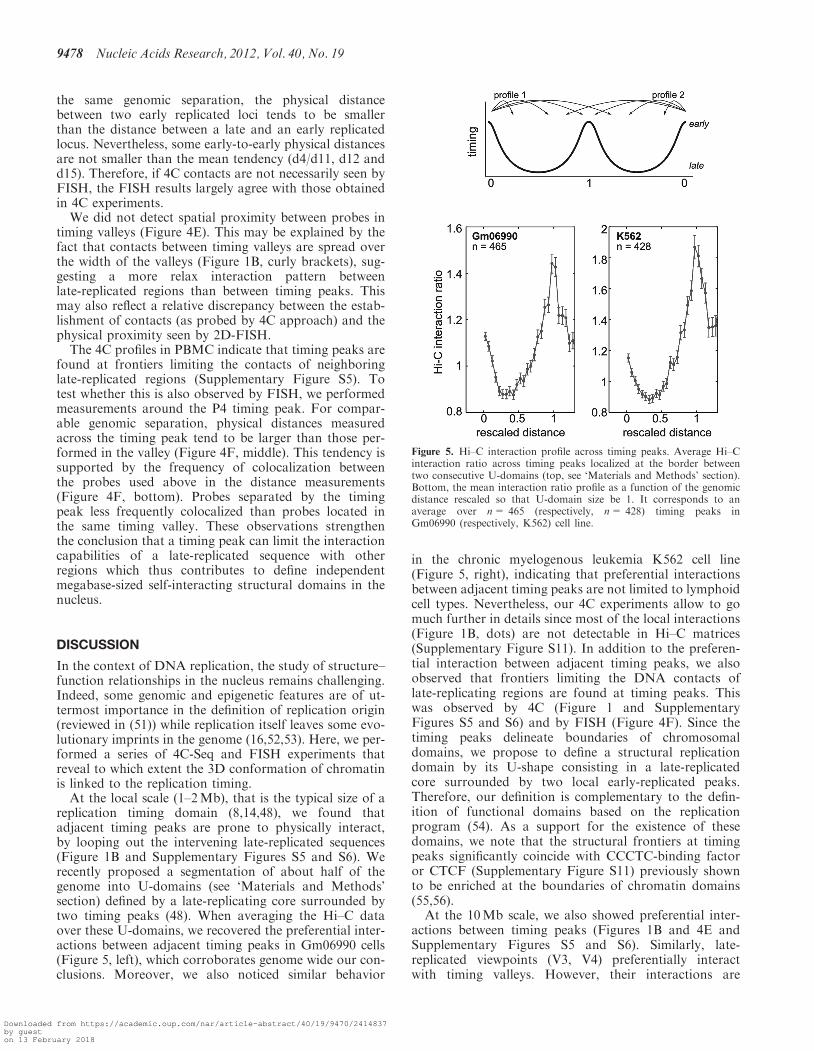
replication timing domain (8,14,48), we found thatadjacent timing peaks are prone to physically interact,by looping out the intervening late-replicated sequences(Figure 1B and Supplementary Figures S5 and S6). Werecently proposed a segmentation of about half of thegenome into U-domains (see ‘Materials and Methods’section) defined by a late-replicating core surrounded bytwo timing peaks (48). When averaging the Hi–C dataover these U-domains, we recovered the preferential inter-actions between adjacent timing peaks in Gm06990 cells(Figure 5, left), which corroborates genome wide our con-clusions. Moreover, we also noticed similar behavior
in the chronic myelogenous leukemia K562 cell line(Figure 5, right), indicating that preferential interactionsbetween adjacent timing peaks are not limited to lymphoidcell types. Nevertheless, our 4C experiments allow to gomuch further in details since most of the local interactions(Figure 1B, dots) are not detectable in Hi–C matrices(Supplementary Figure S11). In addition to the preferen-tial interaction between adjacent timing peaks, we alsoobserved that frontiers limiting the DNA contacts oflate-replicating regions are found at timing peaks. Thiswas observed by 4C (Figure 1 and SupplementaryFigures S5 and S6) and by FISH (Figure 4F). Since thetiming peaks delineate boundaries of chromosomaldomains, we propose to define a structural replicationdomain by its U-shape consisting in a late-replicatedcore surrounded by two local early-replicated peaks.Therefore, our definition is complementary to the defin-ition of functional domains based on the replicationprogram (54). As a support for the existence of thesedomains, we note that the structural frontiers at timingpeaks significantly coincide with CCCTC-binding factoror CTCF (Supplementary Figure S11) previously shownto be enriched at the boundaries of chromatin domains(55,56).
At the 10Mb scale, we also showed preferential inter-actions between timing peaks (Figures 1B and 4E andSupplementary Figures S5 and S6). Similarly, late-replicated viewpoints (V3, V4) preferentially interactwith timing valleys. However, their interactions are
Figure 5. Hi–C interaction profile across timing peaks. Average Hi–Cinteraction ratio across timing peaks localized at the border betweentwo consecutive U-domains (top, see ‘Materials and Methods’ section).Bottom, the mean interaction ratio profile as a function of the genomicdistance rescaled so that U-domain size be 1. It corresponds to anaverage over n= 465 (respectively, n= 428) timing peaks inGm06990 (respectively, K562) cell line.
9478 Nucleic Acids Research, 2012, Vol. 40, No. 19
Downloaded from https://academic.oup.com/nar/article-abstract/40/19/9470/2414837by gueston 13 February 2018

spread over almost the entire length of the valley,indicating a relative lack of specific partners (Figure 1Band Supplementary Figures S5 and S6). This mightexplain why we did not detect any physical proximity byFISH between late-replicated sequences (Figure 4E).
At the scale of entire chromosomes, we demonstratedthat chromosomal domains with an opposite replicationtiming are separated in the nuclear space (Figure 2E) andthat an early-replicated (respectively, late-replicated) locusinteracts with other timing peaks (respectively, timingvalleys; Figures 2A and B and 3). Previous works thatcompared Hi–C data and replication timing values,already proposed that synchronously replicated sequencesinteract more frequently than expected (13,14). However,the 4C protocol provides a much higher number of readsfor each viewpoint, thereby allowing the direct detectionof chromosome-wide interactions. The 4C signals of P1,P2 and P4 viewpoints faithfully reproduce the replicationtiming along the whole chromosome 5, which demon-strates the astonishing persistence, all over the chromo-some, of a timing-linked long-range conformation ofchromatin. In addition, our analysis showed that themid-S-phase replicated P4 peak has a long-rangeinteractions profile similar to those of P1, P2 and P3(Figure 2A and B and Supplementary Figure S8). Thismeans that it is probably not the precise replicationtiming value at a given peak that specifies the long-rangecontacts but rather the timing value relative to itssurroundings. The shape of the timing profile, with itslocal maxima, therefore better predicts the chromatincontacts than the fact of being replicated at the onset ofthe S-phase. This indicates that, irrespective of its replica-tion timing value, a timing peak may comprise determin-ants governing the structural conformation of chromatin.
This spatial segregation between early- and late-replicated domains is in agreement with previous resultsshowing the relative absence of interactions between active(early-replicated) and inactive (late-replicated) chromatin,both by 3C-derivated methodologies (40,42,57) and cyto-logical analyses (26–29). The nuclear processes explainingthis separation remain to be identified. Insight may comefrom the P3 viewpoint that is localized in transcriptionallysilent chromatin, �100-kb away from the nearest ex-pressed gene in PBMC. P3 exhibits in this cell type apositive correlation with the timing, albeit slightly lowerthan the one measured for P1, P2 and P4 viewpoints thatare localized within expressed genes (Figure 3 andSupplementary Figure S2). This might indicate that theinfluence of transcription and replication probably addsup to enhance the long-range interaction capabilities ofselected locus, maybe through the recruitment to spatiallycoordinated replication and transcription factories (58).This hypothesis is further sustained by the resultsobtained for P5. This viewpoint lies in a weakly expressedgene (Supplementary Figure S2) and is not located on asharp timing peak (350-kb shoulder in the replicationtiming curve; Figure 1). In that context, we assume thatthe contribution of both transcription and replication areweaker, explaining why P5 interactions with timing peakscannot be detected beyond the neighboring P4.
Our analysis revealed another striking property of chro-matin reorganization while lymphocytes exit quiescence.Quiescent cells and cycling cells are known to havedistinct nuclear organization (59–61). For instance,lymphocyte activation is associated with major changesin gene expression (62–66) and major histological modifi-cations of the nucleus with a doubling of nuclear volumeand a significant reduction of peripheral heterochromatin(67,68). Despite these important modifications of nucleararchitecture, a high similarity in local and long-rangechromatin contacts was observed between resting andactivated PBMC (Figures 1C and 2C). As PBMC cellswere efficiently pushed out of dormancy (SupplementaryFigure S4), the absence of differences between resting andactivated lymphocytes does not result from an inefficientPBMC activation by PHA. This implies that the histolo-gical disappearance of heterochromatin during lympho-cyte activation takes place without disruption of the4C-probed long-range interactions and while most of theneighboring relationships are maintained. The stability ofthese interactions may rely either on constant structuralelements ultimately determined by the genome sequence,either on some nuclear function shared by resting andcycling cells. As a support of the latter, it has beenshown that the quiescent C127 cells (mouse mammaryepithelial cells), when in vitro replicated, retain a replica-tion timing program similar to the one observed in cyclingC127 cells (61).In summary, using 4C-Seq experiments, we demonstrate
that the spatial segregation of early- and late-replicatingloci (13,14,26–29) is associated with the establishment ofrobust chromatin contacts. The 4C interaction profiles,supported by FISH, highlight the existence ofmegabase-sized self-interacting domains in the nucleuswhose boundaries coincide with early-initiation zones.Along the whole chromosome, we also directly observeda considerable correlation between the replication timingprofiles and the long-range contact frequencies of everyviewpoint, which could not be observed in previousstudies (13,14). Moreover, our work shows that it is notthe precise replication timing value that specifies thelong-range contacts but rather the timing value relativeto its surroundings. This chromatin organization schemeis shared by cycling and resting PBMC. This replication-associated structure stably observed in quiescent as well asin activated cells likely reflects some fundamental elementsof the chromosome 3D structure that remain to bedetermined.
SUPPLEMENTARY DATA
Supplementary Data are available at NAR Online:Supplementary Tables 1–4, Supplementary Figures 1–11and Supplementary References [8,11,14,15,44].
ACKNOWLEDGEMENTS
The authors are very grateful to D.M. Gilbert, O. Hyrien,H. Julienne and C. Vaillant for stimulating discussions.This work benefited from the expertise of the highthroughput sequencing platforms of IMAGIF (Centre de
Nucleic Acids Research, 2012, Vol. 40, No. 19 9479
Downloaded from https://academic.oup.com/nar/article-abstract/40/19/9470/2414837by gueston 13 February 2018

Recherche de Gif—www.imagif.cnrs.fr) and MGX-Montpellier GenomiX (http://www.mgx.cnrs.fr/). Theauthors also thank the PLATIM (PLAteau Techniqued’Imagerie et de Microscopie, IFR128, Lyon FRANCE)and the EFS (Etablissement Francais du Sang, LyonGerland).
FUNDING
The Agence Nationale de la Recherche (ANR)[REFOPOL, ANR 10 BLANC 1615]; Centre Nationalde la Recherche Scientifique (CNRS) ProjectsExploratories Premier Soutien [PEPS 2009]; Fondationpour la Recherche sur le Cancer [ARC ECL2010R01122]; European Molecular Biology Organization(EMBO) short-term Fellowships [ASTF-381.00-2008].Funding for open access charge: ANR [REFOPOL,ANR 10 BLANC 1615].
Conflict of interest statement. None declared.
REFERENCES
1. Raghuraman,M.K., Winzeler,E.A., Collingwood,D., Hunt,S.,Wodicka,L., Conway,A., Lockhart,D.J., Davis,R.W., Brewer,B.J.and Fangman,W.L. (2001) Replication dynamics of the yeastgenome. Science, 294, 115–121.
2. Schubeler,D., Scalzo,D., Kooperberg,C., van Steensel,B.,Delrow,J. and Groudine,M. (2002) Genome-wide DNAreplication profile for Drosophila melanogaster: a link betweentranscription and replication timing. Nat. Genet., 32, 438–442.
3. White,E.J., Emanuelsson,O., Scalzo,D., Royce,T., Kosak,S.,Oakeley,E.J., Weissman,S., Gerstein,M., Groudine,M., Snyder,M.et al. (2004) DNA replication-timing analysis of humanchromosome 22 at high resolution and different developmentalstates. Proc. Natl Acad. Sci. USA, 101, 17771–17776.
4. MacAlpine,D.M., Rodrıguez,H.K. and Bell,S.P. (2004)Coordination of replication and transcription along a Drosophilachromosome. Genes Dev., 18, 3094–3105.
5. Woodfine,K., Fiegler,H., Beare,D.M., Collins,J.E., McCann,O.T.,Young,B.D., Debernardi,S., Mott,R., Dunham,I. and Carter,N.P.(2004) Replication timing of the human genome. Hum. Mol.Genet., 13, 191–202.
6. Audit,B., Nicolay,S., Huvet,M., Touchon,M., d’Aubenton-Carafa,Y., Thermes,C. and Arneodo,A. (2007) DNA replicationtiming data corroborate in silico human replication originpredictions. Phys. Rev. Lett., 99, 248102.
7. Huvet,M., Nicolay,S., Touchon,M., Audit,B., d’Aubenton-Carafa,Y., Arneodo,A. and Thermes,C. (2007) Human geneorganization driven by the coordination of replication andtranscription. Genome Res., 17, 1278–1285.
8. Hiratani,I., Ryba,T., Itoh,M., Yokochi,T., Schwaiger,M.,Chang,C.-W., Lyou,Y., Townes,T.M., Schubeler,D. andGilbert,D.M. (2008) Global reorganization of replication domainsduring embryonic stem cell differentiation. PLoS Biol., 6, e245.
9. Farkash-Amar,S., Lipson,D., Polten,A., Goren,A., Helmstetter,C.,Yakhini,Z. and Simon,I. (2008) Global organization of replicationtime zones of the mouse genome. Genome Res., 18, 1562–1570.
10. Desprat,R., Thierry-Mieg,D., Lailler,N., Lajugie,J., Schildkraut,C.,Thierry-Mieg,J. and Bouhassira,E.E. (2009) Predictable dynamicprogram of timing of DNA replication in human cells. GenomeRes., 19, 2288–2299.
11. Hansen,R.S., Thomas,S., Sandstrom,R., Canfield,T.K.,Thurman,R.E., Weaver,M., Dorschner,M.O., Gartler,S.M. andStamatoyannopoulos,J.A. (2010) Sequencing newly replicatedDNA reveals widespread plasticity in human replication timing.Proc. Natl Acad. Sci. USA, 107, 139–144.
12. Hiratani,I., Ryba,T., Itoh,M., Rathjen,J., Kulik,M., Papp,B.,Fussner,E., Bazett-Jones,D.P., Plath,K., Dalton,S. et al. (2010)
Genome-wide dynamics of replication timing revealed by in vitromodels of mouse embryogenesis. Genome Res., 20, 155–169.
13. Yaffe,E., Farkash-Amar,S., Polten,A., Yakhini,Z., Tanay,A. andSimon,I. (2010) Comparative analysis of DNA replication timingreveals conserved large-scale chromosomal architecture. PLoSGenet., 6, e1001011.
14. Ryba,T., Hiratani,I., Lu,J., Itoh,M., Kulik,M., Zhang,J.,Schulz,T.C., Robins,A.J., Dalton,S. and Gilbert,D.M. (2010)Evolutionarily conserved replication timing profiles predictlong-range chromatin interactions and distinguish closely relatedcell types. Genome Res., 20, 761–770.
15. Chen,C.-L., Rappailles,A., Duquenne,L., Huvet,M., Guilbaud,G.,Farinelli,L., Audit,B., d’Aubenton-Carafa,Y., Arneodo,A.,Hyrien,O. et al. (2010) Impact of replication timing on non-CpGand CpG substitution rates in mammalian genomes. Genome Res.,20, 447–457.
16. Chen,C.-L., Duquenne,L., Audit,B., Guilbaud,G., Rappailles,A.,Baker,A., Huvet,M., d’Aubenton-Carafa,Y., Hyrien,O.,Arneodo,A. et al. (2011) Replication-associated mutationalasymmetry in the human genome. Mol. Biol. Evol., 28,2327–2337.
17. Farkash-Amar,S. and Simon,I. (2010) Genome-wide analysis ofthe replication program in mammals. Chromosome Res., 18,115–125.
18. Thurman,R.E., Day,N., Noble,W.S. and Stamatoyannopoulos,J.A.(2007) Identification of higher-order functional domains in thehuman ENCODE regions. Genome Res., 17, 917–927.
19. Audit,B., Zaghloul,L., Vaillant,C., Chevereau,G., d’Aubenton-Carafa,Y., Thermes,C. and Arneodo,A. (2009) Open chromatinencoded in DNA sequence is the signature of ‘master’ replicationorigins in human cells. Nucleic Acids Res., 37, 6064–6075.
20. Nakayasu,H. and Berezney,R. (1989) Mapping replicational sitesin the eucaryotic cell nucleus. J. Cell. Biol., 108, 1–11.
21. O’Keefe,R.T., Henderson,S.C. and Spector,D.L. (1992) Dynamicorganization of DNA replication in mammalian cell nuclei:spatially and temporally defined replication ofchromosome-specific alpha-satellite DNA sequences. J. Cell. Biol.,116, 1095–1110.
22. Maya-Mendoza,A., Olivares-Chauvet,P., Shaw,A. andJackson,D.A. (2010) S phase progression in human cells isdictated by the genetic continuity of DNA foci. PLoS Genet., 6,e1000900.
23. Leonhardt,H., Rahn,H.P., Weinzierl,P., Sporbert,A., Cremer,T.,Zink,D. and Cardoso,M.C. (2000) Dynamics of DNA replicationfactories in living cells. J. Cell. Biol., 149, 271–280.
24. Sporbert,A., Gahl,A., Ankerhold,R., Leonhardt,H. andCardoso,M.C. (2002) DNA polymerase clamp shows littleturnover at established replication sites but sequentialde novo assembly at adjacent origin clusters. Mol. Cell, 10,1355–1365.
25. Sadoni,N., Cardoso,M.C., Stelzer,E.H.K., Leonhardt,H. andZink,D. (2004) Stable chromosomal units determine the spatialand temporal organization of DNA replication. J. Cell Sci., 117,5353–5365.
26. Zink,D., Cremer,T., Saffrich,R., Fischer,R., Trendelenburg,M.F.,Ansorge,W. and Stelzer,E.H. (1998) Structure and dynamics ofhuman interphase chromosome territories in vivo. Hum. Genet.,102, 241–251.
27. Ma,H., Samarabandu,J., Devdhar,R.S., Acharya,R., Cheng,P.C.,Meng,C. and Berezney,R. (1998) Spatial and temporal dynamicsof DNA replication sites in mammalian cells. J. Cell. Biol., 143,1415–1425.
28. Zink,D., Bornfleth,H., Visser,A., Cremer,C. and Cremer,T. (1999)Organization of early and late replicating DNA in humanchromosome territories. Exp. Cell Res., 247, 176–188.
29. Grasser,F., Neusser,M., Fiegler,H., Thormeyer,T., Cremer,M.,Carter,N.P., Cremer,T. and Muller,S. (2008)Replication-timing-correlated spatial chromatin arrangements incancer and in primate interphase nuclei. J. Cell Sci., 121,1876–1886.
30. Jackson,D.A. and Pombo,A. (1998) Replicon clusters are stableunits of chromosome structure: evidence that nuclear organizationcontributes to the efficient activation and propagation of S phasein human cells. J. Cell. Biol., 140, 1285–1295.
9480 Nucleic Acids Research, 2012, Vol. 40, No. 19
Downloaded from https://academic.oup.com/nar/article-abstract/40/19/9470/2414837by gueston 13 February 2018

31. Cook,P.R. (1999) The organization of replication andtranscription. Science, 284, 1790–1795.
32. Berezney,R. (2002) Regulating the mammalian genome: the roleof nuclear architecture. Adv. Enzyme Regul., 42, 39–52.
33. Koberna,K., Ligasova,A., Malınsky,J., Pliss,A., Siegel,A.J.,Cvackova,Z., Fidlerova,H., Masata,M., Fialova,M., Raska,I.et al. (2005) Electron microscopy of DNA replication in 3-D:evidence for similar-sized replication foci throughout S-phase.J. Cell. Biochem., 94, 126–138.
34. Anachkova,B., Djeliova,V. and Russev,G. (2005) Nuclear matrixsupport of DNA replication. J. Cell. Biochem., 96, 951–961.
35. Ottaviani,D., Lever,E., Takousis,P. and Sheer,D. (2008)Anchoring the genome. Genome Biol., 9, 201.
36. Arneodo,A., Vaillant,C., Audit,B., Argoul,F., d’AubentonCarafa,Y. and Thermes,C. (2011) Multi-scale coding of genomicinformation: From DNA sequence to genome structure andfunction. Phys. Rep., 498, 45–188.
37. Courbet,S., Gay,S., Arnoult,N., Wronka,G., Anglana,M.,Brison,O. and Debatisse,M. (2008) Replication fork movementsets chromatin loop size and origin choice in mammalian cells.Nature, 455, 557–560.
38. Dekker,J., Rippe,K., Dekker,M. and Kleckner,N. (2002)Capturing chromosome conformation. Science, 295, 1306–1311.
39. de Wit,E. and de Laat,W. (2012) A decade of 3C technologies:insights into nuclear organization. Genes Dev., 26, 11–24.
40. Simonis,M., Klous,P., Splinter,E., Moshkin,Y., Willemsen,R., deWit,E., van Steensel,B. and de Laat,W. (2006) Nuclearorganization of active and inactive chromatin domains uncoveredby chromosome conformation capture-on-chip (4C). Nat. Genet.,38, 1348–1354.
41. Zhao,Z., Tavoosidana,G., Sjolinder,M., Gondor,A., Mariano,P.,Wang,S., Kanduri,C., Lezcano,M., Sandhu,K.S., Singh,U. et al.(2006) Circular chromosome conformation capture (4C) uncoversextensive networks of epigenetically regulated intra- andinterchromosomal interactions. Nat. Genet., 38, 1341–1347.
42. Lieberman-Aiden,E., van Berkum,N.L., Williams,L., Imakaev,M.,Ragoczy,T., Telling,A., Amit,I., Lajoie,B.R., Sabo,P.J.,Dorschner,M.O. et al. (2009) Comprehensive mapping oflong-range interactions reveals folding principles of the humangenome. Science, 326, 289–293.
43. Delves,P.J., Martin,S.J., Burton,D.R. and Roitt,I.M. (2006) Roitt’sEssential Immunology, 11th edn. Wiley-Blackwell, New york.
44. Splinter,E., de Wit,E., Nora,E.P., Klous,P., van deWerken,H.J.G., Zhu,Y., Kaaij,L.J.T., van Ijcken,W., Gribnau,J.,Heard,E. et al. (2011) The inactive X chromosome adopts aunique three-dimensional conformation that is dependent on XistRNA. Genes Dev., 25, 1371–1383.
45. Noordermeer,D., Leleu,M., Splinter,E., Rougemont,J., Laat,W.D.and Duboule,D. (2011) The dynamic architecture of Hox geneclusters. Science, 334, 222–225.
46. Jiang,H. and Wong,W.H. (2008) SeqMap: mapping massiveamount of oligonucleotides to the genome. Bioinformatics, 24,2395–2396.
47. Yokota,H., van den Engh,G., Hearst,J.E., Sachs,R.K. andTrask,B.J. (1995) Evidence for the organization of chromatin inmegabase pair-sized loops arranged along a random walk path inthe human G0/G1 interphase nucleus. J. Cell. Biol., 130,1239–1249.
48. Baker,A., Audit,B., Chen,C.-L., Moindrot,B., Leleu,A.,Guilbaud,G., Rappailles,A., Vaillant,C., Goldar,A., Mongelard,F.et al. (2012) Replication fork polarity gradients revealed bymegabase-sized U-shaped replication timing domains in humancell lines. PLoS Comput. Biol., 8, e1002443.
49. Ryba,T., Battaglia,D., Chang,B.H., Shirley,J.W., Buckley,Q.,Pope,B.D., Devidas,M., Druker,B.J. and Gilbert,D.M. (2012)Abnormal developmental control of replication timing domains inpediatric acute lymphoblastic leukemia. Genome Res, 22,1833–1844.
50. Simonis,M., Kooren,J. and de Laat,W. (2007) An evaluation of3C-based methods to capture DNA interactions. Nat. Methods, 4,895–901.
51. Mechali,M. (2010) Eukaryotic DNA replication origins: manychoices for appropriate answers. Nat. Rev. Mol. Cell. Biol., 11,728–738.
52. Brodie of Brodie,E.B., Nicolay,S., Touchon,M., Audit,B.,d’Aubenton-Carafa,Y., Thermes,C. and Arneodo,A. (2005) FromDNA sequence analysis to modeling replication in the humangenome. Phys. Rev. Lett., 94, 248103.
53. Touchon,M., Nicolay,S., Audit,B., Brodie of Brodie,E.-B.,d’Aubenton-Carafa,Y., Arneodo,A. and Thermes,C. (2005)Replication-associated strand asymmetries in mammaliangenomes: toward detection of replication origins. Proc. Natl Acad.Sci. USA, 102, 9836–9841.
54. Gilbert,D.M., Takebayashi,S.-I., Ryba,T., Lu,J., Pope,B.D.,Wilson,K.A. and Hiratani,I. (2010) Space and time in thenucleus: developmental control of replication timing andchromosome architecture. Cold Spring Harb. Symp. Quant. Biol.,75, 143–153.
55. Cuddapah,S., Jothi,R., Schones,D.E., Roh,T.-Y., Cui,K. andZhao,K. (2009) Global analysis of the insulator binding proteinCTCF in chromatin barrier regions reveals demarcation of activeand repressive domains. Genome Res., 19, 24–32.
56. Handoko,L., Xu,H., Li,G., Ngan,C.Y., Chew,E., Schnapp,M.,Lee,C.W.H., Ye,C., Ping,J.L.H., Mulawadi,F. et al. (2011)CTCF-mediated functional chromatin interactome in pluripotentcells. Nat. Genet., 43, 630–638.
57. Sexton,T., Yaffe,E., Kenigsberg,E., Bantignies,F., Leblanc,B.,Hoichman,M., Parrinello,H., Tanay,A. and Cavalli,G. (2012)Three-dimensional folding and functional organization principlesof the Drosophila genome. Cell, 148, 458–472.
58. Malyavantham,K.S., Bhattacharya,S., Alonso,W.D., Acharya,R.and Berezney,R. (2008) Spatio-temporal dynamics of replicationand transcription sites in the mammalian cell nucleus.Chromosoma, 117, 553–567.
59. Bridger,J.M., Boyle,S., Kill,I.R. and Bickmore,W.A. (2000)Re-modelling of nuclear architecture in quiescent and senescenthuman fibroblasts. Curr. Biol., 10, 149–152.
60. Mehta,I.S., Amira,M., Harvey,A.J. and Bridger,J.M. (2010) Rapidchromosome territory relocation by nuclear motor activity inresponse to serum removal in primary human fibroblasts. GenomeBiol., 11, R5.
61. Lu,J., Li,F., Murphy,C.S., Davidson,M.W. and Gilbert,D.M.(2010) G2 phase chromatin lacks determinants of replicationtiming. J. Cell. Biol., 189, 967–980.
62. Stentz,F.B. and Kitabchi,A.E. (2004) Transcriptome andproteome expression in activated human CD4 and CD8T-lymphocytes. Biochem. Biophys. Res. Commun., 324, 692–696.
63. Argyropoulos,C., Nikiforidis,G.C., Theodoropoulou,M.,Adamopoulos,P., Boubali,S., Georgakopoulos,T.N.,Paliogianni,F., Papavassiliou,A.G. and Mouzaki,A. (2004) Miningmicroarray data to identify transcription factors expressed innaıve resting but not activated T lymphocytes. Genes Immun., 5,16–25.
64. Hess,K., Yang,Y., Golech,S., Sharov,A., Becker,K.G. andWeng,N.-P. (2004) Kinetic assessment of general gene expressionchanges during human naive CD4+T cell activation. Int.Immunol., 16, 1711–1721.
65. Chtanova,T., Newton,R., Liu,S.M., Weininger,L., Young,T.R.,Silva,D.G., Bertoni,F., Rinaldi,A., Chappaz,S., Sallusto,F. et al.(2005) Identification of T cell-restricted genes, and signatures fordifferent T cell responses, using a comprehensive collection ofmicroarray datasets. J. Immunol., 175, 7837–7847.
66. Grigoryev,Y.A., Kurian,S.M., Nakorchevskiy,A.A., Burke,J.P.,Campbell,D., Head,S.R., Deng,J., Kantor,A.B., Yates,J.R. andSalomon,D.R. (2009) Genome-wide analysis of immune activationin human T and B cells reveals distinct classes of alternativelyspliced genes. PLoS One, 4, e7906.
67. Branco,M.R., Branco,T., Ramirez,F. and Pombo,A. (2008)Changes in chromosome organization during PHA-activation ofresting human lymphocytes measured by cryo-FISH. ChromosomeRes., 16, 413–426.
68. Kysela,K., Philimonenko,A.A., Philimonenko,V.V., Janacek,J.,Kahle,M. and Hozak,P. (2005) Nuclear distribution of actin andmyosin I depends on transcriptional activity of the cell.Histochem Cell Biol., 124, 347–358.
Nucleic Acids Research, 2012, Vol. 40, No. 19 9481
Downloaded from https://academic.oup.com/nar/article-abstract/40/19/9470/2414837by gueston 13 February 2018