376, sec. 1, hsin-nan rd. luchu, taoyuan county, taiwan ... · eva airways corporation 376, sec. 1,...
TRANSCRIPT

EVA Airways Corporation376, Sec. 1, Hsin-nan Rd. Luchu, Taoyuan County, TaiwanTel: 886-3-351-5151Internet Address: http://www.evaair.com
Taipei Office117, Sec. 2, Chang-an E. Rd., Taipei, TaiwanTel: 886-2-8500-2345
Spokesman Mr. K W Nieh Group Executive Officer, Public Relations Tel: 886-2-2500-1122 email: [email protected] Deputy Spokesperson Ms. Rose Li Deputy Senior Vice President, Public Relations Tel: 886-2-2500-1122 email: [email protected]
Shareholder ServicesAddress: 2F, 166, Sec. 2, Minsheng E. Rd., Taipei, Taiwan Tel: 886-2-2500-1668Internet Address: http://stock.evergreen.com.tw
AuditorsKPMG68F, 7, Sec. 5, Xinyi Road, Taipei, Taiwan (TAIPEI 101 Tower)Tel: 886-2-8101-6666Internet Address: http://www.kpmg.com.tw
Financial CalendarYear ended December 31, 2011

Contents
Financial and Operating Highlights 1
To Shareholders 2
2011 Result 2
2012 Preview 5
Future Development Strategies 6
Competition, Legal Issues and Operating Environment 6
The Company 8
Major Milestones 8
Calendar of 2011 & 2012 Events 10
Directors and Supervisors 11
Principal Officers 19
Corporate Governance 24
Corporate Social Responsibility 30
Capital and Shares 34
EVA Air People 39
The Fleet 41
The Network 45
Principal Subsidiaries 46
Important Resolutions by Shareholders and BOD 47
Financial and Operating Results 51
Financial Results 51
Operating Results 57
Financial Statements 58
Independent Auditors’ Report 59
Balance Sheets 61
Statements of Operations 62
Statements of Changes in Stockholders' Equity 63
Statements of Cash Flows 64
Notes to Financial Statements 65
Consolidated Balance Sheets 104
Consolidated Statements of Operations 105
Consolidated Statements of Changes in Stockholders' Equity 106
Consolidated Statements of Cash Flows 107
1
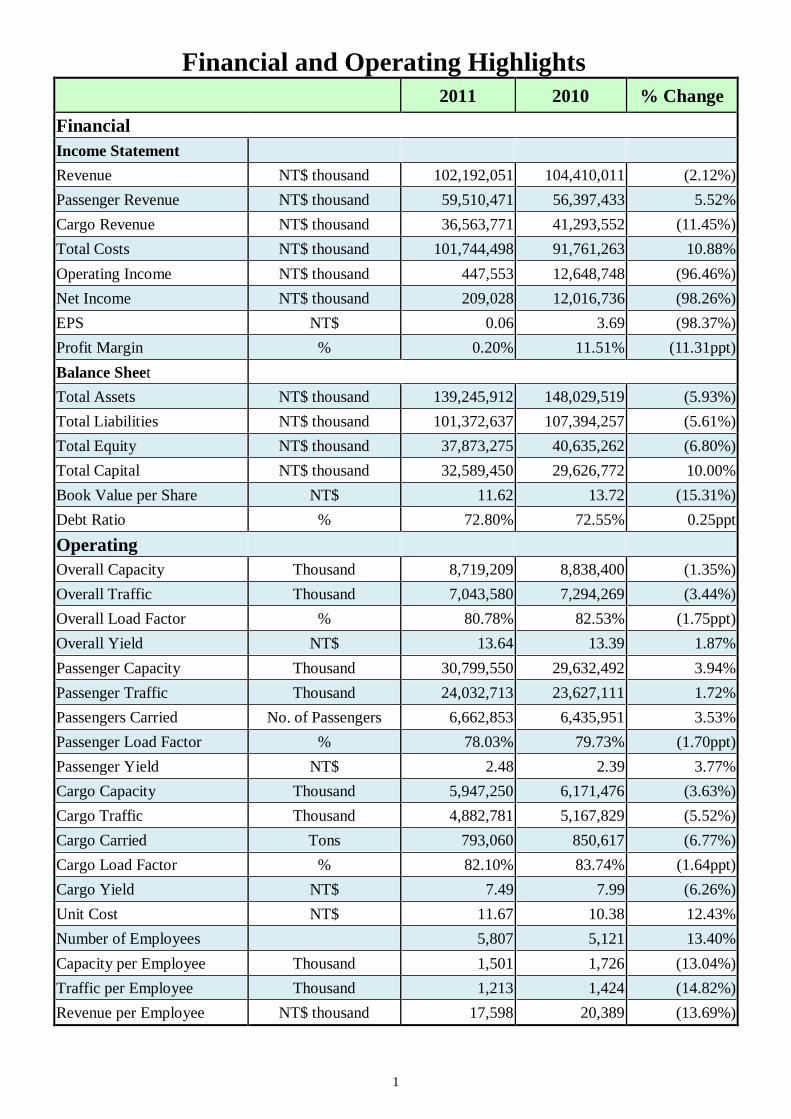
Financial and Operating Highlights 2011 2010 % Change
Financial
Income Statement
Revenue NT$ thousand 102,192,051 104,410,011 (2.12%)
Passenger Revenue NT$ thousand 59,510,471 56,397,433 5.52%
Cargo Revenue NT$ thousand 36,563,771 41,293,552 (11.45%)
Total Costs NT$ thousand 101,744,498 91,761,263 10.88%
Operating Income NT$ thousand 447,553 12,648,748 (96.46%)
Net Income NT$ thousand 209,028 12,016,736 (98.26%)
EPS NT$ 0.06 3.69 (98.37%)
Profit Margin % 0.20% 11.51% (11.31ppt)
Balance Sheet
Total Assets NT$ thousand 139,245,912 148,029,519 (5.93%)
Total Liabilities NT$ thousand 101,372,637 107,394,257 (5.61%)
Total Equity NT$ thousand 37,873,275 40,635,262 (6.80%)
Total Capital NT$ thousand 32,589,450 29,626,772 10.00%
Book Value per Share NT$ 11.62 13.72 (15.31%)
Debt Ratio % 72.80% 72.55% 0.25ppt
Operating
Overall Capacity Thousand 8,719,209 8,838,400 (1.35%)
Overall Traffic Thousand 7,043,580 7,294,269 (3.44%)
Overall Load Factor % 80.78% 82.53% (1.75ppt)
Overall Yield NT$ 13.64 13.39 1.87%
Passenger Capacity Thousand 30,799,550 29,632,492 3.94%
Passenger Traffic Thousand 24,032,713 23,627,111 1.72%
Passengers Carried No. of Passengers 6,662,853 6,435,951 3.53%
Passenger Load Factor % 78.03% 79.73% (1.70ppt)
Passenger Yield NT$ 2.48 2.39 3.77%
Cargo Capacity Thousand 5,947,250 6,171,476 (3.63%)
Cargo Traffic Thousand 4,882,781 5,167,829 (5.52%)
Cargo Carried Tons 793,060 850,617 (6.77%)
Cargo Load Factor % 82.10% 83.74% (1.64ppt)
Cargo Yield NT$ 7.49 7.99 (6.26%)
Unit Cost NT$ 11.67 10.38 12.43%
Number of Employees 5,807 5,121 13.40%
Capacity per Employee Thousand 1,501 1,726 (13.04%)
Traffic per Employee Thousand 1,213 1,424 (14.82%)
Revenue per Employee NT$ thousand 17,598 20,389 (13.69%)

2
To Shareholders
2011 Results In 2011, we carried 6.66 million passengers and
790,000 tons of cargo, achieving a combined load
factor of 81%. EVA‟s audited financial statement
shows annual operating revenue for the year of
NT$102.19 billion, down by 2% compared to
2010, and annual after-tax net profit of NT$0.21 billion.
Passenger revenue increased 5% or
NT$3.1 billion over 2010, reaching
NT$59.5 billion
The 311 earthquake in Japan and subsequent
nuclear disaster hurt the travel market while
flights to more cross-strait destinations and greater
frequency stemming from the stable relationship
between Taiwan and Mainland China boosted the
overall number of passengers carried by 3%.
In addition to continuing to develop
code-sharing cooperation in Europe, America and
Asia, growing the China market and strengthening
transit business in Europe and America, the
Company is working to join the leading airline
alliance, explore the niche markets within the
neighboring region and further to cope with
Taoyuan Aerotropolis program to boost inbound
business by integrating worldwide resources.
Cargo revenue was down by 11% or NT$4.7
billion over 2010, totaling NT$36.6 billion
The Japan earthquake, European debt crisis,
US economic contraction and slower growth in
China did significantly affect the air-freight
market. Though the recovery held its momentum
through the first half of 2011, recession loomed
over the second half. The airfreight market was
overshadowed by the phenomenon of 『 no
significant peak season』and『oversupply』, causing
rates to gradually fall. Cargo tonnage decreased
overall by 7%.
Responding to the uncertain market situation,
we aim to flexibly adjust the fleet arrangement to
cope with changing market, to keep our strength and produce profitability and growth.
Expanded fleet to 59 aircraft, continued to
replace older models
At year-end 2011, the Company operated a
fleet of 59 aircraft fleet made up of 42 passenger
jets and 17 freighters. Aircraft types in the fleet
are shown in the following table:
Aircraft Type Quantity
B747-400 3
B747-400 Combi 4
B747-400 (Freighter) 9
MD-11 (Freighter) 8
MD-90 6
B777-300ER 15
A330-200 11
A330-300 3
Total 59
In addition to 11 Airbus 330-200 aircraft and
15 Boeing 777-300ER Aircraft; the Company
introduced 3 brand new Airbus 330-300s in 2011,
which are also known as “Hello Kitty Jets”.
Aviation safety and quality services
acclaimed for excellence
We continue to make safety and service
quality our priorities. The Company has been
consistently recognized for its outstanding
aviation safety record. We began taking delivery
of brand-new Airbus 330-200s in 2003 and
deployed the first of its Boeing 777-300ERs in
2005. We give our passengers exceptionally
comfortable flights in state-of-the-art cabins. In
Premium Laurel Class top cabins, they travel in
ultra-long hard-shell seats with a roomy 61-inch
pitch, 10.4-inch LCD touch-panel AVODs, have
an SMS (short message service) right at their
fingertips, check in for flights at a dedicated
counter and have the option to pre-order meals
from an extensive menu.
Along with the Company‟s outstanding
aviation safety record and exceptional airfreight
capabilities, our excellent service is widely
recognized at home and globally. In September,
2011 EVA designated to carry two endangered
red-crowned cranes from the Kushiro City Zoo in
Hokkaido, Japan to Taiwan for the Taipei City
Zoo. EVA has also successfully completed it‟s
fourth koala mission and carried four of the
endangered marsupials from Currumbin Wildlife
Sanctuary in Queensland, Australia to the Taipei
City Zoo in Taiwan in October, 2011. Both efforts
won wide acclaim.

3
Results vs. Projections
We forecast NT$101.90 billion in operating
revenue for 2011 and, at NT$102.19 billion,
achieved a 100.28% ratio. At the same time, we
expected pre-tax net profit of NT$0.34 billion and
actually produced NT$0.24 billion.
Analysis of Financial Results and Profitability
Total revenue: NT$103.87 billion
Total 2011 operating revenue reached NT$102.19,
slipping 2% from 2010. More effective
cross-strait route performance and higher volume
lifted passenger revenue by 5% from last year.
Due to the global economic recession and
diminished demand, airfreight revenue was down
by 11% compared to last year.
Total expense: NT$103.63 billion
Primarily because of fuel price spikes, annual
2011 operating expense amounted to NT$101.75
billion, an increase of 10.88% over 2010.
Profitability analysis:
Return on total assets: 1.11%
Return on shareholders‟ equity: 0.53%
Ratio of operating profit to paid-in capital: 1.37%
Return on sales: 0.20%
Earnings per share: NT$0.06
Research and development
Responding to the further increase of the
cross-strait flights in 2011, the Company
developed strategic destinations in China and
established an extensive service network. To
effectively align our e-services with our
China operations, we have focused on code
sharing, e-commerce development and
system building for each route. Our strategy
was to quickly establish EVA presence with
25 gateways serving first- and second-tier
cities that are connected by multiple routes.
The Company is also pursuing strategic
cooperative partnerships with China‟s five
leading carriers so that we can leverage
services and strengthen our competitive
position in key cross-strait markets.
Using rapid change, popularity of smart
phones and the mobile internet environment
as a springboard, EVA launched an
intelligent new version of the EVA Mobile
Web that works on different platforms
with FREE Apps. Anytime, anywhere,
passengers can book flights, check mileage
balances, get flight information, learn more
about EVA and its services and discover
promotional activities, all by simply
downloading the EVA Mobile App, FREE.
Our Electronic Miscellaneous Document
(EMD) system met IATA‟s high StB
(Simplify the Business) threshold for full
electronic passenger ticketing. We began
promoting use of easy-to-use e-ticketing
system when we introduced it in 2008, we
achieved overall passenger e-documentation
after launching EMD in 2011. Optimizing
opportunities created by IATA‟s continuous
promotion of e-ticketing services and
standardization of StB, EVA has reduced
costs, upgraded operating efficiency and
strengthened our competitive position.
EVA developed a Freight Revenue
Management System (ULD pricing) in 2011
for effective management and analysis, to
integrate existing freight processes, provide
automatic pricing and exceptional handling
and gain efficiency and accuracy in
accounting processes. This system also
enables us to leverage our assets far more
effectively.
We developed an e-booking platform for our
cargo network in 2010, enabling agents and
shippers both to book airfreight space using a
web-based application. We integrated
e-billing into this e-commerce platform in
2011 and gave our airfreight customers a
single entry point and unified system,
enhancing and facilitating operations and
services. The system not only enhanced
bookkeeping process but also gave us a
flexible, multi-layer accounting audit
function that made it easier to track services
and payments. In addition to saving
manpower, the system has given the
Company a competitive edge.
Recognizing potential advantages through
use of handheld devices, the Company
digitized cabin operations and developed a
new service information system in 2011. Via
a user-friendly touch interface, chief pursers
now load key passenger information on iPads,
which facilitates in-flight responsiveness and
follow-up and provides data that can be used
to further improve service quality. Use of
these devices also supports Company
concepts of flight safety, convenient, friendly
and attentive services, and effective,

4
innovative operations.
Flight safety is a core EVA value and the
Company always strives for perfection. It is
uncompromising towards even a hint of a
threat to aviation safety. The Company
developed a system to automate pilot
information in 2011 and in September,
implemented a Mobile cockpit dispatch
program that enables pilots to use iPads to
digitally track and instantly access flight
information such as plans, bulletins, dispatch
reports, weather charts and electronic
manuals throughout flights, including
takeoffs and landings.
The SIS (Simplified Interline Settlement)
platform was mandated by IATA ICH
(International Air Transport Association
Interline Clearing House). The organization
initiated it to streamline and facilitate more
effective electronic exchanges of transaction
information for P, C, U and M segments
(Passenger, Cargo, UATP and
Miscellaneous), including settlement
information and document exchange between
billing entities and interline partners. The
organization initiated platform function
development in April 2011, took the P
segment live in November 2011 and geared
up for internal and external electronic billing
and settlement through the SIS platform. The
platform is linked with ICH, curtailing paper
use, reducing invoice costs and supporting
document transfers, advancing eco-friendly
commitments.
In support of a government policy
encouraging businesses to adopt International
Financial Reporting Standards (IFRSs) to
ensure transparency and consistency with
global trading partners, the Company has
adopted IFRS accounting rules. It has
adjusted related operations and is continuing
to evaluate these programs for further
modification and improvement. The
Company also adopted IFRS and ROC
GAAP standards for preparation of financial
statements in 2012. EVA will formally adopt
IFRSs in 2013, further enhancing EVA‟s
global competitiveness.
EVA has been proactive in planning and
managing its information technology
infrastructure, giving us the benefits of
advanced technological services that
strengthen our ability to cope with business
change that have come with the Company‟s
rapid growth. In December 2011, we
upgraded our mainframe system software and
hardware, significantly increasing the
processing scale of our information system.
These upgrades satisfy demands created by
rapid growth in cross-strait and global
markets in addition to giving us competitive
advantage within the industry.
EVA is accommodating steady business
growth by continuing to improve the quality
and expand the quantity of information
applications, database systems and network
communications systems. We are monitoring
and optimizing our sophisticated and
comprehensive IT environment. In 2011, we
introduced Splunk. It is an information
system operational statistical analysis tool
designed to facilitate maintenance of
expanding operations and support proactive
management to satisfy projected future
growth and operational scales and improve
overall services and productivity.

5
2012 Preview Operating Guidelines
We will uphold the Company‟s policy of
providing safe, convenient flights and excellent
services. We upgraded service quality further in
2011 by taking delivery of three brand-new Airbus
330-300, bringing the number of A330s in our
fleet to 14, elevating passenger safety and
ensuring exceptionally comfortable flight
experiences. We are utilizing fleet resources
strategically to improve route competitiveness and
flexibility, and to positively influence our bottom
line.
Estimated Air Traffic and Basis
Passenger services:
We are forecasting that we will carry 7.43
million passengers in 2012, a 12% increase
compared to 6.66 million served in 2011.
Estimation Basis:
Starting with our winter 2011, the quota for
flights to Mainland China has been increased from
370 per week to 558. At the same time, the quota
for tourists from Mainland China to Taiwan was
raised from 3,000 per day to 4,000. And the
number of cities permitting individual travel
programs in Mainland China will expand from
three (Beijing, Shanghai and Xiamen) to eleven by
the end of 2012. Combined with Japan‟s open sky
policy and foreseeable visa-exemption programs in
America, we anticipate a higher volume of sales.
Mainland China has now opened 41
destinations to regularly scheduled flights. EVA is
serving 14 of them, including Beijing, Shanghai
Pudong, Shanghai Hongqiao, Guangzhou,
Hangzhou, Tianjin, Ningbo, Zhengzhou, Jinan,
Chengdu, Guilin, Haikou, Harbin and Huangshan.
Going forward, we will continue to evaluate
feasibility of serving additional gateways in China
and add routes based on market demand and
progress of cross-strait negotiations. The Company
will continue to seek cross-strait
business/passenger sources and strive to promote
Taoyuan International Airport as a global hub.
Cargo services:
Our forecast is to transport 730,000 tons of
airfreight in 2012, a decrease of 8% over the
790,000 tons we carried in 2011.
Estimation Basis:
Due to the debt crisis in Europe, the
uncertainty of the US economy and high oil prices,
we anticipate that cargo movement among
different regions will vary. Overall, we do not
expect to see any pickup in export volume from
Asia to Europe and the United States. Exports
from Europe and the Unites States to Asia are
likely to remain flat. At the same time, projections
for exports within sectors of Asia are upbeat and
indicate opportunities for growth. Looking to 2012,
the Company has the flexibility to accommodate
market demand and adjust capacity accordingly.
Meanwhile, EVA will stay focused on growing
our customer base and strengthening our global
cargo network.
Key Marketing Strategies
Passenger services:
In 2012, we plan to place three brand-new
A321-200 passenger aircraft in service during
the fourth quarter of 2012 to provide our
passenger in the region a more convenient
choice to fly and to accommodate growing
demand on cross-strait and regional routes.
With these aircraft fuel-saving advantages
and advanced cabin amenities of our existing
fleet, we expect to boost operating profits.
We will continue to develop e-services to
further reduce operating costs.
We will adjust destinations, reconfigure
aircraft and fine-tune flight schedules to most
effectively capture market demand, leverage
fleet capacity and boost route profitability.
We will continue to strengthen code-sharing
partnerships with other major airlines such as
United Airlines, US Airways, All Nippon
Airways, Asiana Airlines, Qantas, Air China,
Hainan Airlines, Bangkok Airways, Hong
Kong Airlines and more.
On March 29, 2012, EVA was officially
accepted and announced as future member of
Star Alliance. The integration process has
begun and our goal is to become a formal
member by 2013. The joining of Star
Alliance will offer the Company‟s customers
convenient access to more destinations
worldwide with seamless travel and status
recognition within various frequent flyer
programs of member carriers.
We will optimize opportunities created by the
administration‟s cross-strait open policies
and tap into pipelines of individual tourists

6
from Mainland China. And we will develop
attractive programs to capture individual
travelers coming from Mainland China.
Cargo services:
Now that regular cross-strait flights are well
established, we will make full use of
bellyhold space aboard passenger aircraft.
We will maintain our cooperation with Air
China Cargo to swap regular cross-strait
cargo space on the Taoyuan - Pudong route
and are aggressively seeking cooperation on
regular cross-strait freight services with other
carriers.
Through code-sharing with Lufthansa and
British Airways on European routes, the
Company will achieve our objective of
doubling frequency and capacity, mutually
enhancing service and leveraging profits at
the same time.
Japan‟s amended traffic rights enable the
Company to expand freighter service.
With greater purchasing power in Asia and
Mainland China, the Company will further
strengthen our export markets from Europe
and the United States to these developing
economies.
The Company is also aggressively exploring
more e-service to cut operating costs.
Future Development Strategies The Company has established a vigorous
global flight network that links major cities in
Europe, America, Asia and Oceania. We will
use our far-reaching route network to expand
the reach of our convenient air services and
advance development of Taoyuan
International Airport as global hub within the
near future.
In response to the open cross-strait policy
permitting regular services, EVA is actively
working to expand our direct-link flight
network. We are also building flexibility into
our operations so that, as air agreements are
amended, we can take appropriate action to
capture more of the potential passenger and
cargo markets and retain our competitive
position.
Delivery of three A330-300 aircraft equipped
with the most technologically advanced seats,
inflight entertainment and will much more
strengthen our regional presence. And
deployment of three A321-200 passenger
aircraft will accommodate new demand for
flights on cross-strait routes. As we stay
focused on safety and service quality, we will
also review our fleet portfolio and identify
opportunities to optimize capacity as the
cross-strait market continues to grow and
develop.
The Company is currently cooperating with
13 airlines, including American Airlines, US
Airways, All Nippon Airways, Asiana
Airlines, Qantas, Air China, Hainan Airlines,
Bangkok Airways, Hong Kong Airlines,
British Airways (cargo), Lufthansa (cargo),
Air China (cargo) and FedEx (cargo). We are
committed to joining a key global alliance.
And we will continue to expand and
strengthen our cooperation with other airlines,
combining flight networks and beneficial
advantages, driving down operating costs in
order to diversify risks and giving our
passengers faster, more convenient flight
services.
Competition, Legal Issues and the
Operating Environment
Competition
The global economic recovery continues to
be somewhat murky and has impacted
corporate business travel budgets, affecting
business and leisure markets, passenger
volume and fare levels.
Low-cost carriers are entering the passenger
market with rock-bottom fares and Taiwan‟s
high-speed rail has driven domestic airlines
to transform themselves. These factors are
affecting the competitive landscape and the
supply-demand balance in regional passenger
and cargo markets.
More nations are deregulating aviation
policies. For example, the United States and
Japan have adopted open-sky policies that are
likely to intensify competition for regional
and intercontinental passengers and
airfreight.
China‟s growing demand for air transport is
expected to continue to dominate the Asia
markets. In addition to cross-strait passenger
and cargo volumes that repeatedly reach new
highs, related businesses such as aviation
products manufacturing and aviation
personnel and maintenance are also thriving.
This trend creates significant opportunities
7
for companies in Taiwan.
Legal Environment
Political and economic stability directly
impact ups and downs in passenger and cargo
markets.
The airline industry must remain vigilant and
ready to respond quickly to changes. Open
policies on direct cross-strait flights are still
in initial stages and support measures are
fragmented.
Increasing consumer awareness and changes
in regulations are burdening the airline
industry. A prime example is the penalty
imposed by the European Union on airlines
that oversell seats and inclusion of the
industry in the EU‟s Emission Trading
Scheme (ETS) that take effect in 2012.
Mainland China‟s opening up of its
passenger transit policy is affecting the
competitiveness of Taiwan‟s carriers in
international transit networks.
Operating Environment
Political uncertainty in the Euro zone, the
Middle East and Russia, combined with
possible economic slowdowns in China and
India, pose significant risks to the global
economy.
In 2012, the overall global economic
environment is overshadowed by Europe's
debt debacle and European countries still
have a long way to go to resolve financial
problems that create uncertainty for aviation
prospects.
Volatile international fuel prices and the
cargo slump in 2011 have severely impacted
the airline industry.
Sluggish economies in Europe and America
and fuel price spikes pose a severe challenge for
the airline business. In addition to active market
expansion, the Company will strengthen
operational management processes and implement
cost and risk controls. With growing cross-strait
services, we believe we can overcome difficulties
and again achieve peak performance.

8
The Company
Founded in March 1989, EVA Air, a
one-hundred-percent privately owned
Taiwanese airline, is the sister company of
Evergreen Marine Corporation, which is the
world famous shipping line in terms of
container operation.
Since the inauguration of its maiden flight on
July 01, 1991, EVA Air is currently serving
63 destinations over four continents, except
Africa, with 59 aircraft (as of December 2011)
and is still steadily expanding its operation
network and fleet.
In 1997, after carefully nurturing an
environment where faultless service quality
and flight safety are the standard, EVA Air
became the first airline in Taiwan to achieve
official ISO 9002 Certification in three areas
at the same time -- passenger, cargo and
maintenance operations. Diligently upholding
these objectives, EVA Air earned
ISO-9001:2000 Certification for all
categories of operation in 2001.
In addition, EVA has ensured quality, smooth
ongoing operations and reduced costs by
investing capital and expertise in
airline-related companies, including
Evergreen Sky Catering Corporation,
Evergreen Airline Services Corporation,
Evergreen Air Cargo Service Corporation,
and other selected subsidiaries.
Operating strategies developed by the carrier
are far-reaching. Company goals place equal
importance on its passenger and cargo
services, and it works in cooperation with
affiliated carriers to maximize mutual
efficiencies and effectively compete on a
global scale. Its worldwide hub of operations
at Taoyuan International Airport in Taiwan
has proven to be both successful and
strategic.
EVA Air listed its stock on Taiwan‟s
TAISDAQ Market in October 1999, and
moved to the main board, TSE, in September
2001.
Major Milestones
1988~1990
On September 1, 1988 at the celebration for
the 20th birthday of Evergreen Marine Corporation,
Group Chairman Y. F. Chang announced that
Evergreen would launch an international airline.
EVA Air was officially formed in March 1989.
After careful deliberation, the fledgling airline
signed a contract with Boeing/McDonnell Douglas
for 26 aircraft at a total purchase value of US$3.6
billion, and immediately captured the attention of
the global airline market.
1991
EVA Air accepted delivery of its first two
B767-300ERs in April, and made its inaugural
flight on July 1. Within that first week, the new
airline opened five destinations in Asia -- Bangkok,
Seoul, Jakarta, Kuala Lumpur and Singapore.
1992
The comprehensive EVA Training Center
opened in July, and the carrier‟s first two
all-passenger B747-400s were delivered in
November. EVA used the first flights of the new
aircraft to launch its Taipei-Los Angeles route and
introduce its four classes of cabin service,
including the debut of its trend-setting Evergreen
Deluxe Class in-between Economy and Super
Business.
1993
EVA Air set new standards and heightened
expectations by expanding its network to more
than half a dozen new destinations, and by
launching service to London, Paris, Seattle, New
York, San Francisco, Brisbane, Sydney and Dubai.
1994
EVA made the greatest number of new
aircraft additions to its fleet this year, purchasing a
total of eight, including three MD-11s, one
B747-400 and four B767-200s. The airline also
added Bali, Fukuoka and Auckland routes to its
network.

9
1995
The carrier purchased three MD-11 freighters
and began to vigorously develop air cargo
operations. It set goals emphasizing passenger and
cargo services equally. And it used joint operations
and land transportation to successfully extend
EVA Cargo services worldwide.
1996
Enhancing the high quality of its operations,
EVA applied for ISO-9002 certification. Within
the next year, its passenger service, cargo service
and aviation maintenance operations were all three
granted ISO-9002 international certifications
simultaneously. EVA achieved ISO-9001:2000
certification in 2001.
1997
Ensuring consistent service quality, EVA and
Singapore Airlines formed Evergreen Sky
Catering Corporation as a joint venture and in
February, began providing in-flight catering
services.
1998
Promoting air safety, EVA signed a
joint-venture contract with General Electric and
established Evergreen Aviation Technologies
Corporation on February 24. That same day, a
powerful new engine test cell was placed in
operation, and the new joint venture began an
aggressive campaign to raise the standards of the
aircraft maintenance business.
1999
Earning brilliant results with both passenger
and cargo service, EVA produced outstanding
operating performances for five successive years.
The Securities and Futures Commission (SFC) of
Taiwan approved its admission to the exchange,
and on October 27, EVA Air shares began to be
traded on the over-the-counter market.
2000
In anticipation of future needs and to expand
its fleet, EVA signed a purchase contract in June
with the Boeing Company for 15
B777-200X/300Xs that included a firm order for
seven of the aircraft and an option for eight more.
Deliveries began in 2005. The carrier relocated its
hub to the brand-new Terminal 2 at Taoyuan
International Airport at the end of July.
2001
EVA committed to add more new,
technologically advanced aircraft to its fleet in
March by signing a purchase contract for eight
Airbus A330-200s and making plans to start
taking deliveries in 2003. EVA Air also secured
approval to transfer its stock listing from OTC and
on 17 September, moved its shares to the Taiwan
Security Exchange (TSE).
2002
EVA launched its online booking system on
January 9. It gained approval to add 24 passenger
flights on its thriving Hong Kong route and to
begin new freighter service. It also introduced a
new slogan “Just relax, your home in the air.”
2003
EVA debuted stylish new cabin-crew
uniforms on April 1, took delivery of its first
A330-200 on June 26 and introduced its new
generation of a top cabin class, Premium Laurel,
along with an upgraded economy class and an
awesome, state-of-the-art Audio/Video on
Demand system.
2004
EVA Air exercised an option for eight B777s
that was part of the firm purchase contract
executed with Boeing in June 2000, expanding its
fleet by a total of 15 brand-new B777s. Deliveries
of the new aircraft started in 2005 and will
continue through 2010.
2005
EVA took delivery of its first two of 15
B777s and introduced the extra-roomy,
exceptionally comfortable new aircraft to
passengers on the Bangkok and London with an
inviting new slogan, “Sharing the World, Flying
Together.”
2006
EVA Air opened its new Southern China
Cargo Center in Hong Kong, enabling it more
efficiently and quickly to move air freight
shipments in and out of the region.
2007 EVA Air received 2007 The Richard Teller
Crane Founder‟s Award from the international
Flight Safety Foundation for “its corporate
10
leadership in aviation safety programs and its
superb safety records.” In the five years since the
coveted award was established, EVA is the first
Asian airline and only the second airline among
all recipients to receive it.
2008 Readers selected EVA Air as the Best Airline
for Premium Economy in Global Traveler
magazine‟s fifth annual GT Tested Survey. The
international business-travel publication surveyed
its readers between Jan. 1 and Aug. 31, 2008,
inviting them to identify “the best” in 55
categories of business and luxury travel. Readers
returned 31,457 completed questionnaires.
2009
EVA Air rated as one of World‟s Best
International Airlines Prestigious Travel & Leisure
readers‟ survey identified top-ten carriers. Results
of the publication‟s prestigious annual survey
place EVA in ninth position, barely one-tenth of a
point behind number six Using cabin comfort,
in-flight service, customer service and value as
rating characteristics.
2010
EVA added new service from Taipei‟s
Songshan Airport to Shanghai‟s Hongqiao
International Airport started from June 14, 2010. It
complemented EVA‟s current nine flights a week
between Taoyuan International Airport and
Pudong International Airport.
Calendar of 2011 & 2012 Events
January 2011
EVA opened its roomy new Diamond VIP
lounge in Terminal 2 at Taoyuan International
Airport on January 20, 2011. The luxurious haven
has been created for the exclusive use of
Evergreen Club Diamond Card members and
Premium Laurel Class ticket holders.
April 2011
Encouraging renewal and supporting
rebuilding, EVA and All Nippon Airways have
expanded code-shared services to include
domestic flights throughout Japan, giving travelers
more convenient access to and from key
international arrival and departure points.
May 2011
Belgium‟s Brussels Airport has honored
EVA Air Cargo with its 2010 Network
Development Award Cargo Airline. This event
marked the airport‟s fourth consecutive awards
program to recognize outstanding cargo and
passengers carriers for punctuality and efficiency,
environment and safety, and network and route
development
June 2011
EVA introduced direct passenger flights
between Taipei, Taiwan and the United States
territory of Guam on June 18, 2011. Starting
with two flights a week, the airline will serve its
new Mariana Islands route using Airbus 330-200s.
September 2011
Chosen to be the official carrier, EVA flew
the two rare birds named Big and Kika from the
Kushiro City Zoo in Hokkaido, Japan to Taiwan
on 14 Sep., 2011.
October 2011
EVA served East Coast travelers with flights
to and from John F. Kennedy International Airport
(JFK), effective on and after Oct. 31, 2011. EVA
relocated passenger services from Newark
International Airport to JFK‟s Terminal One.
EVA teamed up with Sanrio to launch a
second generation of Hello Kitty Jets.
March 2012
Star Alliance accepted the membership
application of EVA Air on March 29, 2012. By
2013 the integration process would be scheduled
to complete.

11
Directors and Supervisors
As of April 30, 2012
Title Name
Date of
Election
(Inaugu-
ration)
Tenure
Date of
Initial
Election,
Appoint-
ment
Shareholding
When Elected
Present
Shareholdings
Shares Held by
Spouses &
Dependents
Shares Held
by Third
Parties
Education &
Experience
Concurrent Positions
in Other Companies
Other Managers, Directors or
Supervisors Related by Marriage
or Within Second-degree Blood
Relationship of Each Other
Number (%) Number (%) Number (%) Number (%) Title Name Relationship
Chairman Evergreen Marine
Corp.
2011.06.10 3 Years 1989.03.31 572,257,481 19.32 629,483,229 19.32 - - - - - - - - -
Representative:
Jeng Kung-Yeun
2011.06.10 3 Years 2009.06.16 0 0.00 99,200 0.00 0 0.00 0 0.00 President, EVA
Airways Corp.
PhD in Traffic and
Transportation,
National Chiao-Tung
University
Chairman, Hsiang-Li
Investment Corp.
Director, Evergreen Sky
Catering Corp.
Director, Evergreen
Aviation Technologies
Corp.
Director, Evergreen Air
Cargo Service Corp.
- - -
Director
Chang Yung-Fa
Foundation
2011.06.10 3 Years 2009.06.16 116,000 0.00 127,600 0.00 - - - - - - - - -
Representative:
Chang Yung-Fa
2011.06.10 3 Years 1989.03.31 0 0.00 98,360,200 3.02 11,354,504 0.35 0 0.00 Chairman, Evergreen
Marine Corp.
Taipei Commercial
High School
Director, Evergreen
Marine Corp.
Director, Evergreen
International. Corp.
Director, Evergreen
Steel Corp.
Director
Super-
visor
Chang
Kuo-Wei
Lin
Long-
Hwa
Son
Brother-in
-law
Representative:
Ko Li-Ching
2012.03.19 2.3 Years 1992.05.02 0 0.00 90,593 0.00 0 0.00 0 0.00 Executive Vice
President, Evergreen
International Corp.
Keelung Girls‟
Senior High School
Director: Taiwan High
Speed Rail Corp.,
Evergreen Steel Corp.,
Shun An Enterprise
Corp.
Supervisor: Evergreen
Marine, Evergreen
International Storage &
Transport, Evergreen
International Corp., Uni
Airways, Evergreen
Security, Ever Reward
Logistics, Taipei Port
Container Terminal,
Evergreen Air Cargo
Service, Evergreen
Airline Services,
Evergreen Aviation
Technologies, Hsin
Yung Enterprise Corp.
- - -

12
Title Name
Date of
Election
(Inaugu-
ration)
Tenure
Date of
Initial
Election,
Appoint-
ment
Shareholding
When Elected
Present
Shareholdings
Shares Held by
Spouses &
Dependents
Shares Held
by Third
Parties
Education &
Experience
Concurrent Positions
in Other Companies
Other Managers, Directors or
Supervisors Related by Marriage
or Within Second-degree Blood
Relationship of Each Other
Number (%) Number (%) Number (%) Number (%) Title Name Relationship
Representative:
Chang Ming-Che
2011.06.10 3 Years 2011.06.10 0 0.00 24,880 0.00 19,742 0.00 0 0.00 President, Evergreen
International Corp.
EMBA, National
Taipei University
Chairman, Evergreen
International Corp.
Director: Ever Accord
Construction, GRETEC
Construction, Charng
Yang Development.
- - -
Director
Evergreen Marine
Corp.
2011.06.10 3 Years 1989.03.31 572,257,481 19.32 629,483,229 19.32 - - - - - - - - -
Representative:
Lin Sun-San
2011.06.10 3 Years 2009.06.16 0 0.00 0 0.00 0 0.00 0 0.00 Chairman, Evergreen
Marine Corp.
National Taipei
University
Chairman, Shun An
Enterprise Corp.
Director: Evergreen
Marine, Evergreen
International Storage &
Transport, Taipei Port
Container Terminal
- - -
Representative:
Tai Jiin-Chyuan
2011.06.10 3 Years 2011.06.10 0 0.00 11,825 0.00 0 0.00 0 0.00 Executive Vice
President, Legal &
Insurance EVA
Airways Corp.
Master degree in
Maritime Law,
National Taiwan
Ocean University
Director: Evergreen
Marine, Taipei Port
Container Terminal
- - -
Director Falcon
Investment
Services Ltd.
2011.06.10. 3 Years 2011.06.10 148,148,114 5.00 162,962,925 5.00 - - - - -
- - - -
Representative:
Chang Kuo-Wei
2011.06.10 3 Years 2001.04.19 0 0.00 0 0.00 0 0.00 0 0.00 Chief Executive Vice
President, EVA
Airways Corp.
Master of Arts in
Economics,
California State
University, Long
Beach
President:
EVA Airways Corp.
Director:
Evergreen Sky Catering,
Uni Airways, Evergreen
Air Cargo Service,
Evergreen Airline
Services, Evergreen
Aviation Technologies,
Hsiang-Li Investment
Corp.
Director Chang
Yung-Fa
Father
13
Title Name
Date of
Election
(Inaugu-
ration)
Tenure
Date of
Initial
Election,
Appoint-
ment
Shareholding
When Elected
Present
Shareholdings
Shares Held by
Spouses &
Dependents
Shares Held
by Third
Parties
Education &
Experience
Concurrent Positions
in Other Companies
Other Managers, Directors or
Supervisors Related by Marriage
or Within Second-degree Blood
Relationship of Each Other
Number (%) Number (%) Number (%) Number (%) Title Name Relationship
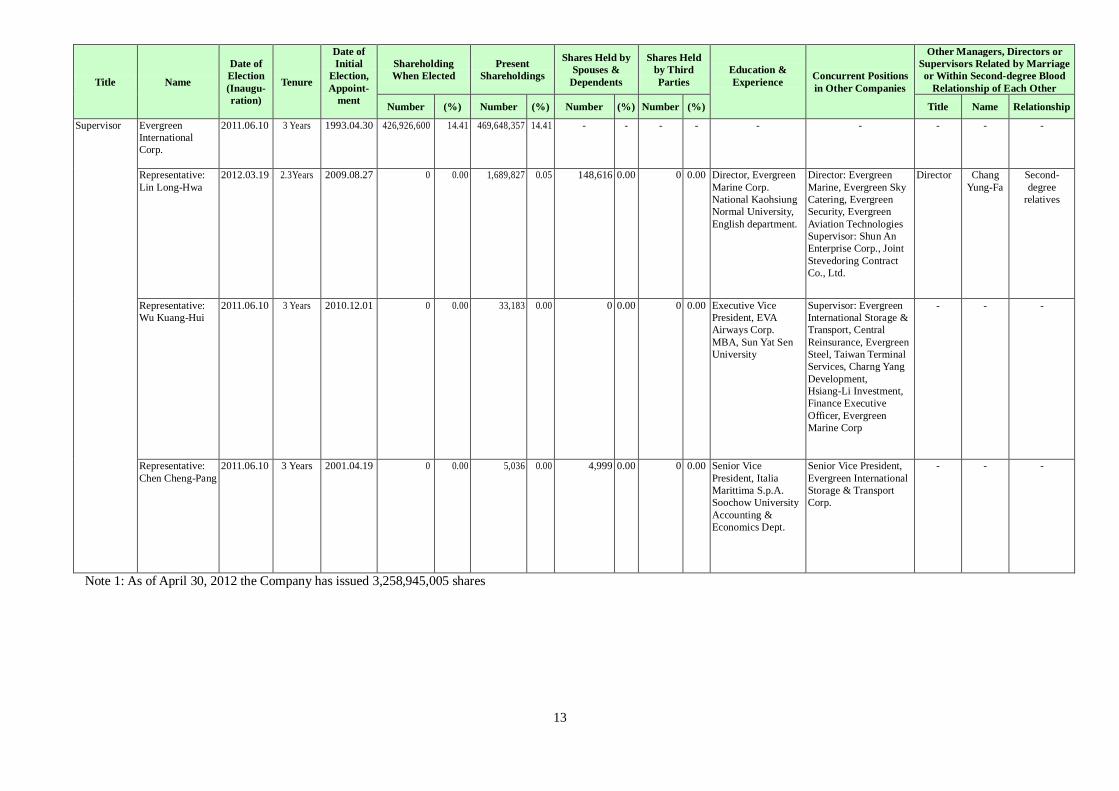
Supervisor Evergreen
International
Corp.
2011.06.10 3 Years 1993.04.30
426,926,600 14.41 469,648,357 14.41 - - - - - - - - -
Representative:
Lin Long-Hwa
2012.03.19 2.3Years 2009.08.27
0 0.00 1,689,827 0.05 148,616 0.00 0 0.00 Director, Evergreen
Marine Corp.
National Kaohsiung
Normal University,
English department.
Director: Evergreen
Marine, Evergreen Sky
Catering, Evergreen
Security, Evergreen
Aviation Technologies
Supervisor: Shun An
Enterprise Corp., Joint
Stevedoring Contract
Co., Ltd.
Director Chang
Yung-Fa
Second-
degree
relatives
Representative:
Wu Kuang-Hui
2011.06.10 3 Years 2010.12.01
0 0.00 33,183 0.00 0 0.00 0 0.00 Executive Vice
President, EVA
Airways Corp.
MBA, Sun Yat Sen
University
Supervisor: Evergreen
International Storage &
Transport, Central
Reinsurance, Evergreen
Steel, Taiwan Terminal
Services, Charng Yang
Development,
Hsiang-Li Investment,
Finance Executive
Officer, Evergreen
Marine Corp
- - -
Representative:
Chen Cheng-Pang
2011.06.10 3 Years 2001.04.19 0 0.00 5,036 0.00 4,999 0.00 0 0.00 Senior Vice
President, Italia
Marittima S.p.A.
Soochow University
Accounting &
Economics Dept.
Senior Vice President,
Evergreen International
Storage & Transport
Corp.
- - -
Note 1: As of April 30, 2012 the Company has issued 3,258,945,005 shares

14
Major Shareholder of EVA Air‟s Institutional Shareholder April 30, 2012
Name of Institutional Shareholder Major Shareholders of Institutional Shareholder
Evergreen Marine Corp. Evergreen International S.A. (Panama)(10.63%),
Chang Kuo-Hua (7.55%),
Evergreen International Corp. (7.12%),
Chang Yung-Fa (6.00%),
Ultra International Investments Ltd. (4.25%),
Chang Kuo-Cheng (4.24%),
Chang Kuo-Ming (3.17%),
Cheng Shen-Chin (2.12%),
Chang Shu-Hua (2.02%),
Bank Taiwan Life Insurance Co., Ltd. (1.55%)
Chang Yung-Fa Foundation Non-profit organization
Falcon Investment Services Ltd. Chang Kuo-Wei (100%)
Evergreen International Corp. Chang Yung-Fa Foundation (28.86%),
Chang Kuo-Cheng (16.67%),
Chang Kuo-Hua (12.90%),
Chang Kuo-Ming (12.19%),
Lee Yu-Mei (7.14%),
Chen Hui-Chu (5.81%),
Yang Mei-Chen (5.10%),
Chang Lin Ching-Chi (5.00%),
Chang Yung-Fa (5.00%),
Tseng Chiung-Hui (1.33%)

15
If the Above-mentioned Shareholders of Major Shareholder of EVA Air‟s
Institutional Shareholder are Corporations, the Principal Shareholders of these
Corporations are as follows: April 30, 2012
Legal Entity Name of Institutional Shareholders Major Shareholders of
Institutional Shareholders
Evergreen Marine Corp. Evergreen International S.A.(Panama) Chang Yung-Fa (20%),
Chang Kuo-Hua (20%),
Chang Kuo-Ming (20%),
Chang Kuo-Cheng (20%),
Pieca Corp. (20%)
Evergreen International Corp.
Chang Yung-Fa Foundation
(28.86%),
Chang Kuo-Cheng (16.67%),
Chang Kuo-Hua (12.90%),
Chang Kuo-Ming (12.19%),
Lee Yu-Mei (7.14%),
Chen Hui-Chu (5.81%),
Yang Mei-Chen (5.10%),
Chang Lin Ching-Chi (5.00%),
Chang Yung-Fa (5.00%),
Tseng Chiung-Hui (1.33%)
Ultra International Investment Ltd. Chang Kuo-Wei (100%)
Bank Taiwan Life Insurance Co., Ltd. Taiwan Financial Holding Co. Ltd.
(100%)
Evergreen International
Corp. Chang Yung-Fa Foundation Non-profit organization

16
Criteria for Expertise and Independence of Directors and Supervisors
Qualifications
Name
Meet One of the Following Qualification Requirements, Together with at Least
Five Years Work Experience Independence Criteria
ConcurrentlyServing as an Independent
Director / Number of
Other Public Companies
An Instructor
or Higher
Position in a
Department of
Commerce,
Law, Finance,
Accounting, or
Other
Academic
Department
Related to the
Business Needs
of the
Company in a
Public or
Private Junior
College,
College or
University
A Judge, Public
Prosecutor, Attorney,
Certified Public
Accountant, or Other
Professional or
Technical Specialists
Who Has Passed a
National
Examination and
Been Awarded a
Certificate in a
Profession Necessary
for the Business of
the Company
Have Work
Experience
in the Area
of
Commerce,
Law,
Finance, or
Otherwise
Necessary
for the
Business of
the
Company
1 2 3 4 5 6 7 8 9 10
Jeng Kung-Yeun -
Chang Yung-Fa -
Lin Sun-San -
Ko Li-Ching -
Chang Ming-Che -
Chang Kuo-Wei -
Tai Jiin-Chyuan
Lin Long-Hwa -
Wu Kuang-Hui -
Chen Cheng-Pang -
(1) Not an employee of the Company or any of its affiliated companies.
(2) Not a director or supervisor of the Company or any of its affiliates. The same does not apply, however, in case
where the person is an independent director of the company, its parent company or any subsidiary in which the
company holds, directly or indirectly, more than 50% of the voting shares.
(3) Not an individual shareholder who holds shares, together with those held by the person‟s spouse, minor children,
or held by the person under others‟ names, in an aggregate amount of 1% or more of the total number of issued
shares of the company or ranking in the top 10 in holdings.
(4) Not a spouse, relative within the second degree of kinship, or lineal relative within the fifth degree of kinship, of
any of the persons in the preceding three subparagraphs.
(5) Not a director, supervisor, or employee of a corporate shareholder that directly holds 5% or more of the total
number of issued shares of the company or that holds shares ranking in the top five in holdings.
(6) Not a director, supervisor, officer, or shareholder holding 5% or more of the shares, of a specified company or
institution that has a financial relationship with the company.
(7) Not a professional individual who, or an owner , partner, director, supervisor, or officer of a sole proprietorship,
partnership, company, or institution that, provides commercial, legal, financial, accounting services or consultation
to the company or any affiliate of the company, or a spouse thereof.
(8) Not having a marital relationship, or a relative within the second degree of kinship to any other director of the
company.
(9) Not been a person of any conditions defined in Article 30 of the Company Code.
(10) Not a government, institutional person or its representative as defined in Article 27 of the Company Code.

17
Compensation for Directors
December 31, 2011
NT$(Thousand)
Title Name
Remuneration for Directors Total of A, B, C and
D as % of 2011 Net
Profit
Compensation Earned as Employee of EVA or EVA Subsidiary Affiliates Total of A, B, C,
D, E, F and G as %
of 2011 Net Profit Other
Compensa
tion from
Non-Subs
idiary
Affiliates
Salary(A) Pension(B) Compensation(C) Allowance(D) Salary, Bonus etc.
(E) Pension(F)
Employee Profit Sharing
(G)
Employee Stock
Option(H)
EVA
Consolidated
Subsidiaries
of EVA
EVA
Consolidated
Subsidiaries
of EVA
EVA
Consolidated
Subsidiaries
of EVA
EVA
Consolidated
Subsidiaries
of EVA
EVA
Consolidated
Subsidiaries
of EVA
EVA
Consolidated
Subsidiaries
of EVA
EVA
Consolidated
Subsidiaries
of EVA
EVA
Consolidated
Subsidiaries of
EVA
EVA
Consolidated
Subsidiaries
of EVA
EVA
Consolidate
d
Subsidiarie
s of EVA
Cash Stock Cash Stock
Chairman
Evergreen
Marine Corp.
Jeng Kung-Yeun
5,836
5,836
-
-
-
5,700
60
60
2.82% 1.54%
3,364
3,364
48
48
-
-
-
-
-
-
4.45%
2.00%
1,101
Director
Chang Yung-Fa
Foundation
Chang Yung-Fa
Lin Bou-Shiu
Chang
Ming-Che
Director
Evergreen
Marine Corp.
Lin Sun-San
Tai Jiin-Chyuan
Director
Falcon
Investment
Services Ltd.
Chang Kuo-Wei

18
Compensation for Supervisors
December 31, 2011
NT$ (Thousand)
Title Name
Remuneration paid to Directors
Total of A, B and C as % of 2011 Net Profit
Other Compensation from Non-Subsidiary
Affiliates
Salary(A) Compensation(B) Allowance(C)
EVA
Consolidated
Subsidiaries of EVA
EVA
Consolidated
Subsidiaries of EVA
EVA
Consolidated
Subsidiaries of EVA
EVA
Consolidated
Subsidiaries of EVA
Supervisor
Evergreen International Corp.
Ko Li-Ching
-
-
-
1,700 - - - 0.23% 2,000 Supervisor
Evergreen International Corp.
Wu Kuang-Hui
Supervisor
Evergreen International
Corp. Chen Cheng-Pang

19
Principal Officers April 30, 2012
Title Name Date of
Inauguration
Shareholding Spouse & Dependent
Shareholding
Shares Held by
Other Nominal
Holder Education and Experience Concurrent Positions
with Other Companies
Manager Related by Marriage or
Within Second-degree Kinship
of Each Other
Number (%) Number (%) Number (%) Title Name Relationship
President Chang Kuo-Wei 2011.01.01 0 0 0 0 0 0
Chief Executive Vice President, EVA Airways
Corp.
Master of Arts in Economics, California State
University, Long Beach
Director, Evergreen Sky
Catering Corp.
Director, Uni Airways
Corp.
Director, Evergreen Air
Cargo Service Corp.
Director, Evergreen
Airline Services Corp.
Director, Evergreen
Aviation Technologies
Corp.
Director, Hsiang-Li
Investment Corp.
- - -
Executive Vice
President,
Project Div.
Cheng Chuan-Yi 2011.03.14 158 0 0 0 0 0
Bachelor degree in International Trade,
Tunghai University
- - - -
Executive Vice
President, (Financial
Officer)
Finance Div.
Tsai Ta-Wei 2011.01.01 588 0 651 0 0 0 Bachelor degree in Accounting, Chinese
Cultural University
Director, Hsiang-Li
Investment Corp.
Supervisor, Evergreen
Sky Catering Corp.
Supervisor, Evergreen
Aviation Technologies
Corp.
- - -
Executive Vice
President,
Safety & Security
Div.
Ho Ching-Sheng 2005.01.01 201,584 0.006 0 0 0 0 Master degree in Flight Safety, University of
Missouri - - - -
Executive Vice
President,
Operation
Management Dept.
Chen Yeou-Yuh 2011.01.01 103 0 0 0 0 0 Bachelor degree in Maritime Science,
Tamkang University - - - -
Executive Vice
President,
Passenger Div.
Li Shyh-Liang 2008.01.01 16,276 0 13 0 0 0 Bachelor degree in Traffic and Transportation
Management, Feng Chia University - - - -
Executive Vice
President,
Cargo Div.
Sun Chia-Ming 2011.04.01 28,123 0.001 0 0 0 0 Bachelor degree in International Trade,
Chinese Cultural University - - - -

20
Title Name Date of
Inauguration
Shareholding Spouse & Dependent
Shareholding
Shares Held by
Other Nominal
Holder Education and Experience Concurrent Positions
with Other Companies
Manager Related by Marriage or
Within Second-degree Kinship
of Each Other
Number (%) Number (%) Number (%) Title Name Relationship
Executive Vice
President,
Flight Operations
Div.
Yuen Ping-Yu 2004.01.01 10,025 0 0 0 0 0 Bachelor degree in Electrical Engineering,
Cheng Kung University - - - -
Executive Vice
President,
Engineering &
Maintenance Div.
Tsao Buo-Yen
2012.03.01 0 0 0 0 0 0
Executive Vice President, Evergreen Aviation
Technologies Corp.
Bachelor degree in Naval Mechatronic
Engineering, Cheng Kung University
- - - -
Executive Vice
President,
Computer Div.
Fang
Gwo-Shianng 2007.01.01 106,846 0.003 0 0 0 0
Deputy Junior Vice President, Evergreen IT
Corp.
Bachelor degree in Computer Science, Feng
Chia University
- - - -
Senior Vice
President,
Auditing Div.
Li Ping-Yin 2008.01.01 65,703 0 700 0 0 0
Manager, Evergreen Heavy Industry Corp.
Master degree in Management, Yuan Ze
University
- - - -
Senior Vice
President,
Project Div. Chai Chien-Hua 2011.07.01 599 0 19 0 0 0
Bachelor degree in International Trade, Chung
Yuan Christian University - - - -
Senior Vice
President,
Passenger Div.
Lu Yu-Chuan 2006.01.01 1,063 0 0 0 0 0
Junior Vice President, Evergreen Aviation
Technologies Corp.
Bachelor degree in Business Administration,
Fu Jen University
- - - -
Senior Vice
President,
Passenger Div.
Chen Chi-Hung 2011.01.01 0 0 0 0 0 0 Department of Mechanical Engineering
Hsinpu Institute of Technology - - - -
Senior Vice
President,
Cargo Div. Lin Tsung-Yen 2012.01.01 0 0 0 0 0 0
Bachelor degree in Navigation Technology,
National Taiwan College of Marine Science
and Technology
- - - -
Senior Vice
President,
Inflight Service Div.
Liu Ying 2011.01.01 9,335 0 0 0 0 0
Master degree in Graduate Institute of Human
Resource Management, National Central
University
- - - -
Senior Vice
President,
Cabin Service Div.
Chang Lih-Lih 2012.01.01 0 0 0 0 0 0
Deputy Senior Vice President, Evergreen Sky
Catering Corp.
Bachelor degree in Statistics, Tamkang
University
- - - -

21
Title Name Date of
Inauguration
Shareholding Spouse & Dependent
Shareholding
Shares Held by
Other Nominal
Holder Education and Experience Concurrent Positions
with Other Companies
Manager Related by Marriage or
Within Second-degree Kinship
of Each Other
Number (%) Number (%) Number (%) Title Name Relationship
Senior Vice
President,
Engineering &
Maintenance Div.
Yeh Ching-Far 2012.01.01 2,110 0 0 0 0 0
Master degree in Business Administrations ,
National Cheng Chi University
Master degree in Mechanical Engineering,
Tatung College of Technology
- - - -
Senior Vice
President,
Airport Div. Soong Allen 2007.01.01 194 0 0 0 0 0
Department of Tourism, World College of
Journalism - - - -
Senior Vice
President,
Computer Div.
Hou Hsien-Yu 2011.01.01 1,100 0 0 0 0 0 Master degree in Information Management,
National Taiwan University - - - -
Deputy Senior Vice
President,
Project Div. Liao Chi-Wei 2011.07.01 464 0 3,341 0 0 0
President(Deputy Junior Vice President),
EZFLY.COM Corporation
Master degree in Marine Biology, National
Sun Yat-sen University
- - - -
Deputy Senior Vice
President,
Project Div.
Huang
Chieh-Chih 2011.07.01 1,406 0 0 0 0 0
Master degree in Business Administration,
National Central University - - - -
Deputy Senior Vice
President,
Project Div. Chiang Wei-Du 2012.01.01 2,200 0 7,676 0 0 0
Deputy Junior Vice President, Evergreen
Aviation Technologies Corp.
Bachelor degree in Foreign Languages and
Literature, National Tsing Hua University
- - - -
Deputy Senior Vice
President,
Personnel Div. Wu Chun-Hung 2012.01.01 28 0 0 0 0 0
Bachelor degree in Business Administration,
National ChengChi University - - - -
Deputy Senior Vice
President,
General Affairs Dept. Yu Ching-Hsi 2012.02.06 40 0 0 0 0 0
Executive Vice President, UNI Airways
Corporation
Deputy Senior Vice President, Evergreen
Marine Corp Taiwan LTD
Bachelor degree in German, Tamkang
University
- - - -
Deputy Senior Vice
President,
Finance Div.
Chiang
Chin-Lan 2012.01.01 8,834 0 0 0 0 0
Bachelor degree in Economics, National
Taiwan University - - - -
Deputy Senior Vice
President,
Finance Div. Ho Li-Cheng 2012.01.01 15,000 0 0 0 0 0
Bachelor degree in Banking and Finance,
Tamkang University - - - -

22
Title Name Date of
Inauguration
Shareholding Spouse & Dependent
Shareholding
Shares Held by
Other Nominal
Holder Education and Experience Concurrent Positions
with Other Companies
Manager Related by Marriage or
Within Second-degree Kinship
of Each Other
Number (%) Number (%) Number (%) Title Name Relationship
Deputy Senior Vice
President,
Operation
Management Dept.
Hsiao
Chin-Lung 2011.07.01 0 0 0 0 0 0
Department of International Trade, Tamsui
Institute of Business Administration - - - -
Deputy Senior Vice
President,
Passenger Div. Yeh Shih-Chung 2011.10.17 61,921 0 0 0 0 0
Bachelor degree in Industrial Management,
National Taiwan Institute of Technology - - - -
Deputy Senior Vice
President,
Passenger Div. Wu Su-Shin 2006.01.01 11,456 0 0 0 0 0
Bachelor degree in Sociology, Fu Jen
University - - - -
Deputy Senior Vice
President,
Cargo Div.
Chuang
Shih-Hsiung 2011.01.01 0 0 0 0 0 0
Bachelor degree in Animal Science and
Biotechnology, Tunghai University - - - -
Deputy Senior Vice
President,
Service
Co-ordination Div.
Yang Hsiu-Huey 2011.01.01 251 0 0 0 0 0 Department of Radio & Television, World
College of Journalism - - - -
Deputy Senior Vice
President,
Cabin Service Div. Tao Shin-Chien 2008.01.01 7,322 0 0 0 0 0
Bachelor degree in Business Administration,
National Chung Hsing University - - - -
Deputy Senior Vice
President,
Cabin Service Div.
Chen Yao-Min 2011.01.01 1,339 0 0 0 0 0 Department of Tourism, World College of
Journalism - - - -
Deputy Senior Vice
President,
Engineering &
Maintenance Div.
Chang
Haur-Chuan 2012.01.01 0 0 6,311 0 0 0
Deputy Senior Vice President, Evergreen
Aviation Technologies Corp.
Department of Marine Engineering, Taipei
College of Maritime Technology
- - - -
Deputy Senior Vice
President,
Airport Div.
Chang
Chun-Huei 2010.07.15 0 0 0 0 0 0
Deputy Senior Vice President, Uni Airways
Corp.
Bachelor degree in English Language and
Literature, Soochow University
- - - -
Junior Vice
President,
(Accounting
Officer) Finance Div.
Chen Chi-Ming 2010.12.01 0 0 0 0 0 0
Bachelor degree in Public Finance, National
Cheng Chi University
- - - -

23
Compensation for President and Executive Vice Presidents December 31, 2011
NT$ (Thousand)
Title Name
Salary(A) Pension(B) Bonus & Perquisite(C) Employee Profit Sharing(D) Total of A, B, C and D
as % of 2011 Net Profit
Employee Stock
Options
Compensation
from Investments
Other than
Subsidiaries
EVA
Consolidated
Subsidiaries
of EVA
EVA
Consolidated
Subsidiaries
of EVA
EVA
Consolidated
Subsidiaries
of EVA
EVA Consolidated
Subsidiaries of EVA
EVA
Consolidated
Subsidiaries
of EVA
EVA
Consolidated
Subsidiaries
of EVA Cash Stock Cash Stock
President Chang Kuo-Wei
22,418 22,418 3,150 3,150 6,176 6,176 0 0 0 0 15.19% 4.23% 0 0 0 Executive
Vice President
Liou Jen-Chih
Cheng Chuan-Yi
Tsai Ta-Wei
Ho Ching-Sheng
Chen Yeou-Yuh
Li Shyh-Liang
Sun Chia-Ming
Yuen Ping-Yu
Fang Gwo-Shianng
Lin Jy-Jong
Tsai Ming-Fang
24
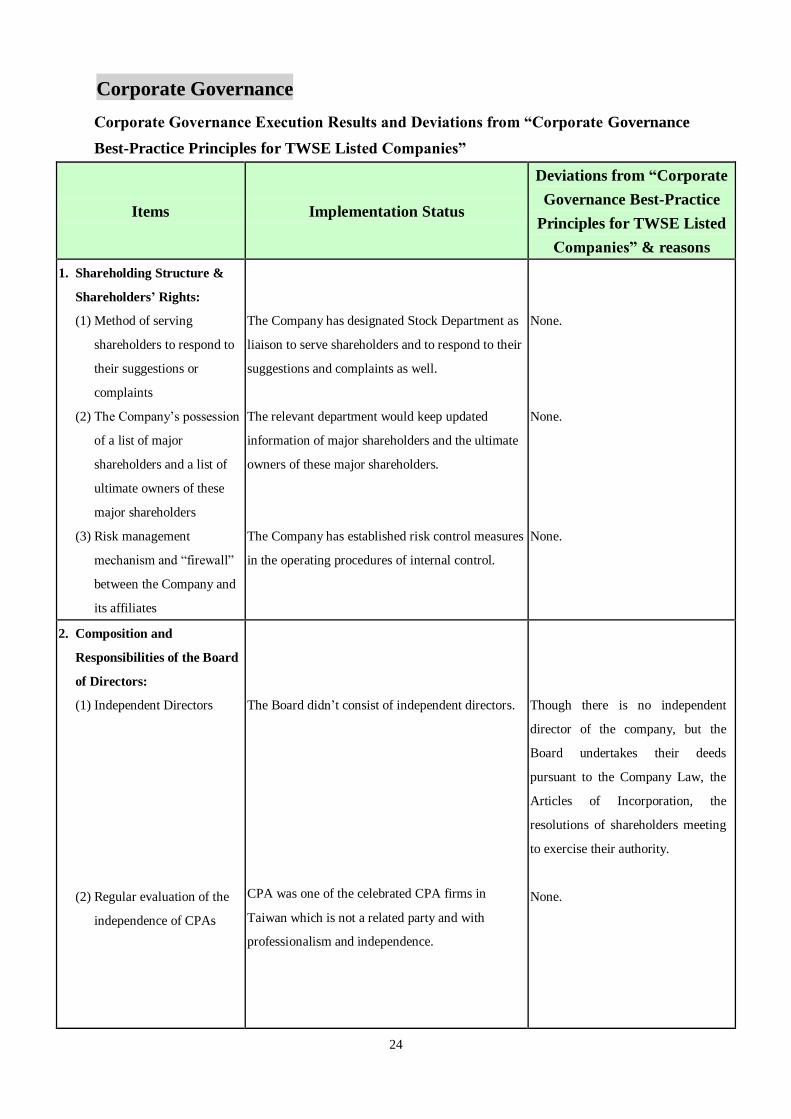
Corporate Governance
Corporate Governance Execution Results and Deviations from “Corporate Governance
Best-Practice Principles for TWSE Listed Companies”
Items Implementation Status
Deviations from “Corporate
Governance Best-Practice
Principles for TWSE Listed
Companies” & reasons
1. Shareholding Structure &
Shareholders‟ Rights:
(1) Method of serving
shareholders to respond to
their suggestions or
complaints
(2) The Company‟s possession
of a list of major
shareholders and a list of
ultimate owners of these
major shareholders
(3) Risk management
mechanism and “firewall”
between the Company and
its affiliates
The Company has designated Stock Department as
liaison to serve shareholders and to respond to their
suggestions and complaints as well.
The relevant department would keep updated
information of major shareholders and the ultimate
owners of these major shareholders.
The Company has established risk control measures
in the operating procedures of internal control.
None.
None.
None.
2. Composition and
Responsibilities of the Board
of Directors:
(1) Independent Directors
(2) Regular evaluation of the
independence of CPAs
The Board didn‟t consist of independent directors.
CPA was one of the celebrated CPA firms in
Taiwan which is not a related party and with
professionalism and independence.
Though there is no independent
director of the company, but the
Board undertakes their deeds
pursuant to the Company Law, the
Articles of Incorporation, the
resolutions of shareholders meeting
to exercise their authority.
None.

25
Items Implementation Status
Deviations from “Corporate
Governance Best-Practice
Principles for TWSE Listed
Companies” & reasons
3. Communication channels
with stakeholders and other
interested parties
The Company has designated relevant departments
to communicate with stakeholders and other
interested parties
None.
4. Information Disclosure:
(1) Construction of a corporate
website to disclose
information regarding the
Company‟s financial,
business and corporate
governance status
(2) Other information
disclosure(i.e. English
language website,
designated persons to
collect and disclose
information, implemented
spokesperson and investor
conference information
disclosed on Company‟s
website etc.)
1. The Company has set up a corporate website
(URL:http://www.evaair.com) and also
designated appropriate persons to monitor the
information about the Company‟s information.
2. Corporate governance status:
The Company has disclosed information of
Articles of Incorporation, important operating
procedures and the resolutions of the Board of
Director meeting.
The Company has established English language
website and spokesperson system which is
responsible for information gathering and
disclosure as well.
None.
None.
5. Operations of the Company‟s
Nomination Committee,
Compensation Committee, or
other committees of varieties
of functions
"The The Company has established the Remuneration
Committee on September 30, 2011 and referring to
Page 37 of Chinese annual report for its operation
status.
None.
6. If the company has set up the principles based on "Corporate Governance Best-Practice Principles for TWSE
Listed Companies", please illustrate the implementation progress and any difference:
Not Applicable. The Company hasn‟t yet set up its governance principles in writing based on the “Corporate Governance
Best-Practice Principles for TWSE Listed Companies”.

26
Items Implementation Status
Deviations from “Corporate
Governance Best-Practice
Principles for TWSE Listed
Companies” & reasons
7. Important information concerning implementation of corporate governance (i.e. employee welfare, employee care,
investor relations, supplier relations, advance learning of directors and supervisors, implementation of risk
management policy and risk metrics, implementation of customer policy, Liability insurance for directors and
supervisors etc. ) :
(1) Besides insuring employees with labor insurance and health insurance, the Company has also insured expatriate staff
with accidents insurance, medical insurance and other insurance programs.
(2) The Company has set up the in-house clinic to provide physician inquiry, medication and free and regular staff health
checkup to ensure health of all the staff.
(3) The Company has designated staff responsible for information gathering, disclose and reply query of investors.
Furthermore, the Company's Website provides operating and financial information for investors ' reference.
(4) The Company in 2011 launched an intelligent new version of the Mobile Web that works on different platforms with
FREE Apps. Anytime, anywhere, passengers can book flights, check mileage balances, get flight information, learn
more about EVA and its services and discover promotional activities, all by simply downloading the EVA Mobile
App.
(5) After promoting and introduction of e-tickets system in 2008, the Company continues to establish Electronic
Miscellaneous Document (EMD) system to achieve overall passenger e-documentation.
(6) After the development of an e-booking platform for our cargo network in 2010, enabling agents and shippers both to
book airfreight space using a web-based application, the Company integrated e-billing into this e-commerce platform
in 2011 and gave our airfreight customers a single entry point and unified system, enhancing and facilitating
operations and services.
(7) Training courses for Directors and Supervisors reveal below:
1. Directors, Mr. Jeng Kung-Yeun, Mr. Lin Sun-San, Ms. Ko Li-Ching, Mr. Chang Ming-Che, Mr. Tai Jiin-Chyuan
and Supervisor, Mr. Wu Kuang-Hui participated in the training course held by the Foundation for the Development
of Securities and Futures Market, ROC on "LCD Panel on international price cartel case and United States anti-trust
litigation" with three hours on March 4, 2011.
2. Supervisor, Mr. Chen Cheng-Pang participated in the training course held by the Foundation for the Development of
Securities and Futures Market, ROC on “Year 2011 insider stock transaction law compliance education conference
for public listed company " with three hours on July 8, 2011.
(8) The Company‟s purchase of liability insurance for Directors and Supervisors:
This Company hadn‟t been purchasing liability insurance for directors and supervisors, which would purchase
depending on situations
8. If the reports of corporate governance are self-examined or commissioned by relevant professional institutions,
please elaborate result, major defects(or suggestions) and remedy:
Not applicable. The Company has neither made a self-examined report of corporate governance nor been commissioned by
the relevant professional institutions.

27
Net Changes in Shareholdings and Shares Pledged by Directors, Supervisors,
Managers and Major Shareholders
Title Name
2011 As of April 30, 2012
Increase
(Decrease) in
Shareholding
Increase
(Decrease) in
Shares Pledged
Increase
(Decrease) in
Shareholding
Increase
(Decrease) in
Shares Pledged
Chairman
Evergreen Marine Corp. 57,225,748
(0) 0 0 0
Representative:
Jeng Kung-Yeun
9,018
(0) 0 0 0
Director
Chang Yung-Fa Foundation 11,600
(0) 0 0 0
Representative:
Chang Yung-Fa
8,941,836
(0) 0 0 0
Representative:
Ko Li-Ching
8,235
(0) 0 0 0
Representative:
Chang Ming-Che
2,261
(0) 0 0 0
Director
Evergreen Marine Corp. 57,225,748
(0) 0 0 0
Representative:
Lin Sun-San 0 0 0 0
Representative:
Tai Jiin-Chyuan
1,075
(0) 0 0 0
Director
Falcon Investment Services
Ltd.
14,814,811
(0) 0 0 0
Representative:
Chang Kuo-Wei 0 0 0 0
Supervisor
Evergreen International Corp. 42,721,757
(0) 0 0 0
Representative:
Lin Long-Hwa 0 0 0 0
Representative:
Wu Kuang-Hui
3,016
(0) 0 0 0
Representative:
Chen Cheng-Pang
457
(0) 0 0 0
Major
Shareholder Evergreen Marine Corp.
57,225,748
(0) 0 0 0
Major
Shareholder Evergreen International Corp.
42,721,757
(0) 0 0 0
President Chang Kuo-Wei 0 0 0 0

28
Title Name
2011 As of April 30, 2012
Increase
(Decrease) in
Shareholding
Increase
(Decrease) in
Shares Pledged
Increase
(Decrease) in
Shareholding
Increase
(Decrease) in
Shares Pledged
Executive Vice
President Cheng Chuan-Yi
14
(0) 0 0 0
Executive Vice
President Tsai Ta-Wei
53
(0) 0 0 0
Executive Vice
President Ho Ching-Sheng
18,325
(0) 0 0 0
Executive Vice
President Chen Yeou-Yuh
9
(0) 0 0 0
Executive Vice
President Li Shyh-Liang
1,479
(0) 0 0 0
Executive Vice
President Sun Chia-Ming
2,556
(0) 0 0 0
Executive Vice
President Yuen Ping-Yu
2
(0) 0
10,000
(0) 0
Executive Vice
President Tsao Buo-Yen 0 0 0 0
Executive Vice
President Fang Gwo-Shianng
9,713
(5,000) 0 0 0
Senior Vice
President Li Ping-Yin
5,973
(0) 0 0 0
Senior Vice
President Chai Chien-Hua
54
(0) 0 0 0
Senior Vice
President Lu Yu-Chuan
96
(8,000) 0 0 0
Senior Vice
President Chen Chi-Hung 0 0 0 0
Senior Vice
President Lin Tsung-Yen 0 0 0 0
Senior Vice
President Liu Ying
848
(0) 0 0 0
Senior Vice
President Chang Lih-Lih 0 0 0 0
Senior Vice
President Yeh Ching-Far
191
(0) 0 0 0
Senior Vice
President Soong Allen
17
(0) 0 0 0
Senior Vice
President Hou Hsien-Yu
100
(0) 0 0 0

29
Title Name
2011 As of April 30, 2012
Increase
(Decrease) in
Shareholding
Increase
(Decrease) in
Shares Pledged
Increase
(Decrease) in
Shareholding
Increase
(Decrease) in
Shares Pledged
Deputy Senior
Vice President Wu Chun-Hung 0 0 0 0
Deputy Senior
Vice President Yu Ching-Hsi 0 0 0 0
Deputy Senior
Vice President Chiang Chin-Lan 0 0 0 0
Deputy Senior
Vice President Ho Li-Cheng 0 0 0 0
Deputy Senior
Vice President Liao Chi-Wei
42
(0) 0 0 0
Deputy Senior
Vice President Huang Chieh-Chih
127
(0) 0 0 0
Deputy Senior
Vice President Chiang Wei-Du 0 0 0 0
Deputy Senior
Vice President Hsiao Chin-Lung 0 0 0 0
Deputy Senior
Vice President Yeh Shih-Chung 0 0 0 0
Deputy Senior
Vice President Wu Su-Shin
1,041
(0) 0 0 0
Deputy Senior
Vice President Chuang Shih-Hsiung 0 0 0 0
Deputy Senior
Vice President Yang Hsiu-Huey
22
(0) 0 0 0
Deputy Senior
Vice President Tao Shin-Chien
665
(0) 0 0 0
Deputy Senior
Vice President Chen Yao-Min
121
(0) 0 0 0
Deputy Senior
Vice President Chang Haur-Chuan 0 0 0 0
Deputy Senior
Vice President Chang Chun-Huei 0 0 0 0
Junior Vice
President Chen Chi-Ming 0 0 0 0
Information on Stock Transfer: Nil
Information on Stock Pledged: Nil

30
Corporate Social Responsibility
Environmental protection, community involvement, social contributions, social services,
social welfare, consumer protection, human rights, health & safety and social responsibility
activities are implemented by the CSR system and implementation status:
Items Implementation Status
Deviations from“CSR
Best-Practice Principles for
TWSE Listed Companies”
& reasons
1. Implementation of Corporate
Governance:
(1) Corporate social
responsibility policy and
performance evaluation
(2) Dedicated organization for
the promotion and execution
of corporate social
responsibility
(3) Regular training and
promotion of corporate ethics
among employees and the
Board of Directors, and
integration with the
employee performance
appraisal system
The Company hasn‟t yet established corporate social
responsibility policy or system and promoted
corporate social responsibility with designated
management (part time) unit. However, the Company
followed Evergreen Group Chairman‟s, Dr. Chang
Yung-Fa, philosophy of "Caring for Taiwan,
Contributing to Society" to invest in social care and
social work, and reach out to the disadvantaged
groups. While actively involved in public welfare
undertakings, the Company offered support for
charitable medication to various areas such as culture,
education, music arena etc..
While the company staff report to work at the first
beginning, we advocated them the code of ethical
conduct and business ethics-related conduct, and
display the relevant provisions in the employee portal
for inspection. Once there is any violation of the
norms of conduct was aroused, the punishment would
be depending on the seriousness which also link with
the performance appraisal system.
The company did not establish
corporate social responsibility
policies or systems, but CSR has
been incorporated into the
company's management principle.
None.
2.Sustainable Environment
Development:
(1) Commitment to improving
resources utilization and the
use of renewable materials
The Company has dedicated to promote various
paperless measures:
1. Electronic inflight reading services
Using advanced electronic devices on the
machine, and all-digital on-demand interactive
entertainment system (AVOD), we provide
environmentally-friendly electronic tourist
None.

31
Items Implementation Status
Deviations from“CSR
Best-Practice Principles for
TWSE Listed Companies”
& reasons
(2) Environmental management
system designed to industry
characteristics
information and passengers can read various travel
information through touch panel.
2. Paperless Electronic Flight Bag
Now flight manuals for the pilots are available in
electronic format and through the web pilot always
could track and instantly access latest flight
information. Since 1998, various types of aircraft
have adopted Electronic Flight Bag which utilized
electronic information to replace paper manuals.
Also through computerized accurately calculation
of take-off and landing performance, the current
usage has reached 100%.
3. IATA“ International aviation e-tickets” Airline
Since October 2000 the Company has adopted
Electronic ticket (e-ticket), combined with the
internal ticketing, travel agents and inter-lines
sales model, which established a comprehensive
paperless electronic ticketing. The Company also
cooperated with the International Air Transport
Association (IATA) to implement Electronic
Miscellaneous Document (EMD) system to
achieve passenger business toward the goal of
paperless environment.
4.IATA「International e-freight」Airlines
The Company successfully passed IATA E-freight
import and export standard measurement
inspection toward the new milestone of paperless
e-freight service. On November 3, 2009, the
Company officially became IATA International
e-freight Airlines.
Since the inauguration in 1991, EVA Air has
actively dedicated green services and even invited
passengers to participate from recycling
newspapers for return flight passengers and
implemented paperless measures including
electronic ticket and electronic flight bag.
None.

32
Items Implementation Status
Deviations from“CSR
Best-Practice Principles for
TWSE Listed Companies”
& reasons
(3) Dedicated environmental
management unit or
personnel
(4) Company strategy for climate
change, energy conservation
and greenhouse gas reduction
The Company not only continues to bring in
fuel-efficient and environmentally-friendly aircraft,
but has set up a cross-departmental「Fuel and
Emissions Reduction Committee (FERC)」which is
directly chaired by chairman / president.
The FERC has developed and promoted various
measures of fuel saving and aircraft weight reduction
to boost aircraft fuel efficiency and eventually reduce
carbon emissions as well.
None.
None.
3. Promotion of social welfare:
(1) Compliance with labor
regulations, protection of
employee rights, and
appropriate management
measures and procedures
(2) Safety and health in working
environment
(3) Disclosure of consumer
rights policy, and official
channel for consumer
complaints
(4) Collaboration with suppliers
The company has established norms and rules at work
in accordance with Labor Act and the related
regulations for the guidance of personnel
management of the Company.
The Company has conducted health and safety
education of new staff in terms of fire safety training,
fire drill workshops, occupational safety and health
workshop. Also, the Company administered
investigation and supervision of occupational hazards
and statistics of occupational hazards to better
employee safety protection measures.
The Company has set up Service Co-ordination
Division to be responsible for dealing with customer
feedback and service quality inspection.
The Company has long been trustworthy partners of
major art museums and art organizations at home and
abroad. Not only has EVA been designated as
specified carriers several times, but also been
rewarded with an Art and Business Award by
Ministry of Culture for many years. In the field of art
without borders, the Company has empowered the
role of culture spreading to help all citizens to extend
their cultural lifer of Taiwan‟s unique culture and
customs into the international realm and even into
None.
None.
None.
None.

33
Items Implementation Status
Deviations from“CSR
Best-Practice Principles for
TWSE Listed Companies”
& reasons
(5) Companies through business
activities, in-kind donations,
corporate volunteer service
or other free professional
services, participation in
community development
activities and charity groups
related conditions.
every corner of the world through the convenience of
air traffic.
1. In 2011, EVA carried two red-crowned cranes
gifted to Taiwan by the Kushiro City Zoo in
Hokkaido, Japan. EVA also successfully carried
four koalas from Currumbin Wildlife Sanctuary in
Queensland, Australia to the Taipei City Zoo in
Taiwan. Both efforts won wide acclaim.
2. Donated the ambulance to Fire Bureau, Taoyuan.
None.
4. Strengthening of information
Disclosure:
(1) Disclosing relevant and
reliable information about
corporate social
responsibility.
(2) Companies prepare the report
of corporate social
responsibility report and
disclosed the status of
promoting corporate social
responsibility.
The implementation of corporate social responsibility
has been disclosed in the annual report and the
Company's Web site.
The company does not currently prepare corporate
social responsibility report.
None.
Despite of no report of CSR, the
Company has set up a dedicated
web page in the corporate website
to disclose relevant information of
CSR and Vision.
5. If the company has set up the principles based on "Corporate Social Responsibility Best-Practice Principles for
TWSE Listed Companies", please illustrate the implementation progress and any difference:
Not Applicable. The Company hasn‟t yet set up its governance principles in writing based on the “Corporate Social
Responsibility Best-Practice Principles for TWSE Listed Companies”.
6. Please state any other important information that would facilitate better understanding on the Company‟s status in
fulfilling corporate social responsibilities (i.e. systems, mechanism, policies that the Company adopts and their
execution results about corporate social responsibilities, such as environmental conservation, community welfare
improvement, contributions to common goods, social service activities, charity and donations, consumer rights,
safety, health, and others):
Please refer to relevant information of implementation about Corporate Governance.
7. If products of the Company or reports of corporate social responsibility have/has been accredited by relevant
accreditation institutions, please elaborate:
Our track record proven quality management system has been certified in accordance with ISO9001 Requirements of the
international standards.

34
Capital and Shares
History of Capitalization
M o nth /Ye ar Pr ic e
Authori zed Capi tal Issued Capi tal
Sources of Capi tal
( „000)
Non-
Monetary
Capi tal
Expansion
Shares
( „000)
Amount
( „000)
Shares
( „000)
Amount
( „000)
03/2008 10 4 ,000,000 40,000,000 3 ,906,815 39,068,150 Corp ora te bond
con vers ion 318,356 -
04/2008 10 4 ,000,000 40,000,000 3 ,942,677 39,426,773 Corp ora te bond
con vers ion 358,623 -
07/2009 10 4 ,000,000 40,000,000 2 ,262,677 22,626,773 Capi tal Reduct ion
16,800, 000 -
09/2009 10 4 ,000,000 40,000,000 2 ,962,677 29,626,773 Cash offer ing
7 ,000,000 -
09/2011 10 4 ,000,000 40,000,000 3 ,258,945 32,589,450
Capi tal i za t ion of
re tained earnings
2 ,962,677
-
Status of Shareholders
As of April 23, 2012
Item \ Entity Government
Agency
Financial
Institution
Other Legal
Entity
Domestic
Individual
Foreign
Institution or
Individual
Total
Number of
Shareholders 5 20 218 131,591 836 132,670
Shareholdings 27,505,912 118,645,199 1,259,054,138 1,285,975,212 567,764,544 3,258,945,005
Holding (%) 0.84 3.64 38.63 39.47 17.42 100.00

35
Distribution of Common Shares
As of April 23, 2012
Range of Shareholdings Number of
Shareholders Number of Shares Holding (%)
1-999 39,409 13,339,498 0.41
1,000-5,000 55,272 126,513,355 3.88
5,001-10,000 17,324 122,529,396 3.76
10,001-15,000 7,953 93,660,715 2.87
15,001-20,000 3,239 57,310,486 1.76
20,001-30,000 3,726 89,686,500 2.75
30,001-50,000 2,705 104,232,978 3.20
50,001-100,000 1,693 117,163,934 3.60
100,001-200,000 743 100,726,467 3.09
200,001-400,000 295 81,140,422 2.49
400,001-600,000 95 46,153,886 1.42
600,001-800,000 33 23,781,202 0.73
800,001-1,000,000 37 34,364,447 1.05
1,000,001 and above 146 2,248,341,719 68.99
Total 132,670 3,258,945,005 100.00
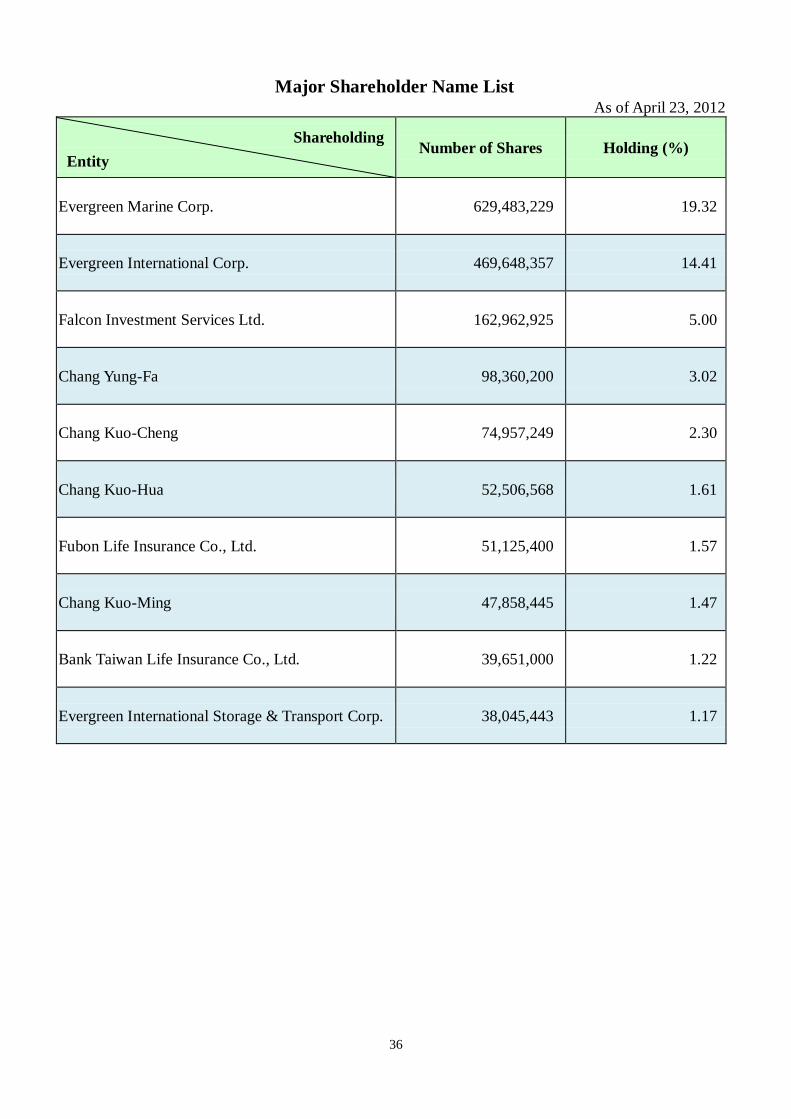
36
Major Shareholder Name List As of April 23, 2012
Shareholding
Entity Number of Shares Holding (%)
Evergreen Marine Corp. 629,483,229 19.32
Evergreen International Corp. 469,648,357 14.41
Falcon Investment Services Ltd. 162,962,925 5.00
Chang Yung-Fa 98,360,200 3.02
Chang Kuo-Cheng 74,957,249 2.30
Chang Kuo-Hua 52,506,568 1.61
Fubon Life Insurance Co., Ltd. 51,125,400 1.57
Chang Kuo-Ming 47,858,445 1.47
Bank Taiwan Life Insurance Co., Ltd. 39,651,000 1.22
Evergreen International Storage & Transport Corp. 38,045,443 1.17

37
Market Price, Net Worth, Earnings and Dividends per Share for Most Recent
Two Years
Year
Items
2010
(Distributed in 2011)
2011
(Distributed in 2012)
2012
(As of April 30 2012)
Market Price
per Share
Highest NT$33.27 NT$37.30 NT$22.50
Lowest NT$9.82 NT$16.15 NT$16.60
Average NT$21.37 NT$25.55 NT$19.80
Net Worth
per Share
Before Distribution NT$13.72 NT$11.62 NT$10.96
After Distribution NT$11.56 - -
Earnings
per Share
Weighted Average Shares 2,962,677,000 shares 3,258,945,000 shares 3,258,945,000 shares
Earnings
per Share
Before Adjustment NT$4.06 NT$0.06 NT$(0.33)
After Adjustment NT$3.69 - -
Dividends
per Share
Cash Dividends NT$1.00 - -
Stock
Dividends
Dividends from
Retained Earnings NT$1.00 - -
Dividends from
Capital Surplus - - -
Return on
Investment
Price/Earnings Ratio
(Note 1) 5.79 - -
Price/Dividend Ratio
(Note 2) 21.37 - -
Cash Dividend Yield Rate
(Note 3) 4.68% - -
Note 1: Price/Earnings Ratio = Average Share Price at Market Close for Current Fiscal Year/Earnings per Share
Note 2: Price/Dividend Ratio = Average Share Price at Market Close for Current Fiscal Year/Cash Dividend per
Share.
Note 3: Cash Dividend Yield Rate = Cash Dividend per Share/Average Market Closing Share Price for
Current Fiscal Year.

38
Dividend Policy and Implementation Status
Dividend Policy
In accordance with Article 26 of EVA‟s Articles
of Incorporation, any earning from the annual
settlement should first be used to offset
accumulated deficits for previous years, after
deducting all applicable taxes and, second,
10% of the balance should be set aside in a
legal reserve; any remainder will be added to
undistributed earnings from the prior period for
distribution after the board of directors
proposes a distribution program with employee
bonuses of no less than 1% and
director/supervisor compensation that does not
exceed 5% of the distributed amount and
submits the program at a shareholders‟ meeting
for resolution.
Since achieving growth status, EVA has
adopted a remainder appropriation method as
its dividend policy to accommodate future
operations and expansion, distributing cash
dividends that range from 0 to 50% and stock
dividends from 100% to 50% alternately. To
maintain profitability and govern the impact of
stock dividends on its operating performance,
EVA may adjust the distribution rate for cash
dividends to 100%~50% and stock dividends
to 0~50% in accordance with capital status if
estimated earnings per share for the current
fiscal year are 20% lower than those of the
previous year.
Dividend Distribution in Current Year
The board adopted a proposal for 2012
dividend distribution at its meeting on March
16, 2012 that no dividend will be distributed to
shareholders.
Employee Bonuses and Compensation Paid
to Directors and Supervisors
Range or Percentage of Employee Bonuses and
Compensation Paid to Directors and
Supervisors Specified in Article 26 of EVA‟s
Articles of Incorporation: Earnings, if any,
from the annual settlement should first offset
accumulated deficits for previous years after
all applicable taxes are deducted and, second,
10% of the balance should be set aside in a
legal reserve; any remainder will be added to
undistributed earnings from the prior period for
distribution after the board of directors
proposes a distribution program with employee
bonuses of no less than 1% and
director/supervisor compensation that does not
exceed 5% of the distributed amount and
submits the program at a shareholders‟ meeting
for resolution.
Proposed Employee Bonus Plan Approved
by Board of Directors
Employee Cash Bonus: Nil
Employee Stock Bonus: Nil
Compensation Paid to Directors and
Supervisors: Nil
Number of shares proposed for distribution to
employees and the percentage of the shares
above capitalized earnings: 0 share, 0%
Estimated EPS after deduction of employee
bonuses and compensation to directors and
supervisors: Not applicable.
Status of Stock Repurchased by EVA: N/A

39
EVA Air People
Items \ Year 2010 2011 2012
(as of Apr. 30 2012)
No. of Employees
Pilots 711 825 832
Cabin Crew 1,421 1,668 1,703
Dispatchers 32 36 36
Maintenance 98 102 101
Other 2,859 3,176 3,151
Total 5,121 5,807 5,823
Average Age 35.4 35.0 35.0
Average Seniority 9.7 9.1 9.9
Education Profile
Distribution (%)
Doctorate 0.10 0.07 0.07
Master‟s 5.27 5.99 6.02
Bachelor‟s 88.35 88.11 87.79
High School 5.87 5.49 5.79
Other 0.41 0.34 0.33

40
Organization
Shareholders
Board of Directors
Chairman
Supervisors
Auditing Div.
Service Quality Committee
Safety Promotion Committee
Corporate Planning Committee Executive Vice President
President
Remuneration Committee
Clin
ic Div
.
Fin
ance D
iv.
Rev
enue A
udit D
ept.
Fin
ance D
ept.
Safety
& S
ecurity
Div
.
Lab
or S
afety &
Health
Div
.
Execu
tive V
ice P
residen
t
Execu
tive V
ice P
residen
t
Gen
eral Affairs D
ept.
Perso
nnel D
iv.
Softw
are Desig
nin
g
Dep
t. I
Softw
are Desig
nin
g
Dep
t. II
Softw
are Desig
nin
g
Dep
t. III
Com
puter D
iv.
Quality
Assu
rance D
ept.
Engin
eering D
ept.
Engin
eering &
M
ainten
ance D
iv.
Airp
ort D
iv.
Operatio
n M
anag
emen
t D
ept.
Tao
yuan
Airp
ort O
ffice
Songsh
an A
irport O
ffice
System
Man
agem
ent
Dep
t.
Foreig
n B
ranch
es
Execu
tive V
ice P
residen
t
Execu
tive V
ice P
residen
t
Execu
tive V
ice P
residen
t
Execu
tive V
ice P
residen
t
Cab
in S
ervice D
iv.
Cab
in S
upply
&
Pro
visio
n D
ept.
Pro
curem
ent D
ept.
Inflig
ht S
ervice D
iv.
Cab
in C
rew T
rainin
g
Dep
t.
Cab
in C
rew
Adm
inistratio
n D
ept.
Flig
ht C
ontro
l Dep
t.
Flig
ht O
peratio
ns D
iv.
Flig
ht M
anag
emen
t D
ept.
Pilo
t Adm
inistratio
n
Dep
t.
Flig
ht T
rainin
g D
ept.
Serv
ice Co
-ord
inatio
n
Div
.
Busin
ess Dep
t.
Taich
ung O
ffice
Kao
hsiu
ng O
ffice
Passen
ger M
anag
emen
t D
ept.
Reserv
ation &
Tariff
Man
agem
ent D
ept.
Passen
ger D
iv.
Execu
tive V
ice P
residen
t
Reserv
ation &
Tick
eting
Dep
t.
Info
rmatio
n
Man
agem
ent D
ept.
Carg
o M
anag
emen
t D
ept.
Carg
o O
peratio
n
Dep
t.
Busin
ess Dep
t.E
xecu
tive V
ice P
residen
tC
argo D
iv.
Project Div.
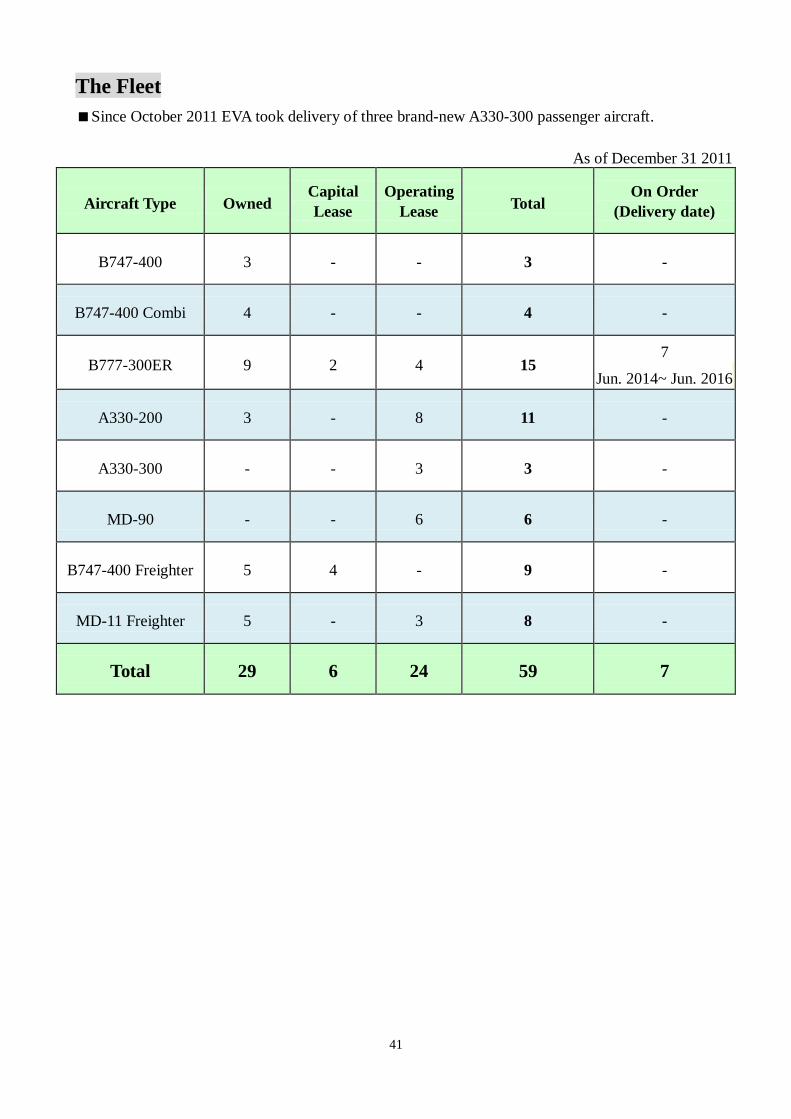
41
The Fleet
Since October 2011 EVA took delivery of three brand-new A330-300 passenger aircraft.
As of December 31 2011
Aircraft Type Owned Capital
Lease
Operating
Lease Total
On Order
(Delivery date)
B747-400 3 - - 3 -
B747-400 Combi 4 - - 4 -
B777-300ER 9 2 4 15 7
Jun. 2014~ Jun. 2016
A330-200 3 - 8 11 -
A330-300 - - 3 3 -
MD-90 - - 6 6 -
B747-400 Freighter 5 4 - 9 -
MD-11 Freighter 5 - 3 8 -
Total 29 6 24 59 7

42
The Market
Passenger Operations
Region
No. of Passenger RPK (Million) Revenue (Million)
2011 2010 % 2011 2010 % 2011 2010 %
America 1,102,104 1,108,358 (0.56%) 11,695 11,915 (1.85%) 22,379 22,016 1.65%
Europe 635,648 550,213 15.53% 4,655 4,175 11.50% 8,439 7,291 15.75%
Asia 4,887,855 4,729,434 3.35% 7,431 7,212 3.04% 28,179 26,469 6.46%
Oceania 37,246 47,946 (22.32%) 252 324 (22.22%) 513 621 (17.39%)
Total 6,662,853 6,435,951 3.53% 24,033 23,627 1.72% 59,510 56,397 5.52%
Cargo Operations
Region
Cargo carried (Tons) FTK (Million) Revenue (Million)
2011 2010 % 2011 2010 % 2011 2010 %
America 281,887 304,549 (7.44%) 3,456 3,637 (4.98%) 22,585 26,708 (15.44%)
Europe 65,061 74,852 (13.08%) 650 741 (12.28%) 4,658 5,536 (15.86%)
Asia 444,884 469,357 (5.21%) 769 777 (1.03%) 9,266 8,976 3.23%
Oceania 1,228 1,859 (33.94%) 8 13 (38.46%) 54 73 (26.03%)
Total 793,060 850,617 (6.77%) 4,883 5,168 (5.51%) 36,563 41,293 (11.45%)
Major Competitors and Market Shares
Item 2010 2011
Number of Flights
EVA Airways 37,807 38,744
Taiwan 202,982 209,692
Market Share (%) 18.63 18.48
Number of Passengers
EVA Airways 6,267,704 6,457,718
Taiwan 29,556,305 31,220,036
Market Share (%) 21.21 20.68
Tons of Cargo
EVA Airways 500,693 479,268
Taiwan 1,812,829 1,686,984
Market Share (%) 27.62 28.41
Data Source: Monthly Digest of Statistics, CAA

43
2012 Outlook After 2012 presidential election, Taiwan will see the coming of a more stable political environment, increased cross-strait trade, gradual relaxation of policy limitations on visitors from Mainland China and frequent, regularly scheduled cross-strait flights, which will lead to more business and leisure travel. Prospects for EVA‟s major routes worldwide are described in the paragraphs that follow.
American routes
The Company operates 45 direct passenger
flights to the United States and Canada weekly:
17 to Los Angeles, five to New York, 12 to San
Francisco, five to Seattle, three to Vancouver
and three to Toronto. We effectively extend
these routes in the respective domestic markets
by code sharing with other leading airlines,
including American Airlines and US Airways.
EVA‟s freighter service to North America is our
major source of cargo revenue. Starting with
the 2012 summer schedule, we have allocated
25 cargo flights a week to the North American
market. In addition to existing airfreight
gateways on the East and West Coasts and in
Middle America, eg, Los Angeles, Atlanta,
Chicago, Dallas and New York, we will add
freighter stops in either Seattle or San
Francisco. The additional cargo gateways will
enhance flexibility of our existing freighter
routes, accommodate customer demands and
strengthen our airfreight network density
between Asia and North America. On
December 2, 2011, the Company launched
east-bound round-the-world services from New
York to Brussels, giving customers served by
our North American sales channels a more
comprehensive cargo network.
European routes
EVA has 16 scheduled nonstop passenger
flights a week to Europe, including three to
Amsterdam, three to Vienna, three to Paris and
seven to London. We give passengers on these
routes comfortable and convenient service.
Starting with the 2012 summer schedule, we
allocated capacity on three airfreight fights to
Brussels and Frankfurt. The Company is also
collaborating with leading global airfreight
carriers British Airways and Lufthansa to offer
regular, dedicated cargo services and extend
our network within Europe. These joint
operations upgrade overall performance in the
region.
Australian route
EVA‟s Australian route primarily serves the
tourism market. In view of market demand and
operating costs, the Company will continue our
two weekly Taipei - Brisbane flights and
ongoing code-share with Qantas Airlines.
Asian routes
Following inauguration of regular cross-strait
services on August 31, 2009, EVA and our
regional subsidiary UNI Air are now operating
105 scheduled weekly flights between Taiwan
and Mainland China. We serve 25 destinations:
Beijing, Shanghai Pudong, Shanghai Hongqiao,
Guangzhou, Shenzhen, Fuzhou, Xiamen,
Hangzhou, Nanjing, Ningbo, Tianjin, Dalian,
Qingdao, Chongqing, Chengdu, Zhengzhou,
Jinan, Shenyang, Xian, Kunming, Yanchen,
Guilin, Haikou, Harbin and Huangshan.
In addition to four regular weekly freighter
flights to Shanghai and Guangzhou, the
Company added one-to-three more to Nanjing,
Xiamen and Chongqing. We anticipate that this
capacity and level of service will contribute
positively and substantially to cross-strait
cultural, economic, tourism and logistics
efficiencies and deliver greater profitability.
Taiwan‟s geographic location makes it an ideal
pivot point for traffic between North America
and Southeast Asia. The Company is leveraging
this geographic superiority and, at the same
time, supporting the government‟s goal of
establishing Taiwan as the leading Asia Pacific
Operations Center with our extensive route
network connecting North America and Asia.
Despite the global economic downturn, the
Asia-Pacific region still has potential for cargo
business. China continues to stand out as a
dominate business and trade driver in the
region. The Company will continue to optimize
opportunities such as those created by the
Economic Cooperation Framework Agreement
(ECFA) in the summer of 2010. Catalyzing
acceleration of China‟s domestic demand and
44
identifiable advantages stemming from the
ASEAN-Plus-One free-trade zone, the
Company will strategically seek greater shares
of the markets in China and Asia.

45
The Network
EVA Air launched Taipei – Guam passenger service in June 2011.
EVA Air flied into JFK-Passenger services relocated from Newark, effective on Oct. 31 2011.
EVA Air launched Taipei - Haikou passenger service in October 2011.
EVA Air launched Taipei - Guilin passenger service in November 2011
EVA Air launched Taipei - Harbin passenger service in December 2011.
As of December 31 2011
North
America
Los Angeles San Francisco Seattle Anchorage Atlanta Chicago
Dallas Vancouver JFK Houston Toronto Guam
Oceania Brisbane
Europe Vienna London Frankfurt Amsterdam Brussels Paris
Asia
Osaka Fukuoka Taipei
(Taoyuan) Kaohsiung Hong Kong Macau
Bangkok Kuala
Lumpur Penang Jakarta Bali Surabaya
Singapore Ho Chi Minh
City Seoul Manila
Tokyo (Narita)
Sapporo
Phnom Penh Sendai Hanoi Delhi Nagoya Komatsu
Tokyo (Haneda)
Taipei (Songshan)
Mainland
China
Shanghai (Pudong)
Beijing Guangzhou Hangzhou Tianjin Ningbo
Shanghai (Hongqiao) Xiamen Nanjing Jinan Zhengzhou Chongqing
Haikou Guilin Harbin Chengdu
Air cargo destination only
Total 61 destinations

46
Principal Subsidiaries
As of December 31 2011
Company Principal
Activities Location
Date
Founded Capital Share%
Evergreen Airline
Services Corp.
Ground
handling Taiwan Oct. 1990 NT$379.83 million 56.33%
Evergreen Aviation
Technologies Co.,
Ltd.
Aircraft
repair and
maintenance
Taiwan Nov. 1997 NT$4.35 billion 80.00%
Evergreen Air
Cargo Service
Corp.
Cargo terminal
operation Taiwan Mar. 2000 NT$1.2 billion 60.00%
Evergreen Sky
Catering Corp. Airline catering Taiwan Oct. 1993 NT$1 billion 49.80%
Hsiang-Li
Investment Corp.
Investment
business Taiwan Jan. 2001 NT$25 million 100%
Evergreen Airways
Service (Macau)
Ltd.
Investment
business Macau Dec. 1994 US$12,488 99.00%
Green Siam Air
Services Co., Ltd. Travel business Thailand May 1990 THB20 million 49.00%
RTW Air
Services(S) Pte.
Ltd.
Travel business Singapore Oct. 1989 SG$1.5 million 49.00%
PT Perdana
Andalan Air
Service
Travel business Indonesia May 1991 IDR1.6 billion 51.00%
Sky Castle
Investment Ltd.
Investment
business Samoa Feb. 2005 US$5.5 million 100%
Concord Pacific
Ltd.
Investment
business Samoa Apr. 2005 US$74.1 million 100%
Sino Gain Limited Aircraft
Leasing Samoa Aug. 2009 US$25,000 100%

47
Important Resolutions by Shareholders and BOD
Important Shareholders‟ Resolutions
Date of
Meeting Summary of Important Proposals
Result of
Resolutions Execution
June 10, 2011
1. Distribution of retained earnings:
Stock dividend of 100 shares for
every 1,000 shares amounts to
NT$2,962,677,280. Cash
dividend of NT$1 per share
amounts to NT$2,962,677,277.
Accepted by all
present
shareholders
with unanimous
consent.
Cash dividend and stock
dividend have been issued
on Sep. 19 2011 and Oct. 5
2011 respectively.
2. To execute capitalization of
retained earnings which amounts
to NT$2,962,677,280 for issuing
296,267,728 new shares.
Accepted by all
present
shareholders
with unanimous
consent.
The new shares have been
traded in Taiwan Stock
Exchange on Oct. 5 2011.
3. To amend the Procedures for
Fund Lending and
Endorsements/Guarantees.
Accepted by all
present
shareholders
with unanimous
consent.
The related operations have
been followed by amended
Procedures for Fund
Lending and Endorsements/
Guarantees accordingly.
4. To elect seven Directors and two
Supervisors in accordance with
article of incorporation.
Elect seven
Directors and
two Supervisors
The directors and
supervisors re-election has
been approved by the
Commerce Department,
Ministry of Economic
Affairs and registered (no.
10001176870) on Aug. 2
2011. Newly appointed
directors and supervisors
have executed matters in
accordance with article of
incorporation and alike.
5. To release newly elected
directors in 2011 shareholder
meeting from non-competition
restriction.
Accepted by all
present
shareholders
with unanimous
consent.
Being executed in
accordance with the
resolution.

48
Date of
Meeting Summary of Important Proposals
Result of
Resolutions Execution
June 10, 2011
6. To amend Article of
Incorporation.
Accepted by all
present
shareholders
with unanimous
consent.
Being executed in
accordance with the
resolution.
7. To amend the election rule of
Directors and Supervisors.
Accepted by all
present
shareholders
with unanimous
consent.
The election of directors
and supervisors has been
executed in accordance with
election rule of Directors
and Supervisors.
Important Resolutions by the Board of Directors
Date of Meeting Important Proposals
March 22, 2011
1. To accept 2010 Report of Operation and 2010 Financial Statements.
2. To accept 2010 Profit Distribution Proposal.
3. To execute capitalization of retained earnings for new share issue.
4. To accept 2010 Internal Control System and present a Declaration of Internal
Control.
5. To amend Internal Control System and Internal Auditing Implementation
Rules.
6. To accept 2011 Operation Plan.
7. To amend the Procedures for Fund Lending and Endorsements/Guarantees.
8. To accept the resolution of re-elect Directors and Supervisors in 2011
shareholders meeting.
9. To propose to release re-electing Directors and Supervisors from
non-competition restriction.
10.To stipulate date and venue for convening 2011 Annual General Shareholders'
meeting.
April 29, 2011
1. To amend Article of Incorporation.
2. To amend the election rule of Directors and Supervisors.
3. To amend 2011 Annual General Shareholder Meeting agendas and notices.
May 27, 2011
1. To accept the resolution of that fuel surcharges collected would be in
violation of U.S. anti-trust law.
2. To appoint Ms. Rose Li as Deputy Spokesperson effective from May 30
2011.
3. To release managers from non-competition restriction.

49
Date of Meeting Important Proposals
4. To issue 16th secured corporate bond.
June 10, 2011
To elect Mr. Jeng Kung-Yeun as Chairman.
August 5, 2011
1. To set August 29, 2011 as base date for the dividend distribution and set
September 19, 2011 as cash dividend payment date.
2. To establish branches in Mainland China.
August 26, 2011 1. To accept 2011 1H Financial Statements.
2. To set September 20, 2011 as dividend distribution and capital increase date.
September 30, 2011
1. To enter sales and leaseback agreement of two MD-11 freighters.
2. To establish Remuneration Committee and set up agendas for Committee.
3. To appoint Mr. Hsu Shui-Teh, Mr. Eugene Chien and Mr. Lin Sun-San as the
members of Remuneration Committee.
October 14, 2011
To sell two MD-11 freighters.
December 30, 2011
1. To appoint Certified Public Accountant and approve the fee.
2. To establish 2012 Internal Audit Plan.
3. To procure one MD-11 freighter from C & L Leasing Company Ltd.
4. To approve compensation structure and performance incentive system of
directors and supervisors.
5. To approve manager‟s performance incentive system.
6. To approve compensation structure (including pension plan) of managers and
current name list (including salary and allowance).
7. To approve 2011 annual bonus of managers.
8. To approve 2012 managers change and compensation.
9. To approve 2012 remuneration of chairman.
10. To approve 2011 annual bonus of chairman.
February 14, 2012
1. To procure one simulator of A320-200 and one simulator of B777-300ER.
2. To approve the construction of 2nd
Training building in Nankan office area
commissioned by related party of " Ever Accord Construction Co., Ltd."
March 16, 2012
1. To accept 2011 Financial Statements and Consolidated Financial Statements.
2. To accept 2011 Profit Distribution Proposal.
3. To approve 2011 Operation Report.
4. To accept 2012 Operation Plan.
5. To accept 2011 Declaration of Internal Control.
6. To amend Internal Control System & Internal Auditing Implementation Rules.

50
Date of Meeting Important Proposals
7. To enter sales and leaseback agreement of one MD-11 freighter.
8. To enter purchase agreement of three B777-300ER passenger aircraft.
9. To enter purchase agreement of three A321-200 spare engines.
10. To issue 17th secured corporate bond.
11. To amend Article of Incorporation.
12. To amend election rule of Directors and Supervisors.
13. To amend Annual General Shareholder Meeting Agendas and Notices.
14. To amend the Procedures for Asset Procurement and Disposal.
15. To stipulate date and venue for 2012 Annual General Shareholders' meeting.

51
Financial and Operating Results
Financial Results
Balance Sheet NT$ (Thousand)
Year
Item 2011 2010
Variance
Amount %
Current Assets 32,841,444 34,373,857 (1,532,413) (4.46)
Funds and Investments 13,449,975 11,850,022 1,599,953 13.50
Fixed Assets 87,529,888 95,802,438 (8,272,550) (8.64)
Intangible Assets 301,345 149,633 151,712 101.39
Other Assets 5,123,260 5,853,569 (730,309) (12.48)
Total Assets 139,245,912 148,029,519 (8,783,607) (5.93)
Current Liabilities 33,383,685 36,392,207 (3,008,522) (8.27)
Long-Term Liabilities 64,952,297 69,054,677 (4,102,380) (5.94)
Other Liabilities 3,036,655 1,947,373 1,089,282 55.94
Total Liabilities 101,372,637 107,394,257 (6,021,620) (5.61)
Common Stock 32,589,450 29,626,772 2,962,678 10.00
Capital Surplus 2,626,446 2,649,436 (22,990) (0.87)
Retained Earnings(Deficit) 6,301,045 12,016,736 (5,715,691) (47.56)
Other Adjustments (3,643,666) (3,657,682) 14,016 (0.38)
Total Stockholders‟ Equity 37,873,275 40,635,262 (2,761,987) (6.80)

52
Income Statement
NT$(Thousand)
Year
Item 2011 2010
Increase
(Decrease)
Amount
Change
(%)
Operating Revenue 102,192,051 104,410,011 (2,217,960) (2.12)
Operating Cost 94,411,785 84,789,200 9,622,585 11.35
Gross Profit from Operations 7,780,266 19,620,811 (11,840,545) (60.35)
Operating Expenses 7,332,713 6,972,063 360,650 5.17
Operating Income 447,553 12,648,748 (12,201,195) (96.46)
Non-Operating Income and Gain 1,675,937 1,476,477 199,460 13.51
Non-Operating Expense and Loss 1,886,123 2,079,958 (193,835) (9.32)
Income before Income Tax 237,367 12,045,267 (11,807,900) (98.03)
Income Tax Benefit (Expense) (28,339) (28,531) 192 (0.67)
Net Income 209,028 12,016,736 (11,807,708) (98.26)
Analysis of deviation of more than 20% in gross profit margin:
NT$(Thousand)
Before and After Period
of Increase (Decrease)
Change Amount
Favorable (Unfavorable) Variance
Item Variance on
Sales Price
Variance on
Cost
Variance on Sales
Segmentation
Variance on
Volume Other
Passenger (5,256,752) 1,889,471 (7,232,403) (94,149) 180,329 -
Cargo (7,311,357) (2,675,111) (4,410,257) 510,119 (736,108) -
Other 727,564 - - - - 727,564
Total (11,840,545) (785,640) (11,642,660) 415,970 (555,779) 727,564
Variance on sales price:
A. Passenger: The ticket fare increase led to a favorable result amounting to
NT$1,889,471,000.
B. Cargo: Airfreight rate decrease in Europe and US routes stemming from global economic
recession led to an unfavorable result amounting to NT$2,675,111,000.
Variance on cost:
Fuel price spike led to a negative result amounting to NT$11,642,660,000.
Variance on sales segmentation:
A. Passenger: Lower profit margin than last year amid rising fuel prices led to an unfavorable
result amounting to NT$94,149,000.
B. Cargo: The routes rationalization triggered by US airfreight rate decrease coupled with
volume dip in US routes stemming from rising fuel cost and economic downturn led to a
favorable result amounting to NT$510,119,000.

53
Variance on volume:
A. Passenger: Acceleration of passenger volume attributed from subsequent launching new
destinations in China route led to a positive result amounting to NT$180,329,000.
B. Cargo: Deceleration of cargo volume stemming from by global economic recession led to
an unfavorable result amounting to NT$736,108,000.
Other: Decrease in miscellaneous expenses led to a favorable result amounting to
NT$727,564,000.
Cash Flow Analysis
Changes in cash flow analysis over recent two years
Year
Item 2011 2010
Change
(%)
Ratio of Cash Flow (%) 40.48 52.96 (23.56)
Cash Flow Adequacy Ratio (%) 59.64 35.00 70.40
Ratio of Re-investment for Cash (%) 6.73 12.19 (44.79)
Economy slowdown in 2011 has contributed a decrease of net cash inflow from operating
activity compared with last year. The results lead to relatively decreases in the Ratio of Cash
Flow and Ratio of Re-investment for Cash.
Remedy Measures for Inadequate Liquidity
EVA expects to make financing through mid and long-term unsecured loans and issuing
corporate bonds.
Liquidity Analysis for the Coming Year
NT$(Thousand)
Initial Cash
Balance
(1)
Net Cash Flow
from Operations
During This Year
(2)
Cash Outflows
During This Year
(3)
Cash Balance
(Negative)
(1)+(2)-(3)
Remedy Measures for Negative
Cash Balance
Investment Plans Financing Plans
13,666,643 7,882,502 14,244,901 7,304,244 - -
Operating activities: The Company estimate cash flow from operations in the next one year
would accumulate to NT$7,882,502,000.
Investment activities: The estimated long-term equity investment and equipment purchase reach
NT$3,644,227,000.
Financing activities: The estimated both mid and long-term mortgage loans reach NT$10,600,674,000.

54
Remedy Measures for Inadequate Cash Liquidity: N/A
Impact of Major Capital Expenditures on Financial Operations in Recent Years
The Company has not engaged with significant capital expenditures in 2011.
Recent Reinvestment Policy, Major Reason of Profit & Loss, Remedy Actions
and Forward Investment Plan
The recent reinvestments entered mainly concentrate on integration of aviation relative business
to ensure service quality. Stemming from outstanding operating performance of subsidiaries
including Evergreen Aviation Technologies Co., Ltd., Evergreen Sky Catering Corp., Evergreen
Airline Services Corp., and Evergreen Air Cargo Service Corp., the Company reported
investment income of NT$1,052,528,000.
The Company has not entered with any reinvestment plan on next year.
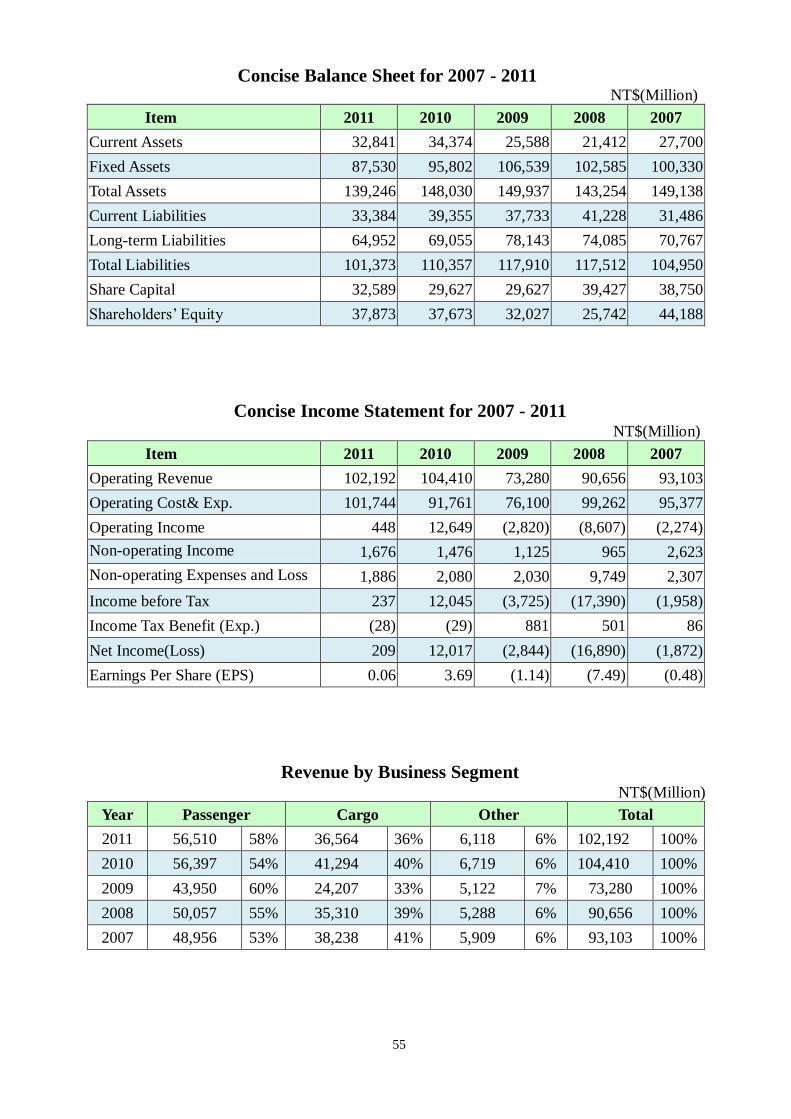
55
Concise Balance Sheet for 2007 - 2011
NT$(Million)
Item 2011 2010 2009 2008 2007
Current Assets 32,841 34,374 25,588 21,412 27,700
Fixed Assets 87,530 95,802 106,539 102,585 100,330
Total Assets 139,246 148,030 149,937 143,254 149,138
Current Liabilities 33,384 39,355 37,733 41,228 31,486
Long-term Liabilities 64,952 69,055 78,143 74,085 70,767
Total Liabilities 101,373 110,357 117,910 117,512 104,950
Share Capital 32,589 29,627 29,627 39,427 38,750
Shareholders‟ Equity 37,873 37,673 32,027 25,742 44,188
Concise Income Statement for 2007 - 2011 NT$(Million)
Item 2011 2010 2009 2008 2007
Operating Revenue 102,192 104,410 73,280 90,656 93,103
Operating Cost& Exp. 101,744 91,761 76,100 99,262 95,377
Operating Income 448 12,649 (2,820) (8,607) (2,274)
Non-operating Income 1,676 1,476 1,125 965 2,623
Non-operating Expenses and Loss 1,886 2,080 2,030 9,749 2,307
Income before Tax 237 12,045 (3,725) (17,390) (1,958)
Income Tax Benefit (Exp.) (28) (29) 881 501 86
Net Income(Loss) 209 12,017 (2,844) (16,890) (1,872)
Earnings Per Share (EPS) 0.06 3.69 (1.14) (7.49) (0.48)
Revenue by Business Segment
NT$(Million)
Year Passenger Cargo Other Total
2011 56,510 58% 36,564 36% 6,118 6% 102,192 100%
2010 56,397 54% 41,294 40% 6,719 6% 104,410 100%
2009 43,950 60% 24,207 33% 5,122 7% 73,280 100%
2008 50,057 55% 35,310 39% 5,288 6% 90,656 100%
2007 48,956 53% 38,238 41% 5,909 6% 93,103 100%

56
Financial Ratio
Item Type of ratio 2011 2010 2009 2008 2007
Financial Structure
(%)
Debt Ratio 72.80 72.55 78.64 82.03 70.37
Ratio of Long-Term Liabilities and
Stockholders‟ Equity to Fixed Assets 117.47 114.50 103.41 97.31 114.58
Solvency
(%)
Current Ratio 98.38 94.45 67.81 51.94 87.97
Quick Ratio 69.32 66.23 42.70 27.19 54.62
Times Interest Earned Ratio(Times) 1.12 6.97 (0.83) (4.82) 0.10
Operating
Performance
Average Collection Turnover (Times) - - - - -
Average Collection Days for Receivables - - - - -
Average Inventory Turnover (Times) - - - - -
Average Days for Sale of Goods - - - - -
Fixed Assets Turnover (Times) 1.11 1.03 0.70 0.89 1.01
Total Assets Turnover (Times) 0.71 0.70 0.49 0.63 0.62
Profitability
Return on Total Assets (%) 1.11 9.05 (0.93) (10.15) (0.15)
Return on Stockholders‟ Equity (%) 0.53 33.08 (9.85) (48.30) (4.14)
Operating Income to Paid -in Capital (%) 1.37 42.69 (9.52) (21.83) (5.87)
Return on Sales (%) 0.20 11.51 (3.88) (18.63) (2.01)
Earnings Per Share (NT$) 0.06 3.69 (1.14) (7.49 ) (0.48)
Cash Flow
(%)
Ratio of Cash Flows 40.48 52.96 - - 23.39
Cash Flow Adequacy Ratio 59.64 35.00 8.99 27.69 41.71
Ratio of Re-Investment for Cash 6.73 12.19 - - 4.80
Leverage Degree of Operating Leverage 51.24 2.75 (6.60) (1.47) (9.65)
Financial Leverage (0.37) 1.16 0.59 0.76 0.51
Note:
(1) Debt Ratio: Total Liabilities/Total Assets
(2) Ratio of Long-term Liabilities and Stockholders‟ Equity to Fixed Assets:
(Net Stockholder Equity + Long-term Liabilities) / Net Fixed Assets
(3) Current Ratio: Current Assets/Current Liabilities
(4) Quick Ratio: Liquid Assets/Current Liabilities
(5) Times Interest Earned Ratio (Times): Earning Before Taxes and Interest Expense/Interest Expense
(6) Fixed Assets Turnover: Net Sales/ Fixed Assets
(7) Total Assets Turnover: Net Sales/Total Assets
(8) Return on Total Assets: (Income after Tax + Interest Expenses)/Total Assets
(9) Return on Stockholders‟ Equity: Income after Tax/Average Stockholders‟ Equity
(10) Operating Income to Paid -in Capital: Operating Income/Capital
(11) Return on Sales: Income after Tax/ Net Sales
(12) Ratio of Cash Flows: Fund from Operating/Current Liability
(13) Cash Flow Adequacy Ratio: 5-Year Sum of Cash from Operation/5-Year Sum of Capital Expenditures, Incremental
Inventory, and Cash Dividends
(14) Ratio of Re-investment for Cash: (FFO- Cash Dividend)/ (Gross Fixed Assets + Long-term Investment + Other Assets +
Working Capital)
(15) Degree of Operating Leverage: (Net Sales – Operating Variable Cost and Expense) / Operating Income
(16) Financial Leverage: Operating Income / (Operating Income – Interest Expense)

57
Operating Results
Item 2011 2010 2009 2008 2007
Overall Capacity (Million) 8,719 8,838 7,188 7,957 8,986
Overall Traffic (Million) 7,044 7,294 5,672 6,142 6,954
Overall Load Factor (%) 80.8 82.5 78.9 77.2 77.4
Overall Yield (NT$) 13.64 13.39 12.02 13.90 12.54
Passenger Capacity (Million) 30,800 29,632 29,311 28,853 29,785
Passenger Traffic (Million) 24,033 23,627 22,689 22,944 24,226
Passengers Carried („000) 6,663 6,436 6,022 5,788 6,181
Passenger Load Factor (%) 78.0 79.7 77.4 79.5 81.3
Passenger Yield (NT$) 2.48 2.39 1.94 2.18 2.02
Cargo Capacity (Million) 5,947 6,171 4,550 5,360 6,305
Cargo Traffic (Million) 4,883 5,168 3,630 4,077 4,774
Cargo Carried (Tons) 793,060 850,617 609,734 681,289 785,222
Cargo Load Factor (%) 82.1 83.7 79.8 76.1 75.7
Cargo Yield (NT$) 7.49 7.99 6.67 8.66 8.01
Unit Cost (NT$) 11.67 10.38 10.59 12.47 10.61
Number of Aircraft 59 56 55 53 52
Number of Employees 5,807 5,121 4,486 4,772 5,153
Capacity per Employee (Thousand) 1,501 1,726 1,602 1,667 1,744
Traffic per Employee(Thousand) 1,213 1,424 1,264 1,287 1,350
Revenue per Employee (Thousand) 17,598 20,389 16,335 18,997 18,068
58
EVA AIRWAYS CORP.
Financial Statements
December 31, 2011 and 2010 (With Independent Auditors' Report Thereon)
Address: No. 376 Hsin-nan Road, Sec. 1, Luchu, Taoyuan Hsien, Taiwan
Telephone No.: 886(03)3515151

59
Independent Auditors’ Report
The Board of Directors
EVA Airways Corp.:
We have audited the balance sheets of EVA Airways Corp. (the “Company”) as of December 31, 2011 and 2010, and the related statements of operations, changes in stockholders’ equity, and cash flows for the
years ended. These financial statements are the responsibility of the Company’s management. Our
responsibility is to express an opinion on these financial statements based on our audits. We did not audit the financial statements of certain non-consolidated investee companies. The Company’s investments in
these companies as of December 31, 2011 and 2010, were evaluated using the equity method, and the
resulting book values of these investments amounted to NT$3,029,549 thousand and NT$3,295,808
thousand, constituting 2.18% and 2.23% of total assets, respectively. The cumulative translation adjustments from the aforementioned investments amounted to NT$8,549 thousand and NT$5,683
thousand, respectively. The resulting investment gains amounted to NT$459,591 thousand, and
NT$417,043 thousand, constituting 194% and 3.46% of income before income tax, for the years 2011 and 2010, respectively. The financial statements of these companies were audited by other auditors, whose
reports were furnished to us, and our opinion, insofar as it relates to these amounts included for the said
investee companies, is based solely on the reports of the other auditors.
We conducted our audits in accordance with the “Regulations Governing Auditing and Certification of
Financial Statements by Certified Public Accountants” and auditing standards generally accepted in the
Republic of China. Those standards and regulations require that we plan and perform the audit to obtain reasonable assurance about whether the financial statements are free of material misstatement. An audit
includes examining, on a test basis, evidence supporting the amounts and disclosures in the financial
statements. An audit also includes assessing the accounting principles used and significant estimates made by management, as well as evaluating the overall financial statement presentation. We believe that
our audits and the reports of the other auditors provide a reasonable basis for our opinion.
In our opinion, based on our audits and the reports of the other auditors, the financial statements referred to in the first paragraph present fairly, in all material respects, the financial position of the Company as of
December 31, 2011 and 2010, and the results of its operations and its cash flows for the years ended, in
conformity with the “Guidelines Governing the Preparation of Financial Reports by Securities Issuers”, and accounting principles generally accepted in the Republic of China.

60
The Company adopted newly issued SFASs, the effects of which are as stated in note 3 to the
accompanying financial statements.
Taipei, Taiwan (the Republic of China)
March 16, 2012

61
EVA AIRWAYS CORP.
Balance Sheets
December 31, 2011 and 2010 (Expressed in Thousands of New Taiwan Dollars)
Assets 2011 2010
Current assets:
Cash and cash equivalents (note 4(a)) $ 13,666,643 14,145,427
Available-for-sale financial assets-current (note 4(b)) 2,410,548 1,943,977
Derivative financial assets for hedge purposes-current (note 4(p)) 69,953 -
Notes receivable, net (note 4(c)) 317,587 230,608
Accounts receivable, net (note 4(c)) 5,922,310 7,441,116
Accounts receivable-related parties (note 5) 178,556 190,539
Other receivables 43,096 75,538
Other receivables-related parties (note 5) 532,038 74,920
Inventories (notes 4(d), 5 and 6) 7,804,560 8,526,069
Other prepayments 564,663 499,163
Deferred income tax assets-current (note 4(m)) 1,305,608 1,210,647
Other current assets 25,882 35,853
Total current assets 32,841,444 34,373,857
Funds and investments:
Available-for-sale financial assets-non-current (notes 4(b) and 6) 677,772 991,131
Financial assets carried at cost-non-current (note 4(b)) 2,530,348 2,251,437
Long-term equity investments under equity method
(note 4(e)) 10,241,855 8,607,454
Total funds and investments 13,449,975 11,850,022
Property, plant and equipment (notes 4(f), 4(g), 5, 6 and 7):
Land 1,869,572 1,869,572
Buildings 4,611,207 4,580,032
Machinery and equipment 10,287,164 9,490,907
Aircraft 104,506,976 98,529,606
Leased assets 17,403,103 16,687,570
138,678,022 131,157,687 Less: accumulated depreciation (51,165,827) (46,652,712)
Advances for purchases of equipment 17,693 11,297,463
Net property, plant and equipment 87,529,888 95,802,438
Intangible assets:
Deferred pension cost (note 4(l)) 301,345 149,633
Other assets:
Refundable deposits (note 7) 1,722,823 1,733,899
Deferred charges (note 4(h)) 125,448 68,598
Deferred income tax assets-non-current (note 4(m)) 3,202,626 3,332,996
Other assets (note 6) 72,363 718,076
Total other assets 5,123,260 5,853,569
Total assets $ 139,245,912 148,029,519
Liabilities and Stockholders’ Equity 2011 2010
Current liabilities:
Accounts payable $ 1,801,200 1,589,218
Accounts payable-related parties (note 5) 2,822,992 2,473,943
Accrued expenses 8,181,776 7,234,011
Other payables-related parties (note 5) 173,542 153,394
Other payables (notes 4(k), 5 and 6) 3,066,250 3,520,070
Unearned revenue 7,379,677 6,620,271
Current portion of long-term liabilities (notes 4(i), 4(j) and 6) 6,146,068 11,756,574
Other current liabilities (note 4(g)) 3,812,180 3,044,726
Total current liabilities 33,383,685 36,392,207
Long-term liabilities: Bonds payable (note 4(j)) 10,200,000 5,000,000
Long-term borrowings (notes 4(i) and 6) 32,990,485 38,237,583
Installment accounts payable (notes 4(k), 5 and 6) 12,758,681 15,460,630
Lease liability-non-current (note 4(g)) 9,003,131 10,356,464
Total long-term liabilities 64,952,297 69,054,677
Other liabilities:
Accrued employee retirement liabilities (note 4(l)) 1,357,097 398,222
Other liabilities 1,679,558 1,549,151
Total other liabilities 3,036,655 1,947,373
Total liabilities 101,372,637 107,394,257
Stockholders’ equity (notes 4(b), 4(e), 4(l), 4(m), 4(n) and 4(p)):
Common stock 32,589,450 29,626,772
Capital surplus 2,626,446 2,649,436
Retained earrings:
Legal reserve 1,201,674 - Special reserve 3,657,682 -
Unappropriated earnings 1,441,689 12,016,736
Total retained earnings 6,301,045 12,016,736
Other stockholders’ equity adjustments:
Cumulative translation adjustments (2,579,360) (3,554,690)
Net loss not yet recognized as net pension cost (1,266,896) (511,128)
Unrealized gains or losses on financial instruments 202,590 408,136
Total other stockholders’ equity adjustments (3,643,666) (3,657,682)
Total stockholders’ equity 37,873,275 40,635,262
Commitments and contingencies (notes 5 and 7)
Total liabilities and stockholders’ equity $ 139,245,912 148,029,519
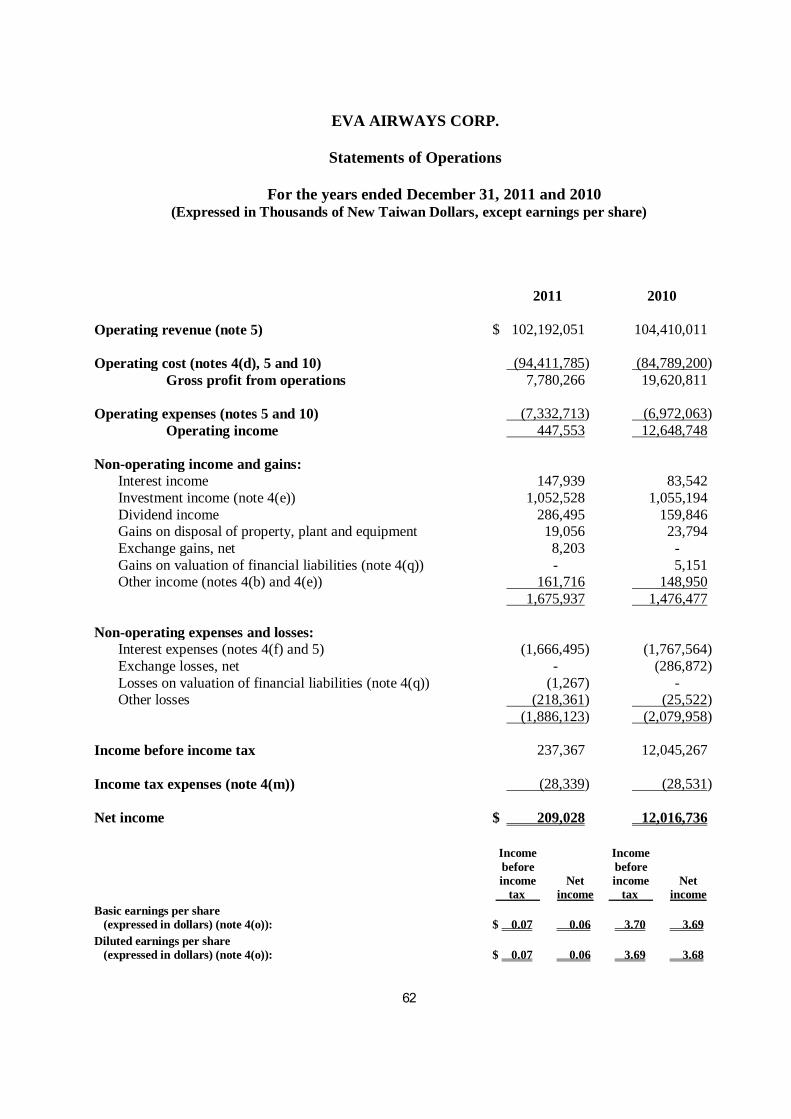
62
EVA AIRWAYS CORP.
Statements of Operations
For the years ended December 31, 2011 and 2010 (Expressed in Thousands of New Taiwan Dollars, except earnings per share)
2011 2010
Operating revenue (note 5) $ 102,192,051 104,410,011
Operating cost (notes 4(d), 5 and 10) (94,411,785) (84,789,200)
Gross profit from operations 7,780,266 19,620,811
Operating expenses (notes 5 and 10) (7,332,713) (6,972,063)
Operating income 447,553 12,648,748
Non-operating income and gains:
Interest income 147,939 83,542
Investment income (note 4(e)) 1,052,528 1,055,194
Dividend income 286,495 159,846 Gains on disposal of property, plant and equipment 19,056 23,794
Exchange gains, net 8,203 -
Gains on valuation of financial liabilities (note 4(q)) - 5,151 Other income (notes 4(b) and 4(e)) 161,716 148,950
1,675,937 1,476,477
Non-operating expenses and losses:
Interest expenses (notes 4(f) and 5) (1,666,495) (1,767,564)
Exchange losses, net - (286,872)
Losses on valuation of financial liabilities (note 4(q)) (1,267) - Other losses (218,361) (25,522)
(1,886,123) (2,079,958)
Income before income tax 237,367 12,045,267
Income tax expenses (note 4(m)) (28,339) (28,531)
Net income $ 209,028 12,016,736
Income
before
income
tax
Net
income
Income
before
income
tax
Net
income
Basic earnings per share
(expressed in dollars) (note 4(o)):
$ 0.07
0.06
3.70
3.69
Diluted earnings per share
(expressed in dollars) (note 4(o)):
$ 0.07
0.06
3.69
3.68

63
EVA AIRWAYS CORP.
Statements of Changes in Stockholders' Equity
For the years ended December 31, 2011 and 2010 (Expressed in Thousands of New Taiwan Dollars)
Common
Stock
Capital
Surplus
Legal Reserve
Special
Reserve
Retained
Earnings
(Accumulated
Deficit)
Cumulative
Translation
Adjustments
Net Loss Not
Yet
Recognized
As Net Pension
Cost
Unrealized
Gains or losses
on Financial
Instruments
Total
Balance on January 1, 2010 $ 29,626,772 5,564,505 - - (2,915,074) 423,833 (157,412) (515,511) 32,027,113 Make-up of accumulated deficit - (2,915,074) - - 2,915,074 - - - -
Increase in net equity due to change in percentage of capital surplus in long-term equity
investments under equity method - 5 -
- - - - - 5 Change in net equity due to recording net loss not yet recognized as net pension cost in
long-term equity investments under equity method - - -
- - - (44,828) - (44,828)
Recognized net loss not yet recognized as net pension cost - - - - - - (308,888) - (308,888)
Change in net equity due to change in percentage of unrealized gains or losses on financial instruments in long-term equity investments under equity method
-
-
-
-
-
- -
18,217 18,217
Change in unrealized gains on financial instruments - - - - - - - 905,430 905,430
Net income for the year ended December 31, 2010 - - - - 12,016,736 - - - 12,016,736 Translation adjustments for the year ended December 31, 2010 - - - - - (3,978,523) - - (3,978,523)
Balance on December 31, 2010 29,626,772 2,649,436 - - 12,016,736 (3,554,690) (511,128) 408,136 40,635,262
Appropriation approved by 2011 stockholders’ meeting: (Note) Legal reserve - - 1,201,674 - (1,201,674) - - - -
Special reserve - - - 3,657,682 (3,657,682) - - - -
Cash dividends - - - - (2,962,678) - - - (2,962,678)
Stock dividends 2,962,678 - - - (2,962,678) - - - - Disposal of long-term equity investments under equity method - (22,990) - - 637 - 1,512 (919) (21,760)
Change in net equity due to recording net loss not yet recognized as net pension cost in
long-term equity investments under equity method - - -
- - - (19,328) - (19,328) Recognized net loss not yet recognized as net pension cost - - - - - - (737,952) - (737,952)
Change in net equity due to change in percentage of unrealized gains or losses on financial
instruments in long-term equity investments under equity method
-
-
-
-
-
-
-
(21,157)
(21,157) Change in unrealized gains on financial instruments - - - - - - - (183,470) (183,470)
Net income for the year ended December 31, 2011 - - - - 209,028 - - - 209,028
Translation adjustments for the year ended December 31, 2011 - - - - - 975,330 - - 975,330
Balance on December 31, 2011 $ 32,589,450 2,626,446 1,201,674 3,657,682 1,441,689 (2,579,360) (1,266,896) 202,590 37,873,257
Note: The amounts of employees’ bonuses and directors’ and supervisors’ remuneration amounting to $100,000 and $53,000, respectively, were deducted from the net income.

64
EVA AIRWAYS CORP.
Statements of Cash Flows
For the years ended December 31, 2011 and 2010 (Expressed in Thousands of New Taiwan Dollars)
2011 2010
Cash flows from operating activities: Net income $ 209,028 12,016,736 Adjustments to reconcile net income to net cash provided by (used in) operating activities:
Depreciation 9,513,922 9,275,815 Amortization and maintenance expense 28,370 25,830
Investment income (1,052,528) (1,055,194) Proceeds from cash dividends on long-term equity investments 419,014 367,650 Losses on disposal and obsolescence of property, plant and equipment 48,163 6,127 Gains on disposal of investments (25,725) (3,376) Amortization expense recorded as interest expenses 37,437 83,158 Amortization of other deferred gain (61,701) (53,636) Other losses 204,753 - Changes in operating assets and liabilities, net:
Financial assets at fair value though profit or loss - 17,247
Notes receivable (86,979) 58,592 Accounts receivable 1,518,806 (635,663) Accounts receivable-related parties 11,983 (27,571)
Other receivables 32,442 (53,089) Other receivables-related parties (457,118) 111,059
Inventories 721,509 164,314 Other prepayments (65,500) 64,885 Other current assets 9,971 (14,480) Financial liabilities at fair value through profit or loss - (685,797) Accounts payable 211,982 420,805 Accounts payable-related parties (43,700) 315,284
Accrued expenses 947,765 1,377,397 Other payables-related parties 20,148 4,454
Other payables (22,323) (3,138,768) Unearned revenue 759,407 640,056 Other current liabilities 681,801 163,804 Accrued employee retirement liabilities (81,886) (147,321) Other liabilities 34,439 (26,266)
Net cash provided by operating activities 13,513,480 19,272,052
Cash flows from investing activities: Decrease (increase) in available-for-sale financial assets-current (452,176) 2,625,966
Proceeds from disposal of investment-non-current 187,505 -
Payments for purchase of investment-non-current (121,254) -
Payments for purchase of in long-term equity investments under equity method (1,453,728) - Proceeds from disposal of long-term equity investments under equity method 220,000 - Proceeds from withdrawal of financial assets carried at cost 4,211 12,871 Payments for purchase of property, plant and equipment (1,048,724) (4,080,714) Proceeds from disposal of property, plant and equipment 1,991,774 1,151
Decrease (increase) in refundable deposits 58,301 (144,692) Increase in deferred charges (122,657) (63,516) Decrease in other assets 645,713 271,358
Net cash used in investing activities (91,035) (1,377,576)
Cash flows from financing activities: Decrease in short-term borrowings - (979,994) Issue of bonds payable 10,200,000 - Redemption of bonds payable (9,000,000) (3,100,000)
Increase in long-term borrowings 2,500,000 20,791,400 Redemption of long-term borrowings (13,120,381) (23,222,197) Redemption of lease liability (1,518,170) (1,457,006) Cash dividends (2,962,678) -
Net cash used in financing activities (13,901,229) (7,967,797)
Net increase (decrease) in cash and cash equivalents (478,784) 9,926,679
Cash and cash equivalents at beginning of year 14,145,427 4,218,748
Cash and cash equivalents at end of year $ 13,666,643 14,145,427
Additional disclosure of cash flow information: Interest paid $ 1,930,638 1,894,742 Less: capitalized interest 27,885 214,189 Interest paid (excluding capitalized interest) $ 1,902,753 1,680,553 Income tax paid $ 84,032 32,676
Supplemental schedule of noncash investing and financing activities: Current portion of long-term liabilities and bonds payable $ 6,146,068 11,756,574 Inventory transferred from fixed assets $ - 13
Translation adjustments $ 975,330 (3,978,523) Unrealized gains or losses on financial instruments $ (205,546) 923,647 Increase in lease liability $ 39,123 - Others $ 392,748 1,080,479

65
EVA AIRWAYS CORP.
Notes to Financial Statements
December 31, 2011 and 2010
(Expressed in Thousands of New Taiwan Dollars Unless Otherwise Specified)
1. Organization and Business Scope
EVA Airways Corp. (the Company) was incorporated on April 7, 1989, as a corporation limited by
shares under special permission of the Ministry of Transportation and Communications and under the Company Act of the Republic of China (ROC). The Company commenced commercial operations on
July 1, 1991.
The Company’s business activities are
1.1 to engage in fixed-wing aircraft transport business, scheduled air transport business, and nonscheduled air transport business;
1.2 to carry on the business of freight agent, including operation, transportation and maintenance;
1.3 to repair and maintain fuselages, aircraft engines, navigational instruments and related equipment, etc.;
1.4 to carry on the business of marketing aircraft facilities, equipment, and fittings;
1.5 to process and manufacture machinery and spare parts;
1.6 to publish magazines in the field of aviation;
1.7 to provide on-the-job training delegated by other organizations and entities (no recruitment from the general public is allowed);
1.8 to engage in maintaining flying facilities for navigational training;
1.9 to engage in import and export trading for the foregoing activities (excluding businesses requiring
a permit);
1.10 to provide consultant services for business operation and management;
1.11 to provide general advertising services;
1.12 to engage in the retailing of tobacco and alcohol;
1.13 to engage in general merchandise activities;
1.14 to engage in the retailing of food and beverages;
1.15 to engage in the retailing of apparel;
1.16 to engage in the retailing of umbrellas;
1.17 to engage in the retailing of hats and caps;
1.18 to engage in the retailing of books and stationery;
1.19 to engage in the retailing of sporting goods;
1.20 to engage in the retailing of toys and amusement goods;

EVA AIRWAYS CORP.
Notes to Financial Statements
66
1.21 to engage in the retailing of watches and clocks;
1.22 to engage in the retailing of glasses;
1.23 to engage in the retailing of weights and measures;
1.24 to engage in the retailing of jewelry and precious metals;
1.25 to engage in the retailing of telecommunication equipment;
1.26 to engage in the retailing of photographic equipment;
1.27 to carry out any business which is not forbidden or restricted by the applicable laws and regulations,
excluding those requiring licensing.
As of December 31, 2011 and 2010, the Company had 5,807 and 5,121 employees, respectively.
2. Summary of Significant Accounting Policies
The financial statements are the English translation of the Chinese version prepared and used in the
Republic of China. If there is any conflict between, or any difference in the interpretation of, the
English and Chinese language financial statements, the Chinese version shall prevail.
The Company prepared the accompanying financial statements in accordance with ROC generally
accepted accounting principles and the “Guidelines Governing the Preparation of Financial Reports by Securities Issuers”. The basis of measurement is considered as historical cost, not unless, if it is
specified.
The major accounting policies and basis of measurement used in preparing the financial statements are
summarized below.
(a) Use of estimates
The preparation of the accompanying financial statements requires management to make estimates
and assumptions that affect the reported amounts of assets and liabilities and disclosures of contingent assets and liabilities at the date of the financial statements and reported amounts of
revenues and expenses during the reporting periods. Actual results could differ from these estimates.

EVA AIRWAYS CORP.
Notes to Financial Statements
67
(b) Foreign currency transactions and translations
The Company maintains its books in New Taiwan dollars. Foreign currency transactions during the year are translated at the exchange rates on the transaction dates. Foreign currency-denominated
assets and liabilities are translated into New Taiwan dollars at the exchange rate prevailing on the
balance sheet date, and the resulting translation gains or losses are recognized as non-operating income or expenses. In accordance with amended Statement of Financial Accounting Standards
(SFAS) No. 14 “The Effects of Changes in Foreign Exchange Rates”, non-monetary assets and
liabilities that are measured in terms of historical cost in a foreign currency are translated using the exchange rate at the date of the transaction. Non-monetary assets and liabilities denominated in
foreign currencies that are stated at fair value are translated into NT dollars at foreign exchange
rates ruling at the dates the fair value was determined. If the financial assets or liabilities are
evaluated at fair value through profit or loss, the resulting unrealized exchange income (loss) from such translations is reflected in the accompanying statements of operations. If the adjustments of
financial assets or liabilities are evaluated at fair value through stockholders’ equity, the resulting
unrealized exchange income (loss) from such translations is recorded as a separate component of stockholders’ equity.
For equity investments in foreign companies which are accounted for by the equity method, the translation differences resulting from translating foreign financial statements from the functional
currency into the reporting currency are reported as cumulative translation adjustments.
Cumulative translation adjustments are reported as a separate component of stockholders’ equity.
(c) Translation of foreign currency for foreign operating units
The Company regards the aircraft purchased with its own US dollar funds and US dollar loans and operated for international passenger and cargo transportation business as “foreign operating units”.
The US dollar-denominated aircraft purchase costs and the related US dollar loans at the balance
sheet date are translated into New Taiwan dollars at the exchange rates prevailing on the balance sheet date. The US dollar-denominated aircraft depreciation amounts are translated into New
Taiwan dollars at the current year’s average exchange rate. The translation differences resulting
from these translations are reported as cumulative translation adjustments.
The US dollar-denominated lease assets and lease liability arising from capital lease of aircraft at
the balance sheet date are translated into New Taiwan dollars at the exchange rates prevailing on the balance sheet date. The US dollar-denominated leased aircraft depreciation amounts are translated
into New Taiwan dollars at the current year’s average exchange rate. The translation differences
resulting from these translations are reported as cumulative translation adjustments.
In addition, the translation differences resulting from the translation of refundable deposits for
aircraft leases into New Taiwan dollars at the exchange rate prevailing on the balance sheet date are
also reported as cumulative translation adjustments.

EVA AIRWAYS CORP.
Notes to Financial Statements
68
(d) Classification of current and non-current assets and liabilities
Cash or cash equivalents, and assets that will be held primarily for the purpose of being traded or are expected to be realized within 12 months after the balance sheet date are classified as current
assets; all other assets shall be classified as non-current.
Liabilities that will be held primarily for the purpose of being traded or are expected to be settled
within 12 months after the balance sheet date are classified as current liabilities; all other liabilities
shall be classified as non-current.
(e) Asset impairment
The Company assesses at each balance sheet date whether there is any indication that an asset (individual asset or cash-generating unit) may have been impaired. If any such indication exists,
the Company estimates the recoverable amount of the asset. The Company recognizes impairment
loss for an asset whose carrying value is higher than the recoverable amount.
The Company reverses an impairment loss recognized in prior periods for assets other than goodwill
if there is any indication that the impairment loss recognized no longer exists or has decreased. The carrying value after the reversal should not exceed the recoverable amount or the depreciated or
amortized balance of the assets assuming no impairment loss was recognized in prior periods.
The Company assesses the goodwill and intangible assets that have indefinite lives or that are not yet available for use on an annual basis and recognizes an impairment loss on the carrying value in
excess of the recoverable amount.
(f) Cash and cash equivalents
Cash and cash equivalents includes cash on hand, savings and checking deposits, fixed time deposits,
miscellaneous petty cash. Cash equivalents represent highly liquid debt instruments, such as commercial paper and bank acceptances with original maturities of three months or less. Cash
equivalents also include other highly liquid investments which do not have a significant level of
market risk related to potential interest rate changes.
(g) Financial instruments
The Company adopted transaction-date accounting for financial instrument transactions. At initial
recognition, financial instruments are evaluated at fair value. Except for financial assets and
liabilities measured at fair value through profit or loss, acquisition cost or issuance cost is added to
the original recognized amount.

EVA AIRWAYS CORP.
Notes to Financial Statements
69
Subsequent to initial recognition, financial instruments are classified into the following categories in
accordance with the purpose of holding or issuing such financial instruments:
1. Financial assets/liabilities at fair value through profit or loss
Financial instruments are classified into this category if the purpose of acquisition is principally for selling or repurchasing in the near term. Except for effective hedging derivative financial
instruments, all financial derivatives are included in this category. At initial recognition,
financial instruments are evaluated at fair value, and transaction cost or issuance cost is recognized in current profit or loss. Changes in fair values are charged to current operations at
subsequent measurement. Trade-date accounting is adopted when purchasing or selling such
financial instruments under transaction conventions.
2. Available-for-sale financial assets
Financial instruments that are recognized as available-for-sale financial assets are measured at fair value, and transaction costs are added to the originally recognized amount at initial
recognition. Any changes in fair value, excluding impairment loss and unrealized foreign
currency exchange gain or loss, are reported as a separate component of stockholders’ equity until realized. Realized gain or loss on financial instruments is charged to current operations. If
there is objective evidence of impairment, an impairment loss is recognized in profit or loss. If,
in a subsequent period, events or changes in circumstances indicate that the amount of
impairment loss has decreased, the previously recognized impairment loss for equity securities is reversed to the extent of the decrease and recorded as an adjustment to equity, while for debt
securities, the reversal is allowed through profit or loss provided that the decrease is clearly
attributable to an event which occurred after the impairment loss was recognized.
3. Financial assets carried at cost
When the Company does not have significant influence over an investee company whose fair value cannot be reliably measured, these financial instruments are carried at their original cost.
If there is objective evidence which indicates that a financial asset is impaired, a loss is
recognized. A subsequent reversal of such impairment loss is not allowed.
4. Notes receivable, accounts receivable, and other receivables
Notes receivable and accounts receivable originate from providing goods or services directly to
a debtor, and other receivables originate from non-operating activities.
The Company considers evidence of impairment for financial assets carried at cost at both a specific asset and collective level. All individually significant receivables and held-to-maturity
investment securities are assessed for specific impairment. Those that are not individually
significant are collectively assessed for impairment by grouping together. All individually significant financial assets found not to be specifically impaired are then collectively assessed
for any impairment that has been incurred but not yet identified.
EVA AIRWAYS CORP.
Notes to Financial Statements
70
An impairment loss in respect of a financial asset measured at amortized cost is calculated as
the difference between its carrying amount and the present value of the estimated future cash
flows discounted at the asset’s original effective interest rate. Losses are recognized in profit or loss and reflected in an allowance account against the financial assets.
When a decrease in the amount of impairment loss is clearly attributable to an event which occurred after the impairment loss was recognized, the decrease in impairment loss is reversed
to the extent of the decrease through profit or loss.
(h) Hedge accounting
Derivative financial instruments held by the Company were to manage the fluctuation risk of
foreign exchange rate, interest rate and fuel prices exposure on operating, investing, financing activities of the company. According to this policy, derivative financial instruments held or issued
by the Company were for hedging. When derivative financial instruments are no longer for hedging,
they are treated as financial instruments held for trading.
Hedge accounting recognizes the offsetting effects on profit or loss of changes in the fair values of
the hedging instrument and the hedged item. If hedging relationships meet the criteria for hedge accounting, they are accounted for as follows:
1. Fair value hedges
Changes in the fair value of a hedging instrument designated as a fair value hedge are
recognized in profit or loss. The hedged item also is stated at fair value in respect of the risk
being hedged, with any gain or loss being recognized in profit or loss.
2. Cash flow hedges
Changes in the fair value of the hedging instrument designated as a cash flow hedge are recognized directly in equity. If a hedge of a forecasted transaction subsequently results in the
recognition of an asset or a liability, the amount recognized in equity is reclassified into profit
or loss in the same period or periods during which the asset acquired or liability assumed affects profit or loss. For hedges other than those covered by the preceding statement, the associated
cumulative gain or loss that had been recognized in equity shall be reclassified to profit or loss
in the same period or periods during which the hedged forecast transaction affects profit or loss.
3. Hedge of net investment in foreign operation
Changes in the fair value of the hedging instrument are recognized directly in equity. The gain or loss on the hedging instrument relating to the effective portion of the hedge that has been
recognized directly in equity is recognized in profit or loss on disposal of the foreign operation.

EVA AIRWAYS CORP.
Notes to Financial Statements
71
(i) Inventories
Inventories represent parts and supplies for maintenance of aircraft, and merchandise to sell during flights. Except for merchandise, which is stated at the lower of cost or market value, parts and
supplies are stated at cost less allowance for slow-moving and obsolete items. Cost is calculated
by the weighted-average method, and market value represents net realizable value.
(j) Long-term equity investments
Long-term equity investments in which the Company owns more than 20% of the investee’s voting
shares or less than 20% but is able to exercise significant influence over the investee’s operating and
financial policies are accounted for by the equity method. In accordance with SFAS No.23
“Interim Financial Reporting”, the Company recognizes investment gains/ losses under the equity method quarterly.
The difference between the selling price and the book value of the long-term equity investments under the equity method is recognized as disposal gain or loss in the accompanying non-
consolidated statements of operations. If there is capital surplus or cumulative translation
adjustments resulting from long-term equity investments, the capital surplus or cumulative translation adjustments should be debited/credited to disposal gain/loss based on the disposal ratio.
If the differences between investment cost and shareholding equity come from assets that can be
depreciated, depleted or amortized, the Company shall amortize such differences over estimated remaining economic lives. If the differences come from discrepancies between the carrying
amounts of assets and their fair market values, the Company shall offset all unamortized differences
when conditions making such over- or under-valuation are no longer present. When the investment cost exceeds the fair value of identifiable net assets acquired, the excess should be
recorded as goodwill. When the fair value of identifiable net assets acquired exceeds the cost, the
difference should be assigned to non-current assets acquired proportionate to their respective fair
values. If these assets are all reduced to zero value, the remaining difference should be recognized as extraordinary gain.
If an investee company issues new shares and original shareholders do not purchase or acquire new shares proportionately, the investment percentage, and therefore the equity in net assets, will be
changed. Such difference shall be used to adjust the additional paid-in capital and the long-term
investments accounts. If the adjustment stated above is to debit the additional paid-in capital account, and the book balance of additional paid-in capital from long-term investments is not
enough to be offset, the difference shall be debited to the retained earnings account.
Unrealized gains or losses resulting from inter-company transactions between the Company and its investees accounted for by the equity method are deferred. Unrealized gains or losses derived from
transactions involving depreciable or amortizable assets are amortized over the useful lives of the
related assets. Gains or losses from other transactions are recognized when realized.
If the stockholders’ equity of an investee company becomes negative, and the Company guaranteed
the investee company’s liability or made financial commitments to the investee company, or the deficit appears to be short term, the Company continues to record investment losses thereon; if the

EVA AIRWAYS CORP.
Notes to Financial Statements
72
book value of long-term investment is insufficient to offset against investment losses, the Company
offsets it against accounts receivable and recognizes liabilities.
When the Company has significant influence, according to SFAS No. 7 “Consolidated Financial
Statements”, consolidated financial statements should be provided at the end of the first quarter,
half-year, third quarter and fiscal year.
(k) Property, plant, and equipment, and related depreciation
Property, plant, and equipment are stated at acquisition cost. For construction of buildings and
purchase of machinery and equipment, the Company capitalizes as part of the costs of related assets
the related interest costs incurred before commencing to use such assets. Routine repair and
maintenance are charged to current operations. Major repairs and maintenance, additions, enhancements and replacements, and the costs of dismantling and removing the items and restoring
the site on which they are located, are capitalized in the cost of related assets.
The Company accrues for the removal and recovery costs for fixed assets during the non-production
period in accordance with Interpretation (97) 340 issued by the Accounting Research and
Development Foundation (ARDF). When parts of an item of property, plant and equipment have different useful lives, they are accounted for as separate items (major components) of property, plant
and equipment. The Company evaluates the useful lives and depreciation method at the end of
every year. Any changes in the useful lives and depreciation method are accounted for as changes
in accounting estimates.
Depreciation of plant and equipment is provided over the estimated useful lives of the respective
assets using the straight-line method. Leasehold improvements are depreciated over the shorter of the lease term or estimated useful lives using the straight-line method. The useful lives of main
property, plant and equipment are as follows:
Buildings: 5~55 years
Machinery and equipment: 3~18 years
Aircraft: 7~18 years
Gains (losses) on disposal of such asset are presented as non-operating income and gains (expenses and losses).

EVA AIRWAYS CORP.
Notes to Financial Statements
73
(l) Lease
The leased property is valued at the smaller of the following two values: (a) the present value of all future rental payments (less the lessor’s executor costs) plus the bargain purchase price or the
lessee’s guaranteed residual value and (b) the market value of leased property at the inception date
of the lease.
All leased properties under capital leases are depreciated. If the lease contract contains a bargain
purchase option or allows the transfer of ownership at the end of the term, the properties under this type of lease are depreciated based on the leased property’s useful economic life, otherwise the lease
term is used.
The lessee’s periodic rental payment covers two parts: (i) the purchase price of the leased property and (ii) the interest expense due to long-term or installment financing. Therefore, the lessee
recognizes both a lease liability and interest expense in each period. The interest expense is
determined using the following rules:
a) If the value of the leased property is determined using the maximum borrowing rate for
nonfinancial institutions (determined by the ROC Ministry of Finance) on the inception date of the lease, the interest expense is calculated based on the beginning balance of the lease payable
and the maximum borrowing rate.
b) If the value of the leased property is determined by its market price, the interest expense is also calculated based on the beginning balance of the lease payable and the maximum borrowing
rate. However, a service charge is calculated based on the beginning balance of the lease
payable and the difference between the lessor’s interest rate implicit in the lease and the maximum borrowing rate.
If there is any unguaranteed residual value at the end of the lease term, the lessee calculates the
imputed interest expense based on the rental payments, the guaranteed residual value, and the leased property’s market value using the rules described in the two paragraphs above.
The lessee’s lease payable is determined by subtracting the interest expense and the service charge from the periodic rental payment.
The lease liability is classified as either a current liability or long-term liability, depending on the expiration date.
The Company sold and leased back aircraft under operating lease agreements. If the translation
differences resulting from the translation of the foreign currency cost of the aircraft and the related US dollar loans into New Taiwan dollars at the exchange rate prevailing on the selling date and
historical rates and the gains or losses from disposal of the aircraft resulting from the translation of
the US dollar selling price and US dollar book value of aircraft at the exchange rate prevailing on
the selling date were net gains, these gains should be deferred using the unearned gain on sales-
leaseback account according to SFAS No. 2 “Leases”, otherwise they should be taken as a loss.

EVA AIRWAYS CORP.
Notes to Financial Statements
74
The amortization of unearned gain on sales-leaseback depends on the nature of the lease. For
operating leases, the unearned gain is amortized to rental expense using the lease term. For capital leases, however, the unearned gain is amortized to depreciation expense using the leased property’s
useful economic life or lease term based on the nature of those transactions.
(m) Deferred charges
Deferred charges are amortized using the straight-line method. In accordance with SFAS No. 37,
an “intangible asset”, shall be measured initially at cost. After initial recognition, an intangible asset shall be measured at its cost less any accumulated amortization and any accumulated
impairment losses.
(n) Employee retirement plan
1. Defined benefit plan
The Company has established an employee noncontributory defined benefit retirement plan (the
“Plan”) covering full-time employees in the ROC. In accordance with the Plan, employees are
eligible for retirement or are required to retire after meeting certain age or service requirements. Payments of retirement benefits are based on an employee’s average monthly salary for the last
six months before the employee’s retirement and the number of points accumulated by the
employee according to his/her years of service. Each employee receives 2 points for each
service year from year 1 to year 15, and 1 point thereafter. A lump-sum retirement benefit is paid through the retirement fund. Under this retirement plan, the Company is responsible for
making the entire pension payment.
Starting from July 1, 2005, the enforcement rules of the newly enacted Labor Pension Act (the
“New Act”) require the following categories of employees to adopt the New Act’s defined
contribution plan:
(i) employees who were covered by the Plan and opted to be subject to the pension mechanism
under the New Act; and
(ii) employees who commenced working after the enforcement date of the New Act.
In accordance with the New Act, the rate of the employer’s monthly contribution to an
individual labor pension fund account per month shall not be lower than 6% of the worker’s
monthly wages.

EVA AIRWAYS CORP.
Notes to Financial Statements
75
The Company adopted SFAS No. 18 “Accounting for Pensions” for its retirement plan. SFAS
No. 18 requires a company to have an actuarial calculation of its pension liability using the
balance sheet date as the measurement date. The excess of accumulated benefit obligation over the fair value of pension plan assets is deemed as the minimum pension liability and is
recognized as accrued pension liability. The Company provides contributions to the
retirement fund monthly equal to 11.9% of the paid salaries and wages. The funds are deposited with Bank of Taiwan.
2. Defined Contribution plan
For the portion of the retirement plan adopting the defined contribution scheme, in accordance
with the New Act, the Company provides monthly contributions to the Bureau of Labor
Insurance equal to 6% of the worker’s monthly wages. The amount of contribution is recognized as expense of the current period.
(o) Revenue recognition
Ticket sales for passengers and cargo are recorded as unearned revenue, included in current
liabilities, and recognized as revenue when the services are provided.
(p) Employee bonuses and directors’ and supervisors’ remuneration
Employee’s bonuses and directors’ and supervisors’ remuneration appropriated after January 1, 2008, are accounted for by Interpretation (96) 052 issued by the Accounting Research and
Development Foundation. The Company estimates the amount of employee’s bonuses and
directors’ and supervisors’ remuneration according to the Interpretation and recognizes it as expenses. Differences between the amount approved in the shareholders’ meeting and recognized in
the financial statements, if any, are accounted for as changes in accounting estimates and recognized
as profit or loss. In addition, the number of shares distributed to employees as employees’ bonuses
is calculated based on the closing price on the day before the shareholders’ resolution date, and the closing price is adjusted retroactively for dividends that had been distributed.
(q) Income tax
The Company adopted SFAS No. 22 “Income Taxes”. Under this method, the amounts of
deferred income tax assets or liabilities are recognized for future tax effects attributable to temporary differences, loss carryforwards, and investment tax credits. The measurement of
deferred income tax assets or liabilities is based on provisions of enacted tax law. A valuation
allowance is provided on deferred income tax assets that may not be realized in the future.
When a change in the tax laws is enacted, the deferred tax liability or asset should be recomputed
accordingly in the period of change. The difference between the new amount and the original
amount, that is, the effect of changes in the deferred tax liability or asset, should be reported as an adjustment to income tax expense (benefit) for income from continuing operations currently.
Deferred income tax assets or liabilities are classified as current or non-current based on the classification of the related assets or liabilities. If no assets or liabilities are related, deferred

EVA AIRWAYS CORP.
Notes to Financial Statements
76
income tax assets or liabilities are classified according to the period of realization.
The tax imputation system was adopted in accordance with the amendment of the ROC Income Tax Law. Under the new system, the Company may retain the earnings after December 31, 1997, by
paying a 10% surtax on such undistributed earnings, and the surtax is accounted for as income tax
expenses in the following year when the shareholders approved a resolution not to distribute the earnings.
The Company adopted SFAS No. 12 “Accounting for Income Tax Credits”, whereby income tax is reduced by investments tax credits in the year when the credit arises.
(r) Earnings per share (EPS)
The earnings per share are computed by dividing the amount of net income attributable to common
stock outstanding for the period by the weighted-average number of common shares outstanding
during the period.
The convertible bonds issued by the Company belong to potential common stock. When
computing diluted EPS, potential common shares are included in the denominator if they are dilutive. Anti-dilutive potential common shares are ignored in calculating diluted EPS.
The calculation of diluted EPS is consistent with the calculation of basic EPS while giving the
effects of all dilutive potential common shares that were outstanding during the reporting period. When calculating diluted EPS, the net income attributable to common stockholders and the
weighted-average number of shares outstanding are adjusted for the effects of all dilutive potential
common shares.
The weighted-average number of common shares outstanding shall be adjusted currently and
retroactively for the increase in common shares outstanding from stock issuance through the
capitalization of retained earnings, additional paid-in capital, or employees’ bonuses. For calculation of diluted EPS, all employees’ bonuses accrued at the end of reporting period are
deemed to be distributable in the form of shares, and bonuses are included in the calculation of the
weighted-average number of shares at market price on the balance sheet date.
(s) Operating segment
An operating segment is a component of an entity that engages in business activities from which it
may earn revenues and incur expenses (including revenues and expenses relating to transactions
with other components of the same entity). The segment’s operating results are reviewed regularly
by the entity’s chief operating decision maker to make decisions pertaining to the allocation of resources to the segment and to assess its performance for which discrete financial information is
available. The Company discloses its operating segment in the consolidated financial statements.
3. Reason for and Effect of Accounting Changes
(a) The Company adopted the third revisions of the SFAS No. 34 “Financial Instruments: Recognition and Measurement” effective January 1, 2011, for the recognition, measurement, and impairment of

EVA AIRWAYS CORP.
Notes to Financial Statements
77
originated loans and receivables. The adoption of this amended accounting principle had no
significant impact on the Company’s financial statements for the year ended December 31, 2011.
(b) The Company likewise adopted the SFAS No. 41 “Operating Segments” effective January 1, 2011.
According to this new accounting standard, an entity shall disclose information to enable users of its
financial statements to evaluate the nature and financial effect of the business activities in which it engages and the economic environment in which it operates. Internal information that is provided
to the operating decision maker is used as the basis for determining and disclosing the operating
segment. This standard replaces the SFAS No. 20 “Segment Reporting”. The adoption of this new accounting standard had no impact on the Company’s profit and loss for the year ended
December 31, 2011.
4. Important Accounts
(a) Cash and cash equivalents
The components as of December 31, 2011 and 2010, were as follows:
2011 2010
Cash on hand $ 96,243 101,216
Cash in bank 13,570,400 14,044,211
$ 13,666,643 14,145,427
(b) Financial instruments (including derivative and non-derivative)
The components as of December 31, 2011 and 2010, were as follows:
2011 2010
Available-for-sale financial assets-current:
Money market funds $ 2,410,548 1,943,977

EVA AIRWAYS CORP.
Notes to Financial Statements
78
For the years ended December 31, 2011 and 2010, gains on disposal of available-for-sale financial
assets-current amounted to $10,201 and $7,597, respectively, which were recorded under other
income.
2011 2010
Available-for-sale financial assets-non-current:
Trade-Van Information Services Co., Ltd. $ 145,816 171,749
Central Reinsurance Corp. 410,866 631,090 U.S. Treasury notes 121,090 188,292
$ 677,772 991,131
For the years ended December 31, 2011 and 2010, losses on disposal of U.S. Treasury notes which
were recorded as available-for-sale financial assets-non-current were $1,382 and $4,221,
respectively, and were recorded as a reduction of other income.
As of December 31, 2011 and 2010, the changes in fair value of available-for-sale financial assets
from subsequent remeasurement were $139,365 and $380,897, respectively, and were recorded as
other stockholders’ equity adjustments.
The Company’s investment in U.S. Treasury notes is for contract performance guaranties. The
pledge for the investment is disclosed in note 6.
Financial assets carried at cost-non-current:
2011 2010
Shareholding Book value Shareholding Book value
Investee
percentage
(%)
percentage
(%)
Taiwan High Speed Rail Corp. 1.20 $ 1,246,549 1.20 1,246,549
Evergreen Steel Corp. (note) 9.35 870,000 9.35 870,000
Abacus International Holding Ltd. 2.11 115,743 2.11 115,743
Technology Partner II Venture Capital Corp. 5.88 3,235 5.88 6,294
Chung Hwa Express Co., Ltd. 10.00 10,000 10.00 10,000
Pan-Pacific Venture Capital Co., Ltd. 2.30 1,699 2.30 2,851
Uni Airways Corp. 8.71 283,122 - -
Total $ 2,530,348 2,251,437
Note: Evergreen Development Corporation changed its name to Evergreen Steel Corporation on July 1, 2011.

EVA AIRWAYS CORP.
Notes to Financial Statements
79
The Company’s investments had no publicly traded prices, and their fair values were difficult to
determine. Therefore, the investments were stated at cost.
Details of increases (decreases) in financial assets carried at cost-non-current of the Company in
2011 and 2010, were as follows:
Units: thousands of shares 2011 2010
Shares Amount Shares Amount
Uni Airways Corp. 27,523 $ 283,122 - -
Technology Partner II Venture Capital Corp. (306) (3,059) - -
Pan-Pacific Venture Capital Co., Ltd. (115) (1,152) (115) (1,151)
$ 278,911 (1,151)
In 2011, the Company sold the stocks of Uni Airways Corp., which the shareholding percentage decreased from 15.67% to 8.71%. And the Company lost a significant influence over Uni Airways
Corp. The long-term equity investment was reclassified as financial assets carried at cost-non-
current.
On May 31, 2011, Technology Partner II Venture Capital Corp. decreased issued stock by 20%, and
the Company withdrew $3,059 in cash in proportion to the Company’s ownership percentage.
On June 10, 2011 and June 11, 2010, Pan-Pacific Venture Capital Co., Ltd. decreased issued stock
by 49.71% and 33%, respectively, and the Company withdrew $1,152 and $1,151, respectively, in
cash in proportion to the Company’s ownership percentage.
(c) Notes and accounts receivable
2011 2010
Notes receivable $ 317,587 230,608
Accounts receivable 5,933,861 7,452,667 6,251,448 7,683,275
Less: allowance for doubtful accounts 11,551 11,551
$ 6,239,897 7,671,724
As of December 31, 2011 and 2010, the Company’s notes and accounts receivable were not pledged.
The carrying amounts of notes and accounts receivable are taken to be their fair value because of
the near maturity dates.

EVA AIRWAYS CORP.
Notes to Financial Statements
80
(d) Inventories
The components as of December 31, 2011 and 2010, were as follows:
2011 2010
Aircraft spare parts $ 7,116,332 7,764,552
Consumables for use and merchandise for sale during
flight 635,856 537,651 Fuel for aircraft 52,372 223,866
$ 7,804,560 8,526,069
For the years ended December 31, 2011 and 2010, the movement of allowance for obsolete
inventories were as follows:
2011 2010
Beginning balance $ 1,238,830 951,909
Addition 1,202,079 1,188,484
Write-off (463,246) (901,563)
Ending balance $ 1,977,663 1,238,830
For the years ended December 31, 2011 and 2010, the Company recognized related losses on
inventories as follows:
2011 2010
Losses on inventory obsolescence $ 1,202,079 1,188,484
The pledge for these inventories is disclosed in note 6.

EVA AIRWAYS CORP.
Notes to Financial Statements
81
(e) Long-term equity investments under equity method
Details as of and for the years ended December 31, 2011 and 2010, were as follows: 2011 2010
Investee
Shareholding
percentage
(%)
Book value
Investment
income
(loss)
Shareholding
percentage
(%)
Book value
Investment
income
(loss)
Evergreen Aviation Technologies
Corp.
80.00 $ 5,287,022 641,518 80.00 4,830,096 433,220
Hsiang-Li Investment Corp. 100.00 32,523 2,074 100.00 50,453 3,177
Concord Pacific Ltd. 100.00 1,441,768 (123,208) 100.00 43,795 126,155
Sky Castle Investment Ltd. 100.00 329,850 32,268 100.00 275,190 33,515
Evergreen Airways Service (Macau)
Ltd.
99.00 120,259 40,183 99.00 111,363 41,967
Sino Gain Limited 100.00 884 102 100.00 749 117
Evergreen Air Cargo Services Corp. 60.00 1,093,880 100,096 60.00 1,046,689 98,669
Evergreen Sky Catering Corp. 49.80 980,846 169,163 49.80 912,536 138,706
Evergreen Airline Services Corp. 56.33 758,918 156,468 56.33 638,909 81,997
Uni Airways Corp. - - 11,234 15.67 496,642 73,401
Evergreen Security Corp. 31.25 89,111 11,766 31.25 77,345 3,425
PT Perdana Andalan Air Service 51.00 60,805 3,806 51.00 71,511 6,250
RTW Air Services (S) Pte. Ltd. 49.00 25,234 2,272 49.00 27,572 6,251
Green Siam Air Services Co., Ltd. 49.00 20,755 4,786 49.00 24,604 8,344
$ 10,241,855 1,052,528 8,607,454 1,055,194
Details of increases in long-term equity investments under the equity method of the Company in 2011 were as follows:
Investee 2011
Concord Pacific Ltd. $ 1,453,728
There was no such transaction in 2010.
Details of decreases in long-term equity investments under the equity method of the Company in
2011 and 2010 were as follows:
Investee 2011 2010
Uni Airways Corp. $ 507,976 -
Hsiang-Li Investment Corp. - 11,720
$ 507,976 11,720
In 2011, the Company sold 22,000 shares of Uni Airways Corp. amounting to $220,000 and the
book value amounting to $224,854. The difference between the selling price and the book value which was deducted from the capital surplus and other equity adjustment was based on the disposal
ratio. The gains on disposal of investments amounted to $16,906 was recorded under other income.

EVA AIRWAYS CORP.
Notes to Financial Statements
82
The Company’s shareholding percentage of Uni Airways Corp. decreased from 15.67% to 8.71%.
And the Company lost a significant influence over Uni Airways Corp. The long-term equity
investments amounted to $283,122 was reclassified as financial assets carried at cost-non-current.
The Company’s portion of capital surplus was the result of the after-tax amount which was taken
from the disposal gains of property, plant and equipment of Uni Airways Corp. in prior years that
were transferred from retained earnings. When the Company sold the shares, it was transferred to the abovementioned capital surplus back to retained earnings that are in accordance with the
disposal ratio amounted to $637.
On June 30, 2010, Hsiang-Li Investment Corp.’s stockholders resolved to make up deficiencies
from the decrease issued stock and cash subscription. Hsiang-Li Investment Corp. decreased
issued stock by 94.57% on July 5, 2010, and the Company withdrew $11,720 in cash in proportion to the Company’s ownership percentage.
As of December 31, 2011 and 2010, the cumulative translation adjustment were $104,750 and
$4,508, respectively.
(f) Property, plant and equipment
For the years ended December 31, 2011 and 2010, the Company capitalized the interest expenses on
purchase of assets amounting to $27,885 and $214,189, respectively. The monthly interest rates on
the above transactions were 0.12%~0.13% and 0.13%~0.14%, respectively. The pledge for this
property, plant and equipment is disclosed in note 6.
(g) Leased assets
The details were as follows:
Present value of leased assets at
the transaction date
Lease item
Leaser
Lease
term
Terms of lease contract
2011
2010
Aircraft GECAS 2004.4.13~
2017.6.21
The rent is payable monthly, and the lease term is
equal to 75% or more of the total estimated
economic life of the leased property
$ 5,734,772 5,516,972
Aircraft C&L Leasing
Co., Ltd.
2007.5.31~
2019.12.27
The rent is payable quarterly, and the present value of
payment for future rental is higher than 90% of the
fair value of the leased asset
9,531,041 9,169,062
Computer
equipment
IBM 2009.5.25~
2014.6.24
The rent is payable monthly, and the lease transfers
ownership of the leased property by the end of the
lease term 50,555 50,555
Computer
equipment
IBM 2010.12.25
~2014.6.24
The rent is payable monthly, and the lease transfers
ownership of the leased property by the end of the
lease term 39,123 -
Leasehold improvements 2,047,612 1,950,981
Subtotal 17,403,103 16,687,570
Less: accumulated depreciation (5,133,452) (3,495,270)
$ 12,269,651 13,192,300
The discount rate for leased assets was 1.18%~6.93%.

EVA AIRWAYS CORP.
Notes to Financial Statements
83
The abovementioned aircraft were financed under sale and leaseback arrangements. The
differences (treated as unrealized gain on sale and leaseback) between sales price and book value of
equipment are recorded as a reduction of depreciation expenses over the lease term.
As of December 31, 2011 and 2010, the book value and present value of lease liability were as
follows:
Year due 2011 2010
January 1, 2011~December 31, 2011 $ - 1,976,611
January 1, 2012~December 31, 2012 1,998,821 1,953,912
January 1, 2013~December 31, 2013 1,975,133 1,930,224
January 1, 2014~December 31, 2014 1,941,246 1,902,231 January 1, 2015~December 31, 2015 1,907,358 1,874,238
January 1, 2016~December 31, 2016 1,702,724 1,676,504
And after 2,740,930 2,735,613 Book value 12,266,212 14,049,333
Less: unrealized interest expenses (1,740,488) (2,255,929)
Present value 10,525,724 11,793,404 Less: current portion (1,522,593) (1,436,940)
$ 9,003,131 10,356,464
The current portion of lease liability was recorded under other current liabilities. (h) Deferred charges
As of December 31, 2011 and 2010, deferred charges, net of amortization, consisted of the
following:
2011 2010
Computer software $ 125,448 68,598

EVA AIRWAYS CORP.
Notes to Financial Statements
84
(i) Long-term borrowings
As of December 31, 2011 and 2010, the details of long-term borrowings were as follows:
2011 2010
Nature Interest rate Interest rate
(%) Amount (%) Amount
Secured loans:
Land and buildings 1.02~1.46 $ 2,150,000 0.89~1.35 2,514,286 Aircraft 1.07~1.59 31,978,553 0.94~1.50 38,463,071
Engines 1.35~1.56 825,000 1.31~2.30 1,997,000
Subtotal 34,953,553 42,974,357 Unsecured loans: 1.20~1.56 4,183,000 1.19~2.26 3,019,800
Total 39,136,553 45,994,157
Less: current portion (6,146,068) (7,756,574)
$ 32,990,485 38,237,583
As of December 31, 2011, the remaining balances of the borrowings were due as follows:
Year due Amount
January 1, 2012~December 31, 2012 $ 6,146,068
January 1, 2013~December 31, 2013 6,488,068
January 1, 2014~December 31, 2014 5,195,090 January 1, 2015~December 31, 2015 5,352,640
January 1, 2016~December 31, 2016 4,054,163
And after 11,900,524
$ 39,136,553
As of December 31, 2011 and 2010, the unused credit lines for long-term borrowings amounted to
$1,694,000 and $0, respectively. The pledge for these long-term borrowings is disclosed in note 6.

EVA AIRWAYS CORP.
Notes to Financial Statements
85
(j) Bonds payable
Details of bonds payable as of December 31, 2011 and 2010, were as follows:
Description 2011 2010
Guaranteed by
Annual
interest rate
Issue
date Amount Amount
Bonds payable Cathay United Bank 2.08% 2006.01 $ - 2,000,000
Bonds payable Hua Nan Bank 2.29% 2006.07 - 500,000
Taipei Fubon Bank 2.29% 2006.07 - 500,000
Bank of Taiwan 2.29% 2006.07 - 500,000
Taiwan Cooperative Bank 2.29% 2006.07 - 500,000
Bonds payable The Shanghai Commercial & Savings Bank 1.21% 2011.01 1,000,000 -
Chinatrust Commercial Bank 1.21% 2011.01 600,000 -
Land Bank 1.21% 2011.01 500,000 -
Mega International Commercial Bank 1.21% 2011.01 500,000 -
Hua Nan Bank 1.21% 2011.01 500,000 -
Bonds payable The Shanghai Commercial & Savings Bank 1.44% 2011.08 600,000 -
First Bank 1.44% 2011.08 1,500,000 -
Chang Hwa Bank 1.44% 2011.08 1,000,000 -
Hua Nan Bank 1.44% 2011.08 1,000,000 -
Bank of Taiwan 1.44% 2011.08 2,000,000 -
Taiwan Cooperative Bank 1.44% 2011.08 1,000,000 -
Ordinary corporate bonds payable issued in private placement 2.00% 2009.10 - 5,000,000
Subtotal 10,200,000 9,000,000
Less: current portion - (4,000,000)
$ 10,200,000 5,000,000
(k) Installment accounts payable
The Company purchased aircraft, engines and inventories by installments. As of December 31,
2011 and 2010, the details were as follows:
2011 2010
Aircraft payable $ 15,575,755 17,996,868 Others 220,000 932,333
15,795,755 18,929,201
Less: current portion (3,037,074) (3,468,571)
$ 12,758,681 15,460,630

EVA AIRWAYS CORP.
Notes to Financial Statements
86
The current portion of installment accounts payable was recorded as other payables. As of
December 31, 2011, the remaining balances of installment accounts payable were due as follows:
Year due Amount
January 1, 2012~December 31, 2012 $ 3,037,074 January 1, 2013~December 31, 2013 2,647,786
January 1, 2014~December 31, 2014 1,624,563
January 1, 2015~December 31, 2015 1,400,272 January 1, 2016~December 31, 2016 1,424,157
And after 5,661,903
$ 15,795,755
The interest expenses of the aforementioned installment accounts payable are calculated based on floating interest rates. For the years ended December 31, 2011 and 2010, the average interest rates
were 0.25%~4.59% and 0.25%~6.77%, respectively. The pledges for the installment accounts
payable are disclosed in note 6.
(l) Retirement plans
Net retirement plan liabilities based on the actuarial computation on December 31, 2011 and 2010, were as follows:
2011 2010
Benefit obligation:
Vested benefit obligation $ 444,091 302,470 Nonvested benefit obligation 3,673,755 2,572,508
Accumulated benefit obligation 4,117,846 2,874,978
Projected effects of salary adjustments 1,093,231 1,062,009
Projected benefit obligation 5,211,077 3,936,987 Plan assets at fair value (2,760,749) (2,476,756)
Projected benefit obligation in excess of plan assets 2,450,328 1,460,231
Unrecognized net transition obligation - (27,300) Unrecognized pension loss (2,485,716) (1,565,704)
Unrecognized prior service cost (301,345) (122,333)
Pension liabilities that need to be accrued 1,693,830 653,328 Accrued employee retirement liabilities $ 1,357,097 398,222

EVA AIRWAYS CORP.
Notes to Financial Statements
87
Actuarial assumptions at December 31, 2011 and 2010, were as follows:
2011 2010
Discount rate 2.00% 1.75%
Rate of increase in future compensation levels 1.55%~2.53% 1.50%~3.00%
Expected long-term rate of return on plan assets 2.00% 1.75%
As of and for the years ended December 31, 2011 and 2010, the details of the retirement plans were
as follows:
2011 2010
Balance of the retirement fund: Bank of Taiwan $ 2,760,749 2,476,756
The components of pension cost under defined benefit pension plan were as follows:
2011 2010
Service cost $ 112,563 115,250
Interest cost 68,801 63,691 Actual return on plan assets (30,465) (36,616)
Unrecognized net transition obligation 176,980 78,741
Net pension cost $ 327,879 221,066
The pension cost under defined contribution plan $ 162,723 135,468
(m) Income tax
(1) For the years ended December 31, 2011 and 2010, the components of estimated income tax
expenses were as follows:
2011 2010
Income tax expenses-current $ (28,339) (28,531)
Income tax benefits-deferred - -
$ (28,339) (28,531)

EVA AIRWAYS CORP.
Notes to Financial Statements
88
The deferred income tax benefits were as follows:
2011 2010 Loss carryforwards $ 653,593 (1,960,521)
Investment tax credits (1,257,536) 177,853 Unrealized exchange losses (gains) (21,057) 4,084
Allowance for obsolete inventories (293,000) 166,155
Purchase of fixed assets in installments, adjusted for tax purposes (46,394) (31,241)
Accrued employee retirement liabilities (13,877) (27,642)
Effect of change in income tax rate on valuation
allowance for deferred income tax assets - (914,212)
Others 37,968 56,751 Valuation allowance for deferred income tax assets 940,303 2,528,773
$ - -
(2) For the year ended December 31, 2011 and 2010, the Company was subject to ROC income tax at a maximum rate of 17% and calculated the amounts of the basic tax in accordance with the
“Income Basic Tax Act.” The differences between expected income tax expense at statutory
rates and income tax expense as reported in the accompanying financial statements for the year
ended December 31, 2011 and 2010, were as follows:
2011 2010 Income tax expenses calculated on pre-tax financial
income at statutory income tax rate of 17%
$ (40,352) (2,047,695)
Gain on disposal of investments 1,734 1,291 Investment income recognized under equity method
-unrealized 185,694 179,383
Dividend income 34,682 5,586 Investment tax credits (1,253,630) 210,580
Permanent difference in depreciation expenses 103,177 21,154
Exchange losses recorded as translation adjustments (46,828) (19,330)
Effect of change in statutory income tax rate - (914,212) Others 46,881 5,939
Valuation allowance for deferred income tax assets 940,303 2,528,773
$ (28,339) (28,531)

EVA AIRWAYS CORP.
Notes to Financial Statements
89
(3) The components of the deferred income tax assets (liabilities) as of December 31, 2011 and
2010, were as follows:
2011 2010
Amount Tax effect Amount Tax effect
Deferred income tax assets-current
Allowance for obsolete inventories $ 1,881,889 319,921 3,605,418 612,921
Investment tax credits 676,387 676,387 1,253,630 1,253,630
Loss carryforwards 5,978,420 1,016,331 3,367,000 572,390
Unrealized exchange losses (gains) (59,598) (10,132) 64,265 10,925
Others 3,041 517 3,041 517
2,003,024 2,450,383
Less: Valuation allowance for deferred income tax assets (697,416) (1,239,736)
Deferred income tax assets, net-current $ 1,305,608 1,210,647
Deferred income tax assets (liabilities)-non-
current:
Investment tax credits 1,092,965 1,092,965 1,773,258 1,773,258
Accrued employee retirement liabilities (336,733) (57,245) (255,106) (43,368)
Purchase of fixed assets in installments, adjusted for tax purposes 2,605,999 443,020 2,878,906 489,414
Loss carryforwards 9,610,376 1,633,764 8,377,127 1,424,112
Cumulative translation adjustments 3,233,867 549,757 4,282,759 728,069
Others 3,569,294 606,779 2,505,341 425,908
4,269,040 4,797,393
Less: Valuation allowance for deferred income tax assets (1,066,414) (1,464,397)
Deferred income tax assets, net-non-current $ 3,202,626 3,332,996
(4) The Company was granted investment tax credits for investment in certain high-tech industries, for purchases of automatic machinery and equipment, and for expenditures in employee training.
These investment tax credits can be used to reduce the income tax liability in the current year
and in the following four years at an amount not exceeding 50% of the income tax liability for
each year during the first four years, with full utilization of the balance of the remaining unused investment tax credits in the final year.
As of December 31, 2011, unused investment tax credits available to the Company were as follows:
Year granted Unused investment
tax credits
Expiry year
2008 $ 676,387 2012
2009 1,092,965 2013
$ 1,769,352

EVA AIRWAYS CORP.
Notes to Financial Statements
90
(5) The Company’s income tax returns have been examined by the local tax authorities through
2009. According to the Income Tax Act, the loss carryforward tax credit can be applied to
offset income tax in the following ten years. As of December 31, 2011, unused loss carryforward tax credits available to the Company were as follows:
Year Unused loss
carryforward
Expiry year
2008 $ 5,978,420 2018
2009 8,374,277 2019
2011 1,236,099 2021
$ 15,588,796
(6) Imputation credit account (ICA) and creditable ratio:
2011 2010
Unappropriated earnings before 1997 $ - - Unappropriated earnings after 1998 1,441,689 12,016,736
$ 1,441,689 12,016,736
ICA $ 214,344 1,035,572
2011 2010
Creditable ratio for earnings distribution to domestic
shareholders
14.87% (estimated)
9.95% (actual)
(n) Stockholders’ equity
(1) Common stock and stock dividends to be distributed
As of December 31, 2011 and 2010, the Company’s authorized share capital consisted of
4,000,000 thousand shares of common stock, at $10 par value per share, of which 3,258,945 and
2,962,677 thousand shares, respectively, were issued and outstanding.
On June 10, 2011, the Company’s stockholders resolved to distribute stock dividends out of
unappropriated earnings in the amount of $2,962,678 by issuing 296,268 thousand shares. The
aforementioned distribution was approved by and registered with the government authorities.

EVA AIRWAYS CORP.
Notes to Financial Statements
91
(2) Capital surplus, legal reserve, and restrictions on appropriations of earnings
The details of capital surplus as of December 31, 2011 and 2010, were as follows: 2011 2010
Cash subscription in excess of par value of shares $ 29,672 29,672
Share options granted to employees 282,100 282,100
Additional paid-in capital from bond conversion 1,411,829 1,411,829 Gain on disposal of property, plant and equipment of
investee company 1,031 1,668
Increase in net equity due to investee company issuing
new shares and the Company not purchasing
proportionately 27,965 50,318
Increase in net equity due to change in percentage of
ownership in long-term investments under equity
method 225,369 225,369
Donated assets 648,480 648,480
$ 2,626,446 2,649,436
According to ROC Company Act, as amended in January 2012, the capital surplus shall not be
used except for covering the deficit (or loss) of the company. This capital surplus includes the
premium derived from the issuance of new shares and endowments received by the company. In addition, the capital surplus which is credited to capital should not exceed 10% of the amount
of paid-in capital in one year in accordance with the “Criteria Governing the Offering and
Issuance of Securities by Securities Issuers”.
According to ROC Company Act, as amended in January 2012, where a company incurs no loss,
it may pursuant to a resolution approved by the stockholders during the stockholders’ meeting
distribute its legal reserve and its remaining capital reserve by issuing new shares or by cash. Where legal reserve is distributed by issuing new shares or by cash, only portion of legal
reserve which exceeds 25 percent of the paid-in capital stock may be distributed.
The Company’s articles of incorporation stipulate that the Company must appropriate
employees’ bonuses of not less than 1% of estimated earnings of each year, and less than 5% of
estimated earnings of each year for remuneration of directors and supervisors. Such
appropriations can only be made after offsetting accumulated deficit, and appropriation of legal reserve, and appropriation of special reserve from unappropriated earnings at an amount equal
to the net debit balance of those accounts in stockholders’ equity.

EVA AIRWAYS CORP.
Notes to Financial Statements
92
To promote long-term development, the Company has adopted a steady dividend policy, in
which a cash dividend of around 0~50% of the appropriated dividend is distributed and a stock
dividend of around 50%~100% of the appropriated dividend is distributed. However, if the expected earnings per share in the year when stock dividends are distributed decline to 20% or
working capital is low, a cash dividend of 50%~100% of the appropriated dividend is
distributed and a stock dividend of 0~50% of the appropriated dividend is distributed.
The Company’s stockholders resolved to appropriate earnings of 2010 on June 10, 2011. The
appropriations and dividends per share were as follows: 2010
Stock dividends $ 1.00
Cash dividends 1.00
Bonuses to employees 100,000
Remuneration to directors and supervisors 53,000
On June 14, 2010, the Company’s stockholders resolved to make up deficiencies from capital
surplus of $2,915,074 and not to appropriate dividends to stockholders, bonuses to employees,
and remuneration to directors and supervisors for year 2009.
The amounts of the abovementioned appropriations of earnings were consistent with the
resolutions of the meetings of the board of directors. The related information can be found on
websites such as the Market Observation Post System.
For the year ended December 31, 2011, the Company did not recognize any bonuses to
employees and remuneration to directors and supervisors. Differences between the amount approved in the shareholders’ meeting and recognized in the financial statements, if any, are
recognized as profit or loss.
For the year ended December 31, 2010, the Company recognize the amount of employee bonus
and directors’ and supervisors’ remuneration, $100,000 and $53,000, respectively. Differences
between the amount approved in the shareholders’ meeting and recognized in the financial
statements, if any, are recognized as profit or loss.
(3) Cumulative translation adjustments
According to the accounting treatment of note 2(c), the cumulative translation adjustments had a
debit balance of $2,684,110 and a $3,559,198 as of December 31, 2011 and 2010, respectively.

EVA AIRWAYS CORP.
Notes to Financial Statements
93
(o) Earnings per share
For the years ended December 31, 2011 and 2010, earnings per share were calculated as follows: 2011 2010
Basic earnings per share:
Before Income
Tax
After Income
Tax
Before Income
Tax
After Income
Tax
Net income $ 237,367 209,028 12,045,267 12,016,736
Weighted-average number of shares outstanding during the year
(thousand shares) 3,258,945 3,258,945 3,258,945 3,258,945
Basic EPS (dollars) $ 0.07 0.06 3.70 3.69
Diluted earnings per share:
Net income for calculating diluted EPS $ 237,367 209,028 12,045,267 12,016,736
Weighted-average number of shares outstanding during the year
(thousand shares)
3,258,945
3,258,945
3,258,945
3,258,945
Employees’ bonus that may be settled in shares (thousand shares) 1,485 1,485 2,717 2,717
Weighted-average number of shares outstanding for calculating
diluted EPS (thousand shares)
3,260,430 3,260,430 3,261,662 3,261,662
Diluted EPS (dollars) $ 0.07 0.06 3.69 3.68
(p) Hedge accounting
The Company needs fuel for operating, and the future cash flows for fuel fluctuate due to the
floating market prices, and therefore cash flow risk occurs. The Company evaluates the risk as
significant, and thus hedges the risk by signing swap agreements.
As of December 31, 2011 and 2010, the cash flow hedging items and derivative financial hedging
instruments were as follows:
Hedging
Fair value of assigned
hedging instrument
Period of
generating
Hedged item instrument 2011 2010 cash flow Account
Floating price of
fuel Fuel swap
agreements $ 69,953 - 2011~2012 Derivative financial assets for
hedge purposes-current
As of December 31, 2011 and 2010, the unrealized valuation gain on financial instruments due to
hedging of cash flow amounted to $69,953 and $0, respectively, recorded under stockholders’
equity.

EVA AIRWAYS CORP.
Notes to Financial Statements
94
(q) Disclosure of financial instruments
(1) Fair value of financial instruments
The details of financial instruments as of December 31, 2011 and 2010, were as follows:
2011 2010
Fair value Fair value
Book value
Public quote
value
Assessment
value Book value
Public quote
value
Assessment
value
Financial assets:
Cash and cash equivalents $ 13,666,643 - 13,666,643 14,145,427 - 14,145,427
Notes and accounts receivable (including
receivables from related parties) 6,418,453 - 6,418,453 7,862,263 - 7,862,263
Other receivables (including receivables
from related parties) 575,134 - 575,134 150,458 - 150,458
Available-for-sale financial assets-
current 2,410,548 2,410,548 - 1,943,977 1,943,977 -
Available-for-sale financial assets-non-
current-stock 556,682 556,682 - 802,839 802,839 -
Available-for-sale financial assets-non-
current-Treasury notes 121,090 121,090 - 188,292 188,292 -
Financial assets carried at cost-non-
current 2,530,348 - - 2,251,437 - -
Fuel swap agreements 69,953 - 69,953 - - -
Other assets 72,363 - 72,363 718,076 - 718,076
Financial liabilities:
Accounts payable (including payables to
related parties) 4,624,192 - 4,624,192 4,063,161 - 4,063,161
Accrued expenses 8,181,776 - 8,181,776 7,234,011 - 7,234,011
Other payable (including payables to
related parties) 202,718 - 202,718 204,893 - 204,893
Bonds payable (including current portion) 10,200,000 10,217,328 - 9,000,000 2,015,043 7,032,803
Long-term borrowings (including current
portion) 39,136,553 - 39,136,553 45,994,157 - 45,994,157
Installment accounts payable (including
current portion) 15,795,755 - 16,138,957 18,929,201 - 19,202,199
Lease liability (including current portion) 10,525,724 - 10,820,579 11,793,404 - 12,223,564
Off-balance-sheet financial instruments:
Letters of credit - - 1,704,293 - - 1,685,720
Guaranteed borrowings - - 984,100 - - 1,420,088
(2) Methods and assumptions to measure the fair value of financial instruments
i) The maturity dates of short-term financial instruments, including cash and cash equivalents,
notes and accounts receivable/payable (including related parties), other receivables
(including related parties), other assets, accrued expenses, and other payables (including related parties), are within one year of the balance sheet date, and therefore, their book
value is equal to their fair value.
ii) If public quoting of financial assets and liabilities is available, the quote price will be the fair value. If market value is not available, an assessment method will be used. The
assumptions used should be the same as those used by the financial market traders when
quoting their prices.

EVA AIRWAYS CORP.
Notes to Financial Statements
95
iii) The assessed value of bonds payable, long-term borrowings, installment accounts payable
and lease liability is the discounted future cash flows, and the discount rates during the
years ended December 31, 2011 and 2010, were both 0.25%~6.93% p.a.
iv) The fair value of letters of credit is based on the amount of the contract.
v) The fair value of guaranteed borrowings is based on the amount of the contract.
(3) For the years ended December 31, 2011 and 2010, the evaluation gain or loss on financial assets at fair value through profit or loss amounted to losses of $1,267 and gains of $5,151,
respectively.
(4) Disclosure of financial risks
(i) Market risk
As of December 31, 2011 and 2010, the bonds payable, installment accounts payable, and
lease liability with the risk arising from floating interest rates amounted to $16,764,790
and $16,622,697, respectively.
The Company’s securities were recorded as available-for-sale financial assets and
measured at fair value. The Company had the risk of changes in market price.
The Company is exposed to foreign currency risk on accounts receivable which are
denominated in a currency other than New Taiwan dollars. The above foreign currency
risk will be offset by the same risk related to those accounts payable which are denominated in a foreign currency. Therefore, the Company believes its exposure to
foreign currency risk is low.
(ii) Credit risk
The Company has major credit risk involving cash and cash equivalents, securities, and
accounts receivable. The Company deposited the cash in different financial institutions. The Company owns securities by purchasing publicly traded bonds and stocks.
Derivative counterparties are limited to high-credit-quality financial institutions. The
Company is exposed to credit risk in every financial institution. However, the credit risk involving cash, derivatives and securities is not significant.
The Company guarantees bank loans of an investee which is 100% owned by the
Company, and therefore the Company concluded that it was not exposed to credit risk for this transaction.

EVA AIRWAYS CORP.
Notes to Financial Statements
96
Accounts receivable were due from many customers. Therefore, there was no
concentration of credit risk. In order to decrease the credit risk of accounts receivable,
the Company continually evaluated each client’s financial situation and requested clients to provide guaranties.
(iii) Liquidity risk
The Company’s capital, operating funds and financing are sufficient to fulfill all
obligations. Therefore, the Company did not have liquidity risk.
The Company’s derivative financial instruments are expected to sell at the rational price.
Therefore, liquidity risk is not significant.
The Company’s available-for-sale financial assets had publicly traded prices and were
expected to be sold promptly at close to their fair values. Therefore, liquidity risk is not
significant.
Liquidity risk resulted from financial assets carried at cost that had no publicly traded
price.
(iv) Cash flow risk related to the fluctuation of interest rates
The Company’s long-term borrowings, installment accounts payable, and lease liability carried floating interest rates. As a result, the effective interest rate changes along with
the fluctuation of the market interest rate and thereby influences the Company’s future
cash flow.
As of December 31, 2011 and 2010, the financial liabilities with the risk arising from
floating interest rates amounted to $58,893,242 and $69,094,065, respectively.
5. Transactions with Related Parties
(a) Name and relationship of related parties
Name Relationship with the Company
Evergreen Marine Corp. Major shareholder
Evergreen International Corp. Major shareholder
Evergreen International Storage & Transport Corp. Major shareholder
Evergreen Airline Services Corp. Subsidiary
Evergreen Sky Catering Corp. Subsidiary
Evergreen Aviation Technologies Corp. Subsidiary
Evergreen Air Cargo Services Corp. Subsidiary
Hsiang-Li Investment Corp. Subsidiary
RTW Air Services (S) Pte. Ltd. Subsidiary
Green Siam Air Services Co., Ltd. Subsidiary

EVA AIRWAYS CORP.
Notes to Financial Statements
97
Name Relationship with the Company
Evergreen Airways Service (Macau) Ltd. Subsidiary
PT Perdana Andalan Air service Subsidiary
Sky Castle Investment Ltd. Subsidiary
Concord Pacific Ltd. Subsidiary
Sino Gain Limited Subsidiary
Evergreen Security Corp. Investee company accounted for by equity method
Uni Airways Corp. Investee company of the Company’s major shareholders
Evergreen Reinsurance Company Limited Investee company of the Company’s major shareholders
Shanghai Airlines Cargo International Co., Ltd. (note) Investee company of the Company’s subsidiary
Directors, Supervisors, and Managers The Company’s directors, supervisors and major
management
Note: Shanghai Airlines Cargo International Co., Ltd. ceased its operation on May 31, 2011. China
Cargo Airlines Co., Ltd. acquired its net assets, and took over its rights and obligations.
(b) Significant transactions with related parties
(1) Revenue, cost and expenses
During the years ended December 31, 2011 and 2010, the Company’s transactions with related
parties were as follows:
Revenue 2011 2010
Amount Percentage Amount Percentage
Uni Airways Corp. $ 623,536 0.61 515,504 0.49
Evergreen Aviation Technologies Corp. 189,777 0.19 365,217 0.35
Evergreen International Corp. 46,498 0.05 41,835 0.04
Shanghai Airlines Cargo International Co., Ltd 8,342 0.01 60,530 0.06
Evergreen Air Cargo Services Corp. 1,594 - 15,912 0.02
Others 5,680 - 3,648 -
$ 875,427 0.86 1,002,646 0.96

EVA AIRWAYS CORP.
Notes to Financial Statements
98
Uni Airways Corp. leased aircraft from the Company to operate cross-strait flights between
mainland China and Taiwan. The rental is charged by actual flight hours and recorded under
operating revenue.
Cost 2011 2010
Amount Percentage Amount Percentage
Evergreen Aviation Technologies Corp. $ 4,877,284 5.17 4,783,273 5.64
Evergreen Sky Catering Corp. 1,267,563 1.34 1,140,946 1.35
Evergreen Airline Services Corp. 1,095,189 1.16 951,580 1.12
Uni Airways Corp. 639,473 0.68 671,454 0.79
Evergreen Air Cargo Services Corp. 322,310 0.34 285,774 0.34
Evergreen Reinsurance Company Limited 183,053 0.19 207,922 0.24
Evergreen International Storage & Transport
Corp. 69,986 0.07 68,445 0.08
Evergreen International Corp. 65,016 0.07 48,533 0.06
Shanghai Airlines Cargo International Co., Ltd 55,935 0.06 220,018 0.26
Others 605 - 767 -
$ 8,576,414 9.08 8,378,712 9.88
Expenses 2011 2010
Amount Percentage Amount Percentage
Evergreen International Corp. $ 183,446 2.50 136,957 1.96
Green Siam Air Services Co., Ltd. 57,458 0.78 72,606 1.04
RTW Air Services (S) Pte. Ltd. 44,545 0.61 50,521 0.72
Evergreen Security Corp. 43,148 0.59 41,682 0.60
PT Perdana Andalan Air Service 33,427 0.46 38,944 0.56
Evergreen Sky Catering Corp. 30,702 0.42 22,673 0.33
Evergreen Airline Services Corp. 29,363 0.40 28,150 0.40
Evergreen International Storage & Transport
Corp.
28,596
0.39
23,596
0.34
Uni Airways Corp. 27,365 0.37 86,936 1.25
Evergreen Aviation Technologies Corp. 11,263 0.15 8,045 0.12
Others 2,060 0.03 101,560 1.45
$ 491,373 6.70 611,670 8.77
The Company sold spare parts to Evergreen Aviation Technologies Corp. amounted to $1,332,809 and $621,428 for the years ended December 31, 2011 and 2010, respectively.
Evergreen Aviation Technologies Corp. provides maintenance services for aircraft and engines for the Company. As of December 31, 2011 and 2010, the aforementioned balance amounted
to $2,891,226 and $2,707,252, respectively, recorded under Aircraft and machinery and
equipment.

EVA AIRWAYS CORP.
Notes to Financial Statements
99
(2) Property transaction
The Company sold two aircraft for US$97,067 to Sino Gain Limited on November 27, 2009, and immediately bought them back by installments. There were no gains or losses on disposal
recorded for this sale and buyback transaction. For the years ended December 31, 2011, and
2010 installment payments amounted to $984,100 and $1,420,088, respectively, recorded under installment accounts payable.
(3) Endorsement and guarantees
As of December 31, 2011, and 2010, the details of guarantees to related parities were as follows:
2011 2010 Local
Amount
Amount
Local
Amount
Amount
Sino Gain Limited USD 32,500 984,100 USD 48,750 1,420,088
(4) The abovementioned transactions with related parties were made with no significant difference from those with non-related parties, but sometimes the payments were overdue. Receivables
and payables as of December 31, 2011 and 2010, resulting from the aforementioned transactions
were as follows:
2011 2010
Accounts receivable-related parties:
Uni Airways Corp. $ 140,434 138,108
Evergreen Aviation Technologies Corp. 29,398 27,782
Evergreen International Corp. 7,104 3,308
Others 1,620 21,341 $ 178,556 190,539
Other receivables-related parties: Evergreen Aviation Technologies Corp. $ 467,912 7,655
Uni Airways Corp. 44,109 36,825
Shanghai Airlines Cargo International Co., Ltd 18,920 29,878 Others 1,097 562
$ 532,038 74,920

EVA AIRWAYS CORP.
Notes to Financial Statements
100
Note: As of December 31, 2011 and 2010, the overdue accounts receivable reclassified to other
receivables were $18,920 and $28,755, respectively. The aging for the abovementioned
overdue accounts receivable is shown below:
2011
Aging for overdue accounts receivable
Name Amount
Over 1-6
months
Over 7-12
months
Over one
year
Shanghai Airlines Cargo International Co., Ltd. $ 18,920 5,979 1,612 11,329
2010
Aging for overdue accounts receivable
Name Amount
Over 1-6
months
Over 7-12
months
Over one
year
Shanghai Airlines Cargo International Co., Ltd. $ 28,755 16,112 2,303 10,340
2011 2010
Accounts payable-related parties:
Evergreen Aviation Technologies Corp. $ 2,235,963 1,892,867
Evergreen Sky Catering Corp. 218,566 177,885
Evergreen Airline Services Corp. 171,101 164,878
Uni Airways Corp. 85,156 82,979
Evergreen Air Cargo Services Corp. 56,866 53,385
Green Siam Air Services Co, Ltd. 10,961 12,172
Evergreen International Corp. 9,501 9,757
RTW Air Services (S) Pte Ltd. 9,242 10,729
Shanghai Airlines Cargo International Co., Ltd. 7,267 54,880
Others 18,369 14,411
$ 2,822,992 2,473,943
Other payables-related parties:
Evergreen Airline Services Corp. $ 77,240 78,873
Evergreen International Corp. 51,407 34,371
Uni Airways Corp. 12,570 15,861
Evergreen Aviation Technologies Corp. 9,801 8,056
Evergreen Air Cargo Services Corp. 9,376 8,391
Evergreen International Storage & Transport Corp. 5,285 1,668
Evergreen Security Corp. 4,048 3,766
Others 3,815 2,408
$ 173,542 153,394

EVA AIRWAYS CORP.
Notes to Financial Statements
101
(c) Summary of payroll and remuneration of the Company’s directors, supervisors and major
management.
For the years ended December 31, 2011 and 2010, the related information about payroll and
remuneration of major management, such as directors, supervisors and managers, received from the
Company were as below:
2011 2010
Salaries $ 27,572 76,832
Bonus and extra payment 7,122 8,814
Employee bonus - 183
6. Pledged Assets
The book values of the pledged assets as of December 31, 2011 and 2010, were as follows:
Pledged assets Object 2011 2010 Land Long-term borrowings $ 1,863,910 1,863,910
Buildings Long-term borrowings 2,110,438 2,172,929
Aircraft Long-term borrowings, Installment accounts payable
56,039,827 55,652,842
Simulators-included in machinery and
equipment
Installment accounts payable - 438,801
Engines-included in machinery and equipment
Long-term borrowings 2,270,815 2,733,104
Advances for purchases of equipment Long-term borrowings - 10,924,674
Time deposit-included in other assets Letters of credit, customs duty, and contract performance guaranties
72,363 718,076
Spare parts-included in inventories Installment accounts payable 500,033 1,000,062
US treasury note-included in available-
for-sale financial assets-non-current
Contract performance guaranties 121,090
188,292
$ 62,978,476 75,692,690

EVA AIRWAYS CORP.
Notes to Financial Statements
102
7. Commitments and Contingencies
(a) The Company entered into aircraft, and building lease contracts using the operating lease or capital lease method. As of December 31, 2011, the Company had paid $1,500,249 as refundable deposits.
According to these contracts, future lease payments in the following five years are as follows:
Year due Amount
January 1, 2012~December 31, 2012 $ 7,486,693
January 1, 2013~December 31, 2013 6,887,511
January 1, 2014~December 31, 2014 6,616,108
January 1, 2015~December 31, 2015 6,245,459
January 1, 2016~December 31, 2016 4,841,028
And after 6,859,583
$ 38,936,382
(b) As of December 31, 2011, the details of guarantees to related parties are disclosed in note 5(b).
8. Important Damage Losses: none
9. Important Subsequent Events: none
10. Others
(a) Total personnel expenses, depreciation and amortization for the years ended December 31, 2011
and 2010, were as follows:
By function 2011 2010
Operating Operating Operating Operating
By item cost expenses Total cost expenses Total
Personnel expenses
Salaries $ 3,691,586 2,814,489 6,506,075 $ 3,322,531 2,833,038 6,155,569
Insurance 184,965 153,109 338,074 153,070 125,508 278,578
Pension 277,404 213,198 490,602 230,663 125,871 356,534
Others (meal
allowances, etc) 1,404,109 240,521 1,644,630 1,123,244 175,227 1,298,471
Depreciation 9,258,491 255,431 9,513,922 9,105,935 169,880 9,275,815
Amortization - 28,370 28,370 - 25,830 25,830

EVA AIRWAYS CORP.
Notes to Financial Statements
103
(b) Reclassification
Certain amounts in the financial statements for the year ended December 31, 2010, have been reclassified to conform with the presentations of the financial statements for the year ended
December 31, 2011, for purposes of comparison. These reclassifications do not have a significant
impact on the financial statements.
(c) Significant foreign currency of financial assets and liabilities.
2011.12.31 2010.12.31
Financial assets
Local
Amount
Exchange
Rate
NT dollars
Local
Amount
Exchange
Rate
NT dollars
Currency
USD $ 33,014 30.28 999,502 114,709 29.13 3,341,473
EUR 4,603 39.18 180,356 3,596 38.88 139,783
JPY 421,111 0.3906 164,486 465,946 0.3581 166,847
HKD 199,684 3.90 778,168 248,237 3.75 930,230
CNY 753,013 4.81 $ 3,619,744 848,713 4.42 3,751,594
$ 5,742,256 8,329,927
Long-term
equity
investment
under equity
method
USD $ 62,509 30.28 $ 1,892,760 14,799 29.13 431,098
2011 2010
Financial
liabilities
Local
Amount
Exchange
Rate
NT dollars
Local
Amount
Exchange
Rate
NT dollars
Currency
USD $ 148,701 30.28 4,501,932 189,845 29.13 5,530,173
EUR 6,440 39.18 252,315 7,361 38.88 286,176
JPY 1,054,213 0.3906 411,776 1,597,227 0.3581 571,938
HKD 20,456 3.90 79,716 26,543 3.75 99,465
CNY 162,644 4.81 $ 781,829 107,039 4.42 473,149
$ 6,027,568 6,960,901
11. Segment Financial Information
The segment financial information is disclosed in its consolidated financial statement instead of the
individual financial statements.
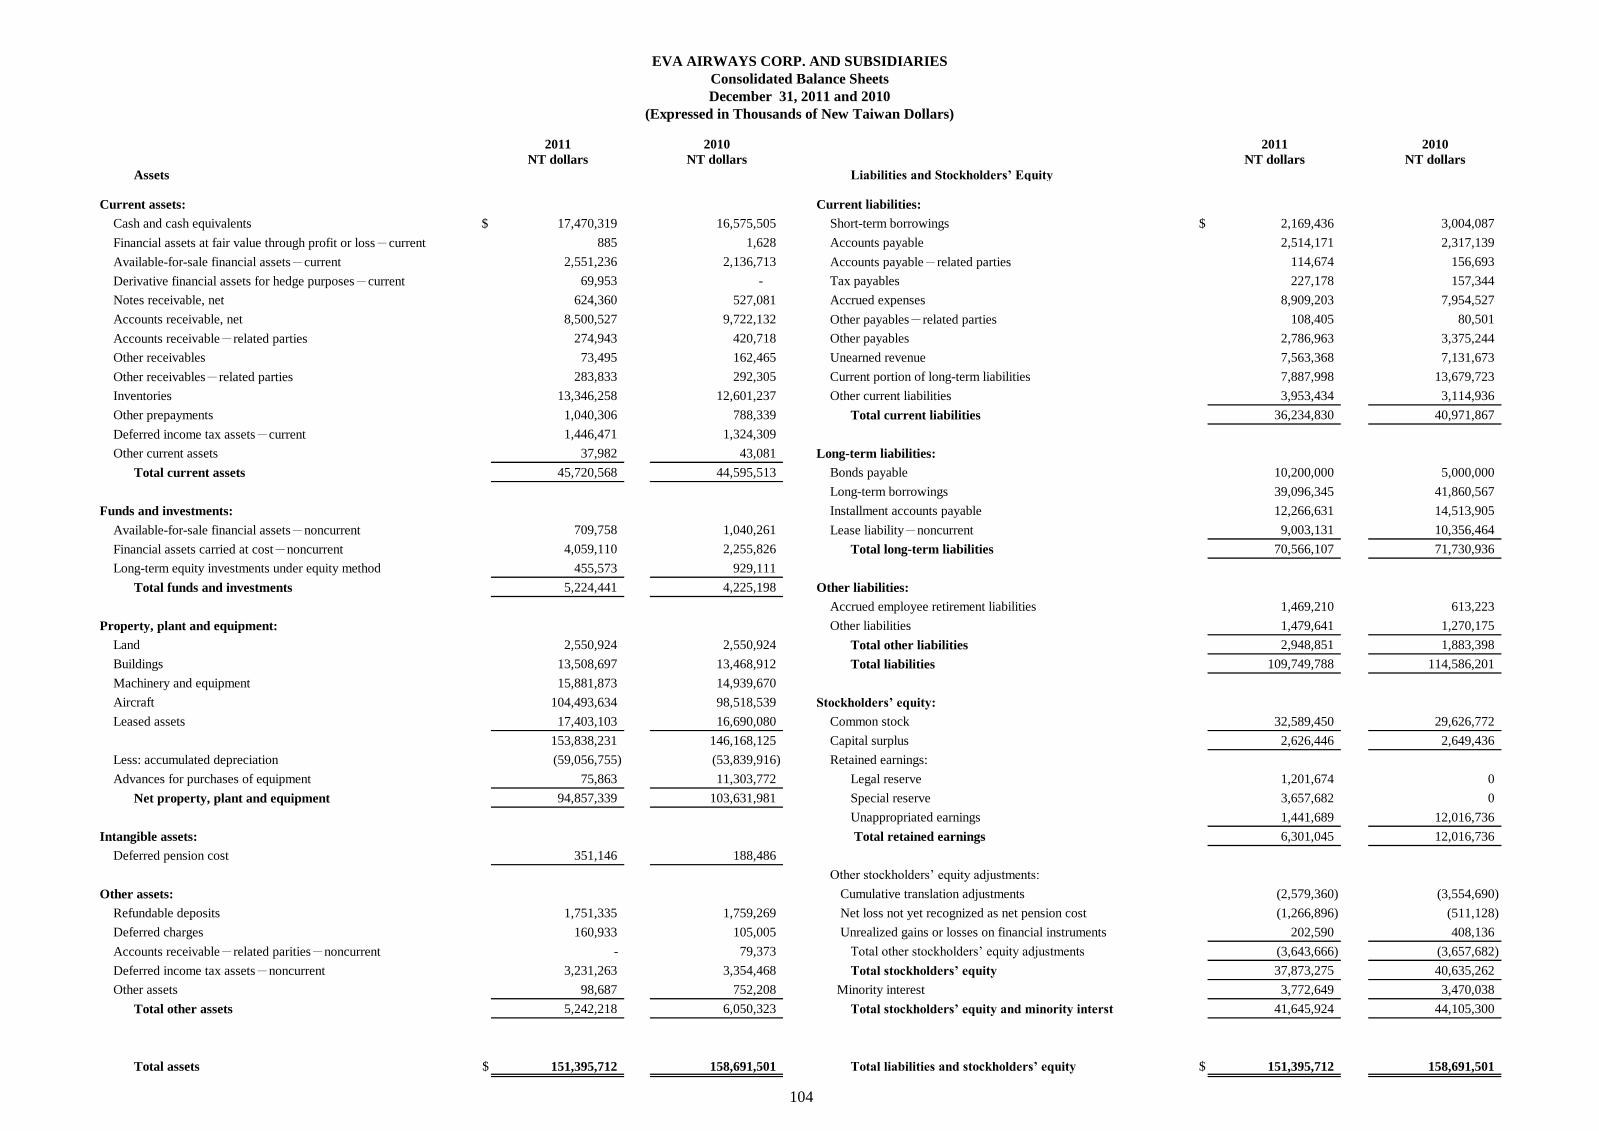
2011 2010 2011 2010
NT dollars NT dollars NT dollars NT dollars
Assets Liabilities and Stockholders’ Equity
Current assets: Current liabilities:
Cash and cash equivalents $ 17,470,319 16,575,505 Short-term borrowings $ 2,169,436 3,004,087
Financial assets at fair value through profit or loss-current 885 1,628 Accounts payable 2,514,171 2,317,139
Available-for-sale financial assets-current 2,551,236 2,136,713 Accounts payable-related parties 114,674 156,693
Derivative financial assets for hedge purposes-current 69,953 - Tax payables 227,178 157,344
Notes receivable, net 624,360 527,081 Accrued expenses 8,909,203 7,954,527
Accounts receivable, net 8,500,527 9,722,132 Other payables-related parties 108,405 80,501
Accounts receivable-related parties 274,943 420,718 Other payables 2,786,963 3,375,244
Other receivables 73,495 162,465 Unearned revenue 7,563,368 7,131,673
Other receivables-related parties 283,833 292,305 Current portion of long-term liabilities 7,887,998 13,679,723
Inventories 13,346,258 12,601,237 Other current liabilities 3,953,434 3,114,936
Other prepayments 1,040,306 788,339 Total current liabilities 36,234,830 40,971,867
Deferred income tax assets-current 1,446,471 1,324,309
Other current assets 37,982 43,081 Long-term liabilities:
Total current assets 45,720,568 44,595,513 Bonds payable 10,200,000 5,000,000
Long-term borrowings 39,096,345 41,860,567
Funds and investments: Installment accounts payable 12,266,631 14,513,905
Available-for-sale financial assets-noncurrent 709,758 1,040,261 Lease liability-noncurrent 9,003,131 10,356,464
Financial assets carried at cost-noncurrent 4,059,110 2,255,826 Total long-term liabilities 70,566,107 71,730,936
Long-term equity investments under equity method 455,573 929,111
Total funds and investments 5,224,441 4,225,198 Other liabilities:
Accrued employee retirement liabilities 1,469,210 613,223
Property, plant and equipment: Other liabilities 1,479,641 1,270,175
Land 2,550,924 2,550,924 Total other liabilities 2,948,851 1,883,398
Buildings 13,508,697 13,468,912 Total liabilities 109,749,788 114,586,201
Machinery and equipment 15,881,873 14,939,670
Aircraft 104,493,634 98,518,539 Stockholders’ equity:
Leased assets 17,403,103 16,690,080 Common stock 32,589,450 29,626,772
153,838,231 146,168,125 Capital surplus 2,626,446 2,649,436
Less: accumulated depreciation (59,056,755) (53,839,916) Retained earnings:
Advances for purchases of equipment 75,863 11,303,772 Legal reserve 1,201,674 0
Net property, plant and equipment 94,857,339 103,631,981 Special reserve 3,657,682 0
Unappropriated earnings 1,441,689 12,016,736
Intangible assets: Total retained earnings 6,301,045 12,016,736
Deferred pension cost 351,146 188,486
Other stockholders’ equity adjustments:
Other assets: Cumulative translation adjustments (2,579,360) (3,554,690)
Refundable deposits 1,751,335 1,759,269 Net loss not yet recognized as net pension cost (1,266,896) (511,128)
Deferred charges 160,933 105,005 Unrealized gains or losses on financial instruments 202,590 408,136
Accounts receivable-related parities-noncurrent - 79,373 Total other stockholders’ equity adjustments (3,643,666) (3,657,682)
Deferred income tax assets-noncurrent 3,231,263 3,354,468 Total stockholders’ equity 37,873,275 40,635,262
Other assets 98,687 752,208 Minority interest 3,772,649 3,470,038
Total other assets 5,242,218 6,050,323 Total stockholders’ equity and minority interst 41,645,924 44,105,300
Total assets $ 151,395,712 158,691,501 Total liabilities and stockholders’ equity $ 151,395,712 158,691,501
EVA AIRWAYS CORP. AND SUBSIDIARIES
Consolidated Balance Sheets
December 31, 2011 and 2010
(Expressed in Thousands of New Taiwan Dollars)
104
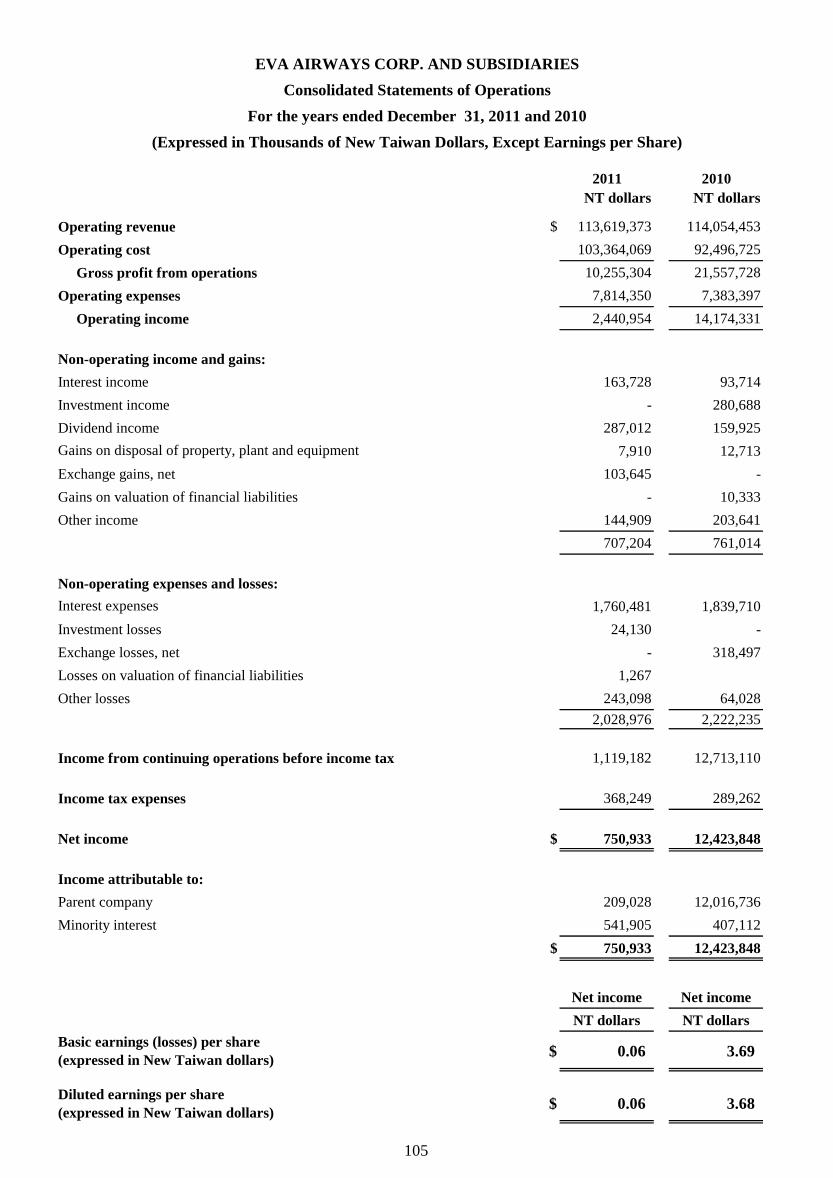
2011 20072010
NT dollars NT dollars
Operating revenue $ 113,619,373 114,054,453
Operating cost 103,364,069 92,496,725
Gross profit from operations 10,255,304 21,557,728
Operating expenses 7,814,350 7,383,397
Operating income 2,440,954 14,174,331
Non-operating income and gains:
Interest income 163,728 93,714
Investment income - 280,688
Dividend income 287,012 159,925
7,910 12,713
Exchange gains, net 103,645 -
Gains on valuation of financial liabilities - 10,333
Other income 144,909 203,641
707,204 761,014
Non-operating expenses and losses:
1,760,481 1,839,710
Investment losses 24,130 -
Exchange losses, net - 318,497
Losses on valuation of financial liabilities 1,267
Other losses 243,098 64,028
2,028,976 2,222,235
Income from continuing operations before income tax 1,119,182 12,713,110
Income tax expenses 368,249 289,262
Net income $ 750,933 12,423,848
Income attributable to:
Parent company 209,028 12,016,736
Minority interest 541,905 407,112
$ 750,933 12,423,848
Net income Net income
NT dollars NT dollars
Basic earnings (losses) per share
(expressed in New Taiwan dollars)$ 0.06 3.69
Diluted earnings per share
(expressed in New Taiwan dollars)$ 0.06 3.68
EVA AIRWAYS CORP. AND SUBSIDIARIES
Consolidated Statements of Operations
For the years ended December 31, 2011 and 2010
(Expressed in Thousands of New Taiwan Dollars, Except Earnings per Share)
Interest expenses
Gains on disposal of property, plant and equipment
105
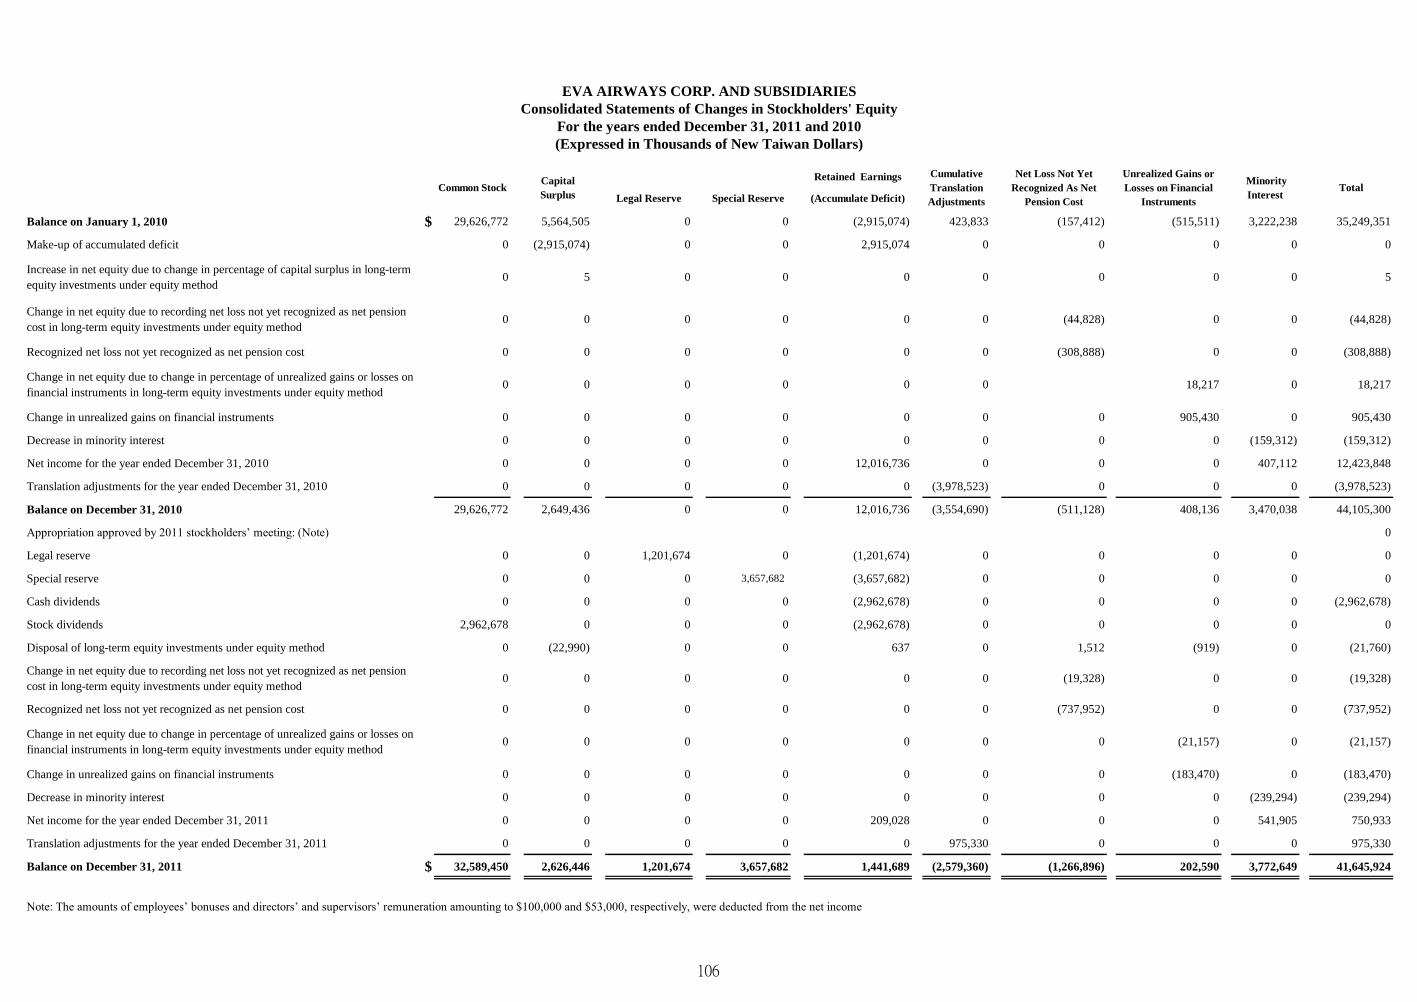
Retained Earnings
Legal Reserve Special Reserve (Accumulate Deficit)
Balance on January 1, 2010 $ 29,626,772 5,564,505 0 0 (2,915,074) 423,833 (157,412) (515,511) 3,222,238 35,249,351
Make-up of accumulated deficit 0 (2,915,074) 0 0 2,915,074 0 0 0 0 0
Increase in net equity due to change in percentage of capital surplus in long-term
equity investments under equity method0 5 0 0 0 0 0 0 0 5
Change in net equity due to recording net loss not yet recognized as net pension
cost in long-term equity investments under equity method0 0 0 0 0 0 (44,828) 0 0 (44,828)
Recognized net loss not yet recognized as net pension cost 0 0 0 0 0 0 (308,888) 0 0 (308,888)
Change in net equity due to change in percentage of unrealized gains or losses on
financial instruments in long-term equity investments under equity method0 0 0 0 0 0 18,217 0 18,217
Change in unrealized gains on financial instruments 0 0 0 0 0 0 0 905,430 0 905,430
Decrease in minority interest 0 0 0 0 0 0 0 0 (159,312) (159,312)
Net income for the year ended December 31, 2010 0 0 0 0 12,016,736 0 0 0 407,112 12,423,848
Translation adjustments for the year ended December 31, 2010 0 0 0 0 0 (3,978,523) 0 0 0 (3,978,523)
Balance on December 31, 2010 29,626,772 2,649,436 0 0 12,016,736 (3,554,690) (511,128) 408,136 3,470,038 44,105,300
Appropriation approved by 2011 stockholders’ meeting: (Note) 0
Legal reserve 0 0 1,201,674 0 (1,201,674) 0 0 0 0 0
Special reserve 0 0 0 3,657,682 (3,657,682) 0 0 0 0 0
Cash dividends 0 0 0 0 (2,962,678) 0 0 0 0 (2,962,678)
Stock dividends 2,962,678 0 0 0 (2,962,678) 0 0 0 0 0
Disposal of long-term equity investments under equity method 0 (22,990) 0 0 637 0 1,512 (919) 0 (21,760)
Change in net equity due to recording net loss not yet recognized as net pension
cost in long-term equity investments under equity method0 0 0 0 0 0 (19,328) 0 0 (19,328)
Recognized net loss not yet recognized as net pension cost 0 0 0 0 0 0 (737,952) 0 0 (737,952)
Change in net equity due to change in percentage of unrealized gains or losses on
financial instruments in long-term equity investments under equity method0 0 0 0 0 0 0 (21,157) 0 (21,157)
Change in unrealized gains on financial instruments 0 0 0 0 0 0 0 (183,470) 0 (183,470)
Decrease in minority interest 0 0 0 0 0 0 0 0 (239,294) (239,294)
Net income for the year ended December 31, 2011 0 0 0 0 209,028 0 0 0 541,905 750,933
Translation adjustments for the year ended December 31, 2011 0 0 0 0 0 975,330 0 0 0 975,330
Balance on December 31, 2011 $ 32,589,450 2,626,446 1,201,674 3,657,682 1,441,689 (2,579,360) (1,266,896) 202,590 3,772,649 41,645,924
Note: The amounts of employees’ bonuses and directors’ and supervisors’ remuneration amounting to $100,000 and $53,000, respectively, were deducted from the net income
Minority
InterestTotalCommon Stock
Capital
Surplus
Cumulative
Translation
Adjustments
EVA AIRWAYS CORP. AND SUBSIDIARIES
Consolidated Statements of Changes in Stockholders' Equity
For the years ended December 31, 2011 and 2010
(Expressed in Thousands of New Taiwan Dollars)
Net Loss Not Yet
Recognized As Net
Pension Cost
Unrealized Gains or
Losses on Financial
Instruments
106

2011 2010
NT dollars NT dollars
Cash flows from operating activities:
Net income $ 750,933 12,423,848
Adjustments to reconcile net income to net cash flow provided by (used in) operating
activities:
Depreciation 10,318,375 10,056,193
Amortization and maintenance expense 47,835 44,788
Investment loss (income) 24,130 (280,688)
Proceeds from cash dividends on long-term equity investments 54,274 89,016
Losses on disposal and obsolescence of property, plant and equipment 50,976 4,866
Gains on disposal of investments (26,201) (3,711)
Deferred income tax (benefit) expenses (4,690) 31
Amortization expense recorded as interest expenses 37,437 83,158
Amortization expense recorded as other expenses 8,944 154
Amortization of other deferred gain (61,701) (53,636)
Other losses 204,753 -
Changes in operating assets and liabilities, net:
Financial assets at fair value though profit or loss 743 25,676
Notes receivable (97,279) 6,340
Accounts receivable 1,221,605 (1,738,534)
Accounts receivable-related parties 145,775 125,462
Other receivable 88,970 5,143
Other receivables-related parties 8,472 (168,675)
Inventories (745,021) (957,257)
Other prepayments (251,967) 432,700
Other current assets 5,099 978
Accounts receivable-related parities-noncurrent 79,373 59,471
Financial liabilities at fair value through profit or loss - (690,979)
Accounts payable 197,032 147,256
Accounts payable-related parties (434,768) (1,004,876)
Tax payable 69,834 (83,737)
Accrued expenses 954,676 1,540,716
Other payables-related parties 27,904 12,767
Other payables 303,581 (1,573,760)
Unearned revenue 431,695 840,319
Other current liabilities 754,396 127,164
Accrued employee retirement liabilities (195,463) (177,565)
Other liabilities 17,315 94,002
Net cash provided by operating activities 13,987,037 19,386,630
Cash flows from investing activities:
Decrease (increase) in available-for-sale financial assets (406,634) 2,682,135
Proceeds from disposal of investment-non-current 187,505 -
Payments for purchase of investment-non-current (121,254) -
Payments for purchase of financial assets carried at cost (1,524,200) -
Proceeds from disposal of long-term equity investments under equity method 220,000 -
Proceeds from withdrawal of financial assets carried at cost 4,211 1,151
Payments for purchase of property, plant and equipment (1,360,323) (4,330,238)
Proceeds from disposal of property, plant and equipment 1,992,745 3,826
Decrease (increase) in refundable deposits 55,159 (160,661)
Increase in deferred charges (150,144) (78,206)
Decrease in other assets 653,521 265,987
Net cash used in investing activities (449,414) (1,616,006)
Cash flows from financing activities:
Increase (decrease) in short-term borrowings (834,651) 87,686
Issuance of bonds payable 10,200,000 -
Redemption of bonds payable (9,000,000) (3,100,000)
Increase in long-term borrowings (including installment accounts payable) 6,234,000 21,919,400
Redemption of long-term borrowings (including installment accounts payable) (14,608,786) (24,930,109)
Redemption of lease liability (1,519,721) (1,457,006)
Decrease in minority interest (239,294) (159,312)
Cash dividends (2,962,678) -
Net cash used in financing activities (12,731,130) (7,639,341)
Effect of exchange rate changes on cash 88,321 (175,506)
Net increase in cash and cash equivalents 894,814 9,955,777
Cash and cash equivalents at beginning of year 16,575,505 6,619,728
Cash and cash equivalents at end of year $ 17,470,319 16,575,505
Additional disclosure of cash flow information:
Interest paid $ 2,023,995 1,975,770
Less: capitalized interest 27,885 214,189
Interest paid (excluding capitalized interest) $ 1,996,110 1,761,581
Income tax paid $ 358,868 378,004
Supplemental schedule of noncash investing and financing activities:
Current portion of long-term liabilities and bonds payable $ 7,887,998 13,679,723
Inventory transferred from fixed assets $ - 13
Unrealized gains or losses on financial instruments (including investee) $ (205,546) 923,647
Translation adjustments $ 975,330 (3,978,523)
Increase in lease liability $ 39,123 -
EVA AIRWAYS CORP. AND SUBSIDIARIES
Consolidated Statements of Cash Flows
For the years ended December 31, 2011 and 2010
(Expressed in Thousands of New Taiwan Dollars)
107
