3,700,000 vélib’ users since july 15 2007 - iis windows...
TRANSCRIPT

1Paris, France – September 2007
H1 2007 RESULTSSeptember 12th 2007
3,700,000 Vélib’ users since July 15th 2007

2
BUSINESS OVERVIEW
Jean-François DecauxChairman of the Executive Board and Co-CEO

3
H1 2007 RESULTS
+ 7.7%
+ 5.7%
+ 3.5%
+ 7.3%
- 2.8%
- 88.3%
(In million €, under IFRS standards)
(1) Operating Margin = Revenues less Direct Operating Costs (excluding Maintenance spare parts and including SG&A costs)(2) EBIT = Earnings Before Interests and Taxes
= Operating Margin less Depreciation, amortization, provisions less Impairment of goodwill less Maintenance spare parts less Other operating income and expenses.
Revenues 1,019.0
Operating margin (1) 280.0
EBIT (2) 175.7
Net income Group share 114.1
Net cash flow from operations 144.3
Free cash flow 7.8

4
H1 2007 REVENUE BREAKDOWN
France
Rest of Europe
UK
North America
Asia-Pacific
Street Furniture
Billboard
By region (% of total)By business (% of total)
Transport28.3%
12.8%
6.5%
14.4%37.2%
24%
26%
50%
Rest of the World: 0.8%

5
Organic growth (%) (1) Reported growth (%)
H1 2007 REVENUE GROWTHBY BUSINESS
(1) Organic growth = excluding acquisitions /divestitures and the impact of foreign exchange.
12.1%
8.9%5.1%
7.7%
StreetFurniture BillboardTransport Group
12.3%
6.9%
StreetFurniture
BillboardTransport Group
8.1%
3.6%

6
H1 2007 REVENUE GROWTHBY REGION
8.1%
-2.0%
14.6%
16.4%
France (2)UK Rest of
EuropeNorth
AmericaAsia-
Pacific
7.8%
Organic growth (%) (1)
Rest of the World
14.7%
(1) Organic growth = excluding acquisitions /divestitures and the impact of foreign exchange.(2) Core advertising revenues in France decreased by 0.2% in the first half of 2007 compared to the same period last year

7
• Organic growth & renewals
• The bike revolution
• Sales & Marketing
H1 2007 BUSINESS HIGHLIGHTS

8
NEW AND RENEWED BUSINESS
NEW CONTRACTS RENEWALS
STREET FURNITURE • Spain Seville (Street furniture & bicycles)
• Japan
• Baltics Tallinn, Vilnius
• Norway Stavanger
TRANSPORT
• Belgium Brussels Airport
• China Shanghai subway (extension of previous contract)
STREET FURNITURE • France Paris (MUPIs®, Seniors®, bicycles)
Toulouse (Street furniture & bicycles)
Strasbourg
Nancy Mulhouse (Street furniture & bicycles)
Besançon (Street furniture & bicycles)
Rouen (Street furniture & bicycles)
BILLBOARD
• France Paris – OPAC contract
SapporoKita-Kyushu SakaiHamamatsu
9
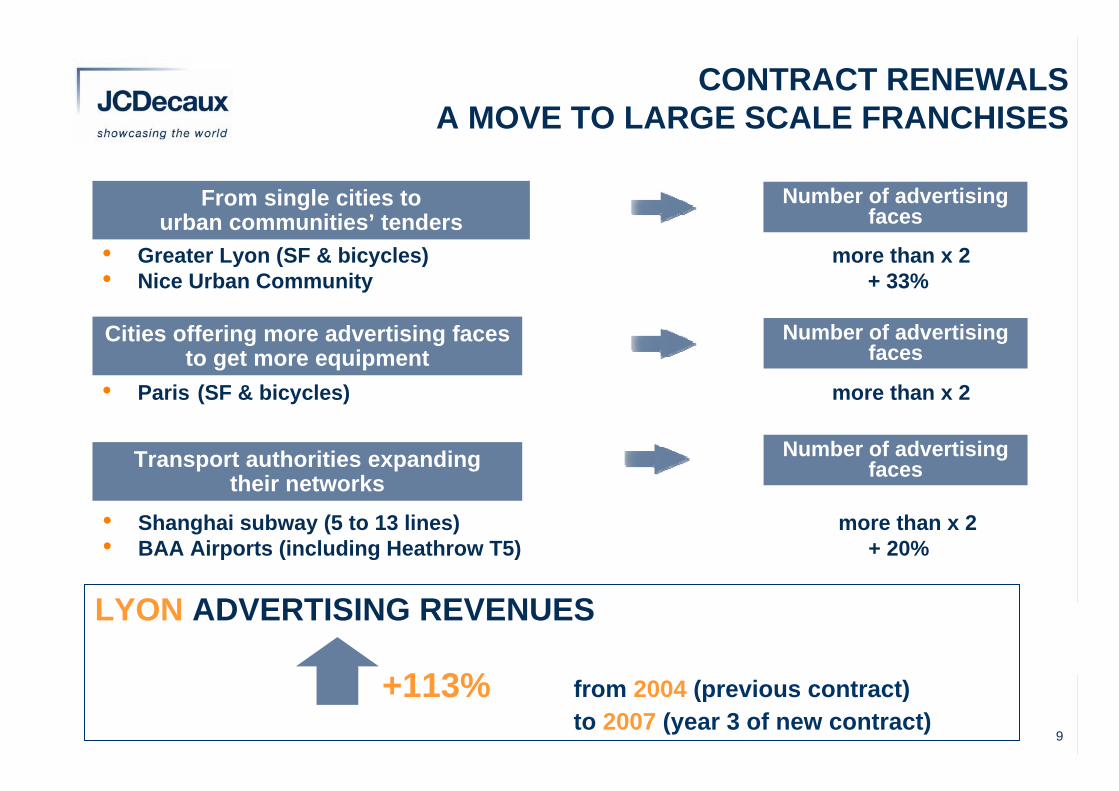
CONTRACT RENEWALSA MOVE TO LARGE SCALE FRANCHISES
• Greater Lyon (SF & bicycles) more than x 2• Nice Urban Community + 33%
From single cities to urban communities’ tenders
Number of advertising faces
Cities offering more advertising faces to get more equipment
• Paris (SF & bicycles) more than x 2
Number of advertising faces
Transport authorities expandingtheir networks
• Shanghai subway (5 to 13 lines) more than x 2• BAA Airports (including Heathrow T5) + 20%
Number of advertising faces
LYON ADVERTISING REVENUES
+113% from 2004 (previous contract)to 2007 (year 3 of new contract)

10
H1 2007 BUSINESS HIGHLIGHTS
• Organic growth & renewals
• The bike revolution
• Sales & Marketing

11Paris, France2007
Lyon, France2005
Aix-en-Provence, France2006
Brussels, Belgium2006
Seville, Spain2007
Vienna, Austria2003
N°1 PROVIDER OF SELF-SERVICE BIKES FINANCED BY ADVERTISING
12
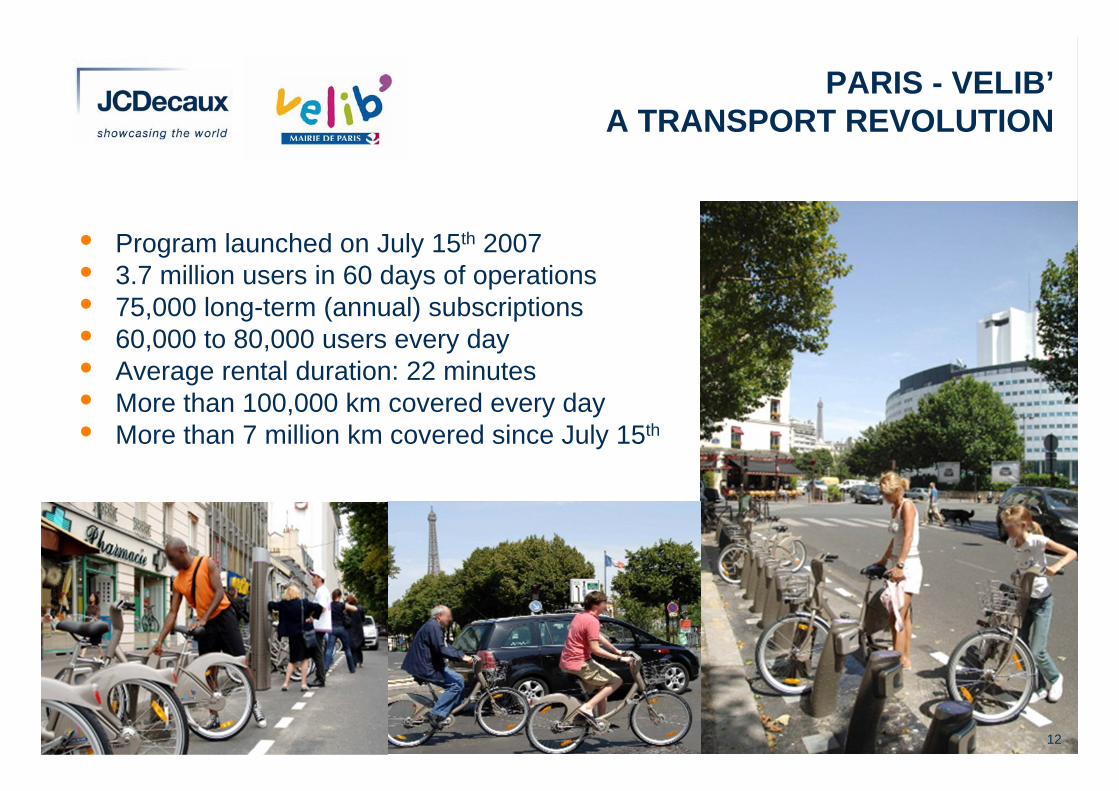
PARIS - VELIB’A TRANSPORT REVOLUTION
• Program launched on July 15th 2007• 3.7 million users in 60 days of operations• 75,000 long-term (annual) subscriptions • 60,000 to 80,000 users every day • Average rental duration: 22 minutes• More than 100,000 km covered every day• More than 7 million km covered since July 15th
12

13
SELF-SERVICE BIKESONE STRATEGY, SEVERAL BUSINESS MODELS
SIGNIFICANT
ADVERTISING
INVENTORY
MEDIUM-SIZEADVERTISING INVENTORY
LIMITEDADVERTISING INVENTORY
Paris5,900 advertising faces
Lyon 5,400 advertising faces
Marseille700 advertising faces
Toulouse 350 advertising faces
• 100% financed by Street Furniture advertising• Quality incentive paid to JCDecaux
(up to 12% of ad revenues + bicycle revenues)
• 100% financed by Street Furniture advertising• Yearly subscriptions (revenues go to JCDecaux)
• Rent paid by the city to JCDecaux• Partially financed by Street Furniture advertising• Advertising on bicycles (revenues go to JCDecaux)
• Largely financed by the city• Partially financed by Street Furniture advertising• Advertising on bicycles (revenues go to JCDecaux)• Yearly subscriptions (revenues go to JCDecaux)

14
• Organic growth & renewals
• The bike revolution
• Sales & Marketing
BUSINESS HIGHLIGHTS

15
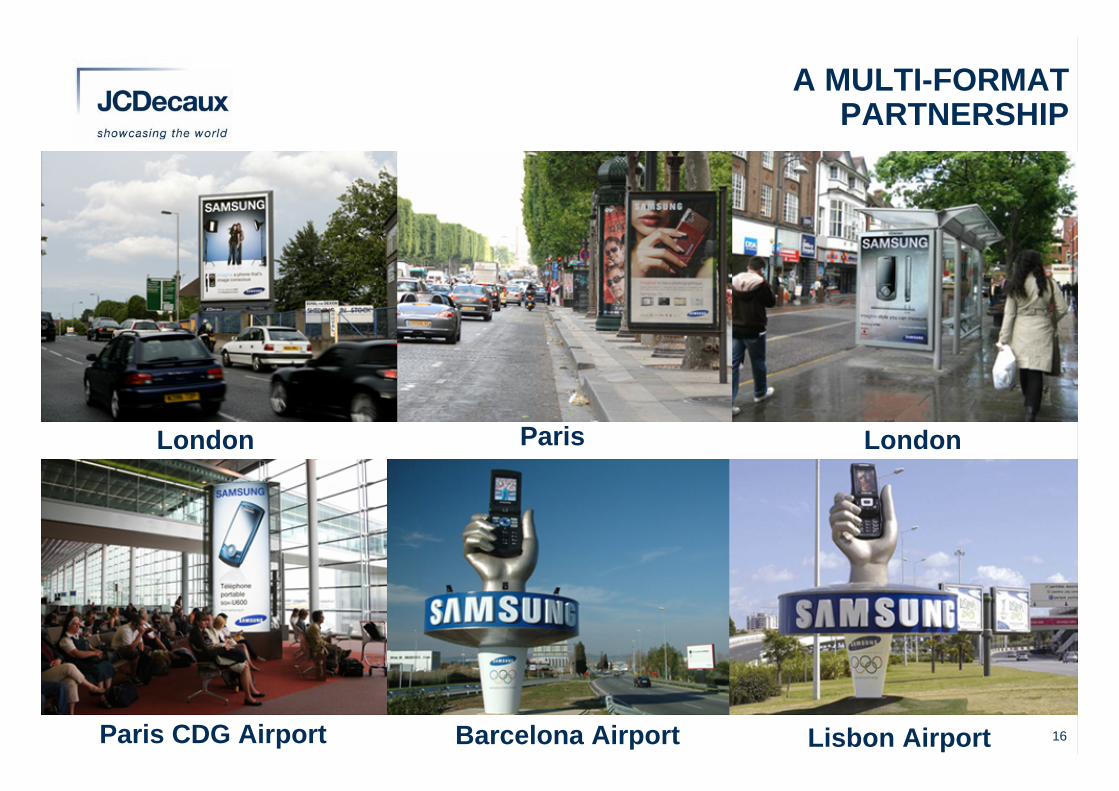
3-YEAR PAN EUROPEANALLIANCE WITH SAMSUNG
Utilization of JCDecaux networks in 20 countries
All Samsung divisions included in the partnershipMobile phone, TV , MP3, white goods, digital cameras
All divisions of JCDecaux Street Furniture - Billboard - Transport
A GLOBAL COMPANY WORKING WITH GLOBAL BRANDS
&
16
A MULTI-FORMATPARTNERSHIP
London Paris
Lisbon AirportParis CDG Airport Barcelona Airport
Paris
London

17
Number of Innovate campaigns:
+61% from 440 in 2005 to 710 in 2006
• Creative outdoor advertising• Tailor-made execution• Using new technological solutions (Bluetooth®…)
Meeting advertisers’ demand for consumer engagement
NOW AVAILABLE IN 34 COUNTRIES

18Lisbon airport, Portugal – May 2007
SPECIAL BUILDVODAFONE

19
Paris, France – May 2007Allowing children to send pictures of their faces via the Internet to be posted on the banner.
INTERACTIVE LARGE FORMAT PANELDISNEYLAND PARIS 15th ANNIVERSARY

20Brussels, Belgium July 2007 Madrid, Spain
SPECIAL BUILDSTHE SIMPSONS MOVIE

21
SPECIAL EFFECTSDIE HARD 4
Brussels, Belgium July 2007

22
FINANCIAL HIGHLIGHTSGérard Degonse
Executive Vice-President, Finance & Administration

23
H1 2007 H1 2006 % change
P&L
(In million €, except %, under IFRS standards)
(1) Operating Margin = Revenues less Direct Operating Costs (excluding Maintenance spare parts and including SG&A costs)(2) EBIT = Earnings Before Interests and Taxes
= Operating Margin less Maintenance spare parts less Depreciation and provisions less Goodwill impairment less Other operating income and expenses(3) Due to the finalisation of the purchase accounting related to the acquisition of Media Partners International, H1 2006 EBIT and Net income Group share have been restated.
Revenues 1,019.0 945.8 +7.7% Operating costs (739.0) (680.8)
Operating margin (1) 280.0 265.0 +5.7%Depreciation, spare parts & others (104.3) (95.2)(3)
Goodwill impairment - -EBIT (2) 175.7 169.8 (3) +3.5%Financial income (loss) (22.2) (22.2)
Tax (45.7) (44.7) (3)
Equity affiliates 9.2 5.6 (3)
Minority interests (2.9) (2.2)
Net Income Group share 114.1 106.3 (3) +7.3%

24
Operating margin (% of revenues) EBIT (% of revenues)
Street Furniture
Billboard TotalGroup
41.3%
27.5%
-50bp
17.9%
+240bp
Street Furniture
BillboardTransport TotalGroup
26.4%
17.2%
-240bp-80bp
10.7%
+320bp
5.6%0bp
-140bp
(under IFRS standards)
Transport
9.7%+10bp
MARGINS BY DIVISION

25
Operating margin (% of revenues)
38404143
4546454340
363537
39 3840
45
40
1985 ‘86 ‘87 ‘88 ‘89 ‘90 ‘91 ‘92 ‘93 ‘94 ‘95 ‘96 ‘97 ‘98 ‘99 ‘00 ‘01 ‘02
European Expansion US Expansion
‘03 ‘04 ‘05 ‘06
41 4243
41 42
Revenues x 6.6
STREET FURNITUREMARGINS AROUND 40%
H1 07
41
Note: French Gaap until 2004 – IFRS as of 2005
French renewalsEmerging markets’expansion

26
H1 2007 H1 2006 % change
P&L
(In million €, except %, under IFRS standards)
(1) Operating Margin = Revenues less Direct Operating Costs (excluding Maintenance spare parts and including SG&A costs)(2) EBIT = Earnings Before Interests and Taxes
= Operating Margin less Maintenance spare parts less Depreciation and provisions less Goodwill impairment less Other operating income and expenses(3) Due to the finalisation of the purchase accounting related to the acquisition of Media Partners International, H1 2006 EBIT and Net income Group share have been restated.
Revenues 1,019.0 945.8 +7.7% Operating costs (739.0) (680.8)
Operating margin (1) 280.0 265.0 +5.7%Depreciation, spare parts & others (104.3) (95.2)(3)
Goodwill impairment - -EBIT (2) 175.7 169.8 (3) +3.5%Financial income (loss) (22.2) (22.2)
Tax (45.7) (44.7) (3)
Equity affiliates 9.2 5.6 (3)
Minority interests (2.9) (2.2)
Net Income Group share 114.1 106.3 (3) +7.3%

27
(In million €, except %, under IFRS standards)
Net Cash flow from operating activities 144.3 148.5 -2.8%General Inv. & Renewal capex (59.0) (52.4)Adjusted free cash flow 85.3 96.1 -11.2%
Growth capex (incl. intangible asset) (77.5) (29.6)
Free cash flow 7.8 66.5 -88.3%Dividends (net) (88.5) (85.2)Equity increase 0.9 11.6 Financial investments (net) (9.1) (44.2)Others (1) (4.3) 9.8
Change in net debt (Balance Sheet) (2) 93.2 41.5
CASH FLOW STATEMENT
Note: Adjusted free cash flow = Free Cash Flow before Growth Capex.(1) Non cash variations (mainly due to consolidation scope variations, translation differences on net financial debt, the impact of IAS 39 and finance lease)(2) Excluding the IAS 32 impact, including the IAS 39 impact on both debt and financial derivatives and including the restatement of loans granted to
companies consolidated under the proportionate method
H1 2007 H1 2006 % change

28
CAPEX2004 - 2008
2004 20062005 2007(e) 2008(e)
168
92
141
59
93
141In m€
Growth capex
Renewal capex
General Inv.
25
1921 25 2523
80
617557
90
Paris
75
70
180(excl. Intangibles)
Growth capex / intangiblesIncl. € 78 m pre-payment to
Shanghai Metro(€ 39 m in 2007 - € 39 m in 2008)
260(excl. Intangibles)

29
A ROBUST FINANCIAL STRUCTURE
• SOUND FUNDAMENTALS
• STRONG GENERATION OF CASH FLOW
• A BALANCE SHEET READY FOR GROWTH & EXPANSION

30
GROWTH STRATEGY AND OUTLOOKJean-Charles Decaux
Co-CEO

31
A GROWTH MEDIA SECTOR
A GROWING SECTOROutdoor continues to benefit from the fragmentation of traditional media
NEW FORMATSDigital upside
EMERGING COUNTRIESIncreased exposure

32
Apart from the internet, onlycinema and outdoor are forecastto grow faster than the market to 2009. […] Outdoor continues to gain share as contractors invest
in better displays and betterresearch.
OUTDOOR ADVERTISING,A GROWING SECTOR
2007-2009 CAGR forecast growth
Total ad.market6.0%
Outdoor TV Print Radio Internet
7.7%
6.2%
3.5% 3.8%
19.2%
Source: Zenith Optimedia Forecast – June 2007
ZenithOptimedia’s Advertising Expenditure Forecasts, June 2007

33
NEW FORMATSDIGITAL OUTDOOR ADVERTISING
Digital Wall - New York JFK Airport The Torch - LondonTrackside Plasma TV – Hong Kong subway
AIRPORTS• Paris Airports• BAA Airports incl. Heathrow T5
• New York JFK Airport• Los Angeles (LAX) Airport
SUBWAYS• Hong Kong • Vienna• Prague
CITIES• London• Cannes• Ad-hoc campaigns in bus
shelters (plasma screens)
• Rational move to digital: step by step and selective• Particularly relevant to transit environment with captive audience• A way to extend and renew contracts

34
Heathrow T5 – London
Digital walkways
Photomontage
BAATHE FUTURE OF AIRPORT ADVERTISING
« Terminal 5 will act as a blueprint for the future of airport advertising and we are looking forward to rolling it out across all BAA airports in the future »Duncan Tolson, Director of Media at BAA
• One of the largest deployment of digital technology worldwide• State of the art digital technology• 700 digital locations across all BAA• Capex paid by BAA
• Heathrow T5 opening: March 2008• 280 digital locations
34

35
SHANGHAI SUBWAYA SUCCESSFUL RENEWAL & EXTENSION
Exclusive 15-year contractFrom 5 metro lines in 2007 to 13 metro lines by 2012China’s largest subway system
20075 lines
95 stations1.8 million pax/day
20109 lines
250 stations6 million pax/day
201213 lines
350 stations7.2 million pax/day
Shanghai World Expo
A landmark franchise strengtheningJCDecaux’ market leading position in China’s largest city
35

36
• China’s largest metro advertising contract
• Joint-venture with Shanghai metro- Financial rights: 65% JCD - 35% metro- Equity rights: 51% JCD - 49% metro
• Expected revenues€ 1.5 bn over 15 years @ 100%
• Different fee structure vs usualTransport contracts
- 15 years- no minimum guarantee- reduced annual revenue share- € 78 million pre-payment(€ 39 m in 2007 - € 39 m in 2008)
SHANGHAI SUBWAYA LANDMARK FRANCHISE
Contract descriptionSubway benchmark
2010 daily traffic(1)
2010 Yearly revenues(2)
Moscow 7.7 million -
Shanghai 6.0 million € 60 m
New York 5.7 million € 60 m
Paris 4.4 million € 100 m
€ 180 mLondon 3.2 million
(1) JCDecaux estimates assuming a yearly traffic growth of 2% as of 2006 for London, Moscow, New York and Paris subway systems(2) JCDecaux estimates of 2010 revenues

37
INCREASED EXPOSURE TO FAST-GROWING OUTDOOR MARKETS
Fastest-growing outdoor markets worldwideCountries showing double-digit growth in 2008 vs 2007 (Zenith Optimedia, June 2007)
Growth JCD presence
Eastern EuropeSlovakia +41% N°1Moldova +25%Russia +22% through BigBoardRomania +20% through AffichageLithuania +16% Bulgaria +16% Bosnia +13%Greece +12% through AffichageBelarus +11%Latvia +10% N°1Slovenia +10% N°1
Latin AmericaUruguay +10%
Growth JCD presence
Asia PacificChina +25%(1) N°1Indonesia +20%India +13%Hong Kong +13% N°1Singapore +12% Malaysia +10% Australia +10%
Middle East / AfricaUnited Arab E. +58%Qatar +47% Saudi Arabia +44%Kuwait +32%Egypt +20%Bahrain +17%South Africa +10%Algeria +10%
Ongoing business
development
(1) Data for the Chinese outdoor market are not available. 25% is the growth of total ad spend forecast by Zenith Optimedia in 2008.

38
THE RIGHT COMPANY IN THE RIGHT BUSINESS AT THE RIGHT TIME
• OUTDOOR:The only media (excl. Internet) gaining market share within the media mix
• JCDECAUX:- A well-balanced:
- Mix of activities- Geographic exposure
- Strong growth prospects from: - Well-established markets- Emerging countries

39
REVENUESWe continue to expect that our organic revenue growth in 2007 will be similar to that of 2006, within a likely range of 7-8%, reflecting an
acceleration of organic revenue growth in the second half due toongoing strength in the Transport division, a stronger growth rate in
Street Furniture and improved market conditions in France.
OUTLOOK FOR 2007
40Paris, France – September 2007
H1 2007 RESULTSSeptember 12th 2007

41Paris, France – September 2007
H1 2007 RESULTSSeptember 12th 2007

42Paris, France – September 2007
H1 2007 RESULTSSeptember 12th 2007