36p.media campaign to change student perceptions of drinking norms. during the course of the...
TRANSCRIPT

ED 421 930
AUTHORTITLE
INSTITUTION
SPONS AGENCYREPORT NOPUB DATENOTEAVAILABLE FROM
PUB TYPEEDRS PRICEDESCRIPTORS
IDENTIFIERS
ABSTRACT
DOCUMENT RESUME
HE 031 452
Haines, Michael P.A Social Norms Approach to Preventing Binge Drinking atColleges and Universities.Higher Education Center for Alcohol and Other DrugPrevention, Newton, MA.Department of Education, Washington, DC.ED-OPE-96-181996-00-0036p.Higher Education Center for Alcohol and Other DrugPrevention, Education Development Center, Inc., 55 ChapelStreet, Newton, MA 02158-1060; phone: 800-676-1730; e-mail:[email protected]; World Wide Web: http://www.edc.org/hec/Reports - Descriptive (141) Tests/Questionnaires (160)MF01/PCO2 Plus Postage.*Alcohol Abuse; *Alcohol Education; College Environment;*College Students; Drinking; Higher Education; *Mass MediaEffects; Mass Media Role; Mass Media Use; *SchoolNewspapers; School Role; *Student Attitudes; StudentBehavior; Student Reaction; Student Welfare; Surveys*Binge Drinking; Northern Illinois University
This document describes an effort to change perceptions ofsocial norms and examines the effect of this change on binge drinking andalcohol-related problems at Northern Illinois University (NIU). The firstsection of the report discusses the historical and theoretical basis for thisapproach to prevention. The next section describes a campus-based mass mediacampaign designed to change student perceptions of drinking norms implementedby NIU after the failure of a more traditional alcohol abuse preventionprogram. The document describes in detail the methods used for this program.Sample media messages are provided, along with a discussion of the effects ofstudent focus groups and research on the cost effectiveness of mass mediaprograms. The report also addresses applications of the approach to differentcampus settings, including commuter schools, schools without newspapers, andsmall-enrollment colleges. Suggestions for applying the model to women,athletes, fraternity and sorority members, and ethnic minorities are alsooffered. During the course of the campaign, NIU students reported reducedbinge drinking for each of six years measured for this report, as well asfewer alcohol-related injuries to self and fewer injuries to others.Appendices include an annual budget for the program and copies of surveyinstruments. (Contains 19 references.) (MAB)
********************************************************************************* Reproductions supplied by EDRS are the best that can be made *
* from the original document. *
********************************************************************************

U.S. DEPARTMENT OF EDUCATIONOffice of Educational Research and Improvement
EI4JCATIONAL RESOURCES INFORMATIONCENTER (ERIC)
This document has been reproduced asreceived from the person or organizationoriginating it.
0 Minor changes have been made toimprove reproduction quality.
Points of view or opinions stated in thisdocument do not necessarily representofficial OERI position or policy.
GU
A Social NormsApproachto PreventingBinge Drinkingat Collegesand Universities
The Higher Education Center for Alcohol and Other Drug Prevention
Funded by the U.S. Department of Education

IA Social Norms Approach
to Preventing Binge Drinkingat Colleges and Universities
By
Michael P. Haines
Northern Illinois University
a publication ofThe Higher Education Center for Alcohol and Other Drug Prevention
Funded by the
U.S. Department of Education

AcknovviedgmentsWe wish to thank the individuals listedbelow for reviewing draft manuscriptsfor this publication. We appreciate thecomments they provided to help usensure that this publication has solidscientific foundation and contains clearmessages. To the extent we achieved thatgoal, the credit is theirs. To the extent wedidn't, the fault is ours.
Alan Berkowitz, Ph.D.,Hobart and William Smith CollegesDaniel Casey, St. John's UniversityWilliam De Jong, Ph.D.,Harvard UniversityLinda Frazier, RN,Harvard UniversityDeb Hofer, Northern State University,South DakotaJeff Likenbach, Ed.D.,Montana State UniversityWesley Perkins, Ph.D.,Hobart and William Smith CollegesIan Wong, Babson College
U.S. Department of Education(Publication No. ED/OPE/96-18).Views expressed are those of the contrac-tor. No official support or endorsementby the U.S. Department of Education isintended or should be inferred.
Anyone may use or reproduce, for non-commercial purposes, all material in thisvolume, except quoted passages fromcopyrighted sources, without permissionfrom Education Development Center.Citation of the source is appreciated.
1996 Education Development Center, Inc.Permission granted for noncommercialquotations.
Design/Layout: J. Lane Designs
Contents
Preface 3
Executive Summary 4
The NIU Campaign 8
References 24
Appendixes
A. Core Instrument 25
B. Sample Questions 28
from MU Survey
C. Misperception Media 32Campaign Estimated Costs

PREFACE
The Higher Education Center for Alcohol and Other Drug Prevention
SINCE 1993, THE U.S. DEPARTMENT
of Education's Higher EducationCenter for Alcohol and Other DrugPrevention has offered a range ofservices and publications to supportprevention efforts at colleges anduniversities across the country. TheCenter's activities and products reflecta comprehensive and integratedapproach to prevention that is basedon the use of multiple strategiesdesigned to have a large-scale impacton the entire student body and thecampus and community environment.
The Center's goal is to influence andchange detrimental campus normsand myths and to prevent the nega-tive consequences related to alcoholand other drug use. All Center activi-ties are guided by an emphasis onproactive prevention, which aims toprevent problems before they arise bychanging the campus environmentand social climate to one of low toler-ance forillegal alcohol and other drug useand abuse.
Center activities and publicationsstress building capacity across thespectrum of institutions of higher edu-cation to develop and maintain pre-vention efforts. The Center relies onresearch-based methods for its train-ing, technical assistance, and publica-tions.
This publication represents onepiece in a comprehensive approach toprevention at institutions of highereducation (IHEs). The concepts andapproaches described should be
viewed in the broader context of pre-vention theory and approachesaffirmed by the U.S. Department ofEducation and implemented by TheCenter in its training, technical assis-tance, publications, and evaluationactivities.
For information on Center servicesand publications, please contact:
The Higher Education Center forAlcohol and Other Drug PreventionEducation Development Center, Inc.55 Chapel StreetNewton, MA 02158-1060
Tel 800-676-1730
Web site: http:/ /www.edc.org/hec/
3
EXECUTIVE
SUMMARY
THIS PUBLICATION DESCRIBES
an effort to change perceptions ofsocial norms and the effect of thischange on binge drinking andalcohol-related problems at NorthernIllinois University (NIU).
The first section discusses the his-torical and theoretical basis for thisapproach to prevention. The NIUapproach is based on researchdemonstrating that, at many collegesand universities, there is a significantdisparity between student estimatesof binge drinking by students andactual binge drinking behavior. Afterimplementation of a more traditionalalcohol abuse prevention effort failedto change drinking behavior, NIUimplemented a campus-based massmedia campaign to change studentperceptions of drinking norms.During the course of the campaign,NIU students have reported reducedbinge drinking for each of the last sixyears, with an overall 35 percentreduction. They have also reported31 percent fewer alcohol-relatedinjuries to self and 54 percent feweralcohol-related injuries to others.
The publication then describes themethods used to implement the NIUprogram. The program relies heavilyon mass media, especially the cam-pus newspaper. Examples of mediamessages are provided, student focusgroup results are discussed, andresearch is presented suggesting thatusing mass media is the most cost-effective method of reaching stu-
dents on large campuses.
The third section addresses appli-cations of the approach in differentcampus settings, including com-muter schools, schools withoutnewspapers, and small enrollmentcolleges. Suggestions for applyingthe social norms model to women,athletes, fraternity and sororitymembers, and ethnic minorities areoffered. Also noted are types of cam-puses where the model would beineffective or too costly.
Included in the Appendixes arean annual budget and copies of sur-vey instruments.
Background
Drinking practices of college stu-dents have been a concern almostsince the first colleges were foundedin the United States. A local sheriffstill leads Harvard University'sgraduation procession, a traditionthat began in Colonial days to con-trol drunk and rowdy celebrants(Wechsler et al., 1995). The Drug-
Free Schools and Campuses Act of1986, as well as funding for alcoholand other drug prevention in highereducation through the U.S.Department of Education's Fund forthe Improvement of PostsecondaryEducation (FIPSE), brought the Waron Drugs to every dormitory, frater-nity house, and tailgate party.
Campus needs assessments,national studies, and police reportsprovided overwhelming evidencethat the drug of choice and the one
6
The Higher Education Center for Alcohol and Other Drug Prevention
most often associated with problemsfor college students is alcohol.Heavier use of alcohol is consistentlyand significantly correlated withnegative consequences (Perkins &Berkowitz, 1986; Hanson & Engs,1992; Presley et al., 1995; Wechsler etal., 1994).
Both the Monitoring the FutureStudy (Johnston et al., 1992), con-
ducted annually with funding fromthe National Institute on DrugAbuse (NIDA), and the HarvardCollege Survey (Wechsler et al.,
1994) have found that drinking ingeneral and binge drinking (definedas having more than five drinks atone sitting) by college students con-tinue at high levels, posing substan-tial health and safety risks.
In 1988, NIU received a FIPSE
grant to fund an expansion of itsalcohol abuse prevention efforts andto implement a social influence cam-paign to reduce binge drinking.Conducted through the HealthEnhancement Services Office of theUniversity Health Service, the pro-ject's objectives were specific andmeasurable: to reduce alcohol-related morbidity among NIU's23,000 students.
Health Enhancement Servicesbegan surveying NIU students aboutalcohol use and other health-relatedpractices in the spring of 1988. Aninstrument was developed to gatherthis information (see Appendix B) atthe end of the academic year. In adeliberate but nonrandom way, the
survey is distributed by a graduateassistant in classes where an instruc-tor has provided time.
Classes are selected to representthe array of student majors andgrade levels. This convenience sam-pling of large general educationclasses was done to ensure broadrepresentation and high return rates.Classes are informed that participa-tion in the survey is optional,responses are anonymous, andresults will be used to determine themost effective way to spend studentfees to reduce harm to students onthis campus. The return rate aver-aged 90 percent, and the results arehighly representative of the studentbody.
Because the survey is optional andanonymous, it is exempt from NIU'shuman subjects research require-ments. Students respond on scanableforms, and data is analyzed byHealth Service prevention staff, whoare familiar with the social influencemodel and focus the summary of thedata on positive and protectivesocial norms.
The 1988 survey (n = 644) showedan NIU binge drinking rate of 43percent. Almost 30 percent of thestudents reported physical harm toself and 16 percent reported physicalharm to others during that schoolyear as a consequence of drinking.These data served as a baselineagainst which the project's impactwould be assessed.

RG. 1
impact of traditionalIntervention on Binge Drinking
80%
70
60
50
40
30
20
n = 644 n = 779
1988 1989Baseline Traditional
44.801111111111.
43.0
N IU StudentsActual Binge *
* Binge defined asdrinking more than 5drinks when "partying"
During the 1988-1989 academicyear, NIU significantly increased itsprevention efforts. Activitiesincluded educational programs,National Collegiate AlcoholAwareness Week, an active College
Students Against Drunk Driving(CSADD) chapter, and the distribu-tion of flyers and posters. Messageand content of these efforts weresimilar and incorporated the follow-ing themes:
support for abstinence, such as"It's O.K. not to drink. Don'tforce drinks on others . . ."
responsible drinking, suchas "Eat before drinking,alternate non-alcoholic drinkswith alcoholic drinks .. ."association of binge drinkingwith negative consequences,such as "Heavy drinkers arearrested more frequently, getinto fights, harm themselvesand others . .."
At the end of the 1988-1989 acade-mic year, students were again sur-veyed (n = 779). Despite increasedprevention efforts, as illustrated inFigure 1 binge drinking rates andalcohol-related injury rates were sta-tistically unchanged.
This disappointing outcomeprompted a rethinking of the campusalcohol and other drug (AOD) pre-vention project. Health EnhancementServices staff investigated further theresearch on misperception of drink-ing norms reported in 1986 by
Wesley Perkins, PhD, and AlanBerkowitz, PhD, from Hobart andWilliam Smith Colleges in Geneva,New York. They found that there wasa significant discrepancy betweenactual alcohol use by college studentsand their perception of other stu-dents' alcohol use. Other campusesthat investigated student perceptionsfound the same disparity betweenactual drinking norms and perceiveddrinking norms. On every campus,regardless of drinker type or level ofuse, the drinker thought the campusdrinking norm was greater than his orher own personal use (Perkins andBerkowitz 1987). Figure 2 shows these
discrepancies.
RG. 2
Actual and Perceived Norms of Alcohol
Use among Undergraduates on a
Residential College Campus
Most Permissive
Permissive
Moderate
Restrictive
Most Restrictive
.4-- Perception of Campus
-4 Perception of Living Unit
-4 Perception of Friends
-4- Actual Campus Norm*
*Based on aggregate of
students' personal attitudes
from: Berkowitz AD, and Perkins HW, 'Changing Student Misperceptions of
Drug Use Norms: Educational, Program and Cknical Strategies, "The FIPSE
Drug Prevention Programs in Higher Education Conference, Sept. 19-22, 1991.
Washington D.C.
8

SOCIALThe Higher Education Center for Alcohol and Other Drug Prevention
This misperception of drinkingnorms occurred at NIU also. Asshown in Figure 3, students sur-veyed during the previous two aca-demic years reported personalbinge drinking rates of 43 percentin 1988 and 45 percent in 1989.
When asked how much theythought most NIU students drank,they perceived binge rates to be 70percent and 69 percent, respectively.Thus, fewer than half the studentswere binge drinkers but theythought more than two of everythree students on campus werebinge drinkers.
Perkins and Berkowitz suggestedthat this "reign of error" had apowerful negative influence on stu-dent drinking behavior (Perkins,1991). If college students think
"everyone is doing it," then bingedrinking rates rise due to influencefrom "imaginary peers" (Berkowitz,1991). These theories were sup-
ported by research showing that theperceptions of drinking norms bycollege students, whether accurateor misperceived, had a strong andpredictive influence on studentdrinking behavior (Graham et al.,1991; Prentice & Miller, 1993).
The overestimation of studentbinge drinking is a self-fulfillingprophecy. The more studentsbelieve binge drinking is occurring,the more binge drinking occurs(Perkins, 1996). Furthermore, exper-iments conducted by Hansen andGraham (1991) demonstrated that
9
reducing perceptions of alcohol,tobacco, and other drug use (ATOD)was an effective strategy for reduc-ing actual ATOD use among adoles-cents.
This research suggested that if themisperception of the binge drinkingnorm were corrected, the actualbinge drinking rate would decline.NIU incorporated these researchfindings in its prevention objectivesfor the next academic year, aiming toreduce student binge drinking mea-surably by reducing the perceptionof binge drinking on campus amongits 23,000 students.
RG. 3
Comparison of Deadens! Interventionand impact on Perceived and Actual
Binge Drinking
n = 644 n = 779
1988 1989Baseline Traditional
80%
70
60
50
40
30
20
69.7 69.3
)NIU StudentsPerceived Binge *
NIU StudentsActual Binge *
*thinegite&a:nd.r.i,'11,",Pte

THE NIUCAMPAIGN
THE NIU CAMPAIGN TARGETED
students who drank alcohol. Whenthe effort began, drinkers composed90 percent of the campus popula-tion. Consequently, any effort toreach drinkers was virtually synony-mous with reaching all students.However, Health EnhancementServices had the equivalent of onefull-time staff person to accomplishthe objective. The sheer size of thetask seemed to preclude reliance onface-to-face approaches (speeches,residence hall programs, peer educa-tors) to get the message across.These limitations suggested a needto develop a campaign based onmass media.
A survey conducted by theDivision of Student Affairs (n = 800)asked students to rate their primary
FIG. 4
Students' Primary Source of informationAbout Campus Activities
n = 800
75% Read the Campus Paper Daily
OtherStudents14
BulletinBoards/Posters
Dorm Staff
8
All Others
NIU Student Affair Survey PublicOpinion Laboratory 1984, 1989.
sources of information about campusactivities. As shown in Figure 4, thecampus newspaper was the over-whelming first choice of the studentsas the primary source of information,with 75 percent of the student bodyreading the paper every day. Otherstudies at NIU and other campuseshave found that print media are afrequent student source of AOD andother health information.
A campus newspaper marketresearch study identified the day ofthe week that had the greatest read-ership and the section of the paperthat was most widely read. AStudent Affairs survey also showedthat the more expensive electronicmedia (TV and radio) had manydifferent markets well beyond stu-dents and the NIU campus. No oneradio station held more than a 15percent share of the student market.
Because a print media campaignwould have the broadest reach andwas the least expensive approach,it was selected as the most cost-effective method of communicatingthe following message to the studentbody: Most NIU students (55 per-cent) drink five or fewer drinkswhen they party. The same messagewas repeated creatively in both dis-play and classified newspaper adver-tisements, a newspaper column,press releases, flyers, and posters.
Whenever Health EnhancementServices staff members had theopportunity to speak in a classroom,
1 0

FIG. 5
Student Desires for Drug Education
Student Likelihood of Using Sources
Source n = 6560%
The Higher Education Center for Alcohol and Other Drug Prevention
Percenta9e of TotalResponding Likely/Very50% 100%
Talk with a friend 74.6
Newspaper articles 70.1
Talking with a trusted adult 63.0
Pamphlets 54 0
Credit course 51.3
Speaker series 45.1
Dorm program led by afaculty member 41 0
Dorm program led by atrained student 37.3
Radio program 33.8
33.4Book
Workshop 2-4 hours 24.2
Information hotline 22.9
Short course 19.7
Based on data reported by: Jensen, M. et al ' Student Desires for a University Drug Education Program"Journal of Drug Education, V.19(3) 231-244, 1989.
FIG. 6
Using Media to Change Student Norms
Which Methods Would You Most Likely Use to Get AOD Information?
Source n = 3630% 5 %
Likely100%
Attend a lecture/speakeron AOD
26
Attend a workshop(discussion/game) on AOD
14
Attend a health fair or exhibitrelated to AOD 24
Enroll in an academic classrelated to AOD 22
Read an article or column inthe Daily Illini regarding AOD 80
Talk to a health professional(counselor, educator, nurse, etc.)about AOD
20
Talk to a UlUC faculty or staffmember about AOD
6
Talk to a peer-educator who hasbeen trained to help people findout information about AOD
22
Based on data reported by: Stafford, B. Unpublished Survey Data, University of Illinois 1991
11
residence hall, or sorority house,regardless of the program content,they conveyed the correct drinkingnorm message.
Student Incentives toPay Attention
During the first year of the NIUcampaign, it became apparent thatperceptions would not changeunless students read and remem-bered the moderation message con-tained in the various media. To gainattention to campaign messages, theproject started rewarding studentswho got and spread those messages.
Two student workers were hiredto be the Money Brothers. Theydressed in trench coats and wore"shades" and fedoras like the JohnBelushi and Dan Akroyd charactersin The Blues Brothers movie.
The Money Brothers approachedgroups of students M the cafeteriasand with a flourish asked "Whoknows how many drinks most NIUstudents drink when they party?"The first student with the correctanswer was handed a dollar and therest were given flyers with the mes-sage "Most NIU students drink fiveor fewer drinks when they party!" Ifno one knew the correct answer,they all got a flyer and were toldwhat they could have received hadthey known the answer. The MoneyBrothers performed their act for twoweeks during the fall semester and
9

two weeks during the spring semes-ter. The cost was $100 in prizemoney and student wages for eachsemester, which was less than thecost of two large display advertise-ments in the campus paper.
To gain the attention of NIU's7,000 residential students, HealthEnhancement Services asked theHousing Office to include campaignmaterial in its Get AcquaintedPacket. Distributed during the firstweek of classes, the packet con-tained flyers, brochures, and infor-mation on a variety of campusevents, services, and policies, as wellas special offers from a variety ofNIU departments and others.
While this seemed like an idealvehicle to reach students withprinted information about positivedrinking norms, two major problemswere considered: getting students tonotice this information among allthe others in the packet and gettingstudents to keep and read the infor-mation beyond the first week ofschool.
To get noticed, the project devel-oped a poster containing the posi-tive alcohol norms among otherhealth information about safer sex,dating safety, and nutrition. It wasthe only poster in the packet andwas eye-catching, with colorfulgraphics, photos of students, usefulphone numbers, and other interest-ing information.
To get posters up on walls andkeep them there for a while, stu-dents were offered an incentiveprinted on the bottom of eachposter: "We will pay you $5 if this
poster is on your wall when ourstudent rep knocks on your door.Offer valid during 93'-94' school
year."Student office workers were used
to find students with a campaignposter on their wall. Winners werehanded a letter of congratulationsthat instructed them to present theirletter at Health EnhancementServices during office hours to col-lect $5. When they showed up, theyhad their picture taken and weregiven their money. The picture wasthen mounted and posted in thelobby of winning students' resi-dence halls.
There were 40 winners, at leastone from every residence hall oncampus; $200 was awarded in all;and posting of the Survey SaysPoster increased. The percentage ofstudents with a campaign poster ontheir wall was determined by stu-dent workers who asked every fifthperson in the residence lobby if heor she had it posted. Three weeksafter initial distribution, 24 percenthad posted Survey Says. Followingthe $5 awards and follow-up photosof the campaign, the rate was 35
percent.
12

FIG. 7
Comparison of Vaditional Intervention
and Media Intervention and impact on
Perceived and Actual Binge Drinking
80%
70
60
50
40
30
20
n = 644
1988Baseline
n = 779
1989Traditional
n = 716
1990
69.7 69.3(
( )NIU StudentsPerceived Binge*
57.0
44.8
43.037.6
4=0NIU StudentsActual Binge *
'ffingedefindmdrinkingnmethan5
OnksMm"partying"
1 1
The Higher Education Center for Alcohol and Other Drug Prevention
Campaign Impact
At the end of the 1990 academicyear, after conducting the mediacampaign, the Health EnhancementServices survey (n 716) found an18 percent reduction in perceivedbinge drinking and a 16 percentreduction in actual binge drinking.In addition, survey respondentsreported a 5 percent reduction inalcohol-related injuries to self and a33 percent reduction in alcohol-related injuries to others. Three-yeartrend data are shown in Figure 7.
When the FIPSE grant ended in1990, NIU provided funds for theproject through an addition to theannual budget of the UniversityHealth Service in 1991. As a result,
FIG. 8
Effects of a Social influence Media Intervention on Student Binge Drinking Behavior
6E=NIU StudenPerceWeclBinge*
NIU StudenActualffinge*
0 CIO
All CollegesActual Binge **
1988 1989 1990 1991 1992 1993 1994 1995n=W n=779 n=716 n=792 n=814 n=853 n=1052 n=.990
Baseline Traditional Media Intervention to Chan e Social Norms
6 9 . 7 6 9 . 3t sc
7.0 60.'
51 .3 51. A40.2
34.6
54.4
40.0ts43.2 4 4 . 8
fin 1 IN41 at
37.6
42.8ovum , A8841 i .4.
43.0 41.7
36--;--7 34..27.
Binge defined as dri king more than 5 drinks when " partlfingBinge defined as drinking 5 or more drinks at a sining within the last 2 weeks.
,13
80%
70
60
50
40
30
20
the media campaign to change bingedrinking norms has been repeated atNIU every year since its inception.
In a 1995 survey (n = 990), the
perception of binge drinking was 43percent and the actual binge rate was28 percent, a reduction in binge drink-ing of more than one-third (35 percent)within six years. During this sameperiod, the national college bingedrinking rate remained essentiallyunchanged, with the most recent bingedrinking rates virtually the same asthe rates in 1989. In addition, duringthe same period, reported alcohol-related injuries to self declined by 31percent and alcohol-related injuries toothers fell by nearly 54 percent at NIU.Six-year trends are shown in Figure 8.
How to Replicatethe NW Social InfluenceCampaign
The NIU Social Influence Campaign isan example of a social marketing inter-vention. It focuses on changing stu-dent perceptions of campus drinkingnorms with messages that highlightpositive and moderate drinkingnorms, while ignoring nonnormativeand negative data. This is a key ele-ment of the concept.
It takes five steps to successfullyimplement this approach:
1. Collect baseline data.
2. Develop a message that high-lights nonbinge norms.

3. Ensure credibility of themessage source.
4. Deliver the message to thetarget population.
5. Support message retentionwithin the population.
Each is described below. Failure toinclude any one of these steps mayundermine the effectiveness of theentire effort.
Collecting Baseline Data
The NIU campaign is both theoryand information-based, using cur-rent data on drinking practices ofcollege students for message con-tent. Many sources of data exist,including local and national studies.Local data specific to the targetschool are of greater interest to stu-dents. Many schools already gatherlocal data with the CORE Survey(Presley et al., 1995), included inAppendix A. Other schools havedeveloped their own survey meth-ods or use an instrument fromanother school. For more informa-tion about developing and conduct-ing needs assessment and otherinformation about the AOD usebehaviors of college students, seeAssessing Alcohol-Related Problems on
Campus, a publication available
through the Higher EducationCenter for Alcohol and Other DrugPrevention (see Preface).
When local data are not available,schools often use one of the well-respected national studies. NIDA'sMonitoring the Future Survey
(Johnston et al., 1992), the national
CORE survey (Presley et al., 1995), orthe Harvard School of Public Healthstudy (Wechsler et al, 1994) are threesources for information on drinkingpractices of U.S. college students basedon national surveys.
When alcohol research and assess-ment data are presented, the media fre-quently spin stories in a negative light,making undesirable behavior seemmore prominent than it actually is andreinforcing misperceptions that sup-port binge drinking. For example, theWall Street Journal, December 7, 1994,
ran the following headline and leadsentence in response to the pressrelease distributed by the HarvardSchool of Public Health announcingthe results of Wechsler's research
(1994):
"Binge" Drinking at Nation's
Colleges Is Widespread, a Harvard
Study Finds
BOSTONAlmost half of allstudents surveyed at 140 U.S.colleges admitted to "binge"drinking, leading to everythingfrom fights to vandalismaccording to . . .
Instead, the study could have resultedin this headline and story lead:
Majority of College Students
Drink Moderately or Not at All,
a Harvard Study Finds
BOSTONMore than half ofall students surveyed at 140U.S. colleges reported moder-ate drinking as the campusnorm, resulting in relatively
1 4

SOC IAL : AThe Higher Education Center for Alcohol and Other Drug Prevention
small numbers (only 9 per-cent) who get hurt or van-dalize, according to . . .
This alternative approach supportssafer drinking norms and encour-ages readers to accurately perceivecampus drinking norms. Whetherdata are collected on campus or aredrawn from a credible nationalstudy, data showing that most stu-dents drink in moderation and donot harm themselves or others as aresult of that drinking may have apositive impact on drinking norms.
Developing a Message
The four rules of message develop-ment for this model are as follows:
Keep it simple.Tell the truth.Be consistent.
Highlight the norm ofmoderation.
A simple message was used at NIUin 1990: Most NIU students (55 per-cent) drink five or fewer drinkswhen they party. That message wasbased on data gathered from theHealth Enhancement Servicesannual survey of student healthbehaviors. Based on the cumulative1995 CORE Survey data for all col-lege students, the message wouldread, "Most college students (61 per-cent) drink fewer than five drinkswhen they party."
The NIU phrase met the messagedevelopment criteria. It was simple;
115
it reported the actual data truthfully;it was consistently used in all of thevarious media and program efforts;and it supports the campus norm ofmoderation. The following is anexample of how CORE Survey datacould be framed to support saferdrinking norms:
U.S. Department of Education
Study Finds Moderation Is the
Norm on Campus.
Researchers report almosttwo-thirds (61 percent) ofAmerica's college studentsdrink moderately or not atall. The CORE Institute onAlcohol and Other DrugStudies at Southern IllinoisUniversity reports in its1995 survey that seriousconsequences of alcohol useamong college students areuncommon:
98 percent are not arrested forDUI/DWI.92 percent do not vandalize.88 percent do not get intotrouble with authorities.85 percent do not get hurt orinjured.
Most students are con-cerned about risks associ-ated with alcohol andprotect themselves bydrinking moderately oravoiding alcohol altogether.
The term most was chosen in the pre-vious examples because it means

normative, thus reinforcing a changein perception of student drinkingnorms. It is also easier to rememberthan a specific percentage. The mes-sage was worded in the affirmative,a positive statement of a specificachievable behavior (five or fewerdrinks), rather than telling studentswhat not to do in a message such as"Don't drink too much!"
Some colleges and universitiesmay find that binge drinking is thecampus norm. Such campuses coulduse national survey data on rates ofnonbinge drinking-61 percent(CORE), 56 percent (Wechsler), and60 percent (NIDA)to communicatenorm messages about "typical" col-lege students. Another alternativewould be to use a different cutoffpoint for the norm message: "Moststudents drink fewer than sevendrinks [or eight drinks or ten drinks]when they party." Regardless ofwhere you begin, correcting the mis-perception of the drinking norm asin the NIU campaign suggests thatthe number of heavy drinkers can bereduced.
Communicating accurate drinkingrates is a means of emphasizingthe norm of moderation. But it'snot necessary, and may even becounterproductive, for the messageto restate the student misperceptionof the campus norm. In fact, restat-ing the misperception may reinforceit. Attempts to explain backgroundtheory within the mass media mes-sage only make the information
more complex and difficult toremember.
Some individuals in the univer-sity community may respond to themessage content without under-standing the social norms concept.Administrators and admission offi-cers, for example, may be delightedto see high-profile media attentionthat features moderation and doesnot exaggerate the prevalence ofserious alcohol-related harm. Theymay even assume mistakenly thatalcohol is not a problem on theircampus. By contrast, others in thecommunity may express concernabout messages that appear to playdown the problem of binge drink-ing, on the theory that positivesocial norm messages amount toinstitutional denial. It is importantto acknowledge that any incidentsof binge drinking and any seriousharm associated with drinkingare important problems that mustbe addressed proactively andeffectively.
Ensuring Credibility
Because college students tend tomisperceive the drinking norm,they may be skeptical of informa-tion that challenges their drinkingbeliefs. To change this mispercep-tion, the sources of informationmust be credible. Research con-ducted at NIU regarding the believ-ability of AOD and other healthinformation indicates that students

AL 9Believability of Sources of Health InformationA survey conducted at NIU (n = 990) in 1994 asked students to ratebelievability of sources of health information on a 1-5 scale.
Source Percent Marking "1" or "Very Believable"0% 5 % 100%
Doctor at health center 46.4%
Health educator at
health center44.0%
Parents 40.8%
Health center nurse 39.4%
Leaflets, pamphlets, flyers 38.3%
Alcohol and sex "ads" in theNorthern Star by HealthEnhancement Services
23.4%
A romanticpPartner 17.5%
Other health "ads",inother newspapers 16.8%
Campus newspaper article 15.7%
Campus peer facilitation
programs2.9%
N111 faculty 9.1%
Friends 8.1%
Resident assistant 7.1%
HaMes, M. P., Unpublished Survey Results, Northern Illinois University, 1994
The Higher Education Center for Alcohol and Other Drug Prevention
rate print material morebelievable than othermedia and health pro-fessionals more believ-able than peereducators, friends, orother interpersonalsources. Figure 9 showsthe results of a surveyon believability ofsources of health infor-mation conducted atNIU in 1994.
It is important toknow how studentsperceive the agency orgroup that is sponsor-ing or conducting thecampaign. Somegroups or offices mayhave low general credi-bility, some may beseen as the enemy,some may be simply
ignored as "nerds" or "geeks," and stillothers may be seen as having hidden orunstated agendas. The informationcredibility survey strongly suggestsusing doctors or health educators assources.
Focus groups and student surveysconducted during the NIU effort madethe following points regarding messagecredibility:
Indicate the source of thedata being used to changeperception. Students may thinkthat ". . . [authorities] just madeup statistics to get students tostop drinking."
17
The more scientific the sourcecitation, the more believable itmay be. For example, informa-tion in an NIU campaign ad wasreferenced as follows: "Basedon random surveys of NIUstudents (n = 1052) conductedduring the 1994-1995 academicyear under the auspices of theU.S. Department of Education(grant # 1234) . . ."
Silly, satirical, cute, or juvenileformats work against the sci-entific integrity of the message.Smiley faces and cartoon char-acters detract from the credibil-ity of these messages.Local data are more crediblethan national data. When datafrom other institutions are pre-sented, it is easy to deny theirvalidity as nonrepresentative("Oh, that's because they'refrom a big impersonal school"or "Of course they drink less.That's a small religious school;they're not like us.").Photographs of students ("peo-ple who look like us; not tooold, not too young; not profes-sional models; not too sick ortoo slick") attract more attentionthan any other design element.Photos of actual students alsosupport the normative emphasisof the message. The NIU pro-gram used photos of MU stu-dents in the advertisements,posters, and flyers.

T FDo the right thing if We'drink
Most Greek Most' Greeka men drink 6 or women drink 4r fewer drinks if or fewer drinks ifI they "party." they "party."
Most
Greeks
drink
responsibly
ifthey
drink.
Win #5! for wearing a button and knowing what it means.
.Pal Hnlo of Me, itut of Wm.. Wag toln, Ma of flm.....411.3.
pri 16
Delivering the Message
Because students appear to ratehigher the believability of printmedia and because print media arerelatively inexpensive, they shouldbe the first choice for delivering themessage. Print media include flyersand leaflets, posters, newspaperadvertisements (both display andclassified), editorials, letters to theeditor, articles, billboards, bulletinboards, comics, and sidewalk chalkart. However, comics and sidewalkchalk art may lack credibility andshould be used only if done welland pretested for credibility.
Interpersonal methods that rely onface-to-face contact and oral commu-nication include residence hall pro-grams, programs at Greek housesand other student organizations,guest lectures in academic classes,town meetings, and skits. Becausethese activities rely on personnel,they may be too costly in terms oftime and money to be the mainstayof a mass perception change effort.
A common lament heard aboutsuch programs is how hard it is toget the people who really need tohear the message to come to hear thespeaker. Interpersonal programs canend up "preaching to the choir"unless attendance is mandatory orthe program is part of a curriculuminfusion effort.
When college AOD programs findit useful to offer at least some inter-personal presentations, these activi-
ties should also be viewed as oppor-tunities to disseminate and enhancethe credibility of the printed mediaon normative behavior. Interpersonalmethods are good opportunities topretest printmedia by asking students to critiqueprototypes of flyers, posters, andadvertisements.
It is essential that the messageactually reach the targeted popula-tion. For example, surveys at NIUhave found that students with thegreatest interest in attending an alco-hol education program are thosewho drink the least. In contrast, stu-dents who drink the most are mostlikely to read NIU alcohol informa-tion, ads, and flyers (Haines, 1993).
One quick way to ascertain whetherthe medium being used is reachingthe target group is to conduct ran-dom surveys of 20 to 50 students ina high-traffic area on campus.
Supporting MessageRetention
To change perceptions, studentshave to remember and internalizethe message. Among the factors thatinfluence retention of a message aretwo that have already been dis-cussed: simple content and sourcecredibility. A third important factoris frequency of exposure to the mes-sage. The same simple message hasto be heard over and over again forit to stick. The people who sell beercertainly know that. To keep it fresh,

SOCIAL : AThe Higher Education Center for Alcohol and Other Drug Prevention
the message should be communi-cated in many different forms,such as posters, flyers, buttons,display advertisements, and classi-fied ads. Multiple exposuresrequire a commitment of time andmoney. At NIU during the fallsemester, the campaign had threemedia exposures per weekforexample, flyers distributed onTuesday at the student union, adisplay ad in Wednesday's paper,and a classified ad on Thursday.
Based on NTU's experience, amedia campaign should startimmediately at the beginning offall semester and maintain highvisibility until spring break. Thenumber of media exposures canthen taper off after spring break.Messages delivered during the lastsix weeks of school may not haveenough time to be translated into
behavior and are probably not car-ried off-campus through the sum-mer. Starting too late with too littlealmost always guarantees failure.
Another technique the advertis-ing industry uses to get messagesto stick is to reward people whoremember it: "The third caller whosays 'WXYZ listeners have morefun!' gets two free tickets totonight's concert" or "If you knowwhich beer is 'beechwood-aged'when our bartender asks, you get afree pitcher." The NIU campaignmodel uses monetary incentivesthrough the Money Brothers andthe Get Acquainted Poster toincrease the number of studentswho remember the message or par-ticipate in its delivery.
College Students & DUIDrinking and driving is one of the most risky behaviors for peopletoday College students are not immune from this risk, although moststudents take precautions to protect themselves
ci
Llo.n.tv*
I II
One of dr goals of dr Health Service Ls to reduce alcohol(elated mjunes. Evayone m campus can help prevent DUL
s/ Take the person's keys,offer them a ride home
61 Disable car by pulling coil wire ordisabling battery
t/ Enlist the help of others to preventthe person from drivmg
61 Call the police before the persongets in the car
1 Harvard School of Moho Meth (1995)P1.17.592 shade= 140 corlaga,2 US Departracal °Macchio:, (1989-91) CORE chewy 5.513713 Unhvraly Uoith Scrvice (199S) Sunvy In random clams 5.990

18
Targeting the Model toSpecial Populations
NIU is a large, residential, public,coeducational university with a totalenrollment of more than 23,000 stu-dents. It's typical of many state uni-versities. The media campaign toreduce binge drinking through socialmarketing strategies was applied tothe entire campus population.However, it could, with minor modi-fications, focus on specific groupswithin the student body.
The most effective way to changebinge drinking behavior among asubculture that knows it is differentand likes the difference is to get"inside" the culture and feed backthe actual drinking norm of thesubculture. Getting to know a sub-culture requires specific surveys,meetings, interviews, or focusgroups conducted with members ofthe distinctive target population.Hiring students from special popula-tions to work as part of the projectmay be an effective way to get toknow the culture, build rapport, andensure credibility.
Fraternity and SororityMembersStudents who are members of Greeksocial organizations, particularlythose who live in fraternity andsorority houses, report significantlyhigher rates of binge drinking thanother students (Presley et al., 1995;Wechsler et al., 1994). Under the NIU
,20
project, significant reductions inbinge drinking were found amongmale and female Greek members,although the reductions were smallerthan reductions for the student bodyas a whole.
The reductions might have beeneven greater had a campaigndirected specifically at Greek stu-dents been implemented simultane-ously with the institution-wideeffort. Greeks at NIU accurately per-ceive themselves as drinking morethan most students. As would bepredicted by the Perkins andBerkowitz research, Greek membersexaggerate the extent of binge drink-ing within the Greek subculture.Consequently, one might expect thatstrategies focused on Greek organi-zations would be as successful, if notmore so, in reducing binge drinkingand related harm within the Greekcommunity.
A social influence campaign toreduce binge drinking among Greekmembers would require followingthe five steps discussed in the repli-cation section, with two importantchanges: (1) The initiative wouldbe limited to Greek students, and(2) the "norm of moderation" maybe considerably higher than thenorm for the whole campus. Themessage for Greeks may be, "MostNIU Greeks drink six or fewerdrinks when they party." This higherGreek norm is still lower than theGreek drinking norm perceived byGreek students (Haines, 1993). The
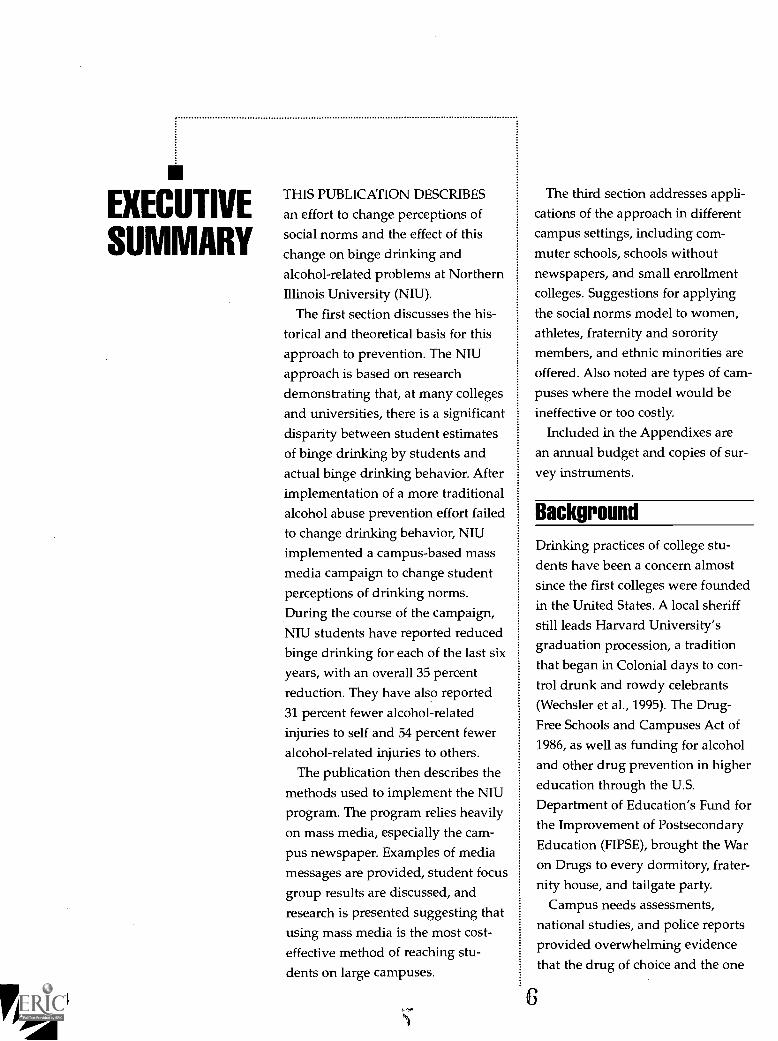
How Do You Compareto a Typical NIU Student?
you may have heard something
Of the "exceSses" of college
Students. The unusual and5
atypical always make the news.
It'S time yen heard some of the
good news!,
. .
The University Health Service
monitors behaviors which affect
etuderd bealth. Each year,
Health Enhancement Services
surveys NIU students (51=990),
patient visits are analyzed
(N=3100), and national data
(Ns;l30,0) is:considemd. The
results sbow most college
Students are very healthy
'People.
z.
4
Exercise is PopularSeven out of ten NIU students(70%) emocise an average of 2
or mom hours in a week.
Heavy DrinkingDecreases
Most NIU students (72%) drink 5or fewer drinks when they party.
Injuries UncommonMom than 90% of all students did
not have an accident or injurywhich interfered with their ability
to attend or perform In school.
Condom Use Increases
Over half of all N1U students (53%always/mostly) use condoms for
protection during intercourse.
Multiple PartnersUncommon
72% of students did not have morethan one sex partner in the last year.
Fewer STDsPositive chiamydia and gonorrheatests have decreased by 50% over
the past 3 years.
The Higher Education Center for Alcohol and Other Drug Prevention
impact of such an approach, how-ever, has not yet been evaluated.
Ethnic and Racial MinoritiesNational surveys have consistentlyreported that white students havethe highest prevalence of bingedrinking, followed closely byHispanic students, while AfricanAmericans and Asians have rela-tively low binge drinking rates(Johnston et al., 1992; Presley et al.,
1995; Wechsler et al., 1994).
Analysis of the NIU data showedthat Hispanic students had reduc-tions in binge drinking rates, plusalcohol-related harm to self andothers, similar to the reductionsobserved in the total student popula-tion. Whether more significantreductions in binge drinking wouldbe possible with a campaign tar-geted specifically at Hispanic stu-dents is unknown. Sample size forother ethnic minorities were toosmall for analysis.
Student AthletesWechsler's research has found thatbinge drinking rates among intercol-legiate athletes are slightly higherthan the rates among other students.Data from NIU indicate that exerciseand athletic behavior are positivelycorrelated with binge drinking rates.Survey results show that the moreoften students exercise in a givenweek, the more likely they are to beheavy drinkers. These findings sug-gest that binge drinking prevention
efforts targeted at student athletesmight be beneficial when there areenough athletes on a specific campusto warrant expenditure of resources.
Cooperation of the athletic depart-ment is essential to any effort target-ing student athletes. It would beimportant to show these students thatthe norm for successful college ath-letes is not heavy alcohol use, if thesurvey data show that to be the case.
WomenNIU efforts to reduce binge drinkingwere more effective for female thanmale students. In the NIU pretests,females reported higher levels ofmisperception regarding campusbinge drinking. Following the socialinfluence media campaign, bothmales and females showed reduc-tions in binge drinking. However,females had a more significant reduc-tion in perceived and actual bingedrinking than males did.
Because the NIU approach showseven greater effectiveness withfemale students than with males, itprovides schools with a promisingapproach for reducing alcohol-relatedharm among college women. Thismay be especially important ifwomen have been underserved by aschool's alcohol abuse preventionservices.

.11111.1104ey Mingara04.0Here are the facts about drinking at NIU:
Nearly all NIU students (97%) agree that an occasional'drunk which Interferes with academics or otherresponsibilities is not okay.
Most NIU students did not cause physical harm to self (80%)or others (91%) as a result of their drinking.
Most N1U students (72%) drink 5 or fewer drinks' whenthey 'party.'
'A DRINK refera twa bottle of beer, a shot of liquor, a glass of wine, a wine cooler, or a mixed drink.
eased on survey data collected by University HealthSeMce (1988-19951 from 6.640 students In randomlyselected classes. Funded by the U.S. Office ofEducation.
Limitations of the SocialInfluence Methodologyand Applications inDifferent Settings
In certain situations, the social influ-ence methods may be ineffective orhave minimal impact. It may be inef-fective if the goal of an interventionis to support nonnormative behavior.For example, an AOD office at cam-
pus X wants to increase the numberof students who report no alcoholuse. Data show that most studentsperceive only 2 percent abstainerswhen there are 20 percent abstainers.A message to change this percep-tionsuch as "One Fifth of AllStudents at Campus X Abstain!"may be counterproductive andunintentionally reinforce the actualdrinking norm. Focus groups con-ducted at NIU showed students readsuch messages as "Most Students(four of five) at Campus X DrinkAlcohol." In this case, abstaining isnot normative behavior.
22
The approach may have a "floor,"a binge drinking level below whichthere will be little further impact. Itis difficult to assume that a socialnorms model could eliminate bingedrinking altogether. There willalways be some segments of thepopulation who are immune tosocial influence, such as alcoholics orantisocial people. Once this floor isreached, further reductions in bingedrinking may be cost prohibitive orsimply impossible, using the socialinfluence methods described in thisdocument.
Additionally, if the needs assess-ment indicates that a campus hasvery few binge drinkers and/orthose students do not misperceivethe campus norm, then anothermethod must be employed or per-haps another health issue should bethe target of prevention resources.
Convincing an alcoholic that thecampus norm is moderation mayhelp overcome denial and help otherstudents to recognize alcoholism andintervene in behalf of alcoholic stu-dents, but it will never reduce theincidence of alcoholism by itself.
Commuter SchoolsCommunity colleges and schoolswith large populations of commutingstudents are a special problem forAOD prevention efforts that rely oninterpersonal methods. One morecost-effective interpersonal strategyfor commuter schools to changesocial norms may be curriculum
SOCIAL iaThe Higher Education Center for Alcohol and Other Drug Prevention
infusion, incorporating informationto correct misperceptions of collegedrinking norms directly into classcontent throughout the curriculum.
Because the NIU social influenceapproach is media-based and doesnot rely on interpersonal methods,it can be successfully applied oncommuter campuses. Much of theprint media material is portable,meaning that the students can takeit with them wherever they go.They have private access to themessage and they can read it ontheir own time and can keep it forfuture reference. Students do notneed to change their daily routinein order to receive the information.For example, flyers placed on thewindshields of cars in student park-ing lots can reach those who driveto campus.
At certainnonresidentialcampuses, thesocial influenceeffort may not bevery effective. At
some of these cam-puses, the studentbody is signifi-cantly older (meanage = 26) and mar-ried. These stu-dents may nothave the alcoholuse patterns thatare more prevalent
among traditional students, or theymay have responsibilities andobligations that reduce the oppor-tunity for or interest in binge drink-ing. There may be little need for anNIU-type binge drinking preven-tion project.
Another factor at commuterschools is a highly diverse studentbody with primary social affilia-tions occurring off-campus inhometown communities or neigh-borhoods. Where this off-campusaffiliation is very strong, studentsare probably too heavily influencedby the social norm of their owncommunity or neighborhood tobe affected significantly by acampus-based social influenceinitiative.
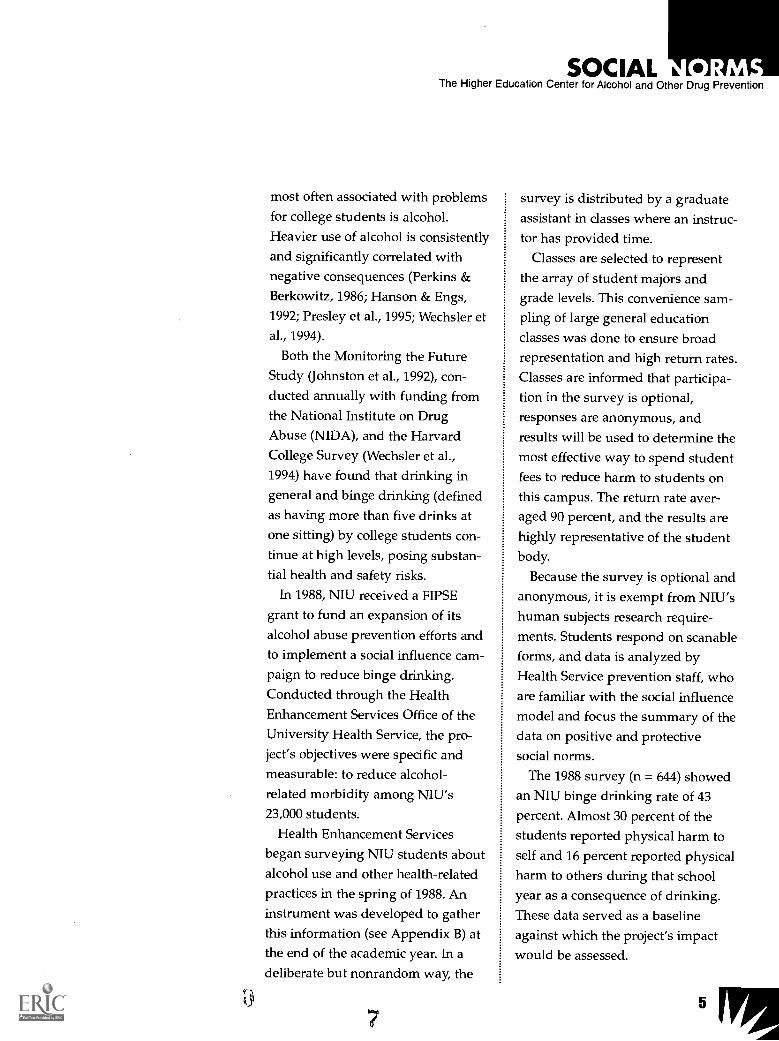
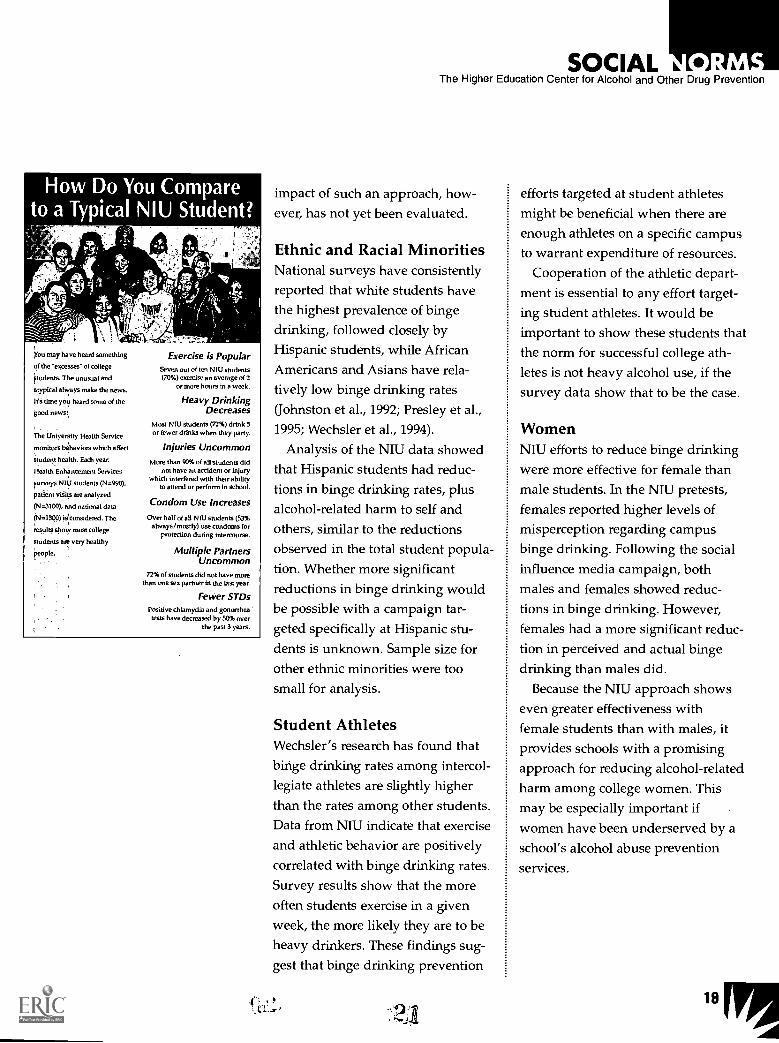
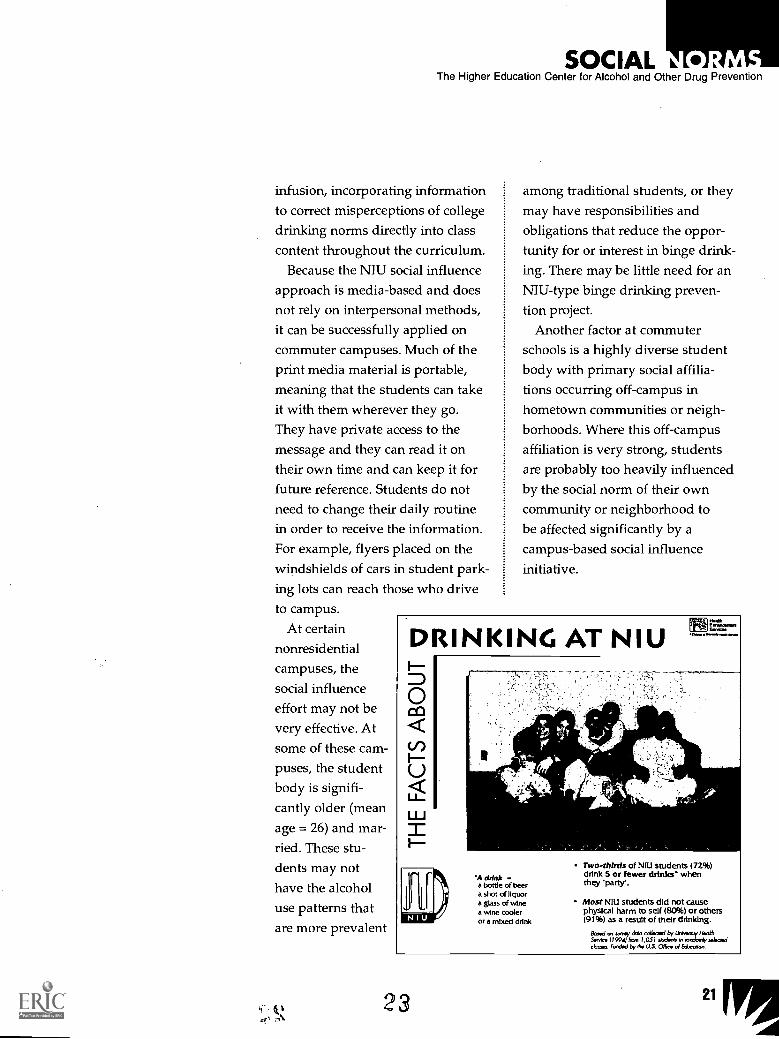
DRINKING AT NIUcl
11.,.sesraieCililomllisiim it.**
'A drink -a bottle of beera shot of liquora glass of winea wine cooleror a mixed chink
Two-thIrds of NIU students (72%)drink 5 or fewer drinks* whenthey *part3e.
Most NW students dld not causephysical harm to self (80%) or others(91%) as a result of their drinking.
Bind en wow dab colloceid by Unisex* Ha:ebb.S.4. (I MO) horn 1,05 I Wan* ill dan400ndciao. Funied by the U.S. Office of Educcoon,
23
Schools Without NewspapersAs noted earlier, students often seethe campus newspaper as an objec-tive and credible source of studentinformation. This is particularly trueof newspaper articles. When socialnorms information about studentdrinking behavior is presented in anewspaper article, it is more likely tobe read than when it is presented bya peer educator, faculty member, orresident assistant.
Some schools do not have a cam-pus paper or the paper is publishedinfrequently. In the latter case, thenewspaper can still be used as avehicle to deliver social norm infor-mation, but not the primary method.In both cases, the production anddelivery of more nonnewspapermedia become paramount. Forexample, every piece of mail that thecollege sends to students is a poten-tial venue for the social norm mes-sage.
It might be worth underwritingthe publication of a new campusnewspaper as a joint undertaking ofthe office conducting the socialnorms intervention and some othergroups that have credibility with thetarget population. At NIU, for exam-ple, University Health Servicerecently underwrote some of thecosts for publishing Lifeline, the
newspaper of the Black StudentUnion. As a result of this support,the paper published numerous arti-cles containing health information.ri 22 24
An ongoing collaborative relation-ship has been established betweenthe two groups.
Religiously Affiliated SchoolsColleges and universities with strongreligious affiliations may requireadaptations of the NIU approach.Some are no different from other col-leges in terms of the prevalence ofbinge drinking. In these cases, theNIU model can be applied as itwould in any other setting.
However, some religiously affili-
ated colleges have very low reportedrates of binge drinking when com-pared with national averages. Therealso may be greater social pressure toabstain and more stigma attached todrinking at these schools. In such set-tings, students who binge may quiteaccurately perceive themselves to bedrinking at rates in excess of thecampus norm, much like Greek stu-dents who perceived that their bingedrinking rate was higher than that ofmost other students. They may alsovalue this difference.
A binge drinking group at a reli-giously affiliated college may be dif-ficult to assess because of the socialcosts associated with self-disclosureof binge drinking. Students affiliatedwith groups who hold nonnormativesocial views, attitudes, or beliefs,may be more immune to social influ-ence methodologies. Students whobelong to political or religious fringegroups, student groups that are

MOSTNILS students (72%) drink 5or fewer drinks* when they"party."
MOSTNIU students did not causephysical harm to self (80%)or others (91%) as aconsequence of drinking.
NEARLY ALLNIU students (97%)disapprove of drunkennesswhich interferes withresponsibilities.
DRINK - a bottle of beer,a glass of wine,a wine cooler,a shot of liquoror a mixed drink.
Seised on inivey date colleaed by University Health Service(1995) from 990 students in rendoiniy selected clews.Funded by the U.S. Office of Ecliseet1on.
SOCIAL h :. _ 1AThe Higher Education Center for Alcohol and Other Drug Prevention
proud to be atypi-cal, gangs, andstudent groupswhose identity islinked to heavydrinking (such asathletic clubs,social clubs, andeven journalismclubs that maysee heavy drink-ing as part of thegroup mystique)may require amore intensive,personal, andexpensive inter-vention than a
media-based social influence strat-egy can provide.
Schools with Very SmallEnrollmentSchools with small enrollment(under 2,000) may find that interper-sonal methods are as cost-effectiveas media methods. The small size ofthe target population neutralizessome of the economies of scale asso-ciated with media-based efforts.Even so, if interpersonal methodsare employed as the primarymethod of delivering the informa-tion, media should still be used tosupport the message. The need forfrequent exposure to repeated yetcredible messages about positivecampus drinking norms remainsthe critical factor for a successfuloutcome.
2 5
Conclusion
The NIU campaign provides apromising approach to reducingbinge drinking and associated prob-lems at colleges and universities.As this approach is tested at othercolleges and universities, more infor-mation will be forthcoming, describ-ing ways to adapt this approach todifferent campus environments andwith different population groups. Inaddition, colleges and universitieswill learn more about the influencesof social norms on student alcoholuse and the impact of shifting thosenorms on changing behaviors andpreventing problems.
23 Ira
References
Berkowitz, A.D. "Following ImaginaryPeers: How Norm MisperceptionsInfluence Student Substance Abuse."Project Direction Module No.2. Ed. G.
Lindsay and G. Rulf. Ball StateUniversity, Muncie, IN. 1991.
Graham J.W.; Marks, G.; Hansen. W.B.
"Social Influence Processes AffectingAdolescent Substance Use" Journal ofApplied Psychology, 76(2), 1991.
Haines, M.P. Unpublished survey data.Northern Illinois University, De Kalb,
IL. 1993.
Haines, M.R; Haves!, A.S. "Mis-measur-ing College Drinkers: Gender Bias asa Result of Binge-Drinking Criteria."Paper presented at the U.S.Department of Education's 1994National Meeting on Alcohol andOther Drug Prevention in HigherEducation, Washington, DC,September 29October 2, 1994.
Hansen, W.B.; Graham, J.W. "PreventingAlcohol, Marijuana, and CigaretteUse Among Adolescents: PeerPressure Resistance Training VersusEstablishing Conservative Norms."Preventive Medicine 20 (1991).
Hanson, DJ; Engs, R.C. "College
Studentsf Drinking Problems: ANational Study, 1982-1991."Psychological Reports 71 (1992): 39-42.
ri 24
Jensen, M., et al. "Student Desires for aUniversity Drug EducationProgram." Journal of Drug Education
19 (1989): 231-244.
Johnston, LD,; O'Malley, P.M.; Bachman, J.G..
Drug Use Among American High
School Seniors, College Students, and
Young Adults, 1975-1991, Volume 2.
Washington, DC: GovernmentPrinting Office. US Dept of Healthand Human Services publication.1992.
McAlister, A.L "Population BehaviorChange: A Theory-Based Approach."Journal of Public Health Policy.
Autunm (1991): 345-361.
Office of Institutional Research. Student
Profile. DeKalb, IL: Northern Illinois
University; 1994.
Perkins, H.W.; Berkowitz, A.D. "Perceivingthe Community Norms of AlcoholUse Among Students: SomeResearch Implications for CampusAlcohol Education Programming."International Journal of the Addictions
21 (1986): 961-976.
Perkins, H.W. "ConfrontingMisperceptions of Peer Drug UseNorms Among College Students: AnAlternative Approach for Alcoholand Drug Education Programs." PeerPrevention Program Implementation
Manual. Fort Worth, TX: Higher
Education Leaders/Peers Network,Texas Christian University, 1991.
26
Perkins, H.W. "Scope of the Problem:Misperceptions of Alcohol andDrugs." Catalyst V1(3) 1996.
Prentice, D.A.; Miller, DJ. "Pluralistic
Ignorance and Alcohol Use onCampus: Some Consequences ofMisperceiving the Social Norm."Journal of Personality and Social
Psychology 64 (1993).
Presley, C.A.; Meilman, P.W.; 1,yerla, R.
Alcohol and Drugs on American College
Campuses: Use, Consequence, and
Perceptions of the Campus Environment,
Volume II: 1989-1991. Carbondale, IL:
The Core Institute, 1995.
Stafford, B. Unpublished survey data.Urbana, IL: University of Illinois,
1991.
Wechsler, H.; Davenport, A.; Dowdall, G.;
Moeykens, B.; Castillo, S. "Health andBehavioral Consequences of Binge
Drinking in College." Journal of the
American Medical Association 272
(1994): 1672-1677.
Wechsler, H.; Dowdall, G.; Davenport, A.;
Rimm, E. "A Gender- Specific Measureof Binge Drinking Among CollegeStudents." American Journal of Public
Health 85 (1995): 982-985.
Wechsler, H.; Deutsch, C.; Dowdall, G. "Too
Many Colleges Are Still in DenialAbout Alcohol Abuse." The Chronicle
of Higher Education. 14 April 1995,
p. B1-2.
APPENDIX A
Core Instrument
SOCIAL IAThe Higher Education Center for Alcohol and Other Drug Prevention
27 25 IM

Core Alcohol and Drug SurveyFor use by two- and four-year institutions
FIPSE Core Analysis Grantee Group
411161Please use a number 2 pencil.
ProCessed by: UCS/Off ice of Measurement ServicesUniversity of Minnesota2520 Broadway Drive Room 130St. Paul, MN 55113
Form 191
For additional use:
A 0 .G.C.F.YS ci; :70 o ;7.; ,*B 0(0(3)007)6()C CX90)Q)®®®®(q:(0D0000)®®V?)@)0E 000000®00®
Classification:Freshman 0Sophomore 0Junior 0Senior 0Grad/professiona I . . 0Net seeking a
degree 0Other 0
5. Gender:Male 0Female 0
2. Age: 3. Ethnic origin:American Indian/
Alaskan Native 0Hispanic 0Asian/Pacific Islander. 0White (non-Hispanic) 0Black (non-Hispanic) 0Other 0
4. Marital status:SingleMarriedSeparatedDivorcedWidowed
6. Is your current residenceas a student:On-campusOff-campus
00
7. Are you working?Yes, full-time 0Yes, part-time 0No 0
9. Approximate cumulative grade average: (choose one)0 0- 0 0 0 0 0 0 0 0 0 0 0A+ A A- 8+ 8 B- C+ C C- D+ D D- F
10. Some students have indicated that alcohol or drug use at parties they attend in andaround campus reduces their enjoyment. often leads to negative situations, andtherefore, they would rather not have alcohol and drugs available and used. Otherstudents have indicated that alcohol and drug use at parties increases theirenjoyment often leads to positive situations, and therefore, they would rather havealcohol and drugs available and used. Which of these is closest to your own view?
Have available Not have availableWith regard to drugs? 0 0With regard to alcohol? 0 0
8. Living arrangementsA. Where: (mark best answer)
House/apartment/etc...0Residence hall 0Approved housingFraternity or sororityOther
B. With whom:(mark all that apply)With roommate(s) 0AloneWith parent(s)With spouseWith childrenOther
o
0
11. Student status:Full-tiMe (12+ credits)... 0Part-time (1-11 credits).. 0
13. Place of permanentresidence:In-state 0USA, but out of state. 0Country other than USA . 0
12. Campus situation on alcohol and drugs: yes no don't knowa. Does your campus have drug and alCohol policies? 0 0 0b. If so, are they enforced? 0 0 0c. Does your campus have a drug and alcohol '
prevention program? 0 0 0d. Do you believe your campus is concerned about
the prevention of drug and alcohol use? 0 0 0e. Are you actively involved in efforts to prevent drug
and alcohol use problems on your campus? 0 014. Think back over the
last two weeks. Howmany times have youhad five or moredrinks* at a sitting?
None 0Once 0Twice 03 to 5 times 06-to 9 times 0-10 or more times 0
15. Average # ofdrinks* youconsume a week
(If less than /7110, code'ansWer as01, 02, etc.)
*A drink is a bottle of beer, a glassof wine, a wine cooler, a stetglass of liquor, or a mixed drink.
000
0
00
16. At what age did youfirst use... (mark onefor each line)
a.
b.
c.d.e.f.
9-h.
k.
ea,
Tobacco (smoke, chew, snuff) 0Alcohol (beer, wine, liquor)* 01_._Marijuana (pot, hash, hash oil) OTJCocaine (crack, rock, freebase) 0Amphetamines (diet pills, speed)0Sedatives (downers, ludes)Hallucinogens (LSD,J)CP) 0Opiates (heroin, smack, horse) OiInhalants (glue, solvents, gas) 00Designer drugs (ecstasy, MDMA)0Steroids 0Other illegal drugs ' 0
"Other than a few sips
0 00 00 00 00 00 00 00 00 00 00 00 0
pi 26 BEST , tPt AVAILABLE -r`
2 8

SOCIAL : AThe Higher Education Center for Alcohol and Other Drug Prevention
on17. Within the last year, 2
LI`0 ''4_7.;- 1. % 1.8.' During the past 30 days,
we ebout how often have .°1--13,1 %-3-9,, 0 <6,1:11;- On how many days ..0- .me yetrused ... . S 3o o 4.2 did yeti have: o tl
(Mark one foreaCh line) ce., S S 0 0 10A. (mark onh for each line) ..4. L. L0 0NM a. Tobacco (smoke, chew, snuff) .0 000000 a. Tobacco (smoke, chew,;snuff) o.c 00 *No b. Alcohol (beer, wine, liquor). ,00 000000 b. Alcohol (beer, wine, liquor) 0 00 .No c. Marijuana (pot hash, haeh-oil) 000000000 c. Mari'uana (pot, hash, hash oil) ilk 000ow d. Cocaine (crack, rock, freebise) 000000000 d. Cocaine (cracIt'rock, freebase) 0 *00'so e:--Arnphetamines (diet pills, speed) 00.000000 e. Amphetamines (diet pills, speed) 0 0000on f. Sedatives (downers,: ludes) 00000 )000 f. Sedatives (downers, ludes) 0*1.10
g. Hallucinogens (LSD; PCP) 000000 00 g. Hallucinogens (LSD, PCP) 0 00*h. Opiates (heroin, smack, horse) 000000 00 h. Opiates (heroin, smack, horse) 0* 00*i. Inhalants (glue, solvents, gas) 000000 00 i. Inhalants (olue, solvents, gas) 0, 0000,.. j.. Designer.drugs (ecstasy, MDMA)00*000 00 j. Designer drugs (ecstasy. MDMA) 00 00*k. Steroids 00.000 00 k. ,Steroids 0 *00I. Other illegal drugs 00.000 00 I. Other illegal drugs 000000
,.... di.0 +.,19. How, often do youi 1%, ,. lc % 'iothiiik the average student 't 0 ,..0° 4. a
froc?...
Iwo
en 21. Please indicate how oftenyou have experienced
aim on your campus uses-..: . op '.7,% % tib.10, the following'clue to'(mark one for each line) ci r OA IS co 0i a- your drinking or drug use N No
a. Tobacco (smoke, chew, snuff) 00000 00 during the last year... '1-.0'1 e ':-. ','b. Alcohol (beer, wine, liquor) 00000 00 (mark one for each line) 0.- cip ("0 l'a, 6:1, 6Zr
oi. c. Marijuana (pot, hash, .hash oil) 00000 00 a. Had a hangover 00 00d. Cocaine (crack, rock, freebase) 00000 00 b. Performed poorly on a test.me e. Amphetamines (diet pills, speed) 00000 00 .
dr important project 00 00 'us f. Sedatives (downers, ludes) , 00000 0 c. Been in trout)le with police,
ANN g, Hallucinogens (LSD, PCP) 00000 00 residence hall, or otherow h. Opiates (heroin, smack, horse) 00000 00 college authorities 00 *00No i. Inhalants (glue, solvents, gas) 00000 00 d. Damaged proPerty, pulled
- Ill j. Designer drugs (ecstacy. MDMA)00 00 00 fire alarm, etc. 000000imi k. Steroids 00000 t.. 00 e. Got into an argument or a fight QOY 00
I. Other illegal drugs 00000 L 00 f. Got nauseated or vomited 00%.)*00g. Driven a car while under
.c.
son
-an0le,
d al i.s- the influence 00
h. Missed a class 000 0.000so
en 20 Where have you.1, 1:
o 4` S o S.o c?.>used
^c,.61.
i. Been criticized by someoneI know 000 00I" ... % e- %. OA 0(mark all that apply) . a ,
0 Sy 9C) l V. Stp. j. Thought I might have a drinkingMB 0 .'" 4... r 0 .... ..; , , or other drug problem 00J 00No a. Tobacco (smoke, chew, snuff) 0*000* 00, k. Had .a memory loss 00 00ou b. Alcohol (beer, wine, liquor) ..,00 00 00 I. .Done something I later regretted 00 00ow c. Marluana (pot, hash, hash oil) 0010400 C 0 0 m. Been arrested for DWI/DUI 00 00ma d. Cocaine (crack; rock, freebase) 00000 C 00 n. Have been taken advantage
e. Amphetarnines (diet-Pills, speed) 000000000 of sexually 000 00f. Sedatives (downere, Aides) 0000* 00* o. Have taken advantage ofg. Hallucinogens (LSD, -PCP) 00000 *00 another sexually 00 00en h. :Opiates (heroin; smack, tiorse) -0 000* *00 p. Tried to unsuccessfully stop using oon ooi. inhalants (glue,-solvents, gas) .0,00 * 00 q. Seriously thought about suicide: 00 00j. Designer drugs (66etacy, MDMA)0 000* 00 r. Seriously tried to commit suicide 00100100
mu! k,.Steroids 0 0000 00 s. Been hurt &injured 00 00an I. Other illegal drugs QQtQQ0 0023. If you volunteer.any of your time on or off campus
22. Have any of your family had alcohol or otherow to help others, please indicate the approximatedrug problems: (mark all that apply) number of hours per month and principal activity:
00 0 Mother 0 Brothers/sisters 0 Spouse 0 Don't volunteer, or 0 10-15hours0 Father 0 Mother's parents 0 Children less thanlhour 0 16or more hours0 Stepmother 0 Father's parents 0 None 01-4hours Principal volunteer activity is:
imsill
0 Stepfather 0 Aunts/uncles 0 5-9 hours
SE4161. PF1- 54321
29 27 lr5
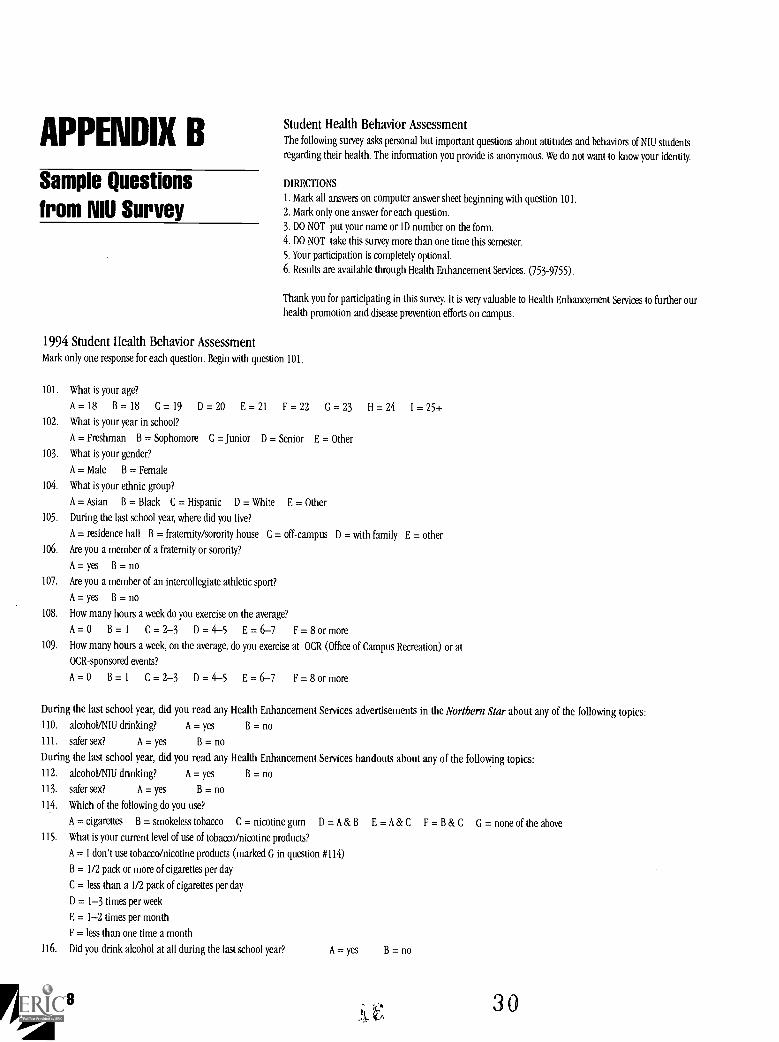
APPENDIX B
Sample Questions
from NIU Survey
Student Health Behavior AssessmentThe following survey asks personal but important questions about attitudes and behaviors of NIU students
regarding their health. The information you provide is anonymous. We do not want to know your identity.
IMRECTIONS
1. Mark all answers on computer answer sheet beginning with question 101.
2. Mark only one answer for each question.
3. DO NOT put your name or ID number on the form.
4. DO NOT take this survey more than one time this semester.
5. Your participation is completely optional.
6. Results are available through Health Enhancement Services. (753-9755).
Thank you for participating in this survey. It is very valuable to Health Enhancement Services to further our
health promotion and disease prevention efforts on campus.
1994 Student Health Behavior AssessmentMark only one response for each question. Begin with question 101.
101. What is your age?
A = 18 B = 18 C = 19 D = 20 E = 21 F = 22 G = 23 H = 24 I = 25+102. What is your year in school?
A = Freshman B = Sophomore C = Junior D = Senior E = Other
103. What is your gender?
A = Male B = Female
104. What is your ethnic group?
A = Asian B = Black C = Hispanic D = White E = Other
105. During the last school year, where did you live?
A = residence hall B = fraternity/sorority house C = off-campus D = with family E = other
106. Are you a member of a fraternity or sorority?
A = yes B = no
107. Are you a member of an intercollegiate athletic sport?
A = yes B = no
108. How many hours a week do you exercise on the average?
A = 0 B = 1 C = 2-3 D = 4-5 E = 6-7 F = 8 or more
109. How many hours a week, on the average, do you exercise at OCR (Office of Campus Recreation) or at
OCR-sponsored events?
A = 0 B = 1 C = 2-3 D = 4-5 E = 6-7 F = 8 or more
During the last school year, did you read any Health Enhancement Services advertisements in the Northern Star about any of the following topics:110. alcohol/NIU drinking? A = yes B = no
111. safer sex? A = yes B = no
During the last school year, did you read any Health Enhancement Services handouts about any of the following topics:
112. alcohol/NIU drinking? A = yes B = no
113. safer sex? A = yes B = no
114. Which of the following do you use?
A = cigarettes B = smokeless tobacco C = nicotine gum D = A & B E=A&C F=B&C G= none of the above115. What is your current level of use of tobacco/nicotine products?
A = I don't use tobacco/nicotine products (marked G in question #114)
B = 1/2 pack or more of cigarettes per day
C = less than a 1/2 pack of cigarettes per day
D = 1-3 times per week
E = 1-2 times per month
F = less than one time a month
116. Did you drink alcohol at all during the last school year? A = yes B = no
ri 28 30
SOCIAL h IAThe Higher Education Center for Alcohol and Other Drug Prevention
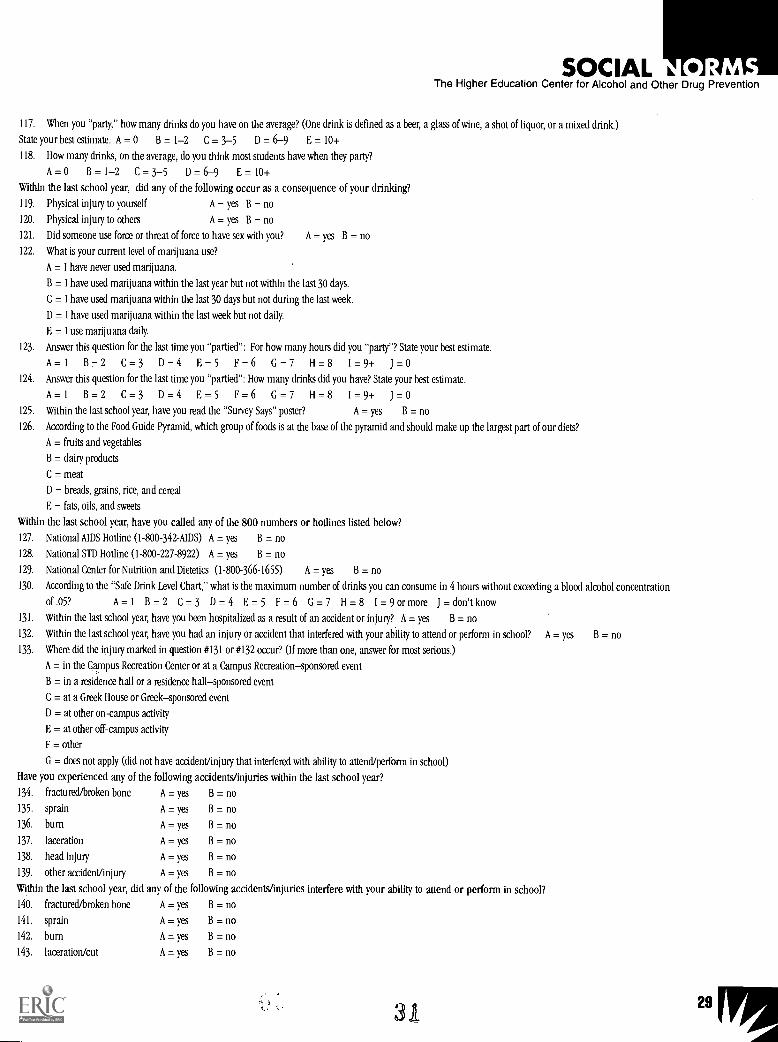
117. When you "party," how many drinks do you have on the average? (One drink is defined as a beer, a glass of wine, a shot of liquor, or a mixed drink.)
State your best estimate. A = 0 B= 1-2 C = 3-5 D = 6-9 E = 10+
118. How many drinks, on the average, do you think most students have when they party?
A = 0 B = 1-2 C = 3-5 D = 6-9 E = 10+
Within the last school year, did any of the following occur as a consequence of your drinking?
119. Physical injury to youiself A = yes B = no
120. Physical injury to others A = yes B = no
121. Did someone use force or threat of force to have sex with you? A = yes B = no
122. What is your current level of marijuana use?
A = 1 have never used marijuana.
B = I have used marijuana within the last year but not within the last 30 days.
C = I have used marijuana within the last 30 days but not during the last week.
D = 1 have used marijuana within the last week but not daily.
E = 1 use marijuana daily.
123. Answer this question for the last time you "partied": For how many hours did you "party"? State your best estimate.
A= 1 B= 2 C= 3 D=4 E= 5 F=6 G= 7 H= 8 I= 9+ J=0124. Answer this question for the last time you "partied": How many drinks did you have? State your best estimate.
A=1 B= 2 C=3 D=4 E= 5 F=6 G=7 11=8 1=9-F J=0125. Within the last school year, have you read the "Survey Says" poster? A = yes B = no
126. According to the Food Guide Pyramid, which group of foods is at the base of the pyramid and should make up the largest part of our diets?
A = fruits and vegetables
B = dairy products
C = meat
D = breads, grains, rice, and cereal
E = fats, oils, and sweets
Within the last school year, have you called any of the 800 numbers or hotlines listed below?
127. National AIDS Hotline (1-800-342-AIDS) A = yes B = no
128. National STD Hotline (1-800-227-8922) A = yes B = no
129. National Center for Nutrition and Dietetics (1-800-366-1655) A = yes B = no
130. According to the "Safe Drink Level Chart," what is the maximum number of drinks you can consume in 4 hours without exceeding a blood alcohol concentration
of .05? A-1 B-2 C-3 D-4 E-5 F-6 G-7 8 I-9 or more J don't know
131. Within the last school year, have you been hospitalized as a result of an accident or injury?. A = yes B = no
132. Within the last school year, have you had an injury or accident that interfered with your ability to attend or perform in school? A = yes B = no
133. Where did the injury marked in question #131 or #132 occur? (If more than one, answer for most serious.)
A = in the Campus Recreation Center or at a Campus Recreationsponsored event
B = in a residence hall or a residence hallsponsored event
C = at a Greek House or Greeksponsored event
D . at other on-campus activity
E = at other off-campus activity
F = other
G = does not apply (did not have accident/injury that interfered with ability to attend/perform in school)
Have you experienced any of the following accidents/injuries within the last school year?
134. fractured/broken bone A = yes B = no
135. sprain A = yes B = no
136. bum A = yes B = no
137. laceration A = yes B = no
138. head injury A = yes B = no
139. other accident/injury A = yes B = no
Within the last school year did any of the following accidents/injuries interfere with your ability to attend or perform in school?
140. fractured/broken bone A = yes B = no
141. sprain A = yes B = no
142. bum A = yes B = no
143. laceration/cut A = yes B = no
31
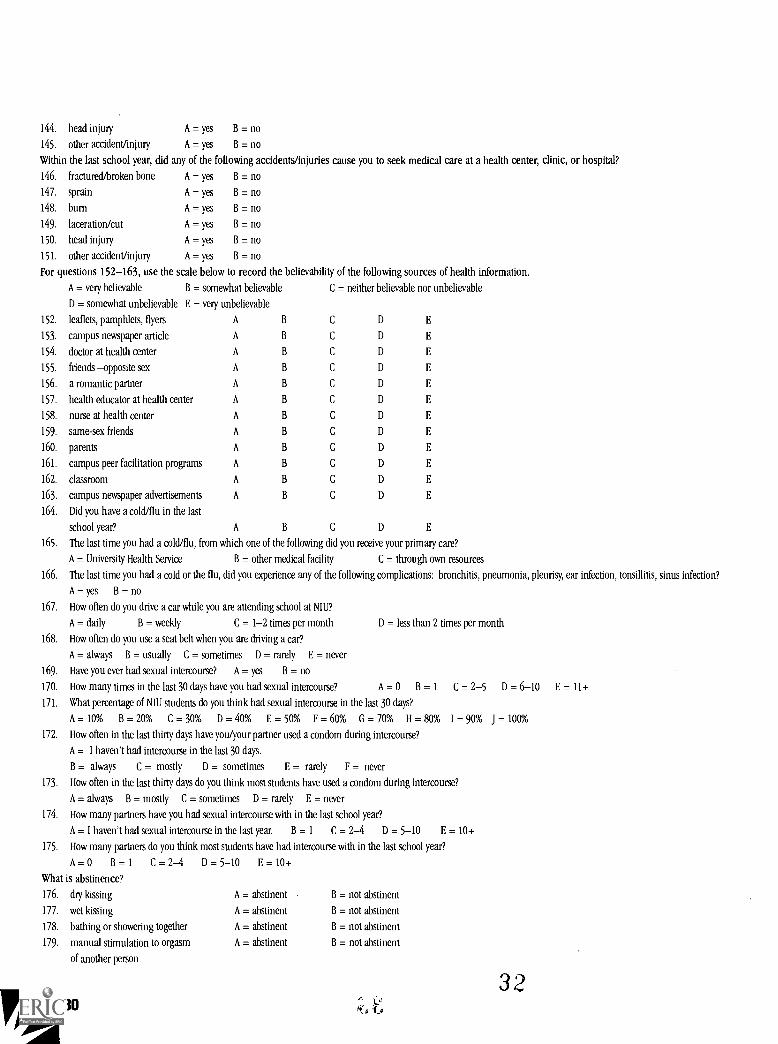
144. head injury A = yes B = no
145. other accident/injury A = yes B = no
Within the last school year, did any of the following accidents/injuries cause you to seek medical care at a health center, clinic, or hospital?
146. fractured/broken bone A = yes B = no
147. sprain A = yes B = no
148. bum A = yes B = no
149. laceration/cut A = yes B = no
150. head injury A = yes B = no
151. other accidenVinjury A = yes B = no
For questions 152-163, use the scale below to record the believability of the following sources of health information.
A = very believable B = somewhat believable C = neither believable nor unbelievable
D = somewhat unbelievable E = very unbelievable
152. leaflets, pamphlets, flyers A
153. campus newspaper article A
154. doctor at health center A
155. friends -opposite sex A
156. a romantic partner A
157. health educator at health center A
158. nurse at health center A
159. same-sex friends A
160. parents A
161. campus peer facilitation programs A
162. classroom A
163. campus newspaper advertisements A
164. Did you have a cold/flu in the last
school year? A
165. The last time you had a cold/flu, from which one of the following did you receive your primary care?
A = University Health Service B = other medical facility C = through own resources
166. The last time you had a cold or the flu, did you experience any of the following complications: bronchitis, pneumonia, pleurisy, ear infection, tonsillitis, sinusinfection?
A = yes B = no
167. How often do you drive a car while you are attending school at NIU?
A = daily B = weekly C = 1-2 times per month D = less than 2 times per month
168. How often do you use a seat belt when you are driving a car?
A = always B = usually C = sometimes D = rarely E = never
169. Have you ever had sexual intercourse? A = yes B = no
170. How many times in the last 30 days have you had sexual intercourse? A = 0 B = 1 C = 2-5 D = 6-10 E = 11+
171. What percentage of NIU students do you think had sexual intercourse in the last 30 days?
A = 10% B = 20% C = 30% D = 40% E = 50% F = 60% G = 70% H = 80% I = 90% J = 100%
172. How often in the last thirty days have you/your partner used a condom during intercourse?
A = I haven't had intercourse in the last 30 days.
B = always C = mostly D = sometimes E = rarely F = never
173. How often in the last thirty days do you think most students have used a condom during intercourse?
A = always B = mostly C = sometimes D = rarely E = never
174. How many partners have you had sexual intercourse with in the last school year?
A = I haven't had sexual intercourse in the last year. B = I C = 2-4 D = 5-10 E = 10+
175. How many partners do you think most students have had intercourse with in the last school year?
A= 0 B=1 C=2-4 D= 5-10 E= 10+
What is abstinence?
176. dry kissing A = abstinent B = not abstinent
177. wet kissing A = abstinent B = not abstinent
178. bathing or showering together A = abstinent B = not abstinent
179. manual stimulation to orgasm A = abstinent B = not abstinent
of another person
32
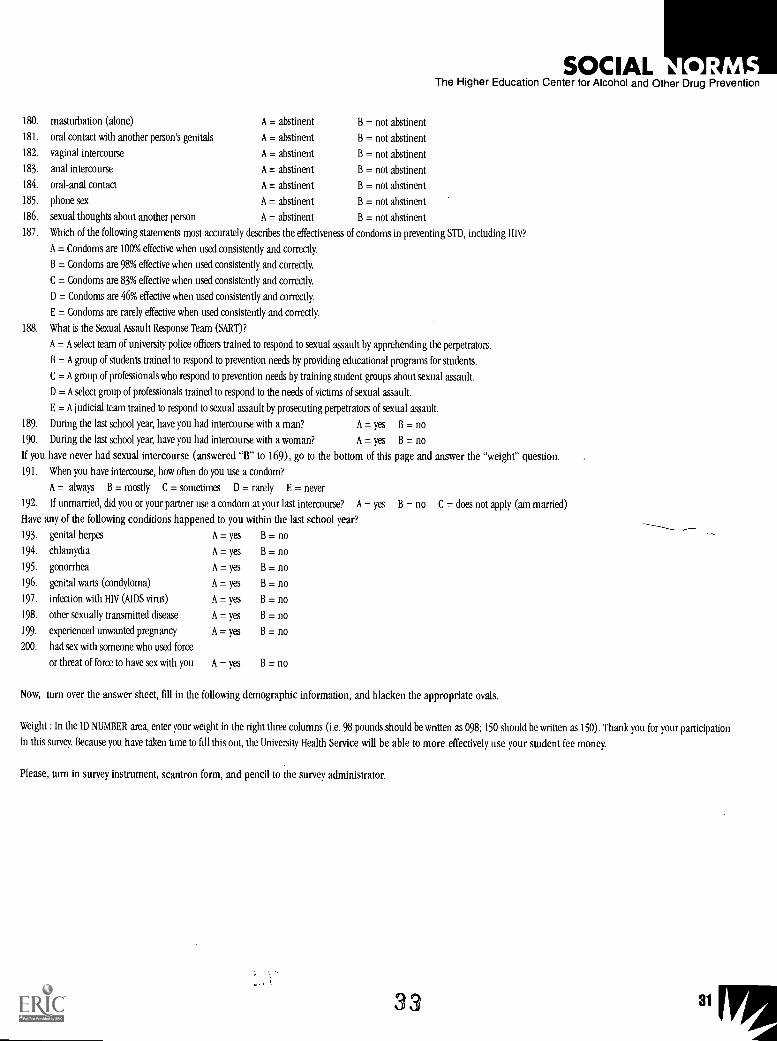
SOCIAL 1/The Higher Education Center for Alcohol and Other Drug Prevention
180. masturbation (alone) A = abstinent B = not abstinent
181. oral contact with another person's genitals A = abstinent B = not abstinent
182. vaginal intercourse A = abstinent B = not abstinent
183. anal intercourse A = abstinent B = not abstinent
184. oral-anal contact A = abstinent B = not abstinent
185. phone sex A = abstinent B = not abstinent
186. sexual thoughts about another person A = abstinent B = not abstinent
187. Which of the following statements most accurately describes the effectiveness of condoms in preventing STD, including HIV?
A = Condoms are 100% effective when used consistently and correctly.
B = Condoms are 98% effective when used consistently and correctly.
C = Condoms are 83% effective when used consistently and correctly.
D = Condoms are 46% effective when used consistently and correctly.
E = Condoms are rarely effective when used consistently and correctly.
188. What is the Sexual Assault Response Team (SART)?
A = A select team of university police officers trained to respond to sexual assault by apprehending the perpetrators.
B = A group of students trained to respond to prevention needs by providing educational programs for students.
C = A group of professionals who respond to prevention needs by training student groups about sexual assault.
D = A select group of professionals trained to respond to the needs of victims of sexual assault.
E = A judicial team trained to respond to sexual assault by prosecuting perpetrators of sexual assault.
189. During the last school year, have you had intercourse with a man? A = yes B = no
190. During the last school year, have you had intercourse with a woman? A = yes B = no
If you have never had sexual intercourse (answered "B" to 169), go to the bottom of this page and answer the "weight" question.
191. When you have intercourse, how often do you use a condom?
A = always B = mostly C = sometimes D = rarely E = never
192. If unmarried, did you or your partner use a condom at your last intercourse? A = yes B = no C = does not apply (am married)
Have any of the following conditions happened to you within the last school year?
193. genital herpes A = yes B = no
194. chlamydia A = yes B = no
195. gonorrhea A = yes B = no
196. genital warts (condyloma) A = yes B = no
197. infection with HIV (AIDS virus) A = yes B = no
198. other sexually transmitted disease A = yes B = no
199. experienced unwanted pregnancy A = yes B = no
200. had sex with someone who used force
or threat of force to have sex with you A = yes B = no
Now, turn over the answer sheet, fill in the following demographic information, and blacken the appropriate ovals.
Weight : In the ID NUMBER area, enter your weight in the right three columns (i.e. 98 pounds should be written as 098; 150 should be written as 150). Thank you for your participation
in this survey. Because you have taken time to fill this out, the University Health Service will be able to more effectively use your student fee money.
Please, turn in survey instrument, scantron form, and pencil to the survey administrator.
33

APPENDIX C
Misperception MediaCampaign
Estimated Costs
rl 32
ADVERTISEMENTS
Display Ads:
19 display ads @ 30 column inches,@ est. $7/col. in.
(Weekly Sept/Oct; Biweekly Nov/Jan; Weekly Feb/Mar)
Classified Ads:
79 classified ad placements of 3-4 different ads avg.Cost $8/placement (3/week for 24 weeks; 1/week for 7 weeks)
$3,990
$ 632
Ryer
5,000 copies of a two-sided flyer on colored paper $ 410
Designer
Student graphic designer (250 hrs. @ $5.50) $1,375
Poster
7,000 copies of 18 x 24, 2-color poster on glossy stock $1,500
34
Total cost $7,907

Publications available from ...The Higher Educati n Center for Alcohol and * ther Drug Prevention
Please contact us (see back cover) for information on obtaining the following materials:
Setting and Improving Policies for Reducing Alcohol and Other Drug Problems on Campus:A Guide for Administrators (62 pp.)
Preventing Alcohol-Related Problems on Campus:
Acquaintance Rape: A Guide for Program Coordinators (74 pp.)
Methods for Assessing Student Use of Alcohol and Other Drugs (48 pp.)
Substance-Free Residence Halls (62 pp.)
Vandalism (8 pp.)
College Alcohol Risk Assessment Guide: Environmental Approaches to Prevention (103 pp.)
111 Raising More Voices than Mugs: Changing the College Alcohol Environment throughMedia Advocacy (74 pp.)
Institutionalizing Your AOD Prevention Program (8 pp.)
A Social Norms Approach to Preventing Binge Drinking at Colleges and Universities (32 pp. )
Complying with the Drug-Free Schools and Campuses Regulations (34 CFR Part 86):A Guide for University and College Administrators (36 pp.)
Rethinking the Campus Environment: A Guide for Substance Abuse Prevention (39 pp.)
Alcohol and Other Drug Prevention: A Bulletin for Fraternity & Sorority Advisers (39 pp.)
II Binge Drinking on Campus: Results of a National Study (8 pp.)
Secondary Effects of Binge Drinking on College Campuses (8 pp.)
Special Event Planner's Guidebook (16 pp.)
Fact Sheets/ Prevention Updates
E Alcohol and Other Drug Use and Sexual Assault
E College Academic Performance and Alcohol and Other Drug UseAlcohol and Other Drug Use Among College Athletes
Alcohol, Other Drugs, and Interpersonal Violence
Alcohol Use Among Fraternity and Sorority Members
Getting Started on Campus: Tips for New AOD Coordinators
Responsible Hospitality Service PreventionSocial Marketing for Prevention
3 5
zitcr0 D'on. Alicololl knol atm. IIDamE 1Prevertptflom
1920¢M
NCYNg CM] Eog-p
MOdCM1
The mission of the Higher EducationCenter for Alcohol and Other DrugPrevention is to assist institutions ofhigher education in developingalcohol and other drug (AOD) preventionprograms that will foster students'academic and social development andpromote campus and community safety.
The Center offers an integrated array of services to help people at collegesand universities adopt effective AOD prevention strategies:
Training and professional development activities
Resources, referrals, and consultations
Publication and dissemination of prevention materials
Support for the Network of Colleges and UniversitiesCommitted to the Elimination of Drug and Alcohol Abuse
Assessment, evaluation, and analysis activities
Xigm6 Cho[r Gftaidottar
Keep up to date with the Catalyst. Learn about important developments inAOD prevention in higher education. To receive free copies, ask to be puton our mailing list.
12M bp aloch
Additional information can be obtained by contacting:
The Higher Education Center for Alcohol and Other Drug PreventionEducation Development Center, Inc.55 Chapel StreetNewton, MA 02158-1060
Web site: http://www.edc.org/hec/Phone: 800-676-1730E-mail: [email protected]
c'.)) 4)
Funded by the U.S. Department of Education

U.S. DEPARTMENT OF EDUCATIONOffice of Educational Research and improvement (OERI)Educational Resources information Canter (ERIC)
NOTICE
REPRODUCTION BASIS
ERIC
This document is covered by a signed "Reproduction Release(Blanket)" form (on file.within the ERIC system), encompassing allor classes of documents from its source organization and, therefore,does not require a "Specific Document" Release form.
This document is Federally-funded, or carries its own perrriission toreproduce, or is otherwise in the public domain and, therefore, maybe reproduced by ERIC without a signed Reproduction Releaseform (either "Specific Document" or "Blanket").