36 benign bone tumors and tumor like processes on
TRANSCRIPT

36 Benign Bone Tumors and Tumor-like Processes on
Magnetic Resonance Imaging

CLINICAL IMAGAGINGAN ATLAS OF DIFFERENTIAL DAIGNOSIS
EISENBERG
DR. Muhammad Bin Zulfiqar PGR-FCPS III SIMS/SHL

• Fig B 36-1 Simple bone cyst. (A) Sagittal T1-weighted image shows homogeneous intermediate signal intensity within the lesion, which has a sclerotic margin that appears as low signal intensity. (B) On a T2-weighted image, the lesion has high signal intensity.47
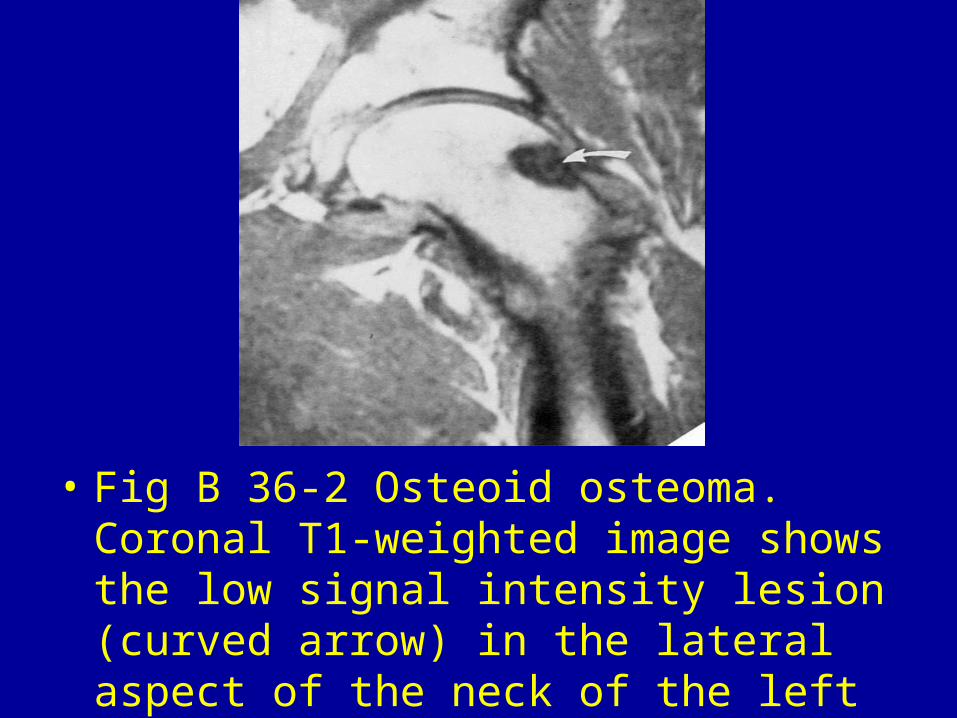
• Fig B 36-2 Osteoid osteoma. Coronal T1-weighted image shows the low signal intensity lesion (curved arrow) in the lateral aspect of the neck of the left femur.45

• Fig B 36-3 Osteoblastoma. Axial T2-weighted image shows the low signal intensity of this proximal humeral lesion, indicating the bony matrix. The rim of high signal intensity adjacent to the posterolateral margin of the tumor reflects peritumoral edema.45
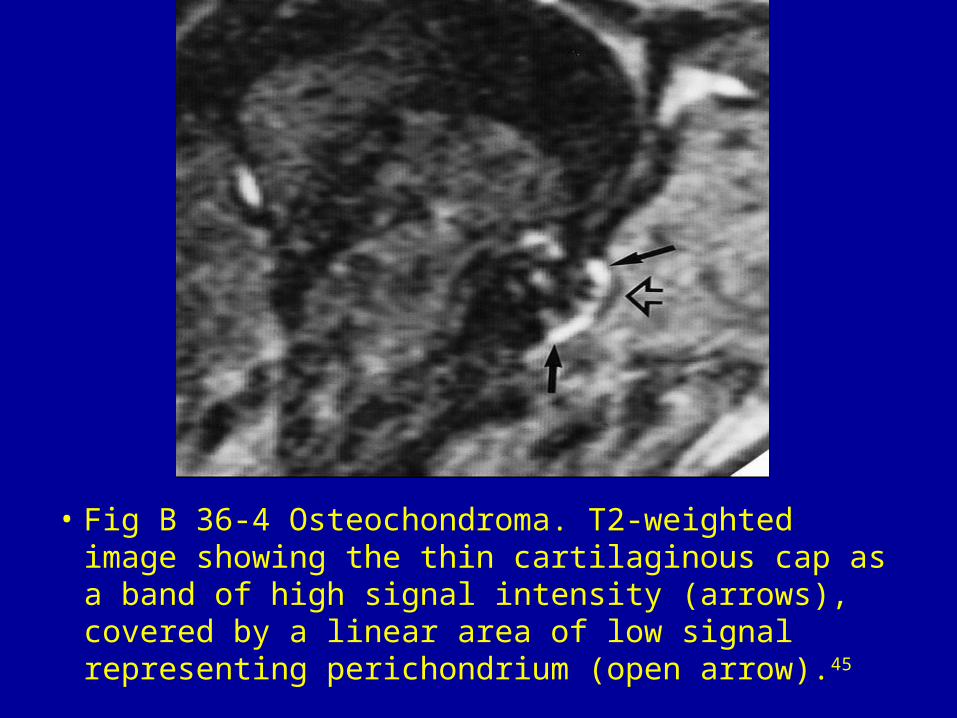
• Fig B 36-4 Osteochondroma. T2-weighted image showing the thin cartilaginous cap as a band of high signal intensity (arrows), covered by a linear area of low signal representing perichondrium (open arrow).45

• Fig B 36-5 Enchondroma. (A) Coronal T1-weighted image shows a well-circumscribed, lobulated lesion with intermediate signal intensity. The darker area in the center represents calcifications. (B) On the T2-weighted image, the lesion has a mixed-intensity signal, with the brighter areas representing cartilaginous tumor and the darker areas reflecting calcifications.45

• Fig B 36-6 Chondroblastoma. An axial T2-weighted image shows a sharply marginated lesion of the left humeral head that has a sclerotic border and central calcifications. Note the small amount of joint effusion and peritumoral edema.45
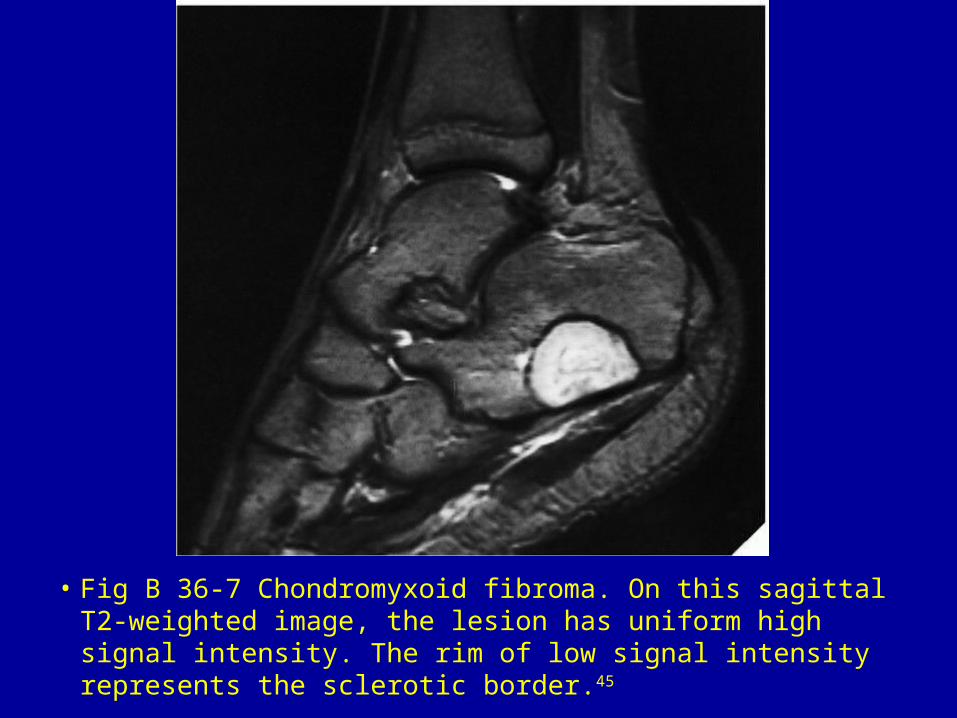
• Fig B 36-7 Chondromyxoid fibroma. On this sagittal T2-weighted image, the lesion has uniform high signal intensity. The rim of low signal intensity represents the sclerotic border.45

• Fig B 36-8 Aneurysmal bone cyst. Axial T2-weighted image shows a lesion of the left inferior pubic ramus that has high signal intensity. Note the multiple fluid-fluid levels characteristic of an aneurysmal bone cyst.45

• Fig B 36-9 Fibrous dysplasia. Coronal T1-weighted image demonstrates expansion of the left femoral neck and abnormal signal intensity in this area and the left ilium in a patient with polyostotic disease.46

• Fig B 36-10 Giant cell tumor. (A) Coronal T1-weighted image of the wrist shows the lesion to be of low signal intensity. (B) On a T2-weighted image, the tumor becomes bright, displaying low-signal septations.45

• Fig B 36-11 Langerhans cell histiocytosis. This coronal contrast T1-weighted image shows marked enhancement of an expansile lesion of the right femur. Note the enhancement of the soft tissue adjacent to the thickened femoral cortex.45
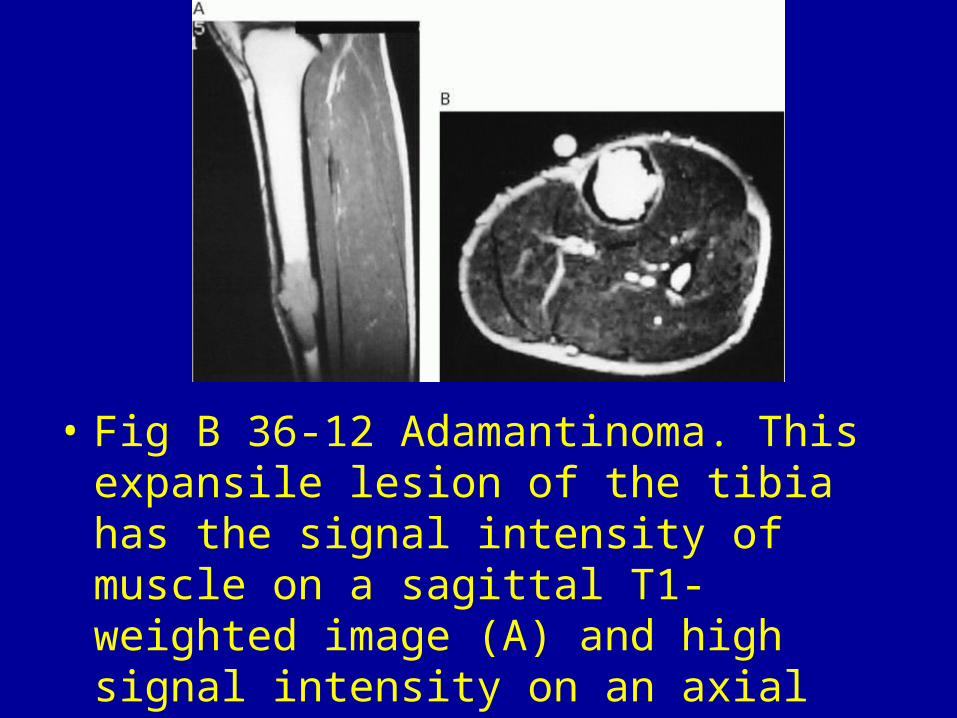
• Fig B 36-12 Adamantinoma. This expansile lesion of the tibia has the signal intensity of muscle on a sagittal T1-weighted image (A) and high signal intensity on an axial T2-weighted sequence (B).46

Fig B 36-13 Brodie's abscess. Coronal contrast T1-weighted image demonstrates rim enhancement about this lesion in the distal femur.46

• Fig B 36-14 Bone island. Axial T2-weighted image shows a low-intensity lesion with irregular margins (arrow) in the right femoral head. Note the tiny bone island in the opposite femoral head (open arrow).46


