3208 - lpi.usra.edu · pdf fileenigmatic landforms in cydonia: geospatial anisotropies,...
TRANSCRIPT

ENIGMATIC LANDFORMS IN CYDONIA: GEOSPATIAL ANISOTROPIES, BILATERALSYMMETRIES, AND THEIR CORRELATIONS. M. J. Carlotto, Veridian Systems Division, 705 BroughtonDr., Beverly MA 01915 ([email protected])
Introduction: Geospatial terrain statistics and ob-ject symmetries of enigmatic landforms in Cydonia areexamined and correlations identified. Analysis of Vi-king image-derived MDIM data (1/256 deg./pixel)over Cydonia (37.5-42.5° N and 4.5-15.5° W) showsdirectional anisotropies in the spatial autocorrelation(variogram) at medium to long wavelengths (10-100km.). One is in the direction of the crustal dichotomyin this part of Mars (~ 64.6°, or ~25.4° north of east),along with two others at 103.7° and 164.2°. Anisot-ropies in similar directions at shorter wavelengths(down to tens of meters) are evident in the variogramsof Viking, THEMIS, and MGS images within this area.The spatial autocorrelation structure of selected re-gions in Viking images show indications of rectilineargeometry (directional anisotropies approximately 90deg. apart) similar to that of highly eroded terrestrialarchaeological ruins. Previous analyses of THEMISand MGS imagery reveal a high degree of bilateralsymmetry in several landforms. We show the axes ofsymmetry are roughly in line with the directional ani-sotropy at 164.2° noted above.
Geospatial Statistics: Variograms describe corre-lations in spatial data. The variogram of an imagei x y( , ) is:
2
2
2
2
γ ( , ) ( , ) ( , )
( , ) ( , )
( , ) ( , )
( , ) ( , )
u v Var i x y i x u y v
E i x y i x u y v
E i x y i x u y v
E i x y i x u y v
= − + +[ ]= − + +[ ]{ }−
− + +[ ]{ }= − + +[ ]{ }
for stationary random processes. The variogram andthe autocorrelation function are related
2
0 0
2γ
γ
( , ) ( , ) ( , )
( , ) ( , ) ( , )
u v E i x y i x u y v
u v R R u v
= − + +[ ]{ }= −
where R u v E i x y i x u y v( , ) ( , ) ( , )= + +[ ]. For efficiencythe autocorrelation function is computed using the FastFourier Transform (FFT):
R u v i x y i x y
i x y i x y
( , ) ( , ) ( , )
[ ( , )] [ ( , )]*
= ∗ − −
= ℑ ℑ ℑ{ }−1
The image formation model [1] relates the spatial sta-tistics of an image to its underlying terrain surface. Weare interested in the correlation structure of the terrain,specifically in its directional anisotropy. The autocor-relation function in polar coordinates is R r( , )θ where
r u v= +2 2 and θ = ( )−tan 1 v u . The polar distribu-tion function
F r r R r drr
r
θ θ1 2
1
2
, ( , )( ) = ∫
expresses directional correlations in spatial data over agiven scale range. Peaks in the angular distributionindicate directions along which correlations exist in theterrain.
Mars Crustal Dichotomy: MDIM data providethe appropriate spatial scale to illustrate long term di-rectional trends in the terrain (Fig. 1a). The MDIMautocorrelation function is shown in Fig. 1b with apolar plot showing directional anisotropies for9 115< <r km. Three peaks occur at 64.7±2.5°,103.2±3.9°, and 164.0±0.9°. The first (direction A)corresponds to the direction of the crustal dichotomy inthis part of Mars [2]. The other two directions (B andC) are referenced later in the paper.
Fig. 1a Mosaic of two MDIM images at 1/256 degrees/pixel(231 m/pixel) in sinusoidal equal-area projection.
Sixth International Conference on Mars (2003) 3208.pdf

Fig. 1b Polar plot of MDIM autocorrelation function com-puted over distances of 9-115 km.
Shorter Scale Correlations: Anisotropies in similardirections at shorter wavelengths (down to tens of me-ters) can be found in the autocorrelation functions ofTHEMIS, Viking, and MGS images within this area.Fig. 2a shows two sections of a THEMIS image strip.This area is toward the northeast corner of the MDIMimage in Fig. 1. A directional anisotropy exists in theautocorrelation at 153.5±3.7° over distances of 2-25km (Fig. 2b). This is approximately 90° away from thedirection of the Mars crustal dichotomy (direction A).
Fig. 2a Two sections of THEMIS image 20020413a overCydonia
Fig. 2b Polar plot showing directional anisotropies inTHEMIS image over distances of 2-25 km.
Fig. 2c Directions 149.8° and 157.2° (153.5±3.7°) overlaidon portion of THEMIS image
In Fig. 2c the directional interval 153.5±3.7° is repre-sented by the two arrows overlaid on the portion of theTHEMIS image strip which includes the two enigmaticlandforms known as the D&M Pyramid and Face [3].Both of these objects possess a high degree of bilateral
Sixth International Conference on Mars (2003) 3208.pdf

symmetry (Fig. 3) with their axes of symmetry closelylined up with the 153.5±3.7° anisotropy.
"D&M Pyramid" fromTHEMIS image 20020413a "Face" from MGS image
E1701041Fig. 3 Enigmatic landforms rotated so that their axes ofsymmetry are in the vertical direction
Analysis of Viking orbiter imagery (Fig. 4) revealsspatial correlations at 48° and 167.7±2.5° between 2.5-10 km. that coincide roughly with those seen in MDIMand THEMIS images.
Fig 4a Mosaic of map projected Viking frames from orbit 35over an area showing evidence of rectilinear organization
Fig. 4b. Portion of map projected Viking frame 35A72 show-ing the enigmatic landform known as the "City"
Fig. 4c Polar plot showing directional anisotropies in Vikingimages over distances of 2.5-10 km. (Peaks at 0° and 90° areedge artifacts that are a result of FFT processing.)
Finally in Fig. 5 we show a portion of an MGS imagenear 39.95° N 14.8° W containing small bumps ori-ented at 52.7±6.7° over scales of 150-580 meters. Thisarea is about 250 km. away from the Cydonia land-forms, in the southwest corner of the MDIM image inFig. 1.
Fig. 5a Portion of MGS image SP249604 (area shown inabout 1.4 sq. km.)
Fig. 5b Peak in polar plot of MGS autocorrelation function at52.4±6.7°
Sixth International Conference on Mars (2003) 3208.pdf
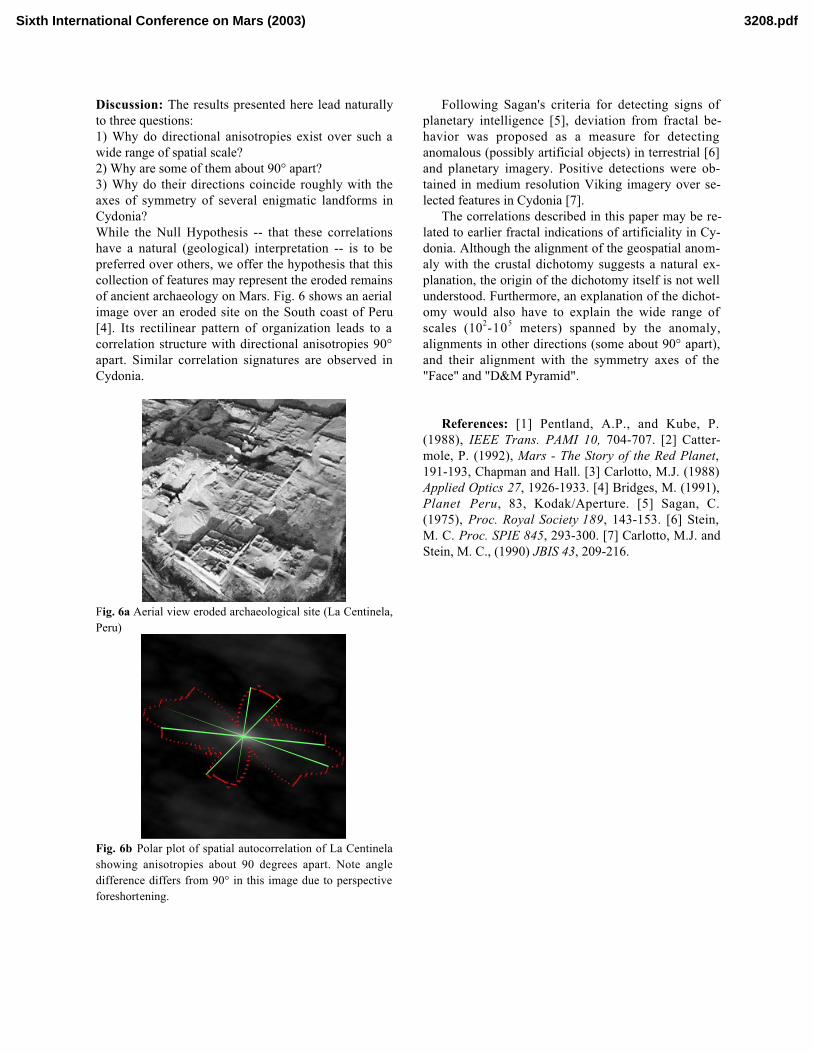
Discussion: The results presented here lead naturallyto three questions:1) Why do directional anisotropies exist over such awide range of spatial scale?2) Why are some of them about 90° apart?3) Why do their directions coincide roughly with theaxes of symmetry of several enigmatic landforms inCydonia?While the Null Hypothesis -- that these correlationshave a natural (geological) interpretation -- is to bepreferred over others, we offer the hypothesis that thiscollection of features may represent the eroded remainsof ancient archaeology on Mars. Fig. 6 shows an aerialimage over an eroded site on the South coast of Peru[4]. Its rectilinear pattern of organization leads to acorrelation structure with directional anisotropies 90°apart. Similar correlation signatures are observed inCydonia.
Fig. 6a Aerial view eroded archaeological site (La Centinela,Peru)
Fig. 6b Polar plot of spatial autocorrelation of La Centinelashowing anisotropies about 90 degrees apart. Note angledifference differs from 90° in this image due to perspectiveforeshortening.
Following Sagan's criteria for detecting signs ofplanetary intelligence [5], deviation from fractal be-havior was proposed as a measure for detectinganomalous (possibly artificial objects) in terrestrial [6]and planetary imagery. Positive detections were ob-tained in medium resolution Viking imagery over se-lected features in Cydonia [7].
The correlations described in this paper may be re-lated to earlier fractal indications of artificiality in Cy-donia. Although the alignment of the geospatial anom-aly with the crustal dichotomy suggests a natural ex-planation, the origin of the dichotomy itself is not wellunderstood. Furthermore, an explanation of the dichot-omy would also have to explain the wide range ofscales (102-105 meters) spanned by the anomaly,alignments in other directions (some about 90° apart),and their alignment with the symmetry axes of the"Face" and "D&M Pyramid".
References: [1] Pentland, A.P., and Kube, P.(1988), IEEE Trans. PAMI 10, 704-707. [2] Catter-mole, P. (1992), Mars - The Story of the Red Planet,191-193, Chapman and Hall. [3] Carlotto, M.J. (1988)Applied Optics 27, 1926-1933. [4] Bridges, M. (1991),Planet Peru, 83, Kodak/Aperture. [5] Sagan, C.(1975), Proc. Royal Society 189, 143-153. [6] Stein,M. C. Proc. SPIE 845, 293-300. [7] Carlotto, M.J. andStein, M. C., (1990) JBIS 43, 209-216.
Sixth International Conference on Mars (2003) 3208.pdf