318747 (red star eng) · pdf filethe group is also involved in pan-home furnishings...
TRANSCRIPT

2016A n n u a l R e p o r t
紅星美凱龍家居集團股份有限公司Red Star Macalline Group Corporation Ltd.(A SINO-FOREIGN JOINT STOCK COMPANY INCORPORATED IN THE PEOPLE'S REPUBLIC OF CHINA WITH LIMITED LIABILITY)
STOCK CODE : 1528
ContentsCompany Profi le
Corporate Information
Financial and Operational Highlights
Chairman’s Statement
Management Discussion and Analysis
Directors, Supervisors and
Senior Management
Report of Directors
Report of Supervisors
Corporate Governance Report
Social Responsibility Report
Independent Auditor’s Report
Consolidated Statement of Profi t or Loss
and Other Comprehensive Income
Consolidated Statement of
Financial Position
Consolidated Statement of
Changes in Equity
Consolidated Statement of Cash Flows
Notes to the Consolidated
Financial Statements
Five-Year Financial Summary
Defi nitions
2
3
5
7
10
45
58
85
88
108
111
118
119
121
124
127
241
242

2
Company Profi le
Red Star Macalline Group Corporation Ltd.
The Company was founded in 2007, and its shares were listed on the Main Board of the Hong Kong Stock Exchange in June
2015 (Stock Code: 1528).
As a leading home improvement and furnishings shopping mall operator in China, the Group mainly engages in the business
of offering comprehensive services to the merchants, consumers and partners of the home improvement and furnishings
shopping malls under “Red Star Macalline” through the operation and management of both Portfolio Shopping Malls and
Managed Shopping Malls. The Group is also involved in pan-home furnishings consumption, including internet home
decoration, internet retail, as well as logistics and delivery services.
According to the statistics of Frost & Sullivan, the Group is a nationwide home improvement and furnishings shopping
mall operator in China which ranks fi rst in terms of area of operational premises, the number of malls, and the geographic
coverage. As at the end of the Reporting Period, we operated 200 shopping malls with a total operating area of 12,692,393
sq.m. in 142 cities in 28 provinces, municipalities and autonomous regions in China. The malls offer more than 18,000 brands
in total. According to the statistics of Frost & Sullivan, in 2016, the Group had a 11.8% market share in the chain home
improvement and furnishings retail mall sector and a 4.5% mall sector market share, owning the largest relevant market share
in China’s rapidly growing home improvement and furnishings retail industry.
The Group has been committed to “building warm and harmonious homes and enhancing taste for consumption and
home life”, and will continue to follow the operation and management mode of “market-oriented and shopping-mall-based
management”. The Company will further strengthen its cooperation with home improvement and furnishings manufacturers
and distributors, and persistently optimize the structure of brands operated by us in home improvement and furnishings
shopping malls. We are able to provide consumers with better services and better understandings of the home culture
philosophy.
In the future, the Group will continue to implement the two-pronged business model, with a focus on continuing development
of our asset-light business model and strategically expanding our shopping mall network nationwide in order to further
enhance our market share, and thereby persistently strengthening our market leadership in China’s home improvement
and furnishings industry. Meanwhile, we will gradually expand the application of the Internet pan-home improvement and
furnishings consumption business based on our physical shopping malls network and strengthen the “Red Star Macalline”
brand as the expert of home living in the minds of consumers with integrated online and offl ine operations. As such, the
Company aims at becoming China’s most professional and advanced “omni-channel platform provider in home improvement
and furnishings industry”.

3Annual Report 2016
Corporate Information
BOARD OF DIRECTORSExecutive Directors
Mr. CHE Jianxing (Chairman)
Ms. ZHANG Qi (Vice Chairman)
Ms. CHE Jianfang
Mr. JIANG Xiaozhong
Non-executive Directors
Ms. CHEN Shuhong
Mr. XU Guofeng
Mr. Joseph Raymond GAGNON
Mr. ZHANG Qiqi
Independent Non-executive Directors
Mr. LI Zhenning
Mr. DING Yuan
Mr. LEE Kwan Hung
Mr. QIAN Shizheng (Appointed on 19 April 2016)
Mr. ZHOU Qinye (Resigned on 19 April 2016)
SUPERVISORSMr. PAN Ning (Chairman)
Ms. NG Ellen Hoi Ying
Ms. CHAO Yanping
Mr. ZHENG Hongtao (Appointed on 31 January 2016)
Mr. CHEN Gang (Appointed on 31 January 2016)
AUDIT COMMITTEEMr. DING Yuan (Chairman)
Mr. QIAN Shizheng (Appointed on 19 April 2016)
Mr. LI Zhenning
Mr. ZHOU Qinye (Resigned on 19 April 2016)
REMUNERATION AND EVALUATION COMMITTEEMr. QIAN Shizheng (Chairman) (Appointed on 19 April 2016)
Mr. CHE Jianxing
Mr. LI Zhenning
Mr. ZHOU Qinye (Chairman) (Resigned on 19 April 2016)
NOMINATION COMMITTEEMr. LI Zhenning (Chairman)
Mr. CHE Jianxing
Mr. LEE Kwan Hung
STRATEGY AND INVESTMENT COMMITTEEMr. CHE Jianxing (Chairman)
Ms. ZHANG Qi
Mr. JIANG Xiaozhong
Mr. ZHANG Qiqi
Mr. LI Zhenning
COMPANY SECRETARYMr. GUO Binghe
ASSISTANT COMPANY SECRETARYMs. LEUNG Suet Lun
AUTHORIZED REPRESENTATIVESMr. CHE Jianxing
Mr. GUO Binghe
REGISTERED OFFICESuite F801, 6/F
No. 518, Linyu Road
Pudong New District
Shanghai, the PRC
HEADQUARTERS IN THE PRC9/F Red Star World Trade Building
No. 598, Nujiang Road North
Putuo District
Shanghai, the PRC

4 Red Star Macalline Group Corporation Ltd.
Corporate Information
PRINCIPAL PLACE OF BUSINESS IN HONG KONG36/F, Tower 2
Times Square
1 Matheson Street
Causeway Bay
Hong Kong
H SHARE REGISTRARComputershare Hong Kong Investor Services Limited
Shops 1712–1716, 17th Floor
Hopewell Centre
183 Queen’s Road East
Wan Chai Hong Kong
LEGAL ADVISORSAs to Hong Kong and United States law
Davis Polk & Wardwell
Hong Kong Solicitors
The Hong Kong Club Building
3A Chater Road
Hong Kong
As to the PRC law
Llinks Law Offi ces
19/F One Lujiazui
68 Yin Cheng Road Middle
Shanghai 200120
The PRC
COMPLIANCE ADVISORAnglo Chinese Corporate Finance, Limited
40/F, Two Exchange Square
8 Connaught Place
Central
Hong Kong
AUDITORDeloitte Touche Tohmatsu
Certifi ed Public Accountants
35/F, One Pacifi c Place
88 Queensway
Hong Kong
PRINCIPAL BANKSIndustrial and Commercial Bank of China
Shanghai Branch Banking Department
No. 24 Zhongshan Dongyi Road
Shanghai, the PRC
Minsheng Bank
Shanghai South Branch
No. 550 Xujiahui Road
Shanghai, the PRC
Bank of Communication
Shanghai West Branch
No. 350 Jiangning Road
Shanghai, the PRC
Bank of China
Wuxi Xishan Branch
No. 82 Xiuhuzhong Road
Wuxi, the PRC
STOCK CODE1528
COMPANY’S WEBSITEwww.chinaredstar.com

5
Financial and Operational Highlights
Annual Report 2016
FINANCIAL HIGHLIGHTS
For the year ended 31 December
2016 2015
(Audited) (Audited)
(in thousands of RMB,
except otherwise stated)
Revenue 9,282,393 8,756,120
Gross Profi t 6,624,221 6,514,139
Gross profi t margin 71.4% 74.4%
Profi t attributable to owners of the Company 4,036,269 4,098,068
Profi t margin attributable to owners of the Company 43.5% 46.8%
Core net profi t attributable to owners of the Company (1) 2,554,746 2,552,735
Core net profi t margin attributable to owners of the Company (2) 27.5% 29.2%
Earnings per share (basic) RMB1.11 RMB1.22
Dividend per share (tax inclusive) RMB0.42 RMB0.47
Notes:
(1) Core net profi t attributable to owners of the Company represents the profi ts attributable to owners of the Company after deducting the after-tax effects
of changes in fair values of investment properties, other income, other gains and losses and other expenses etc., which are not related to daily operating
activities.
(2) Core net profi t margin attributable to owners of the Company represents the ratio of core net profi ts attributable to owners of the Company divided by
revenue.
RMB million
Key Financial Performance Indicators
2015 2016
0
2500
5000
7500
10000
Revenue Profit attributableto owners ofthe Company
Core net profitattributable to owners
of the Company
4,036
8,7569,282
4,098
2,553 2,555
6 Red Star Macalline Group Corporation Ltd.
Financial and Operational Highlights
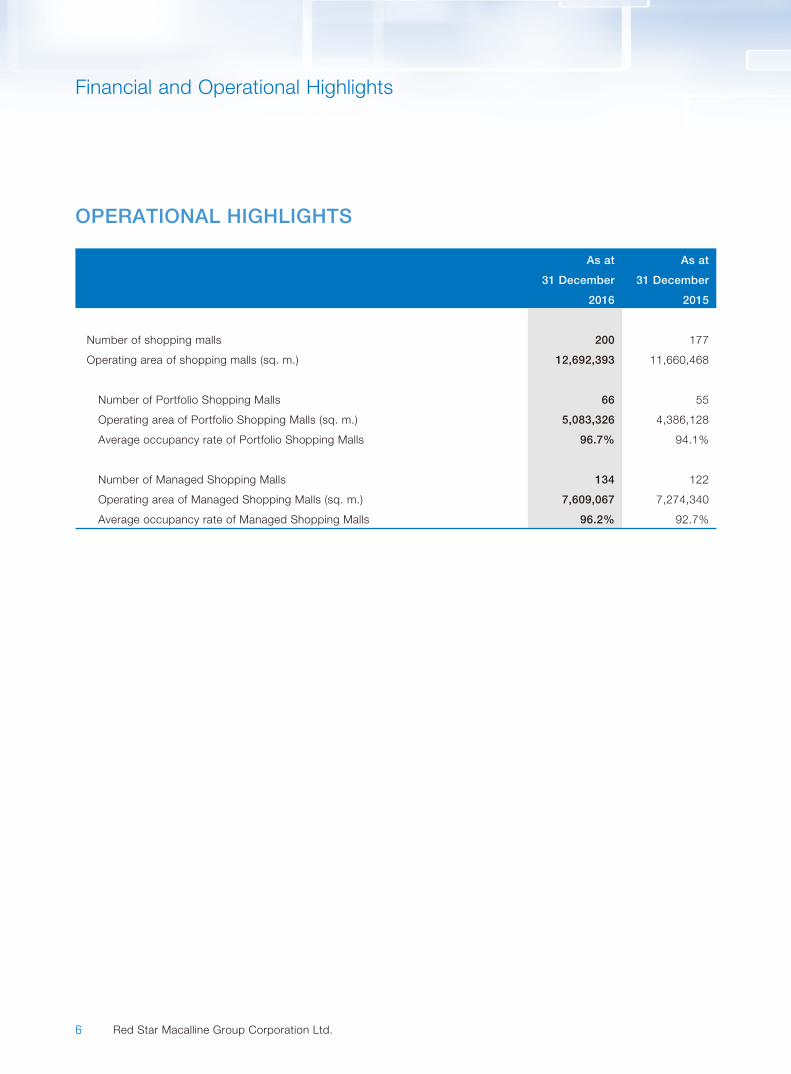
OPERATIONAL HIGHLIGHTS
As at
31 December
2016
As at
31 December
2015
Number of shopping malls 200 177
Operating area of shopping malls (sq. m.) 12,692,393 11,660,468
Number of Portfolio Shopping Malls 66 55
Operating area of Portfolio Shopping Malls (sq. m.) 5,083,326 4,386,128
Average occupancy rate of Portfolio Shopping Malls 96.7% 94.1%
Number of Managed Shopping Malls 134 122
Operating area of Managed Shopping Malls (sq. m.) 7,609,067 7,274,340
Average occupancy rate of Managed Shopping Malls 96.2% 92.7%

7
Chairman’s Statement
Annual Report 2016
Dear Shareholders:
The year of 2016 embraced the fi rst anniversary of Red Star Macalline Group Corporation Ltd.’s
listing on the Hong Kong Stock Exchange. During the year, the management of the Company has
led all the Red Star Macalline staff by virtue of unity, progressiveness and innovative spirit and have
achieved brilliant results.
In 2016, the Group’s revenue amounted to RMB9,282 million; profi t attributable to owners of the Company amounted to
RMB4,036 million; and core net profi t attributable to owners of the Company amounted to RMB2,555 million. We are willing to
share our development outcomes with shareholders while enjoying satisfactory fi nancial results. It was pleased to announce
at the 2016 Board meeting that the 2016 cash dividend per share was RMB0.42 (tax inclusive), representing a 60% dividend
payout ratio of core net profi t attributable to owners of the Company.
In recent years, with the continuous increase of China’s national income, and people’s higher requirement in quality life,
the home improvement and furnishings industry has entered into a 10-year golden period. We should capitalize on the
development opportunities arising from the home improvement and furnishings industry, continue to enhance our leading
position in the home improvement and furnishings industry, grow into a new benchmark retailer in the home improvement and
furnishings industry to lead the industry in its evolvement.
CAPITALIZING ON THE DEVELOPMENT OPPORTUNITIES ARISING FROM THE HOME IMPROVEMENT AND FURNISHINGS INDUSTRY
• Home furnishing is closely related with people’s daily life and standard of living. Along with the growth in disposable
income, people’s enhanced standard of living and higher requirement in quality life, the home furnishing market in China
has experienced a rapid development in the past fi ve years.
According to the independent authoritative market research institutions, in 2016, the total retail sales of China’s home
improvement and furnishings industry reached a high level of nearly RMB4 trillion; however, when it comes to per capita
consumption, there is still an obvious gap between China and developed countries, such as the United States and the
United Kingdom. Along with the continued steady growth in China’s macro economy and people’s constantly enhanced
taste and requirement in living, the home improvement and furnishings industry has entered into a 10-year golden
period, and will grow rapidly at a pace faster than that of GDP growth in the coming fi ve years.

8 Red Star Macalline Group Corporation Ltd.
Chairman’s Statement
CONSOLIDATING OUR LEADING POSITION IN THE HOME IMPROVEMENT AND FURNISHINGS INDUSTRY
• According to the independent authoritative market research institutions, we are a nationwide home improvement and
furnishings shopping mall operator in China which ranks fi rst in terms of area of operational premises, the number of
malls, the geographic coverage, and with the most relevant market share in China’s rapidly growing home improvement
and furnishings retail industry. As at the end of the Reporting Period, we have operated 200 shopping malls in mainland
China with a total operating area of more than 12.7 million sq.m.. However, compared with the home furnishing markets
in United States and other developed countries, the market concentration of home furnishings industry in mainland
China is signifi cantly lower. As one of the most infl uential home furnishings enterprises in mainland China, we not only
have absolute market superiority, but also have great room for growth and integration potential.
BUILDING A NEW BENCHMARK RETAILER IN THE HOME IMPROVEMENT AND FURNISHINGS INDUSTRY
• In order to build the Group into a new benchmark retailer in the home improvement and furnishings industry, we will
continue to expand our business scale through applying the two-pronged development model of Portfolio Shopping
Malls and Managed Shopping Malls, and place emphasis on enhancing our enterprise brand, connotation and value.
A new retailing model, in my opinion, is supposed to provide consumers with better and more intensive experience,
more professional and comprehensive value-added services and more convenient and user-friendly modes of service,
as compared with the traditional one. Goods circulated in the home improvement and furnishings industry are usually
non-standard (customized) goods with high unit price and high degree of specialization, and thus higher requirements
in shopping guide service, the quality and eco-friendly attributes of products, the distribution, installation and after-sale
services are imposed by consumers. As one of the most infl uential home furnishings enterprises in mainland China, we
have always been committed, with a view to truly understanding and serving the demands from consumers, to providing
consumers with a reliable circulation platform which may integrate suffi cient home improvement and furnishings industry
brands, providing professional shopping guide service and in-depth experience service, assuring the quality and eco-
friendly attributes of products circulated on the platform, and offering reliable distribution, installation and after-sale
services. Meanwhile, we gradually expanded the application of the internet-related products and services in home
improvement and furnishings business on the basis of our physical shopping malls network, including introducing
online shopping malls, online home decoration, consumer fi nancing and other expanding businesses, so as to address
diversifi ed demands of consumers in an integrated and close-loop manner and enhance the integrated O2O experience
of consumers. All these measures are adopted to make our omni-channel circulation platform the most valuable one in
the home improvement and furnishings industry.
9Annual Report 2016
Chairman’s Statement
PROMOTING A WELL-GROUNDED AND FORWARD-LOOKING DEVELOPMENT TO LEAD THE INDUSTRY IN ITS EVOLVEMENT
• Nowadays, the world has entered into a digital era, and the level of digitalization determines the long-term
competitiveness of an enterprise or institution, home improvement and furnishings industry is of no exception. The
Group is implementing a “1001” strategy, which is designed to enhance the Group’s long-term competitiveness
and embrace new development opportunities by virtue of internet, big data, cloud computing and other information
technologies. Household intelligentization is another signifi cant development trend of the home improvement and
furnishings industry. At the same time, the Group is also seeking opportunities to tap into the smart household fi eld, as
a breakthrough point to embrace future in a proactive manner. In addition, we will also actively explore new business
models, attempt asset securitization in respect of properties of Portfolio Shopping Malls and deeply integrate upstream
and downstream resources via investments and mergers and acquisitions, in an effort to expand the business scale,
reinforce the strength of the Group, and to lead the industry in its evolvement.
The achievements made by the Company were refl ective of the efforts of all individuals of Red Star Macalline. I would
like to take this opportunity to express my sincere gratitude, on behalf of the Board, to all staff for their hard work and all
shareholders and stakeholders for giving us trust and confi dence. In the coming year, we will consistently adhere to the “spirit
of craftsman” to improve ourselves as well as promote our national living quality and spread culture of furnishings through
diligence and care in the home improvement and furnishings industry, and to gain more returns to our shareholders.
CHE Jianxing
Chairman
20 March 2017
10
Management Discussion and Analysis
Red Star Macalline Group Corporation Ltd.
INDUSTRY REVIEW
In 2016, facing the complex and volatile domestic and overseas economic environment, together with the effect of policies
such as the structural reforms of supply side policies, the appropriate expansion of the total demands and the steady
promotion of reforms, the national economy maintained an overall stable and improving development trend, and achieved a
good commencement of the Thirteenth Five-Year Plan.
According to the statistics of the National Bureau of Statistics of the People’s Republic of China, in 2016, the GDP grew by
6.7% on a year-on-year basis calculated based on the comparable price, while the national disposable income per capita
increased by 8.4% on a year-on-year basis, with an actual growth rate of 6.3% after deducting price factors. During the same
period, the accumulative value of retail sales of social consumer goods increased by 10.4%, while the accumulative value of
retail sales of furniture category and construction and decoration material categories increased by 14.0%, both on a year-on-
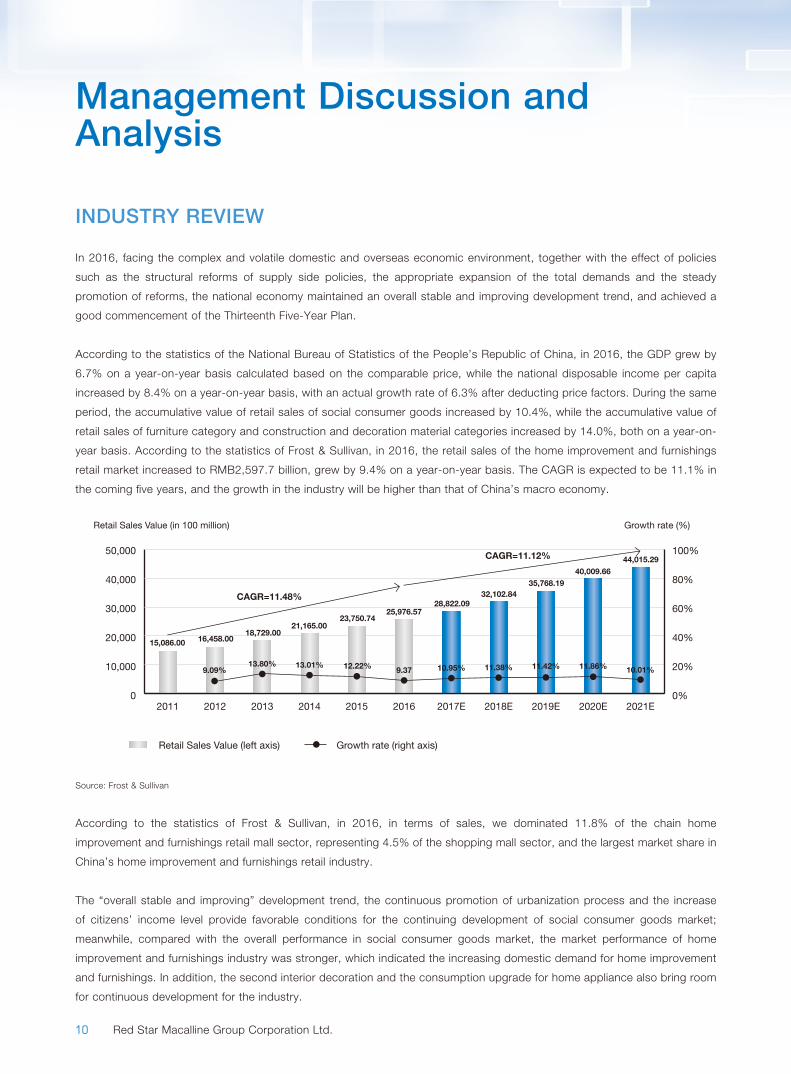
year basis. According to the statistics of Frost & Sullivan, in 2016, the retail sales of the home improvement and furnishings
retail market increased to RMB2,597.7 billion, grew by 9.4% on a year-on-year basis. The CAGR is expected to be 11.1% in
the coming fi ve years, and the growth in the industry will be higher than that of China’s macro economy.
0
10,000
20,000
30,000
40,000
50,000
2021E2020E2019E2018E2017E2016201520142013201220110%
20%
40%
60%
80%
100%
CAGR=11.48%
CAGR=11.12%
15,086.00 16,458.00
9.09%13.80% 13.01% 12.22% 9.37 10.95% 11.38% 11.42% 11.86% 10.01%
18,729.0021,165.00
23,750.7425,976.57
28,822.0932,102.84
35,768.1940,009.66
44,015.29
Retail Sales Value (in 100 million) Growth rate (%)
Retail Sales Value (left axis) Growth rate (right axis)
Source: Frost & Sullivan
According to the statistics of Frost & Sullivan, in 2016, in terms of sales, we dominated 11.8% of the chain home
improvement and furnishings retail mall sector, representing 4.5% of the shopping mall sector, and the largest market share in
China’s home improvement and furnishings retail industry.
The “overall stable and improving” development trend, the continuous promotion of urbanization process and the increase
of citizens’ income level provide favorable conditions for the continuing development of social consumer goods market;
meanwhile, compared with the overall performance in social consumer goods market, the market performance of home
improvement and furnishings industry was stronger, which indicated the increasing domestic demand for home improvement
and furnishings. In addition, the second interior decoration and the consumption upgrade for home appliance also bring room
for continuous development for the industry.
11Annual Report 2016
Management Discussion and Analysis
BUSINESS REVIEW
1. Business development and presence: stable development of shopping malls and strategic
presence with a nationwide coverage
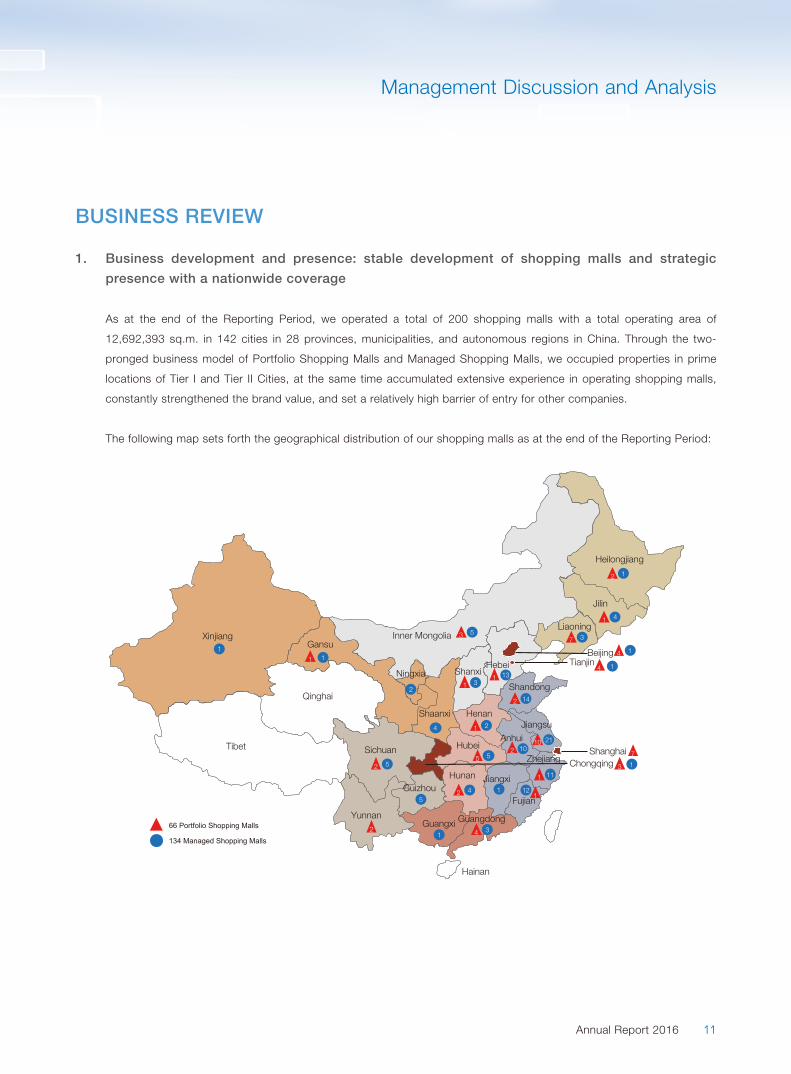
As at the end of the Reporting Period, we operated a total of 200 shopping malls with a total operating area of
12,692,393 sq.m. in 142 cities in 28 provinces, municipalities, and autonomous regions in China. Through the two-
pronged business model of Portfolio Shopping Malls and Managed Shopping Malls, we occupied properties in prime
locations of Tier I and Tier II Cities, at the same time accumulated extensive experience in operating shopping malls,
constantly strengthened the brand value, and set a relatively high barrier of entry for other companies.
The following map sets forth the geographical distribution of our shopping malls as at the end of the Reporting Period:
2 1
1 4
7 33 5
1 13
1 3
10
12
102
21
1
1
2 14
1 2
5 5
2 4
4
1
3
2
4
1
5
12
2 5
4 1
14
7
3
1 11
11Hebei
Hubei
Shandong
Jiangsu
Shanghai
Fujian
Guangdong
Heilongjiang
Jilin
LiaoningInner MongoliaXinjiang
Tibet
Qinghai
Sichuan
Yunnan
Guizhou
Guangxi
Hainan
Hunan Jiangxi
Henan
Ningxia
Shaanxi
Gansu
Shanxi
Beijing
Chongqing
Tianjin
Anhui
Zhejiang
66 Portfolio Shopping Malls
134 Managed Shopping Malls

12 Red Star Macalline Group Corporation Ltd.
Management Discussion and Analysis
BUSINESS REVIEW (continued)
1. Business development and presence: stable development of shopping malls and strategic
presence with a nationwide coverage (continued)
The following table sets forth the number and operating area of our Portfolio Shopping Malls and Managed Shopping
Malls in operation by region as at the end of Reporting Period:
Color
Region(1) (Municipality/
Administrative Region)
Portfolio Shopping Malls Managed Shopping Malls
No. of
shopping
malls
Sub-total of
Operating
Area (m2)
No. of
Shopping
Malls
Sub-total of
Operating
Area (m2)
Beijing 4 272,028 1 80,699
Shanghai 7 684,864 — —
Tianjin 4 292,763 1 29,109
Chongqing 3 261,825 1 38,106
Northeast China 10 804,486 8 377,718
North China (excluding Beijing, Tianjin) 5 280,912 21 1,235,909
East China (excluding Shanghai) 16 1,269,071 69 3,852,127
Central China 8 675,065 11 617,583
South China 4 235,906 4 271,261
Northwest China 1 66,006 8 540,035
Southwest China (excluding Chongqing) 4 240,399 10 566,519
Total 66 5,083,326 134 7,609,067
Note:
(1) The information disclosed above is obtained according to the following statistic standards. The provinces, municipalities and autonomous regions
of the PRC are divided into 7 large regions and 4 municipalities (excluding Hong Kong, Macau and Taiwan regions), among which, Northeast
China includes Heilongjiang Province, Jilin Province, Liaoning Province; North China (excluding Beijing and Tianjin) includes Shanxi Province, Hebei
Province, Inner Mongolia Autonomous Region; East China (excluding Shanghai) includes Shandong Province, Jiangsu Province, Zhejiang Province,
Anhui Province, Jiangxi Province, Fujian Province; Central China includes Hunan Province, Hubei Province, Henan Province; South China includes
Hainan Province, Guangdong Province, Guangxi Zhuang Autonomous Region; Northwest China includes Shaanxi Province, Gansu Province, Qinghai
Province, Ningxia Hui Autonomous Region, Xinjiang Uygur Autonomous Region; Southwest China (excluding Chongqing) includes Yunnan Province,
Sichuan Province, Guizhou Province, Tibet Autonomous Region; 4 municipalities are Beijing, Shanghai, Tianjin and Chongqing respectively.
13Annual Report 2016
Management Discussion and Analysis
BUSINESS REVIEW (continued)
1. Business development and presence: stable development of shopping malls and strategic
presence with a nationwide coverage (continued)
During the Reporting Period, we continued to strategically locate our Portfolio Shopping Malls in prime locations in Tier I
and Tier II Cities, especially in municipalities. As at the end of the Reporting Period, we operated 66 Portfolio Shopping
Malls covering a total operating area of 5,083,326 sq.m. with an average occupancy rate of 96.7%. Among these
Portfolio Shopping Malls, 18 Portfolio Shopping Malls, representing 27.3% of the total number of Portfolio Shopping
Malls, were located in the four municipalities of Beijing, Shanghai, Tianjin and Chongqing. The operating area of the
aforesaid Portfolio Shopping Malls was 1,511,480 sq.m., representing 29.7% of the total operating area of the Portfolio
Shopping Malls. The same mall growth of mature shopping malls(1) during the Reporting Period was 5.2%.
During the Reporting Period, we opened eight new Portfolio Shopping Malls, and three Managed Shopping Mall were
converted into Portfolio Shopping Malls. As at the end of the Reporting Period, we had 22 pipeline Portfolio Shopping
Malls. We will continue to focus on the prime locations of Tier I and Tier II Cities to strategically expand our Portfolio
Shopping Malls network in the future.
In addition, with a reputable brand name in the home improvement and furnishings industry and extensive experience in
shopping mall development, strength in tenant sourcing and operational management, we continued to rapidly develop
Managed Shopping Malls in Tier III Cities and Other Cities. We also established a strict internal screening and reviewing
mechanism to ensure steady and rapid development of our Managed Shopping Malls. As at the end of the Reporting
Period, we had 134 Managed Shopping Malls in operation covering a total operating area of 7,609,067 sq.m., with an
average occupancy rate of 96.2%. Among these Managed Shopping Malls, 90 Managed Shopping Malls, representing
67.2% of the total number of Managed Shopping Malls, were located at East China and North China. The operating
area of the aforesaid Managed Shopping Malls was 5,088,036 sq.m., representing 66.9% of the total operating area of
Managed Shopping Malls. During the Reporting Period, we opened 20 new Managed Shopping Malls and closed fi ve
Managed Shopping Malls. In addition, three Managed Shopping Malls were converted into Portfolio Shopping Malls.
As at the end of the Reporting Period, we had 316 pipeline Managed Shopping Malls under contracts and have
obtained land licenses for these projects. Along with steady social and economic development of the country, further
development of urbanization strategy, and stable growth in disposable income per capita, we will focus on increasing
the rate of expansion of our Managed Shopping Malls business throughout China as our priority.
Note:
(1) “Same mall growth of mature shopping malls” is the growth in average effective unit income from operation for a particular period compared with the
same period in the prior year for all Portfolio Shopping Malls that were in operation for at least three fi nancial years and were still in operation as at
the end of the Reporting Period. In line with the Group’s business development and to better present the performance of our business operation, we
have introduced the “same mall growth of mature shopping malls” as another business operation indicator.

14 Red Star Macalline Group Corporation Ltd.
Management Discussion and Analysis
BUSINESS REVIEW (continued)
2. Business management: Continuous improvement of shopping mall operation and management
2.1 Tenant sourcing management
Continuously improve the strategic layout of our shopping malls, implement new business strategies and lead the
consumption trend of the home furnishings industry
Based on the understanding of the home furnishings consumption trend, the research of all sorts of bestseller products and the analysis of the consumption trend in home furnishings market of various cities, we continuously adjusted the combination of product brand and category in shopping malls to cater for various consumers, market situation and competition status. We endeavored to introduce fl agship stores of major brands that meet consumers’ demand, improved the layout of shopping malls and diversifi ed channels for furnishings brands to display their image by opening street-front stores; meanwhile, we also enhanced our customized house-fi lling products in line with the changing furnishing and decoration market; emerging product categories including overall designs for living rooms and original designs were introduced and promoted in major cities such as Shanghai, Shenzhen, Beijing, Nanjing and Suzhou. Besides, combining cupboards and kitchen appliances, we launched consumption experience interactive programs with kitchen themes so as to enhance consumers’ experience and strengthen their loyalty.
In addition, we maintained diversifi ed businesses to enrich category portfolio by combining the location environment of the shopping mall, property structure and characteristics of consumption need; we continued on incorporating experiential categories such as soft decoration and catering; meanwhile, we piloted the project of “Home Decoration Experience Center” in 12 shopping malls all over the country so as to meet consumers’ increasing demand of home decoration design and successfully introduced tens designer studios, which provided design consultation and decoration service for consumers and increased the fl ow volume in shopping malls. As at the end of the Reporting Period, the operation area of new-type of business including soft decoration, home decoration design and catering have increased by 26% compared with the corresponding period in 2015.
We lead the consumption trend of the home furnishings industry by continuously improving the layout of shopping malls, implementing the strategy of new business and enhancing the consumers’ shopping experience.
Enhance the standards of our refi ned rental management and improve our tenant sourcing management
mechanism
Based on the original mode of rent pricing analysis, we enlarged the scope of sample shopping mall and display booth for analysis, and further refi ned the object and indicator of sample analysis. We also formulated rent pricing models for display booths in different shopping malls and with different categories and classes through “structural rent-increasing analysis” and other regularity analysis approaches, which provided more scientifi c rent pricing basis for lease-signing of new commercial tenants and lease-renewal of old commercial tenants with shopping malls, thereby improving the rent level of shopping malls.
In addition, we have improved the tenant sourcing management mechanism for new businesses by adopting an all-round examination tool to follow up the progress of the tenant sourcing; we compiled and promoted the Instruction Manual for Catering Tenant Sourcing (《餐飲招商指導手冊》) and Instruction Manual for Small Business Owners to Fit-out (《小商戶進場裝修指導手冊》), to provide reference for fi tting-out issues and catering tenant sourcing.

15Annual Report 2016
Management Discussion and Analysis
BUSINESS REVIEW (continued)
2. Business management: Continuous improvement of shopping mall operation and management
(continued)
2.1 Tenant sourcing management (continued)
Constantly strengthen the management of brand resources and enhance the value-added services provided to
our key customers
For brand factory customers, we regularly studied the consumption trends in home improvement and furnishings
industry, analyzed competitive pattern of every factory in accordance with these consumption trends and issued
reports on the development of brand management; aiming at the operating status of the factories, we provided
recommendations on customized product innovation, market development and upgrade of terminal operating
mode of the dealers in order to promote innovation in product development and the transformation and upgrading
of the marketing mode. At the same time, we made innovation in service mode, provided dealer referral service for
some brand factories and continuously optimized the service platform.
We also kept an eye on the future business-expanding opportunities and enhanced interaction between core
dealers in system via pushing of industry dynamics and tenant sourcing information, brand recommendation,
business forum and other approaches, which also boosted the loyalty of core dealers and laid a foundation for
follow-up business expansion.
These measures have been widely recognized and praised by numerous brands that we cooperated with, thus
we have become the benchmarking enterprise that is truly able to provide value-added services in the home
improvement and furnishings industry. During the Reporting Period, we have signed strategic contracts with 132
brand factories.
Step up our efforts in introducing global brands and continue to build the international pavilions
During the Reporting Period, we stepped up our efforts in introduction of global brands. By creating a database,
we effectively managed our dealers for imported furnishings brands, who rendered great support to the
introduction of imported furnishings brands and accelerated the brand integration processes in international
pavilions of respective shopping malls. In addition to the international pavilions established in Tier I and Tier II
Cities, we also deeply investigated potential market to prepare for expansion of global brands in the new emerging
market.
As at the end of the Reporting Period, the global brands we owned amounted to 2,208.
16 Red Star Macalline Group Corporation Ltd.
Management Discussion and Analysis
BUSINESS REVIEW (continued)
2. Business management: Continuous improvement of shopping mall operation and management
(continued)
2.2 Operational management
Improving customer satisfaction through “Word of Mouth Advertising” project
We promoted the “Word of Mouth Advertising” project comprehensively, setting high standards for and strict
requirements on shopping mall operation in respect of price, quality and service etc.
In terms of pricing, we continued to promote the fi rst system of “Discount Control on Home Furnishings Industry”
in the industry to guide the factories and dealers to adjust the infl ated price, rectify the phenomenon of “high
pricing, high discount”, promote reasonable pricing and guide value sales. Based on this system, we took
suffi cient interaction with NDRC, jointly completed and piloted Management Regulations for Price-clearly-marked
Exhibition Room of Red Star Macalline (《紅星美凱龍明碼實價展廳管理規定》). During the Reporting Period,
we have got written approval for implementation from local price management authorities of 12 cities such as
Suzhou, Jinan and Yangzhou. In addition, we implemented strict price management nationwide through all-
channel price comparison system and ensured reasonable commodity pricing.

17Annual Report 2016
Management Discussion and Analysis
BUSINESS REVIEW (continued)
2. Business management: Continuous improvement of shopping mall operation and management
(continued)
2.2 Operational management (continued)
Improving customer satisfaction through “Word of Mouth Advertising” project (continued)
In terms of quality, leveraging on the Ministry of Commerce, the General Administration of Quality Supervision,
Inspection and Quarantine of the PRC (the “AQSIQ”), together with the China Quality Certifi cation Center, we
launched the “Query Platform of Chinese Household Certifi ed Products” in December 2015, which realised the
detection of counterfeit household products. As at the end of the Reporting Period, we completed the system
upload training with 280 major brands, and more than 4.6 million pieces of products were labeled. Besides, during
the Reporting Period, we fi nished source commodity sampling and inspection and evaluation of production quality
control system for 238 factories. We also successfully issued “2016 List of Green and Environmental Protection
Home Furnishings Leading Brands Recommended by Red Star Macalline”. We cooperated with external national
standard compilation experts and jointly complied the Environmental Quality Assessment Standards for Red Star
Macalline Products (《紅星美凱龍商品環保質量評價標準》), an industry standard about product quality which has
been fi led in Technical Supervision Bureau of National Quality Inspection Administration.
In terms of services, we have launched the fi rst
“15-minute Refund” service in the industry which
can be completed within 15 minutes from the
customers putting forward the refund demand to all
the refund formalities being completed. In addition,
the Company has built up a unifi ed image of national
service personnel, established a unifi ed service
standard and launched in 126 pilot shopping malls.
Moreover, we carried out the activity of “Return Visit
for One Million Customers”, which provided visiting
service for customers and surveyed them with
questionnaires, thereby increasing the interaction with customers and boosting their satisfaction.
During the Reporting Period, the “Word of Mouth Advertising” project was promoted successfully in 123 shopping
malls nationwide, and we won the 2016 Retail Innovation Prize awarded by CCFA (China Chain Store & Franchise
Association, 中國連鎖經營協會).

18 Red Star Macalline Group Corporation Ltd.
Management Discussion and Analysis
BUSINESS REVIEW (continued)
2. Business management: Continuous improvement of shopping mall operation and management (continued)
2.2 Operational management (continued)
Improving customer satisfaction through “word of mouth advertising” project (continued)
In terms of operational standards, we compiled the “Environmental Quality Assessment Standards for Red Star
Macalline Products (《紅星美凱龍商品環保質量評價標準》) during the Reporting Period and have applied for the
fl ing of industrial standards. Our “Credit Classifi cation Management of Tenants” was nominated by the Publicity
Department of the CPC Central Committee and recommended by the Ministry of Commerce of the People’s
Republic of China (the “Ministry of Commerce”) as one of the “100 Renowned Experiences of Cultivating and
Practicing the Socialist Core Values” cases; it was selected by the Ministry of Commerce as the “Key Propulsion
Unit of Business Integrity Construction” in China, and participated in the drafting of laws and regulations of
“Guiding Opinions of the Ministry of Commerce on Promoting and Standardizing the Construction of Credit Rating
Mechanism for Marketization” (商務部關於促進和規範市場化信用評價機制建設的指導意見). We completed the
information sharing of our credit platform in March 2016, which is one of the fi rst sub platforms of the Shanghai
Commercial Credit Public Service Platform (上海市商務誠信公眾服務平台) and was selected as “2016 Top
Ten Typical Cases of Credit in Shanghai”. Besides, we formulated 2016 Inspection Standard for Imported Home
Furnishing Products Recommended by Red Star Macalline (《2016年紅星美凱龍推薦家居出口產品核查標準》),
the fi rst certifi cation system in home furnishing industry, which provided helpful reference for management of
imported home furnishing products in China.
Improving operational management effi ciency by means of digital space management
We consolidated the information of space and operation of shopping malls and converted complicated data into
user-friendly charts by using digital space management, and we systematically managed the KPI indicators of our
malls including occupation of exhibition space, rental rates, occupancy rate and collection rate with our visualised
space management platform, which improved the overall operation effi ciency of our malls.
Continuingly launch “Leading Green” campaigns to promote consumers’ green home life quality
In terms of environmental protection, we continued to promote the campaigns of “Leading Green” brand
appraisal, and initiated an omni-directional quality management system for pre-sales, sales and after-sales, to
ensure the standard of healthy living of each consumer. During the Reporting Period, over 368 famous home
furnishings brands had proactively participated in the campaign of “Leading Green” brand appraisal. Our shopping
malls provide “Leading Green Brands Appraisal of Home Improvement and Furnishings” manuals as professional
guidance for consumers to buy healthy and environmental-friendly products. At the same time, the “Green
Household Consumption Festival” campaign was launched across our shopping malls on an ad-hoc basis.

19Annual Report 2016
Management Discussion and Analysis
In the celebration for 30th anniversary, we produced a brand image fi lm, Better Routine, and also put forward the slogan of “Design for Chinese Life” to clarify that we are devoted to bringing better quality life for every Chinese family. The brand image fi lm won the prize of the most infl uential brand in the international advertisement festival in Fusan, Korea.

20 Red Star Macalline Group Corporation Ltd.
Management Discussion and Analysis
BUSINESS REVIEW (continued)
2. Business management: Continuous improvement of shopping mall operation and management
(continued)
2.3 Marketing management
Continuingly raising our level of brand communication so as to strengthen our “Home Furnishings Expert”
corporate image
We leverage on a series of nationwide large-scale promotional campaigns such as “The Two Days”, “Sleep
Day”, “May Day Holiday”, “Membership Day”, and “Anniversary” and social marketing means to promote the
brand and transmit the positioning as “Home Furnishings Expert”, thereby boosting the continued dissemination
effectiveness of the brand.
We actively promoted the concept of “Home Life Aesthetic” and promoted high-quality home concepts by We-
media platforms such as “WeChat” to lead the home consumer values. At the same time, we tailored the selection
guide and brand communication program with practical value for brands settled in the Red Star platform to
enhance the awareness and reputation of cooperation brands in consumers. During the Reporting Period, more
than 184 articles regarding the home aesthetic were released and have been read for over 460,000 times in total;
there were 28 original articles about selection guide and have been read for over 760,000 times in total.

21Annual Report 2016
Management Discussion and Analysis
BUSINESS REVIEW (continued)
2. Business management: Continuous improvement of shopping mall operation and management
(continued)
2.3 Marketing management (continued)
Continuingly raising our level of brand communication so as to strengthen our “Home Furnishings Expert”
corporate image (continued)
We place importance on the unifi ed management to the brand
image of “Red Star Macalline”. Through digital technology, we
developed a brand visual management system, “Brand Rubik’s
Cube”, providing solutions to the brand visual management of
“One Thousand Appearances for One Thousand Stores and
One Appearance for One Thousand Stores”, which not only
secured the unifi ed management of the brand image of “Red
Star Macalline” throughout the country, but also secured the
demonstration of the individuation of different malls, so as to
realise systematic, real-time and effi cient management.
Upgrading the digital marketing platforms and membership
service systems to carry out socialized membership marketing
During the Reporting Period, we opened up the online and
offl ine membership systems of shopping malls, corporate
offi cial website, WeChat subscription account, WeChat service
account, HXshop.com and home decoration business to achieve
the integration of the Red Star Macalline membership system,
and conducted unifi ed management of the accounts, rights and
experience of members to provide convenient shopping process
for members and enables us to better understand the needs of members.
By adopting the method of “one code one voucher”, we connected each stage of “propagation – customer
accumulation – interaction – consumption – customer accumulation” and established a complete closed-loop
marketing strategy which provided data basis for our customer-channeling and comparative analysis of fi nal sales,
thereby remarkably improving the effi ciency of sales content advertising.
The “Brand Rubik’s Cube” of Red Star Macalline won the management innovation gold prize of ECI Awards. Note: The ECI Awards, founded by the International E-Commerce Innovation Association, is an international award with “innovation” as evaluating standards aiming at the digital business.
22 Red Star Macalline Group Corporation Ltd.
Management Discussion and Analysis
BUSINESS REVIEW (continued)
2. Business management: Continuous improvement of shopping mall operation and management
(continued)
2.3 Marketing management (continued)
Upgrading the digital marketing platforms and membership service systems to carry out socialized membership
marketing (continued)
We attracted members to proactively take depth interaction with us through Wechat platform, promotion
activities, loan of home furnishings and other approaches so as to carry out socialized membership marketing,
make us understand users’ demand and further provide customized service and marketing plan, thereby giving
members differentiated experience effect and effectively boosting their loyalty.
At the same time, we greatly improved the marketing effi ciency and reduced the cost of savings customers by
means of increasing the variety of WeChat activities and the number of WeChat pilot cities as well as obtaining the
access to WeChat coupons in online and offl ine shopping malls based on the existing digital marketing platforms
(including the online platforms of WeChat subscription account and WeChat service account). As at the end of the
Reporting Period, there have been 1.95 million registered WeChat members in total.
During the Reporting Period, we recruited 2.14 million new members through various channels including Wechat,
shopping mall, property for sale and online platforms. Among which, members with consumption records spent
about RMB28,000 on average in the same year and the aggregate tenants sales volume amounted to RMB22.13
billion in total.
Note: new members are clients who have registered through online or offl ine platform during the Reporting Period and have at least one interaction
with us.
Extending the channels with different industries to carry out precision marketing
By means of cross-industry cooperation and precision marketing, we constantly extended the marketing channels
of home improvement and furnishings shopping malls. As for the market of new houses, we rapidly extended
our channels to 6,050 premium housing buildings in 128 cities nationwide by virtue of the strategic cooperation
with brand land agents and housing platform agents; in terms of second-hand housing market, we successfully
innovated data-marketing mode, which solved two diffi culties in second-hand housing market, namely the
scattered proprietor distribution and the high communication cost. Through deep industry investigation and
concentrated regional trial, we fi nally formed a new marketing mode which took diversifi ed channel data as the
core and realised transformation by precise screening and concentrated invitation. Furthermore, we have started
to promote and duplicate the mode on a national scale.

23Annual Report 2016
Management Discussion and Analysis
BUSINESS REVIEW (continued)
2. Business management: Continuous improvement of shopping mall operation and management
(continued)
2.3 Marketing management (continued)
Extending the channels with different industries to carry out precision marketing (continued)
In August 2016, Red Star Macalline and Greentown Service reached national strategic cooperation, intending to
forge a big cooperation league covering brand real estate, real estate platform and nationwide property platform.
Red Star Macalline and Greentown Service entered into a nationwide strategic cooperation
In addition, we also actively discussed the possibility of cooperation with a number of banks, real estate
agents, travel agencies, and car brands. During the Reporting Period, we developed a large number of potential
customers through interaction across different industries and precision marketing, and achieved a high conversion
rate of potential customer to customer.
Consolidating factory resources of premium brands to realise joint marketing and establish market infl uence
We established intimate strategic cooperation with all the famous home furnishing brands in the industry within
the long-time synergetic development. Through consolidation of factory resources of premium brands, we
excavated brand demand deeply, expanded cooperation depth and scope and helped brand factories to carry
out customized and exclusive marketing activities. Meanwhile, we promoted this mode in our nationwide home
furnishing system, which continuously enhanced market infl uence via cross regional joint-marketing and has
become one of the most famous marketing modes in the industry.

24 Red Star Macalline Group Corporation Ltd.
Management Discussion and Analysis
BUSINESS REVIEW (continued)
2. Business management: Continuous improvement of shopping mall operation and management
(continued)
2.3 Marketing Management (continued)
Consolidating factory resources of premium brands to realise collaborating marketing and establish market
infl uence (continued)
During the Reporting Period, we made continuous innovation in joint marketing mode, promoted service quality
and carried out many marketing activities, such as big joint promotion, super brand day, home expo, provincial
purchase convention, peak discount and celebrity show. Meanwhile, we beefed up the consolidation of premium
resources, introducing tens of famous brand factories sources including Chivas, Xilinmen, Sofi a, Kuka and Mellkit.
We also jointly organized industry-infl uencing publishing events with several big brands. All these measures
remarkably improved brand infl uence and sales level.
2.4 Property Management
Advocating energy saving and environmental protection and creating green shopping malls
We advocated energy saving and environmental protection and devoted ourselves to constructing energy-saving
and environmentally friendly properties and building green shopping malls. We managed energy and pollution
source through the wide application of LED energy and other scientifi c and technological progresses, which
benefi ted images of malls and continuously reduced energy consumption. During the Reporting Period, electricity
consumption in 47 malls decreased by 4.9% year on year. We conducted daily quantitative management in
product protection with failure rate of ground, walls, ceilings, lamps, doors and windows decreasing from 2.7% at
the beginning of the year to 1.1%.
Improving the environment of shopping malls and enhancing the shopping experience of our customers
We made continuous improvements on environmental quality of shopping malls through “Ten Services” standard,
namely ground, lighting, toilets, temperature, air, parking lot, greening, etiquettes, waterproofi ng and elevators.
Meanwhile, we utilised all sorts of new tools such as cleaning machine of elevators, high-pressure water cannon,
balance car, ladder truck, luxmeter and roughness meter, effectively improving work effi ciency and quality.

25Annual Report 2016
Management Discussion and Analysis
BUSINESS REVIEW (continued)
2. Business management: Continuous improvement of shopping mall operation and management
(continued)
2.4 Property Management (continued)
System coming fi rst, standardized management, strict inspection, and professional training for security of malls
With lifetime of equipment of malls extended, the introduction of different industries like catering industry
normalised and the environment of malls increasingly complicated, security control became our new challenge
in mall management. We formulated technological requirements and safety standards in system in such high-
risk areas such as different industries, neighboring properties and contaminated places. Moreover, we teased
out records of risk of malls and guarded against and excluded potential safety problems by a series of work like
checking safety problems by professional apparatus and organizing fi re drills and publicity. Given that safety
risk of malls depended on people’s responsibility and initiative, we kept enhancing professional training of real
property management practitioners and comprehensively evaluated all employees’ performance and lifted their
work effi ciency and positivity. During the Reporting Period, we maintained zero accident in terms of fi re, injuries
and key facilities, greatly controlled safety risk and constantly raised safety level of malls.
3. Expanding Business: Robust Development
Our various business segments that are currently underlying the expansionary phase fl ourished during the Reporting
Period. We offi cially launched the “1001” strategy, based on which we carried out upstream and downstream cross-
border business extension, and built up a business life community for pan-home improvement and furnishings industry
with the orientation on the “omni-channel platform service provider for the pan-home improvement and furnishings
industry” and by upholding the core concept “home”. During the Reporting Period, our internet platform was offi cially
launched, which provided consumers with industry chain services for pan-home improvement and furnishings
consumption ranging from home purchase to home renovation and purchase of household-related products. Our
household fi nancing services were further extended, with a view to retain and expand our customer and tenant base.
We also provided full-range and all-dimensional logistics services to satisfy multiple needs of users on both ends of the
platform so as to realise resources sharing.
26 Red Star Macalline Group Corporation Ltd.
Management Discussion and Analysis
BUSINESS REVIEW (continued)
3. Expanding Business: Robust Development (continued)
3.1 Internet-based Pan-Home Consumption
We have established the internet-based platform building on the concept of “home”, which provides consumers
with industry chain services for pan-home improvement and furnishings consumption ranging from home
renovation to purchase of household-related products through the online and offl ine integrative business model.
We have fully integrated and shared the business resources of the online home improvement and furnishings
consumption platform with its offl ine real shopping mall network by digitally transforming and upgrading the
existing home improvement and furnishings mall. Through these efforts, the Company succeeded in providing
convenient and quality services and O2O interactive experience to our customers. At the same time, we had
achieved synergies between the offl ine business and the expansionary business on the internet, further improving
overall operation effi ciency and maximizing value creation.
Internet-based Home Improvement
Home decoration business is an upstream extension in the home improvement and furnishings retail industrial
chain. Due to a high level of overlap between home furnishings consumers and home decoration consumers, we
leverage on the home furnishings shopping malls as a platform and join forces with our strong brand impact, to
effi ciently reduce the cost of customer acquisition and marketing for the development of our home decoration
business. As the industry pioneer in transformation and upgrade, our home decoration business aims to integrate
the upstream and downstream industrial chain in the home decoration industry by using the home furnishing
shopping malls as a platform and our great brand impact. We provided full services integrating home furnishings
design proposals, sale of materials and furniture and construction service for consumers, in order to improve the
shopping experiences of our consumers, and drive sales in our shopping malls.
We established an experienced household design team by the subsidiary, Shanghai Betterhome Decoration
Engineering Co., Ltd (“BetterHome”), and set up home decoration stores in our household decoration malls
to provide customers with integrated service of home design and decoration and create synergy effect with
businesses of home decoration malls. As at the end of the Reporting Period, we have 30 online and offl ine home
decoration stores across the country, which were located in our shopping malls in cities such as Beijing, Tianjin,
Shanghai, Nanjing, Shenyang and Chengdu.
During the Reporting Period, we established internet home decoration platform focusing on design and introduced
such product programs as content, designers and investment attraction to offer users online display of design
content and online communication and reservation of designers and a series of home decoration tool services etc.
As at the end of the Reporting Period, our internet home decoration platform has signed agreements with 143
shops and 1,093 original articles were published.

27Annual Report 2016
Management Discussion and Analysis
BUSINESS REVIEW (continued)
3. Expanding Business: Robust Development (continued)
3.1 Internet-based Pan-Home Consumption (continued)
Internet Retail (continued)
During the Reporting Period, the Company established an online retail platform. The platform is designed to
cover a series of convenient services including products display, consultancy, membership marketing, online
transaction, guidance for offl ine stores in shopping mall and booking experience. Online and offl ine interaction
helps to expand our Company’s communication channels with our consumers, enhance their satisfaction and
loyalty, and drive the overall consumption demand. The online retail platform is mainly materialized through mobile
APP user portal, and it covers a complete set of household-related products, including furniture, construction
material, electrical appliance, furnishing and textile. While integrating certain merchant resources of the offl ine
shopping malls of Red Star Macalline, the Company proactively explored the brands and stores which conduct
online business only, thus providing abundant and more diversifi ed choices for consumers. With the unique
business application of SPU (Standardized Product Unit) for brand suppliers offered through the internet-based
retail platform of the Company, we have successfully created the commodity management model centered on
SKU (Stock Keeping Unit).
As the offl ine shopping malls still constitute an integral part of consumer experience and purchasing decisions,
the strategic focus of our internet retail platform rests on bringing into play the advantages of combining with
the offl ine shopping malls. On one hand, the online platform provides unlimited long tail display space for offl ine
merchants and products, breaking the limits of product display faced by offl ine merchants and enabling the
information about the products and stores available to consumers in a more convenient and effi cient way. On
the other hand, leveraging on the extensive network of offl ine shopping malls of “Red Star Macalline”, we meet
consumers’ demand for on-site experience in the home improvement and furnishings industry, thus providing
our clients with one-stop services covering election and purchase of goods, promotional activities, logistics and
distribution, and after-sales service.
As at the end of the Reporting period, the Company has attracted 1,782 brands and 3,615 tenants to sign-up for
its internet-based retail platform. Based on the self-developed O2O system, 13 offl ine shopping malls of Red Star
Macalline succeeded in connecting with the products and services from the online platform, covering cities such
as Shanghai, Nanjing, Suzhou and Changsha.

28 Red Star Macalline Group Corporation Ltd.
Management Discussion and Analysis
BUSINESS REVIEW (continued)
3. Expanding Business: Robust Development (continued)
3.2 Improved home furnishings fi nancial services: retaining and expanding our consumer and tenant base
We use HomeFax as an Internet fi nancial information service platform to provide relevant service of fi nancing for
our shopping mall partners, home furnishings factories and tenants. Such platform provides information service
and conducts strict risk appraisal through professional risk control system, credit information of third parties,
central bank credit reference system and the “Star Cloud System”, to satisfy the fi nancing demands of our
shopping mall partners, home furnishings factories and tenants.
We provided petty loan services to partners of the Group and fi nancial support for its development by giving
full play to the Company’s ability to control risk and to conduct a comprehensive evaluation of the risk profi le
of the partners. As of the end of the Reporting Period, we accumulatively granted petty loans in the amount of
RMB189.8 million.
During the Reporting Period, we further expanded our business of prepaid card services and customer fi nancial
services. We issued prepaid card or provided installment services to customers by cooperation with banks to
satisfy funding raising and use needs of customers related with home furnishing, which interlinked home furnishing
fi nancial services with customers, increased customers’ loyalty on our products and services and raised sales
level of shops of malls. During the Reporting Period, we issued prepaid cards with aggregate denomination
amounted to RMB1,393 million with the relevant income from commission amounted to RMB17.6 million. We
provided customers with RMB492 million consumption loans through cooperation with banks and recorded
relevant operating income in the amount of RMB13.6 million.
3.3 Comprehensive logistic service: satisfying multiple needs on both ends of the platform and achieving
resources sharing
In the terminal service ecosystem of the home furnishings and furniture industry, the logistics and distribution is
the direct interface with our consumers. As a result, the quality of logistic service has an impact on the reputation
of relevant brands. In order to provide professional distribution and installation services to our tenants and
consumers to facilitate the “Last Mile” offering of distribution, installation and after-sale services, and to improve
customer satisfaction and loyalty to the brands of our tenants as well as the brand of Red Star Macalline. We
set up logistics trial centers in Nanjing, Wuxi, Shijiazhuang, Changsha and Shenyang to provide “one-stop”
professional services for customers from purchase to professional product distribution and installation. As at
the end of the Reporting Period, more than 330 brands have commenced operations with our logistics service
business, with a storage area of approximately 30,000 sq.m. in total.

29Annual Report 2016
Management Discussion and Analysis
BUSINESS REVIEW (continued)
3. Expanding Business: Robust Development (continued)
3.3 Comprehensive logistic service: satisfying multiple needs on both ends of the platform and achieving
resources sharing (continued)
We were further improving business processes and effectively enhanced customer experience and service
effi ciency through “one-click ordering” by salesman of home furnishing malls, real-time inquiry of inventory,
customers’ feedbacks, three-year quality warranty and free disassembly, assembly and cleaning.
4. Upgrade and restructuring of information technology infrastructure and support for our internet-based platform
During the Reporting Period, in line with our Company’s development of the internet-based business, we further
upgraded and restructured our information technology infrastructures.
We have accumulatively uploaded information of 163 shopping malls on the “Star Cloud System”, which is the leading
comprehensive enterprise resource planning system used in the home improvement and furnishings industry. Full
access of malls enabled us to collect, analyse and utilise big data of malls, shops and customers better and helped
devise targeted business strategy, raise refi ned management level and improve our management and administration
performance.
In terms of development of information system, we have increased the investment in and the proportion of self-
construction. By self-construction and upgrading core information modules and systems, we would further master
underlying architectures and core technical patterns of relevant systems, ensure sustainable development of information
system and effectively accumulate our big data assets.
During the Reporting Period, we launched the “Dragon’s Eyes” system, an APP platform developed for in-house
employees and internal management of the Group. Business support functions as required by the staff-end were
integrated into the “Dragon’s Eyes” system, and as a result, both the effi ciency of the operation of our employees and
the effi ciency of the management of the Group had been enhanced effectively.
We carried out further research and upgrade in respect of the tenant sourcing system. In addition to the intuitive display
of the tenant sourcing system, the real-time monitoring and alert and the improvement in refi ned management through
the analysis of tenant sourcing and operation data, we also initiated research and development on the online tenant
sourcing system to align with the plan for the development of our internet-based business. Our goal is to connect the
online and offl ine channels and establish an online and offl ine tenant sourcing platform.
Meanwhile, we proactively build our “Smart Shopping Mall” IT project. At present, the infrastructure of WIFI and
positioning system for four shopping malls has been completed. The construction of “Smart Shopping Mall” would
further improve customers’ shopping experience, promote sales of shops and create value-added service incomes.

30 Red Star Macalline Group Corporation Ltd.
Management Discussion and Analysis
BUSINESS REVIEW (continued)
5. High effi ciency of human resources management policies: effectively support the Group’s growth
During the Reporting Period, our human resources policies were strictly in line with our strategies and achieved success in a number of aspects, such as systems optimization, evaluation of overall performance, employee incentivization and talent development and support, as well as industry talent training.
In terms of system optimization, we had adopted a comprehensive approach to the implementation of the human resources system. As at the end of the Reporting Period, our human resources system has covered 200 shopping malls currently in operation, 52 shopping malls under the progress of preparation, and 26 business units, thus achieving the full coverage of the human resources system in home furnishing shopping malls.
With regard to the performance evaluation and employee motivation, we introduced the system of “performance evaluation for all employees”, and made every employees involve in the performance management and assessment. The pragmatic and advanced nature of the performance index system, performance and accountability system and motivation system was also strengthened. These systems had become the important tools for employees management within the Group. Through various incentives methods such as evaluation on the employees’ performance and performance-based bonus, the enthusiasm and energy for work of employees are motived and released. During the Reporting Period, we improved the employee’ s work effi ciency and reduced the number of employees at the service area per unit, realizing the objective of streamline on work force and administration by adopting effi cient appraisal and incentive measures. We make adjustment to the human resources structure for the employee and reduce back-offi ce support employees and increase service staffs and improve the effi ciency while ensuring the quality of service and management.
Regarding the development of and support for talents, we have established the competency model for the key post of the general manager of shopping malls, the BEI (Behavioural Event Interview) interview manual, the capability development manual, and improved the promotion management system for key posts, with a view to providing talent support to the development of the Group’s operation. We recruited and cultivated excellent university graduates by “Star Motivation” program to attract and prepare talents for development of the Company. Having been conducted for ten years, the program recruited and fostered over 1,300 excellent graduates. We recruited and cultivated general managers for malls by “Elites” program to prepare talents for strategic goals of the Group and ensure competence of successive people. During the Reporting Period, we continued to carry out “New Youth” plan, encouraged innovation, awarded innovative measures, tried to fi nd innovative people and built management teams with more innovation awareness and more vigor. Our “New Business Boosting Team” built management team and core professionals for development of new business, infused new vigor into and laid solid foundation for sustainable development of new business of the Group.
Regarding professional talent cultivation, we provide sound systems of development and training courses for all departments and employees in different levels to continuously improve the capability of management team and employees. We have also established “Lu Ban Academy” and carried out several training plans, in order to improve the comprehensive quality of employees who engage in home improvement and furnishings industry.
During the Reporting Period, we have been awarded “The Best Enterprise University” by China Chain Store & Franchise Association for six consecutive years and “The Best Employer” by Institute of Social Survey research centre and Zhilian Zhaopin (智聯招聘) for four consecutive years.
We had a total of 19,060 employees as at the end of the Reporting Period.

31Annual Report 2016
Management Discussion and Analysis
FINANCIAL REVIEW
The key fi nancial performance indicators of the Company can generally be categorized into revenue, profi ts attributable to
owners of the Company and core net profi t attributable to owners of the Company. These indicators provide a measure of
our performance against the key drivers of the Company. For details of the fi nancial performance indicators, please refer to
“Revenue” and “Profi t, core net profi t attributable to owners of the Company and earnings per share” on pages 31 to 32 and
page 36 respectively.
1. Revenue
In 2016, the Group’s revenue was RMB9,282.4 million, representing an increase of 6.0% from RMB8,756.1 million in
2015. The stable growth in our revenue was primarily due to an increase in revenue from our Owned/Leased Portfolio
Shopping Malls.
The following table sets forth our revenue by business segment:
For the year ended 31 December
2016 2016 2015 2015
(RMB’000) % (RMB’000) %
Owned/Leased Portfolio Shopping Malls 5,870,695 63.2 5,259,961 60.1
Managed Shopping Malls 2,740,945 29.5 3,141,708 35.9
Sales of merchandise and related services 205,442 2.2 115,838 1.3
Others 465,311 5.1 238,613 2.7
Total 9,282,393 100.0 8,756,120 100.0
• Owned/Leased Portfolio Shopping Malls: The income rose from RMB5,260.0 million in 2015 to RMB5,870.7
million in 2016, representing an increase of 11.6%, mainly due to the increase of operating area, the average rent
and management fee. As at the end of 2016, the number of portfolio shopping malls opened by the Group was
more than that at the end of 2015 by 11, with the corresponding increase in the total operating area of 697,198
sq.m. At the same time, we used centralized management and scale effect to make all shopping malls have
marketing synergy, and offered merchants promotions and other value-added services, enhanced the operation
and management level of the mall, then ensured that the level of rent and management fees could increase when
the already opened mall renewed the agreement with merchants. In 2016, the average operating income of real
unit of portfolio shopping malls opened by the Group was RMB113/sq.m per month, which fell slightly compared
with RMB114/sq.m per month in 2015, mainly due to lower operating income of the newly opened shopping malls
during the Reporting Period; since the beginning of 2015, the operating income of the already opened mall kept
growing, and the same mall growth rate of mature shopping malls was 5.2% in 2016.

32 Red Star Macalline Group Corporation Ltd.
Management Discussion and Analysis
FINANCIAL REVIEW (continued)
1. Revenue (continued)
• Managed Shopping Malls. Revenue decreased from RMB3,141.7 million in 2015 to RMB2,740.9 million in 2016,
representing a decrease of 12.8%, which was mainly due to the decrease of revenue from services of construction
consultation and management fees.
2. Cost of sales and services
The cost of sales and services of the Group mainly included staff salary, malls rent and fi xed expenses etc. that were
directly related to the operation of our Owned/Leased Portfolio Shopping Malls. The cost of sales and services of the
Group increased from RMB2,242.0 million in 2015 to RMB2,658.2 million in 2016, representing an increase of 18.6%,
mainly because the number of operational staff and the salary and welfare increased due to the expansion of the
shopping mall network of the Company.
The following table sets forth our cost of sales and services by business segment:
Year ended 31 December
2016 2016 2015 2015
(RMB’000) % (RMB’000) %
Owned/Leased Portfolio Shopping Malls 1,403,606 52.8 1,224,836 54.6
Managed Shopping Malls 939,804 35.4 823,170 36.7
Sales of merchandise and related services 134,882 5.1 90,003 4.0
Others 179,880 6.7 103,972 4.7
Total 2,658,172 100.0 2,241,981 100.0
• Owned/Leased Portfolio Shopping Malls: the cost of sales and services increased by 14.6% from RMB1,224.8
million in 2015 to RMB1,403.6 million in 2016, mainly due to the increase of salary of relevant staff in the newly
opened shopping malls in the current period and the second half of the previous period and the increase of
provision of annual bonus in the current period.
33Annual Report 2016
Management Discussion and Analysis
FINANCIAL REVIEW (continued)
2. Cost of sales and services (continued)
• Managed Shopping Malls: the cost of sales and services of Managed Shopping Malls increased from RMB823.2
million in 2015 to RMB939.8 million in 2016, representing an increase of 14.2%, mainly due to the signifi cant
increase in the number of our Managed Shopping Malls opened as at the end of 2016 as compared with that as at
the end of 2015.
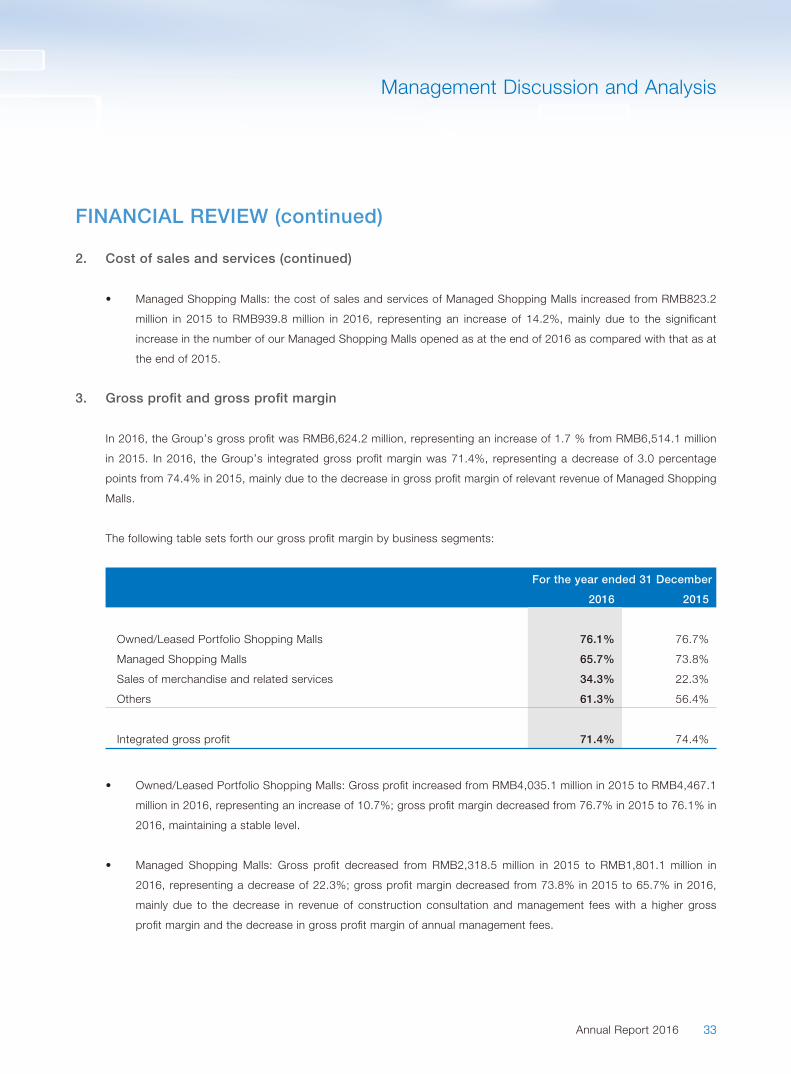
3. Gross profi t and gross profi t margin
In 2016, the Group’s gross profi t was RMB6,624.2 million, representing an increase of 1.7 % from RMB6,514.1 million
in 2015. In 2016, the Group’s integrated gross profi t margin was 71.4%, representing a decrease of 3.0 percentage
points from 74.4% in 2015, mainly due to the decrease in gross profi t margin of relevant revenue of Managed Shopping
Malls.
The following table sets forth our gross profi t margin by business segments:
For the year ended 31 December
2016 2015
Owned/Leased Portfolio Shopping Malls 76.1% 76.7%
Managed Shopping Malls 65.7% 73.8%
Sales of merchandise and related services 34.3% 22.3%
Others 61.3% 56.4%
Integrated gross profi t 71.4% 74.4%
• Owned/Leased Portfolio Shopping Malls: Gross profi t increased from RMB4,035.1 million in 2015 to RMB4,467.1
million in 2016, representing an increase of 10.7%; gross profi t margin decreased from 76.7% in 2015 to 76.1% in
2016, maintaining a stable level.
• Managed Shopping Malls: Gross profi t decreased from RMB2,318.5 million in 2015 to RMB1,801.1 million in
2016, representing a decrease of 22.3%; gross profi t margin decreased from 73.8% in 2015 to 65.7% in 2016,
mainly due to the decrease in revenue of construction consultation and management fees with a higher gross
profi t margin and the decrease in gross profi t margin of annual management fees.

34 Red Star Macalline Group Corporation Ltd.
Management Discussion and Analysis
FINANCIAL REVIEW (continued)
4. Other income
Other income of the Group mainly include interest income from bank deposits, other loans and receivables, government
grants and received and compensatory payment receivable.
Other income was RMB199.4 million in 2016 (other income were RMB194.3 million in 2015), of which the interest
income was RMB96.1 million and government grants were RMB85.9 million.
5. Other gains and losses
Other gains and losses of the Group mainly include the change in net of the provision for doubtful debts, impairment
loss on available-for-sale equity investments and intangible assets, gains and losses of disposal of property, plant and
equipment and gains and losses of disposal of subsidiaries. Other losses were RMB567.3 million in 2016 (other losses
were RMB206.3 million in 2015), of which the allowance for doubtful debts was RMB336.5 million, mainly because
we adopted a more conservation standard when reviewing the trade receivables related to the income of Managed
Shopping Malls.
6. Sales and distribution expenses
The sales and distribution expenses of the Group mainly include advertising and marketing expenses, energy and
maintenance costs, salary costs of marketing personnel and new business related staff, after-sales service expenses,
etc. The sales and distribution expenses increased from RMB1,196.9 million in 2015 to RMB1,205.7 million in 2016
representing an increase of 0.7%; the proportion of the sales and distribution expenses in the revenue of the Group
decreased from 13.7% in 2015 to 13.0% in 2016.
7. Administrative expenses
Administrative expenses of the Group mainly include the salary and welfare expenses of the administrative personnel,
offi ce expenses, property tax, other miscellaneous taxes and professional fees. Administrative expenses were
increased from RMB882.4 million in 2015 to RMB1,149.3 million in 2016 with an increase of 30.2%; the proportion of
administrative expenses in the revenue of the Group increased from 10.1% in 2015 to 12.4% in 2016, which was mainly
because the Group expanded its operation scale and developed new businesses which resulted in the increase of
employee compensation and offi ce expenses.

35Annual Report 2016
Management Discussion and Analysis
FINANCIAL REVIEW (continued)
8. Finance costs
The fi nance costs of the Group mainly include interest in bank and other loans, interest in fi nance lease and interest
in bonds. Finance costs were increased from RMB854.3 million in 2015 to RMB949.2 million in 2016 with an increase
of 11.1%. The total interest expenses decreased from RMB1,250.7 million in 2015 to RMB1,209.2 million in 2016,
representing a decrease of 3.3%, which was mainly due to the overall decrease of market interest rate during the
Reporting Period, the improvement of effi ciency in the use of funds of the Group, optimization of loan structure,
issuance of onshore corporate bonds with lower coupon rate and reduced average fi nancing cost.
The fi nance costs of the Group were mainly affected by relevant interest-bearing bank loans and bonds balance
required by property investment. With the completion of the investment property and the opening of the relevant
malls, we will no longer capitalize interest expense associated with the investment properties and record it as the cost.
Capitalized interest expenses decreased from RMB396.4 million in 2015 to RMB260.1 million in 2016, representing a
decrease of 34.4% mainly due to the completion of the construction of part of shopping malls and the cessation of the
capitalization.
9. Treasury Policies and Objectives
The Group adopted prudent liquidity risk management policies in order to maintain fl exibility of fund utilization, which
include maintaining suffi cient cash and funding through an adequate amount of committed credit facilities.
10. Income tax expense
In 2016, the income tax expenses of the Group were RMB1,358.8 million, representing a drop of 13.6% compared with
RMB1,572.6 million in 2015, with the decrease rate higher than that of the pre-tax profi t. Through effective tax planning,
the rate of the effective income tax decreased from 26.5% in 2015 to 23.7% in 2016.

36 Red Star Macalline Group Corporation Ltd.
Management Discussion and Analysis
FINANCIAL REVIEW (continued)
11. Profi t, core net profi t attributable to owners of the Company and earnings per share
In 2016, profi t attributable to owners of the Company amounted to RMB4,036.3 million, representing a decrease of
1.5% from RMB4,098.1 million in 2015; core net profi t attributable to owners of the Company amounted to RMB2,554.7
million, remaining relatively fl at compared with that of RMB2,552.7 million in 2015. The above was a result of the
decrease in proportion of a higher gross profi t margin business.
For the year ended 31 December
2016
(RMB’000)
2015
(RMB’000)
Growth
Profi t attributable to owners of the Company 4,036,269 4,098,068 -1.5%
Profi t margin attributable to owners of the Company 43.5% 46.8% -3.3ppts
Core net profi t attributable to owners of the Company 2,554,746 2,552,735 0.1%
Core net profi t margin attributable to owners of the Company 27.5% 29.2% -1.7ppts
In 2016, the Group’s earnings per share was RMB1.11, comparing with RMB1.22 in 2015.
12. Trade and other receivables
As at the end of the Reporting Period, the trade and other receivables of the Group were RMB2,008.5 million, of which
the trade receivables and bills receivable were RMB836.3 million, which were mainly the outstanding fi rst entrance fee
to be paid by partners of Managed Shopping Malls and the construction consultation and management fees to be paid
by the contractors. The trade and other receivables decreased by RMB132.5 million at the end of 2016 compared with
that at the end of 2015. It was mainly because the Group increased the efforts in the collection of trade receivables
during the Reporting Period and the allowance for doubtful debts of outstanding amounts in previous years has
increased.
13. Investment properties and changes in fair value of investment properties
As at the end of the Reporting Period, the Group’s book value of investment properties amounted to RMB77,090.0
million, representing an increase of 9.2% from RMB70,593.0 million as at the end of 2015, which was mainly due to
the increase of rental rate of our owned malls and advancement of project progress of investment properties under
construction during the Reporting Period. In 2016, the Group gained RMB2,652.2 million due to the increase in fair
value of investment properties mainly because the rise of rent and management fees of owned malls and completion
and opening of several shopping malls under construction in some developed cities during the Reporting Period
resulted in the increase in fair value of investment properties. The Group will continue to derive rental income from
the investment properties and may consider disposing certain investment properties as and when appropriate and in
accordance with market conditions.

37Annual Report 2016
Management Discussion and Analysis
FINANCIAL REVIEW (continued)
14. Capital expenditures
The Group’s capital expenditures were primarily related to acquisition and construction expenditures for investment
properties. In 2016, the Group’s capital expenditures amounted to RMB3,189.9 million (in 2015, the Group’s capital
expenditures amounted to RMB3,288.1 million), primarily due to advancement of project progress of investment
properties under construction.
15. Bank balances, cash and cash fl ow
As at the end of the Reporting Period, the Group’s bank balances and cash were RMB6,150.2 million, representing an
increase of RMB196.1 million from RMB5,954.1 million as at the end of 2015.
For the year ended 31 December
2016 2015
(RMB’000) (RMB’000)
Net cash from (used for) operating activities 3,893,741 3,309,333
Net cash from (used for) investment activities (5,016,660) (3,912,985)
Net cash from (used for) fi nancing activities 1,266,880 2,859,712
Net increase in cash and cash equivalents 143,961 2,256,060
In 2016, the Group’s net cash infl ow from operating activities was RMB3,893.7 million, representing an increase of
17.7% from RMB3,309.3 million in 2015, mainly due to the increase of pre-received rental and service fee of the Group
during the Reporting Period.
In 2016, the investment activities of the Group generated a net cash outfl ow of RMB5,016.7 million, representing an
increase of 28.2% compared with a net outfl ow of RMB3,913.0 million in 2015, which was mainly due to the increase of
payment of various projects and investment of the Group during the Reporting Period.
In 2016, the fi nancing activities of the Group generated a net cash infl ow of RMB1,266.9 million, representing a
decrease of RMB1,592.8 million compared with a net infl ow of RMB2,859.7 million in 2015, which was mainly due to
the relatively large scale of the Group’s H Share offering in 2015 and no equity fi nancing in the Reporting Period.

38 Red Star Macalline Group Corporation Ltd.
Management Discussion and Analysis
FINANCIAL REVIEW (continued)
16. The debt situation and debt ratio
As of the end of the Reporting Period, the total amount of debt of the Group was RMB21,558.4 million, of which banks and other borrowings were RMB11,234.8 million, and bonds were RMB10,323.6 million. Banks and other borrowings and bonds of the Group are denominated in RMB.
The following table sets out our specifi c debt:
31 December2016
31 December2015
(RMB’000) (RMB’000)
Bank and other borrowingsBank loans, secured 9,705,833 8,349,819Bank loans, unsecured 19,000 535,000Other loans, secured 1,510,000 439,733
11,234,833 9,324,552
Fixed-rate borrowings 1,510,010 839,733Variable-rate borrowings 9,724,823 8,484,819
11,234,833 9,324,552
The borrowings are repayableWithin one year or on demand 2,787,296 2,297,382More than one year, but not exceeding two years 3,344,038 2,192,768More than two years, but not exceeding fi ve years 3,444,250 3,339,116More than fi ve years 1,659,249 1,495,286
11,234,833 9,324,552
Actual interest rate rangeFixed rate bank borrowings 4.90–7.59 6.15–7.59
Floating rate bank borrowings 4.41–8.00 5.89–7.38
31 December2016
31 December2015
(RMB’000) (RMB’000)
BondsUnsecured medium-term notes— Bonds due in 2017 894,941 889,791— Bonds due in 2018 497,031 495,449— Bonds due in 2016 — 497,195Private placement medium-term notes— Private placement notes due in 2017 994,527 989,277Corporate bonds— Corporate bonds due in 2020 4,973,683 4,960,494— Corporate bonds due in 2021 1,485,447 —— Corporate bonds due in 2023 1,477,940 —
10,323,569 7,832,206

39Annual Report 2016
Management Discussion and Analysis
FINANCIAL REVIEW (continued)
16. The debt situation and debt ratio (continued)
Among the total debt of the Group, the portion to be repaid in one year or on demand was RMB4,676.8 million; the
portion to be repaid more than one year but not more than two years was RMB3,841.1 million; the portion to be repaid
more than two years but not more than fi ve years was RMB9,903.4 million; the portion to be repaid over fi ve years was
RMB3,137.1 million; the Group shall timely repay the above loans at the maturity date of the same.
The following table sets out our major debt ratio:
As at
31 December
2016
As at
31 December
2015
Asset-liability ratio(1) 48.1% 45.6%
Net gearing ratio(2) 33.2% 25.5%
For the year ended 31 December
2016 2015
Interest expenses coverage ratio(3) 3.63 3.65
Notes:
(1) Asset-liability ratio is calculated as the total liabilities divided by total assets as at the end of each period.
(2) Represents the total interest-bearing bank and other borrowings, bonds and obligations under fi nance leases net of bank balances and cash as a
percentage of total equity at the end of each period.
(3) Interest expense coverage ratio is our adjusted EBITDA divided by our interest expenses before capitalization for each period. Adjusted EBITDA
represents profi t before tax, adding back fi nance costs, depreciation, amortization and impairment, further adjusted to exclude gains from increases
in the fair value of investment properties, share of profi t of associates, share of results of joint ventures, other gains and losses, other expenses and
other income.
17. Credit rating
As at the end of the Reporting Period, the main credit rating of the Group was rated as BBB+ by Fitch Ratings, Inc. and
BBB by Standard & Poor’s Financial Services LLC, and its outlook and prospects were rated as stable by both of them.
18. Pledge of assets of the Company
As at the end of the Reporting Period, the Group had pledged investment properties with book value of RMB54,814.0
million and restricted bank deposits of RMB70.5 million for obtaining loans and providing guarantees.

40 Red Star Macalline Group Corporation Ltd.
Management Discussion and Analysis
FINANCIAL REVIEW (continued)
19. Contingent liabilities
As at the end of the Reporting Period, the Group issued fi nancial guarantees with its partners to a bank in respect of a
loan in the amount up to RMB400 million granted to a joint venture, of which RMB98 million (as of 31 December 2015:
RMB178 million) have been utilised by the joint venture as at 31 December 2016.
As at the end of 2016 and 2015, the Group and its partner provided fi nancial guarantees to a fi nancial institution in
respect of a loan in the amount up to RMB1,500 million granted to an associate, of which the Group provided guarantee
according to its equity proportion of 25%, which is RMB375 million, to secure the above facility.
(1) the Group pledged its shares in the associate to secure 15% of this loan, which is up to RMB225 million; and
(2) the Group issued fi nancial guarantee to 10% of this loan, which is up to RMB150 million.
During the Reporting Period, the Group and its partner provided fi nancial guarantees to a fi nancial institution in respect
of a new loan in the amount up to RMB2,500 million granted to this associate, of which the Group provided guarantee
according to its equity proportion of 25%, which is RMB625 million, to secure the above facility.
As at the end of the Reporting Period, RMB500 million and RMB500 million (as of 31 December 2015: RMB1,000
million and N/A) of the two facilities have been utilised by the associate, respectively.
The Group believes that the fair value of the above fi nancial guarantees provided by the Group is not signifi cant and the
guaranteed joint ventures and associates are in good fi nancial positions.
20. Material acquisitions and disposals
During the Reporting Period, the Company had no material acquisitions and disposals in relation to our subsidiaries or
joint ventures/associates.
21. Future plans for major investments
Our future major investments of the Group are primarily capital expenditures in respect of acquisition and construction
of investment properties (including through acquisition of subsidiaries). We expect to capitalize on secular growth
trends in the home improvement and furnishings industry by strategically opening new shopping malls in selected
cities in China with attractive market attributes. As at the end of the Reporting Period, the amount of which the Group
has contracted for but not provided in the fi nancial statements was RMB4,359.5 million. The capital commitment as
disclosed in Note 43 to the Consolidated Financial Statements on page 218 was primarily in relation to the development
of our Portfolio Shopping Malls. It is one of our strategies, and we expect to strengthen our market leadership through
strategic expansion of our shopping mall network and brand portfolio.

41Annual Report 2016
Management Discussion and Analysis
FINANCIAL REVIEW (continued)
21. Future plans for major investments (continued)
The source of the Group’s future major investment funds will mainly come from the cash of business operation, bank
loans, issuing bonds and the equity capital contributed by the Shareholders. We will adhere to a prudent and rational
fi nancial management strategy, plan and arrange the investment and operating expenses based on the cash infl ow,
expand fi nancing channels while maintain a reasonable fi nancial condition and debt ratio level to provide better funding
for business development in the future. Currently, we do not have detailed plans for material investments except
opening new shopping malls which are in our ordinary course of business. Accordingly, we foresee that our major
source of funding will be from our operating cash fl ow, revenue from our shopping malls, borrowings from banks and
other fi nancing activities of the Group.
22. Foreign exchange risk
The Group operates in China. All income and almost all expenditure of the Group are in RMB. The Group owns
a small amount of bank deposit in HK dollars and US dollars, and the dividend will be paid in HK dollars to
H shareholders. The Company’s directors believe that the Group’s foreign currency risk is relatively small, and the
Group implements no foreign currency hedging policy currently. The Group manages foreign exchange risks by regularly
checking foreign currency exchange rates. The Group will consider hedging policies to deal with material foreign
exchange risks where necessary.
23. Human Resources
As at the end of the Reporting Period, the Group has 19,060 employees (31 December 2015: 17,086 employees).
The Group signs labour contract with employees according to the Labor Law of the People’s Republic of China and
the relevant provisions of the employee’s locality. The Group will determine the employee’s basic wage and bonus
level according to the employee’s performance, work experience and the market wage standard, and shall pay social
insurance and housing provident fund for the employees. In 2016, the Group has paid a total of RMB2,164.0 million
for salary expenditures (2015: RMB1,730.3 million). Meanwhile, the Group also kept investing resources to provide
various education and training opportunities for the staff, aiming to standardize the management work and improve the
operation performance, and continuously improved the knowledge and technical competence as well as professional
practice competence of the employees.
24. Events after the Reporting Period
The Company received the “Notice of Acceptance of Registration” (Zhong Shi Xie Zhu [2016] SCP No. 400) from the
National Association of Financial Market Institutional Investors (中國銀行間市場交易商協會), according to which the
Company can issue a super short-term commercial papers in tranches with a registered amount of RMB3 billion in
Shanghai Pudong Development Bank. Please refer to the Company’s related announcement on 19 January 2017 for
details.
At the board meeting held on 28 February 2017, the Board resolved to submit to the extraordinary general meeting,
the domestic shareholders’ class meeting and the H shareholders’ class meeting respectively for consideration
and approval by the shareholders by way of special resolution a proposal for extension of the validity period of the
shareholders’ approval for the proposed A Share offering for a future period of 12 months commencing from the date of
passing the relevant special resolutions.

42 Red Star Macalline Group Corporation Ltd.
Management Discussion and Analysis
RISKS FACTORS
1. Risks caused by slackened macro-economy and cyclical fl uctuation of real estate industry
The recent years has witnessed China’s persistent slackened macroeconomic growth trend. In 2016, China’s GDP
showed 6.7% year-on-year growth, which was the lowest growth rate for the past 25 years, and it may be further
reduced in the future. The slowdown in macro-economic growth may slow down the expected urbanization in China,
and pose adverse effect to the improvement of residents’ disposable income and standard of living. Meanwhile, the
real estate industry, as the basic industry under the continued regulation of China, is closely related to the country’s
macroeconomic development with the manifestation of the strong cyclical characteristics. The potential adverse
changes caused by slower growth of the macro-economy and cyclical fl uctuation of real estate industry may weaken
the demand for home improvement and furnishings retail industry, and thus posing certain negative impact on the
Company’s operating performance.
According to the data of Frost & Sullivan, the sales amount achieved in Chinese home improvement and furnishings
industry in 2016 was RMB4.0 trillion, representing an increase of 7.6% on a year-on-year basis. The industry growth
rate was signifi cantly higher than that of China’s macroeconomic overall growth. The Company will actively seize
favorable opportunities of the rapid development in the home improvement and furnishings industry and increase the
market share by the fast and steady expansion of the shopping mall network; while improving economies of scale and
operational effi ciency and strengthening the sustained stability of profi tability, so as to better cope with and withstand
the risks associated with macroeconomic and industry volatility.
2. Risks associated with talent shortage and loss
As our business scale is under continuous development and expansion, demand for high-level management talents and
professionals increases continuously. If the Company’s reserve of talents cannot keep up with the rapid development
rate of the Group’s business, then it will pose an adverse impact on the Company’s operational stability.
We have set up different personnel training and reserve plans for the fresh graduates, excellent employees and
supervisory employees, and we continue to invest resources to provide various types of education and training
opportunities so as to enhance their knowledge and technical level as well as the ability of business practices.
Meanwhile, the Company will continue to strengthen information construction so as to improve the effi ciency of
business, and thus providing guarantee for the building of our pool of talents required for business expansion.

43Annual Report 2016
Management Discussion and Analysis
RISKS FACTORS (continued)
3. Risks associated with expanding business development
Based on the nationwide retail platform and the largest database of businesses and consumers in the Chinese home
improvement and furnishings industry, we plan to further develop the attractive Internet-related products and services
as well as the supply chain related products and services. Compared with our shopping mall business, the business
model and risks of expanding business may vary, but we may not have enough experience to effectively manage such
expanding business and the related risks. Such expanding business may bring us new challenges and risks. If the
expanding business failed to achieve the expected results, then our business, fi nancial condition, results of operations
and prospects as a whole may be adversely affected.
By relying on a strong industrial infl uence in the existing business accumulation, rich management experience and
national distribution network system, we will provide high-quality brand, market, customer and product resources
support for the implementation of the above-mentioned expanding business. It will fl exibly select and adjust the
operating mode of operation and based on the market changes and business needs, so as to reduce the uncertainty of
expanding business and other related risks.
OUTLOOK AND PROSPECTS
We have persistently adhered to the mission of “building a warm and harmonious homeland enhancing consumption and
living taste”. In 2017 and thereafter, we will continue to follow the operation and management model of “market-oriented
management and shopping mall management”, provide better and more professional services for consumers, consolidate our
market leadership and strengthen the brand of “Red Star Macalline” of “Home Furnishings Expert” in the consumers’ mind to
build the most pioneering and professional “omni-channel platform provider in home improvement and furnishings industry”.
Our future development plans are as follows:
1. To continue the implementation of two-pronged business model of Portfolio Shopping Malls and Managed Shopping Malls; to strengthen the market leadership through strategic expansion of shopping mall network and brand portfolio
In terms of shopping mall network construction, we will further strengthen the market leading position in Tier I and II
Cities through self-operation mode, and continue to selectively open new home shopping malls in the core cities; at
the same time, by relying on the sound brand reputation, mature shopping mall development, tenant sourcing and
operation and management capabilities in the home improvement and furnishings industry, we will quickly penetrate
into the Tier III Cities and Other Cities through the asset-light managed business model, so as to further expand the
operation coverage of companies in the country, and thus accelerating market penetration. Moreover, we are also
exploring vigorously the possibility of property asset securitization of owned furniture malls to promote the capital
operating effi ciency of enterprise.

44 Red Star Macalline Group Corporation Ltd.
Management Discussion and Analysis
OUTLOOK AND PROSPECTS (continued)
1. To continue the implementation of two-pronged business model of Portfolio Shopping Malls and Managed Shopping Malls; to consolidate the market leadership through strategic expansion of shopping mall network and brand portfolio (continued)
As for the brand portfolio construction, we will cover a wider range of consumer groups and market segment and serve
our merchants to further enhance our market share through diversifi ed brand strategy.
2. Striving to become new retail benchmark in home decoration and furnishing industry
As one of the most infl uential brands in the home industry in China, we will, from the perspective of truly understanding
and satisfying the needs of consumers, always furnish consumers with a better and more in-depth experience, more
professional and all-round value-added services, and more convenient and humanized service mode. We will provide
a trustworthy circulation platform that can integrate a suffi cient number of home decoration and furniture industry
brand commodities to satisfy the various needs and consumer Pain Points, enhance the online and offl ine integration
experience of consumers, establish the most valuable circulation platform in home decoration and furniture industry,
and strive to become new retail benchmark in the home improvement and furnishing industry.
3. Enhancing the long-term competitiveness of the enterprise through digital strategies
The digital strategies such as “1001” we are pursuing are aimed at enhancing the long-term competitiveness of
enterprise to meet new growth opportunities by making use of internet, big data, cloud computing and other information
technologies.
4. The Group actively made innovations and valued capital market and fi nancial instruments
The Group will positively explore new business model and integrate upstream and downstream resources of home
decoration and furniture industry through investment, merger and acquisition and other ways, and in particular look
for opportunities into smart household fi eld and offer services for enlarging enterprise scale, strengthening corporate
strength, preparing for future and leading the development of the industry.
5. We will improve corporate governance, standardize the operation, and fulfi ll the social
responsibility.
We will make continuous improvement in corporate governance framework, organizational process and management
mechanism, abide by national laws and business ethics and create the commercial atmosphere of “standardized
operation” as well as undertake and fulfi ll social responsibility proactively.
45
Directors, Supervisors andSenior Management
Annual Report 2016
EXECUTIVE DIRECTORS
Mr. CHE Jianxing, aged 50, the founder of our Group, has been the chairman, an executive Director, the chief executive
offi cer and the general manager of our Company, since its establishment in June 2007. Mr. CHE is primarily responsible
for the overall management, strategic development and business planning of our Group. Mr. CHE has over 29 years of
industry experience. He started his career in furniture manufacturing in the late’80s. He then established Changzhou Red
Star Furniture Store* (常州市紅星傢俱城) in December 1990 and served as its general manager from 1990 to 1994. He
subsequently founded Red Star Furniture Group in June 1994 and served as its chairman of the board of directors and chief
executive offi cer from 1994 to 2007. Mr. CHE is Ms. CHEN Shuhong’s husband and Ms. CHE Jianfang’s brother. Mr. CHE
is a member of the executive committee of All-China Federation of Industry & Commerce (中華全國工商業聯合會). Mr. CHE
was awarded as the “Shanghai Outstanding Star” by Shanghai government, Shanghai Industry & Commerce (上海工商業聯
合會) and Shanghai Outstanding Enterprise Promotion Association (上海光彩事業促進會) in February 2014, the “Changzhou
Outstanding Entrepreneur” by Changzhou government in January 2012 and the “Working Model of Jiangsu Province” by
Jiangsu Provincial People’s Government in April 2006. For Mr. CHE’s interest in the shares and underlying shares of the
Company, please refer to the section headed “Report of Directors” of this annual report.
Ms. ZHANG Qi, aged 57, joined our Company in June 2012 and has been the vice chairman, an executive Director and a vice
general manager of our Company since then. Ms. ZHANG is primarily responsible for the business development, strategy and
investment planning, operating management of Managed Shopping Malls, construction progress of Portfolio Shopping Malls,
Internet fi nancial segment, overall management of the Xingyijia* (星藝佳) business, legal compliance and internal control of
our Group. Prior to joining our Company, Ms. ZHANG served in various positions in the Huangpu District offi ce, Shanghai City
of the Industrial and Commercial Bank of China (中國工商銀行) (“ICBC”), including the director of South Three Sub-branch,
the secretary of the communist party branch of South three sub-branch, the director of Nanjing Road East sub-branch, the
vice director of deposit department, the assistant director and the vice director, from July 1984 to September 1992. From
September 1992 to January 2000, she successively served as the vice president, the president and the secretary of the
communist party committee of Huangpu sub-branch and Jing’an sub-branch of the Shanghai branch of ICBC. From January
2000 to March 2008, Ms. ZHANG worked in the Shanghai branch of ICBC, where she served in various positions, including
the director of the retail division and the securities clearing division, the assistant president, the vice president and the deputy
secretary of the communist party committee. From March 2008 to June 2012, Ms. ZHANG served as the general manager
and the secretary of the communist party committee of the private banking department of ICBC.
Ms. ZHANG studied in the Cadre Class of Financing Management (金融管理幹部專修班) at the Faculty of Economics of
Fudan University (復旦大學) from September 1985 to July 1987. She graduated with a master’s degree in fi nance from
Shanghai University of Finance Economics (上海財經大學) in June 1998. Ms. ZHANG also completed the executive master of
business administration program jointly organized by Shanghai National Accounting Institute (上海國家會計學院) and Arizona
State University in October 2005. Ms. ZHANG was accredited by ICBC as a senior economist in August 1997. She received
the honor of “Shanghai Financial Talent” granted by Shanghai Financial Work Committee of Communist Party (中共上海市金
融工作委員會) and Shanghai Financial Services Offi ce (上海市金融服務辦公室) in March 2004.

46 Red Star Macalline Group Corporation Ltd.
Directors, Supervisors and Senior Management
Ms. CHE Jianfang, aged 48, joined our Company in June 2007 and has been an executive Director and a vice general
manager of our Company since then. Ms. CHE is primarily responsible for merchandising management of our Group. Prior
to joining our Company, Ms. CHE worked as the general manager at the Changzhou Red Star Furniture General Factory* (常
州市紅星傢俱總廠) from 1990 to 1993, mainly responsible for general operation of the business. She served as the general
manager responsible for national investment operation at Red Star Furniture Group from 1994 to 2007. Ms. CHE is Mr. XU
Guofeng’s wife and Mr. CHE Jianxing’s sister. Ms. CHE completed the “Senior Executive Program for China” jointly organized
by China Europe International Business School (中歐國際工商學院) (“CEIBS”), Harvard Business School and the School
of Economics and Management of Tsinghua University (清華大學經濟管理學院) in December 2007. She also completed
the China CEO Program jointly organized by Cheung Kong Graduate School of Business (長江商學院), Columbia Business
School, the International Institute for Management Development and London Business School in July 2011. Currently,
Ms. CHE serves as the vice-chairman of Shanghai Entrepreneur Association (上海市企業家聯合會) and has always been
committed to social welfare undertakings. She further established Red Star Bright Fund (紅星光彩基金). For Ms. CHE’s
interest in the shares and underlying shares of the Company, please refer to the section headed “Report of Directors” of this
annual report.
Mr. JIANG Xiaozhong, aged 47, joined our Company in June 2007 and has been an executive Director and a vice general
manager of our Company since December 2012. Mr. JIANG is primarily responsible for business development and operation
of our Group. Prior to joining our Company, from June 1994 to June 2007, Mr. JIANG served in various positions at Red
Star Furniture Group, including as secretary of the communist party branch committee, secretary of the communist party
committee and as vice president, primarily responsible for business operation, administration and communist party committee
related work.
Mr. JIANG completed a three-year correspondence course for cadre in administrative management at the Communist Party
School of Jiangsu Province (江蘇省委黨校) in July 1992. He graduated with an executive master of business administration
degree from the executive master of business administration program at Cheung Kong Graduate School of Business (長江商
學院) in September 2011.

47Annual Report 2016
Directors, Supervisors and Senior Management
NON-EXECUTIVE DIRECTORS
Ms. CHEN Shuhong, aged 44, joined our Company in June 2007 and has been a non-executive Director since then.
Ms. CHEN is primarily responsible for overseeing our Company’s management and strategic development. Prior to joining
our Company, Ms. CHEN worked at the Changzhou Red Star Furniture General Factory* (常州市紅星傢俱總廠) from July
1992 to December 1993, and was mainly responsible for fi nance-related work. She then served as a manager of Changzhou
Home Furnishing Wholesale Center* (常州建材傢俱批發中心) from January 1994 to June 1999. Ms. CHEN served as the
chief fi nancial offi cer of Red Star Furniture Group from June 1999 to June 2007. Ms. CHEN is Mr. CHE Jianxing’s wife and
Mr. CHEN Donghui’s sister.
Ms. CHEN obtained a college degree for adult higher education in accounting from Industrial College of Jiangsu Province
(江蘇省工業學院) (now known as Changzhou University (常州大學)) in 2003. She graduated with an executive master of
business administration degree from the executive master of business administration program of The Hong Kong University
of Science and Technology (香港科技大學) in June 2012. For Ms. CHEN’s interest in the shares and underlying shares of the
Company, please refer to the section headed “Report of Directors” of this annual report.
Mr. XU Guofeng, aged 50, joined our Company in June 2007 and has been a Director and a vice general manager of our
Company since December 2010. He has been a non-executive Director of our Company since he resigned as vice general
manager in November 2014. Mr. XU is primarily responsible for overseeing our Company’s management and strategic
development. Prior to joining our Company, Mr. XU served as a factory manager at the Changzhou Red Star Furniture General
Factory* (常州市紅星傢俱總廠) from 1991 to 1994, where he was mainly responsible for production and business operation.
He then served as a vice president of Red Star Furniture Group from 1994 to 2007, where he was mainly responsible for
managing construction-related work and participating in the decision making for signifi cant events. Mr. XU is Ms. CHE
Jianfang’s husband and Mr. XU Guoxing’s brother. Mr. XU completed a correspondence course in business administration
at Beijing Business Management Correspondence College (北京經濟管理函授學院) in July 2004. He also completed
the executive master of business administration program at Cheung Kong Graduate School of Business (長江商學院) in
September 2011.

48 Red Star Macalline Group Corporation Ltd.
Directors, Supervisors and Senior Management
Mr. Joseph Raymond GAGNON, aged 39, joined our Company in December 2009 and has been a non-executive Director of
our Company since then. Mr. GAGNON is primarily responsible for participating in formulating our Company’s corporate and
business strategies. He joined Warburg Pincus Asia LLC, an affi liate of Warburg Pincus (美國華平投資集團), in September
2005 and currently serves as its managing director and the head of its real estate investment business in Asia. Mr. GAGNON
previously worked for GE Capital from July 2000 to August 2005, where he last served as a business development manager
with GE Capital Real Estate in Tokyo. Mr. GAGNON has been a director of Vingroup Joint Stock Company, a company listed
on the Ho Chi Minh City Stock Exchange (stock code: VIC), since July 2013. Mr. GAGNON also served as a non-executive
director of Sunshine 100 China Holdings Ltd. (陽光100中國控股有限公司), a company listed on the Hong Kong Stock
Exchange (stock code: 02608), from June 2011 to September 2014.
Mr. GAGNON graduated with a bachelor of science degree in mathematical economics from Wake Forest University in the
United States in August 2000. On 14 June 2012, Mr. GAGNON was appointed as a director of Titan Investment Group
Limited (“TIGL”), a company incorporated in Hong Kong. TIGL was fi nancially distressed at the time when Mr. GAGNON was
appointed as a director. Mr. GAGNON’s role included seeking means of reorganizing the TIGL group for the benefi t of its
shareholders and creditors. On 18 June 2012, one of TIGL’s shareholders made an application to the British Virgin Island
court for the appointment of liquidators to TIGL. On 17 July 2012, TIGL was appointed as the liquidators as part of the
reorganization process that Mr. GAGNON supported and assisted with implementing. On 17 September 2012, a consortium
agreed to purchase substantially all of the assets of the TIGL group.
Mr. ZHANG Qiqi, aged 35, joined our Company in December 2010 and has been a non-executive Director of our Company
since then. Mr. ZHANG is primarily responsible for participating in formulating our Company’s corporate and business
strategies. He joined Beijing Warburg Pincus Investment Consulting Co., Ltd., an affi liate of Warburg Pincus in July 2009 and
currently serves as its executive director. Mr. ZHANG previously worked as an associate and successively a senior associate
at the Shanghai branch of PWC Consulting (Shenzhen) Co., Ltd. from August 2003 to July 2007. Mr. ZHANG graduated with
a bachelor’s degree in international economics and trade (English) from Shanghai International Studies University (上海外國語
大學) in July 2003 and a master of business administration degree from the Booth School of Business, University of Chicago,
in June 2009.
49Annual Report 2016
Directors, Supervisors and Senior Management
INDEPENDENT NON-EXECUTIVE DIRECTORS
Mr. LI Zhenning, aged 63, joined our Company in March 2012 and has been our independent non-executive Director since
then. He is primarily responsible for participating in the decision making for our Company’s signifi cant events and advising on
issues relating to corporate governance, audit, strategy and investment, and the nomination, remuneration and assessment
of our Directors and senior management. Prior to joining our Company, Mr. LI engaged in investment activities and acted as a
fi nancial consultant in his personal capacity from May 1995 to December 2002. He was an independent director of Shanghai
Zhangjiang Hi-tech Park Development Co., Ltd. (上海張江高科技園區發展股份有限公司), a company listed on the Shanghai
Stock Exchange (stock code: 600895), from May 2008 to April 2010. Mr. LI founded Shanghai Rising Fund Management
Company Ltd. (上海睿信投資管理有限公司) in December 1997 and has been serving as its chairman of the board of directors
since then. He has also been serving as the chairman of the board of directors of Shanghai Juying Culture Communication
Co., Ltd. (上海聚英文化傳播有限公司) since November 2006. Mr. LI graduated from Renmin University of China (中國人民
大學) with a bachelor’s degree in western economics in June 1982 and a master’s degree in economics in June 1985.
Mr. LEE Kwan Hung, aged 51, has been appointed as our independent non-executive Director since February 2015. He
is primarily responsible for participating in the decision making for our Company’s signifi cant events and advising on issues
relating to the nomination of our Directors and senior management. From December 1992 to April 1994, Mr. LEE worked in
the Listing Division of the Hong Kong Stock Exchange, where he successively served as a manager and a senior manager,
and was a partner of Woo, Kwan, Lee & Lo from April 2001 to February 2011. Mr. LEE is currently a consultant at Howse
Williams Bowers. He has been an independent non-executive director of several companies listed on the Hong Kong Stock
Exchange, including Embry Holdings Limited (安莉芳控股有限公司) (stock code: 1388) since November 2006, NetDragon
Websoft Inc. (網龍網絡控股有限公司) (stock code: 777) since June 2008, Asia Cassava Resources Holdings Limited (亞洲木
薯資源控股有限公司) (stock code: 841) since January 2009, Futong Technology Development Holdings Limited (富通科技發
展控股有限公司) (stock code: 465) since November 2009, Newton Resources Ltd. (新礦資源有限公司) (stock code: 1231)
since December 2010, Tenfu (Cayman) Holdings Company Limited (天福(開曼)控股有限公司) (stock code: 6868) since August
2011, China BlueChemical Ltd. (中海石油化學股份有限公司) (stock code: 3983) since June 2012, Landsea Green Properties
Co., Ltd. (朗詩綠色地產有限公司) (stock code: 106) since July 2013, China Goldjoy Group Limited (中國金洋集團有限公
司) (stock code: 1282) since November 2015, Fse Engineering Holdings Limited (豐盛機電控股有限公司) (stock code: 331)
since November 2015, and Ten Pao Group Holdings Limited (天寶集團控股有限公司) (stock code: 1979) since November
2015. Mr. LEE was also the independent non-executive director of Yuexiu REIT Asset Management Limited (越秀房托資產
管理有限公司), which is the manager of Yuexiu Real Estate Investment Trust (越秀房地產投資信託基金) (stock code: 405),
from November 2005 to October 2014, the independent non-executive director of Far East Holdings International Limited (遠
東控股國際有限公司) (stock code: 36) from March 2012 to November 2014 and the independent non-executive director of
Walker Group Holdings Limited (盈進集團控股有限公司) (stock code: 1386) from February 2011 to March 2016, the shares
of which or the units or shares of the said management funds are listed on the Hong Kong Stock Exchange. Mr. LEE obtained
his Bachelor of Laws (Honours) degree and Postgraduate Certifi cate in Laws from the University of Hong Kong in 1988 and
1989 respectively. He was admitted as a solicitor in Hong Kong in 1991 and in the United Kingdom in 1997.

50 Red Star Macalline Group Corporation Ltd.
Directors, Supervisors and Senior Management
Mr. DING Yuan, aged 47, joined our Company in March 2012 and has been appointed as our independent non-executive
Director since then. He is primarily responsible for participating in the decision making for our Company’s signifi cant events
and advising on issues relating to corporate governance and audit. Mr. DING has more than ten years of experience
in teaching and researching fi nancial accounting, fi nancial statement analysis, corporate governance and mergers and
acquisitions. Mr. DING served as a tenured professor in accounting and management control at the HEC School of
Management in France from September 1999 to September 2006. Mr. DING has joined the CEIBS since September 2006,
and is currently serving as the Cathay Capital professor, vice president and dean in Accounting. Since July 2013, Mr.
DING has been serving as an independent non-executive director, the chairman of the audit committee and a member of
the nomination committee and the remuneration committee of Landsea Green Properties Co., Ltd. (朗詩綠色地產有限公
司), a company listed on the Hong Kong Stock Exchange (stock code: 106). He has been an independent non-executive
director, the chairman of the remuneration committee and a member of nomination committee and audit committee of Man
Wah Holdings Limited (敏華控股有限公司), a company listed on the Hong Kong Stock Exchange (stock code: 1999) since
December 2016. He is currently a director of Jaccar Holdings, a private investment company. Mr. DING was an independent
director and the chairman of the audit committee at Anhui Gujing Distillery Co., Ltd. (安徽古井貢酒股份有限公司), a company
listed on the Shenzhen Stock Exchange (stock code: 000596), from June 2008 to June 2011 and at TCL Corporation (TCL集
團股份有限公司), a company listed on the Shenzhen Stock Exchange (stock code: 000100), from June 2008 to June 2014.
He has been a director and the chairman of the audit committee of MagIndustries Corp., a company listed on the Toronto
Stock Exchange (stock code: MAA), since July 2011 to June 2015. Mr. DING graduated with a doctor of philosophy degree in
management science from the College of Business Administration, Bordeaux IV University in France in May 2000.
Mr. QIAN Shizheng, aged 64, joined our Company in April 2016 and has been appointed as our independent non-executive
Director of our Company since then. He is primarily responsible for participating in the decision making for our Company’s
signifi cant events and advising on issues relating to corporate governance, audit and the remuneration and assessment of
our Directors and senior management. Mr. QIAN has over 30 years of experience in the theory and practice of fi nance and
accounting. Mr. QIAN served as the Deputy Dean of the Department of Accounting at Shanghai Fudan University from August
1983 to December 1997. During the period from January 1998 to June 2012, he served as the executive director and vice
president of Shanghai Industrial Holdings Limited (上海實業控股有限公司), a company listed on the Hong Kong Stock
Exchange (stock code: 363), and concurrently served as the vice chairman of Haitong Securities Co., Ltd. (海通證券股份有
限公司), a company listed on both the Shanghai Stock Exchange (stock code: 600837) and the Hong Kong Stock Exchange
(stock code: 6837). During the period from June 2014 to February 2017, Mr. Qian served as an independent director at
Shanghai Chengtou Holding Co., Ltd. (上海城投控股股份有限公司), a company listed on the Shanghai Stock Exchange
(stock code: 600649). Mr. QIAN returned to Shanghai Fudan University (上海復旦大學) in July 2012 and is now a professor
at the School of Management of Shanghai Fudan University. Mr. QIAN is concurrently acting as an independent director at
Shanghai Lujiazui Finance and Trade Zone Development Co., Ltd. (上海陸家嘴金融貿易區開發股份有限公司), a company
listed on the Shanghai Stock Exchange (stock code: 600663), Shanghai Laiyifen Co., Ltd., (上海來伊份股份有限公司) a
company listed on the Shanghai Stock Exchange (stock code: 603777), Hanhua Financial Holding Co., Ltd.* (瀚華金控股份
有限公司), a company listed on the Hong Kong Stock Exchange (stock code: 3903), Jingrui Holdings Limited (景瑞控股有限
公司)*, a company listed on the Hong Kong Stock Exchange (stock code: 1862) and Lonking Holdings Limited (中國龍工控
股有限公司)*, a company listed on the Hong Kong Stock Exchange (stock code: 3339), respectively. Mr. QIAN obtained his
bachelor’s degree in economics from the Accounting Department at Shanghai University of Finance and Economics in July
1983 and obtained his master’s degree in economics and PhD in management from Shanghai Fudan University in January
1993 and July 2001, respectively.
51Annual Report 2016
Directors, Supervisors and Senior Management
SUPERVISORS
Ms. NG Ellen Hoi Ying, aged 36, has been the shareholder representative Supervisor of our Company since December
2010, mainly responsible for overseeing business development and operations of our Company. Ms. NG currently serves
as a managing director of Warburg Pincus Asia LLC, an affi liate of Warburg Pincus. Ms. NG served as an analyst in the
investment banking division of Bank of America Merrill Lynch in Hong Kong from July 2003 to September 2005. She joined
Warburg Pincus Asia LLC in October 2005 and was promoted to her current position in December 2015. Ms. NG graduated
with a bachelor’s degree in economics from the University of Pennsylvania in May 2003. She has been a CFA charterholder
accredited by CFA Institute since September 2005.
Mr. ZHENG Hongtao, aged 50, joined our Company in January 2016 and has been an independent Supervisor. He has
been engaging in teaching and research work at Beijing National Accounting Institute (北京國家會計學院) as a director of
corporate governance and risk control center. Mr. ZHENG was a teacher at Guangdong Zhongkai Technology and Economics
College (廣東仲愷技術經濟學院) from July 1995 to December 1996. From January 1997 to October 1997, Mr. ZHENG
was a researcher at the Rural Economics Research Center of the Ministry of Agriculture (農業部農村經濟研究中心). From
October 1997 to September 1998, Mr. ZHENG served as an investment project manager at the investment banking division
of Everbright Securities Company Limited (光大證券股份有限公司) (which was subsequently listed on both the Hong Kong
Stock Exchange (stock code: 6178) and the Shanghai Stock Exchange (stock code: 601788)).
Mr. ZHENG participated in post-doctoral research in fi nance at Zhongnan University of Economics and Law (中南財經政法大
學) from July 2002 to December 2006. He graduated from Huazhong Agricultural University (華中農業大學) with a doctoral
degree in agricultural economics and management and a master’s degree in agriculture in June 2001 and June 1995,
respectively.
Mr. ZHENG is currently an independent director of CNNC SUFA Technology Industry Co., Ltd., iHandy and Hebei Changshan
Biochemical Pharmaceutical Co. Ltd. and Beijing Taikong Panel Industry Corp (北京太空板業股份有限公司), a company
listed on the Shenzhen Stock Exchange (stock code: 300334), and Venustech Group Co., Ltd. (啟明星辰信息技術集團股
份有限公司), a company listed on the Shenzhen Stock Exchange (stock code: 002439), since 2012 and 2014 respectively.
In February 2010, Mr. ZHENG was named as a professor by the Ministry of Finance of the People’s Republic of China. Mr.
ZHENG was an independent director of Tangshan Jidong Cement Co., Ltd. (唐山冀東水泥股份有限公司), a company listed
on the Shenzhen Stock Exchange (stock code: 000401) and Hengxin Mobile Business Co., Ltd. (恒信移動商務股份有限
公司), a company listed on the Shenzhen Stock Exchange (stock code: 300081) for the three years prior to the date of this
annual report.
52 Red Star Macalline Group Corporation Ltd.
Directors, Supervisors and Senior Management
Mr. CHEN Gang, aged 40, joined our Company in January 2016 and has been an independent Supervisor. Mr. CHEN
served as the senior manager and director of the investment banking division of Huatai United Securities Co., Ltd. (華泰聯
合證券有限責任公司), formerly known as United Securities Co., Ltd. (聯合證券有限責任公司) and the general manager
of its investment banking (4) division of Shanghai from July 2001 to August 2006. From August 2006 to February 2007,
he served as an assistant of general manager of the headquarters of mergers and acquisitions fi nancing department of
China Securities and the person in charge of the Shanghai branch of the company. From February 2007 to January 2010,
he served as the vice general manager and successively the executive general manager of the investment banking division
of Zhongtai Securities Co., Ltd. (中泰證券股份有限公司), formerly known as Qilu Securities Co., Ltd. (齊魯證券有限公
司). From February 2010 to December 2016, he successively acted as assistant to president and general manager of the
investment banking division of Zhongshan Securities Co., Ltd., vice general manager of the OTC Market division and general
manager of the new third board business of Zhongshan Securities Co., Ltd. Since January 2017, he has been appointed as
general manager of the investment banking division in LC Securities. Mr. CHEN graduated from Beijing University of Posts
and Telecommunications (北京郵電大學) with a major in English for Science and technology and a bachelor’s degree in
engineering in July 1998. Mr. CHEN completed the fi nance courses (including insurance courses) of the Economics College
in Fudan University and obtained the master’s degree in economy in July 2001, completed the world economy courses of the
Economics College in Fudan University and obtained doctoral degree in economy in July 2009, and engaged in post-doctoral
research on politics in the International Relationships and Public Affairs College in Fudan University and graduated in July
2012. Mr. CHEN is currently a part-time master tutor at the School of Economics of the Fudan University and a master tutor
in Shanghai Advanced Institute of Finance (上海交通大學高級金融學院). He is also a member of the Tenth Session of the
Central Finance and Economics Committee of China National Democratic Construction Association (中國民主建國會中央財
政金融委員會). Mr. CHEN was accredited as a Chinese Certifi ed Public Accountant by Shanghai Institute of Certifi ed Public
Accountants (上海註冊會計師協會) in November 2004. In September 2009, Mr. CHEN was accredited by Jiangsu Offi ce of
Personnel (江蘇省人事廳) as a senior economist. Mr. CHEN was listed in the fi rst batch of sponsors in Chinese securities
market in 2004.
Mr. PAN Ning, aged 50, has been the chairman of the supervisory committee of the Company since February 2012. He was
previously a vice general manager of the Company from June 2007 to December 2011, mainly responsible for overseeing
the audit and evaluating investment decisions of the Company. Prior to joining the Company, Mr. PAN worked as an offi cer
successively at the Changzhou branch of the People’s Bank of China, the Changzhou branch of Industrial and Commercial
Bank of China and Changzhou Commercial Bank from November 1983 to March 2002. Mr. PAN served as a vice president of
Red Star Furniture Group from 2002 to 2007, mainly responsible for corporate fi nance work.
Mr. PAN completed a part-time course in fi nance at Jiangsu Radio and Television University (江蘇廣播電視大學) (now
known as Jiangsu Open University (江蘇開放大學)) in July 1991 and a postgraduate course in monetary banking at Suzhou
University (蘇州大學) in June 1998. He completed the “Senior Executive Program for China” jointly organized by China
Europe International Business School, Harvard Business School and the School of Economics and Management of Tsinghua
University (清華大學經濟管理學院) in December 2009. Mr. PAN completed the fi nance executive master of business
administration course in Shanghai Advanced Institute of Finance (上海交通大學上海高級金融學院) and obtained his master’s
degree in executive master of business administration in June 2016. Mr. PAN was accredited by the Jiangsu branch of
Industrial and Commercial Bank of China as an economist in June 1992.
53Annual Report 2016
Directors, Supervisors and Senior Management
Ms. CHAO Yanping, aged 46, has been the employee representative supervisor of the Company since December 2010.
Ms. CHAO has been serving as a general manager of the Company’s fi rst development center since June 2007, mainly
responsible for overseeing business development and operations of the Company. She has also been serving as an
executive partner of Shanghai Hongmei Investment since February 2012. Prior to joining the Company, Ms. CHAO worked
as the general manager of Shanghai region in Red Star Furniture Group from 2002 to 2007, mainly responsible for projects
investment and development.
Ms. CHAO completed part-time study in business administration at the University of Shanghai for Science and Technology (上
海理工大學) in January 2010.
SENIOR MANAGEMENT
Mr. LI Bin, aged 42, joined our Company in January 2016 and now serves as vice general manager of our Company. Prior
to joining the Company, Mr. LI was appointed as a chief account director in Hefei Royalstar Electronic Appliance Group Co.,
Ltd. prior to January 2005 and as a deputy chief operating offi cer and CEO of operating headquarters in Sunning Commerce
Group Co., Ltd. prior to September 2015.
Mr. LI graduated from International Trade Major of Shanghai University of International Business and Economics and now is
taking MBA courses for senior executives in Fudan University.
Mr. LIU Yuanjin, aged 62, joined our Company in June 2007 and has been a vice general manager of our Company. He
is primarily responsible for the business development and operations of our Company. Prior to joining our Company, Mr.
LIU worked at Changzhou Juqian Street Primary School (常州市局前街小學) from September 1971 to January 1977. Mr.
LIU was a member and a deputy secretary of the communist youth league committee of Tianning District, Changzhou City
from January 1977 to September 1981. From July 1985 to August 1997, Mr. LIU worked in the government of Tianning
District, Changzhou City, where he successively served as head of the industry department, head of the planning economy
department and the deputy district chief. From August 1997 to December 2003, Mr. LIU served as deputy head and deputy
secretary of the central management committee and a member of the party committee of the Changzhou National High
Technology Development Zone (常州市國家高新技術開發區), and concurrently served as the deputy district chief and deputy
secretary of the communist party committee of Xinbei District, Changzhou City. Mr. LIU served as a vice president of Red Star
Furniture Group from 2004 to 2007, mainly responsible for the development of projects in their early stage.
Mr. LIU completed his studies in engineering management at Tianjin University (天津大學) in July 1985. He completed the
“Senior Executive Program for China” jointly organized by CEIBS, Harvard Business School and the School of Economics
and Management of Tsinghua University (清華大學經濟管理學院) in December 2007. He completed the EMBA course of
Cheung Kong Graduate School of Business (長江商學院) in 2014. Mr. LIU is currently taking the CEO course of China Europe
International Business School.

54 Red Star Macalline Group Corporation Ltd.
Directors, Supervisors and Senior Management
Mr. PAN Ping, aged 61, joined our Company in June 2007 and has been a vice general manager of our Company since 30
December 2010. He is primarily responsible for the business development and operations of our Company. Prior to joining
our Company, Mr. PAN served as the deputy general manager and the deputy secretary of the communist party committee of
Wuxi Commercial Mansion (無錫商業大廈), the general manager of Wuxi Shopping Mall (無錫商場) and the general manager
and the secretary of the party committee of Wuxi Electrical Appliances Corporation (無錫交家電總公司) from 1985 to 1996.
Mr. PAN served as the deputy district chief of Chong’an District, Wuxi City from 1996 to 2003. From 2003 to 2007, Mr. PAN
served as a vice president of Red Star Furniture Group, mainly responsible for business development and operation. Mr.
PAN also served as supervisor of Jinke Real Estate Group Co. Ltd. (金科地產集團股份有限公司), a company listed on the
Shenzhen Stock Exchange (Stock Code: 000656) from January 2012 to March 2014 and as director from May 2014 to March
2015.
Mr. PAN completed his studies in politics at Wuxi Workers Part-Time University (無錫市工人業餘大學) in August 1977 and
the study in party and politics at Communist Party School of Wuxi Municipal Committee (中共無錫市委黨校) in July 1985. Mr.
PAN was accredited as a senior economist by Senior Economics Qualifi cation Review Committee of Jiangsu Province (江蘇
省經濟專業高級職務任職資格評審委員會) in June 1995. Mr. PAN completed the “Corporate CEO/Finance CEO Program
in China” jointly opened by Cheung Kong Graduate School of Business (長江商學院), London Business School, Columbia
Business School, Research College on International Enterprises Strategies of the Hitotsubashi University in Japan (日本一橋
大學國際企業戰略研究學院), ESMT and IMD in November 2015. On 29 December 2016, Mr. PAN resigned as a member of
the senior management.
Mr. XI Shichang, aged 42, joined our Company in July 2010 and has been the chief fi nancial offi cer of our Company since
December 2010. He is primarily responsible for overseeing corporate fi nance and fi nancial management of our Company.
Prior to joining our Company, from October 1999 to December 2002, Mr. XI worked at Shanghai Zhong Yong Xin Accounting
Firm (上海中永信會計師事務所). From January 2003 to July 2010, Mr. XI worked at Deloitte & Touche Tohmatsu Certifi ed
Public Accountants Co., Ltd.
Mr. XI graduated with a bachelor’s degree in fi nance from Shanghai University of Finance and Economics (上海財經大學) in
July 1995 and a master of business administration degree from the executive master of business administration program at
CEIBS in October 2013. Mr. XI has been a Certifi ed Public Accountant accredited by Shanghai Institution of Certifi ed Public
Accountants (上海註冊會計師協會) since June 2011.
Mr. LI Jianhong, aged 43, joined our Company in February 2013 and has been a vice general manager of our Company since
March 2013. He is primarily responsible for the investment and fi nancing of our Company. Prior to joining our Company, Mr. LI
worked as the head of the fi nance department of Xiamen Customs in the 1990s. Mr. LI joined Man Wah Holdings Ltd. (敏華控
股有限公司), a company listed on the Hong Kong Stock Exchange (Stock Code: 01999) in September 2000 and served as its
executive director, chief operating offi cer and vice president from April 2005 to October 2011.
Mr. LI graduated with a bachelor’s degree in accounting from Xiamen University (廈門大學) in July 1994, and obtained a
distance education degree in executive master of business administration from Peking University (北京大學) in January 2007.
Mr. LI obtained a master of business administration degree from Booth School of Business, University of Chicago in March
2010. Mr. LI was accredited as a Chinese Certifi ed Public Accountant by CICPA in June 2001.

55Annual Report 2016
Directors, Supervisors and Senior Management
Mr. XU Guoxing, aged 45, joined our Company in June 2007 and has been a vice general manager of our Company since 30
December 2010. He is primarily responsible for the building material distribution business and the decoration business of our
Company. Prior to joining our Company, Mr. XU worked in Changzhou Red Star Furniture General Factory* (常州市紅星家俱
總廠) and Changzhou Red Star Furniture Store* (常州市紅星家俱城) from 1992 to 1994, mainly responsible for the sales of
furniture. Mr. XU worked as sales manager in Red Star Furniture Group from 1994 to 2007, mainly responsible for the sales of
furniture. Mr. XU is Mr. XU Guofeng’s brother.
Mr. XU completed the study of business administration at Nanjing College of Artillery Academy of the People Liberation Army
(中國人民解放軍炮兵學院南京分院) in June 2004. He also completed the EMBA Program in October 2012 at Cheung Kong
Graduate School of Business (長江商學院). He is currently the vice president of Jiangsu Furniture Industry Association (江蘇
省家居行業協會). On 29 December 2016, Mr. XU resigned as a member of the senior management.
Mr. ZHANG Peifeng, aged 45, joined our Company in October 2008 and has been a vice general manager of our Company
since 30 December 2010. He is primarily responsible for the property management of our Company. Prior to joining our
Company, Mr. ZHANG worked in Whirlpool Corporation (China) (美國惠而浦水仙公司(中國)), a company mainly producing
household appliances, from September 1997 to March 1999. Mr. ZHANG then worked in Shanghai B&Q Decoration and
Construction Material Co., Ltd. (上海百安居裝飾建材有限公司) from June 1999 to July 2005. From August 2005 to
November 2006, Mr. ZHANG worked at the Home Depot (China) (家得寶 (中國)), a company mainly selling home furniture and
construction materials. From January 2007 to May 2008, Mr. ZHANG worked in Best Buy Commercial (Shanghai) Co., Ltd. (百
思買商業(上海)有限公司).
Mr. ZHANG graduated with a bachelor’s degree in English literature from Qufu Normal University (曲阜師範大學) in July 1994
and a master’s degree in English language from Shanghai International Studies University (上海外國語大學) in February 1997.
Mr. XIE Jian, aged 46, joined our Company in March 2011 and has been a vice general manager of our Company since April
2011. He is primarily responsible for human resources, cultural promotion management, administration and management
of our Company. Prior to joining our Company, Mr. XIE served as a general manager responsible for human resources and
service quality of New World Department Store China Ltd. (新世界百貨(中國)有限公司) from April 1995 to January 2011.
Mr. XIE completed his studies in politics and education at Wuxi Education College (無錫教育學院) in July 1990. He obtained
a bachelor’s degree in business management through self-study examination from Nanjing University (南京大學) in July 1995.
Mr. XIE obtained a master of business administration degree from the executive master of business administration program at
Shanghai Jiao Tong University in June 2015. Mr. XIE was awarded as the “Excellent Trainer of the Industry” by China Building
Materials Circulation Association (中國建築材料流通協會) in November 2010 and was appointed as “First Thinktank —
Human Resources Expert” and “China Pioneer HR”in October 2013 by First Thinktank (第一資源智庫). He is currently serving
as the MBA occupation tutor by Antai College of Economics & Management, Shanghai Jiao Tong University (上海交通大學安
泰經濟與管理學院) and the head of the Human Resources Committee of the China’s Chain Stores by the CCFA. He entered
the “2015 China Top 100 Individuals for Promoting the HR Reform” selected in April 2015. The team led by Mr. XIE has been
awarded “Best Corporate University” for 6 years in a row since 2011 and has been granted “China Best Employer Award” for
4 years in a row since 2013.
56 Red Star Macalline Group Corporation Ltd.
Directors, Supervisors and Senior Management
Mr. GUO Binghe, aged 43, joined our Company in June 2007 and has been a vice general manager of our Company
since October 2011. Since December 2013, he has also been the secretary of the Board. He is primarily responsible for
legal compliance, corporate governance, internal control, investor relations and information disclosure of our Company and
providing support and assistance to the Board in the performance of its duties. Prior to joining our Company, Mr. GUO
worked in the investment banking division of Shenyin & Wanguo Securities Co., Ltd. (申銀萬國證券股份有限公司) from July
2001 to March 2004. He then worked in Skyone Securities Co., Ltd. (天一證券有限公司) from March 2004 to October 2005.
From 2006 to 2007, Mr. GUO served as assistant chief fi nancial offi cer of Red Star Furniture Group.
Mr. GUO completed his studies in English education at Anhui Education College (安徽教育學院) (now known as Hefei Normal
University (合肥師範學院)) in July 1998, and obtained a master’s degree in economics from Fudan University in July 2001 and
a degree of executive master of business administration from Cheung Kong Graduate School of Business (長江商學院). Mr.
GUO was accredited as an intermediate economist by Ningbo Municipal People’s Government in January 2005.
Mr. WANG Wei, aged 47, joined our Company in June 2007 and has been a vice general manager of our Company since
March 2013. He is primarily responsible for the business development and operation of our Company. Mr. WANG has held
several positions successively since joining our Company, including the general manager of Chongqing Red Star Macalline
Shibo Home Living Plaza Company Limited (重慶紅星美凱龍世博家居生活廣場有限責任公司) and Chengdu Red Star
Macalline Shibo Home Living Plaza Company Limited (成都紅星美凱龍世博家居生活廣場有限責任公司) from June 2007
to August 2008, the general manager of our operating center in the southwest region and Shanghai from August 2008 to
June 2009, the assistant president and the general manager of our operating center in the Beijing-Shanghai Southwest region
from June 2009 to August 2012, the general manager of our operating center in the Beijing-Shanghai Southwest region
from September 2010 to August 2012. Prior to joining our Company, Mr. WANG served as the assistant general manager of
Wuhan GOME Electrical Appliances Ltd.(武漢國美電器有限公司) from March 2004 to December 2005. From December 2005
to June 2007, Mr. WANG served as the assistant general manager of the development center of Red Star Furniture Group,
mainly responsible for the operation of shopping malls in Changzhou and Xuzhou.
Mr. WANG graduated with a bachelor’s degree in Chinese from Hubei University (湖北大學) in June 1992 and a master’s
degree in business administration from Wuhan University of Technology (武漢理工大學) in June 2005. He graduated from
Renmin University of China with an EMBA in June 2015.
Mr. CHEN Donghui, aged 40, joined our Company in June 2007 and has been a vice general manager of our Company
since March 2013. He is primarily responsible for the development of online business of our Company. Mr. CHEN has held
several positions successively since joining our Company, including the general manager of the fourth operating center and
the general manager of Shandong, Northeast and North China regions from June 2007 to June 2010, the assistant to the
president and general manager of Northeast and North China regions from June 2010 to December 2013. Prior to joining
our Company, Mr. CHEN held several positions successively in Red Star Furniture Group, including as its accountant from
December 1994 to July 1996, the vice general manager in charge of business operation of its several operating subsidiaries
from July 1996 to August 2006, and the general manager of its forth operation center and Shandong, Northeast and North
China regions from August 2006 to June 2007. Mr. CHEN is Ms. CHEN Shuhong’s brother.

57Annual Report 2016
Directors, Supervisors and Senior Management
Mr. CHEN completed the advanced course of business administration at Shanghai Jiao Tong University (上海交通大學) in
April 2005 and his studies in business administration through online education at East China Normal University (華東師範
大學) in January 2014. He obtained his master’s degree in executive master of business administration in Shanghai Fudan
University (上海复旦大學) in June 2016.
Mr. ZHANG Xian, aged 38, joined our Company in June 2007 and has been a vice general manager of our Company since
March 2015. He is primarily responsible for the general operation of shopping malls and management of the pre-paid card,
building materials collection and logistics businesses of our Company. Mr. ZHANG has held several positions successively
since joining our Company, including the vice general manager of the fourth operating center, the vice general manager
of Shandong and Northeast regions, and the general manager of Sourthern area of Jiangsu Province from June 2007 to
December 2010, the assistant president and the general manager of operation and promotion center from December 2010
to January 2015. Prior to joining our Company, Mr. ZHANG held several positions successively in Red Star Furniture Group,
including the head of its human resources department and the director of its president offi ce from January 1999 to January
2005, the vice general manager of its fourth operation center, the vice general manager of Shandong and Northeast regions,
and the general manager of Sourthern area of Jiangsu Province area from January 2005 to June 2007. Mr. ZHANG was
awarded the honourable title of “Shanghai Youth 4th Medal” in April 2016.
Mr. ZHANG graduated with a master’s degree in business administration from Guangxi Normal University (廣西師範大學) in
June 2013.
Ms. TANG Zhengmao, aged 47, joined our Company in April 2015 and has been vice general manager and fi nancial
consultant of the board of directors of the Company since August 2015. Ms. TANG is primarily responsible for the
international investor relations, domestic and overseas fi nancing and market value management of the Company, and
provides fi nancial analysis and suggestion, and investment proposals to the Board. Before joining our Company, Ms. TANG
worked in the Research Institute of Shenzhen Headquarters of Junan Securities Co., Ltd., Investment Banking Division
of Hong Kong Branch and Sales Division from 1994 to 1999. During 2001 to 2002, Ms. TANG served in the New York
Investment Bank Headquarters of Credit Suisse First Boston, and later worked in SOHO China Ltd. from 2002 to 2014,
where she was successively appointed as the manager/chief inspector of Business Expending Department, chief inspector of
Corporate Financing and Investor Relations Department, secretary of the board of directors, executive director and CFO.
Ms. TANG completed her undergraduate courses of Economics and postgraduate courses of Western Economics in Fudan
University in 1991 and 1994, respectively, and obtained a MBA master’s degree in Business School of Yale University in 2001.
During the Reporting Period, Ms. TANG resigned.

58
Report of Directors
Red Star Macalline Group Corporation Ltd.
The Board of Directors is pleased to present this annual report together with the audited Consolidated Financial Statements of
the Company and its subsidiaries for the end of the Reporting Period.
CORPORATE INFORMATION AND GLOBAL OFFERING
The Company was incorporated in the PRC on 6 January 2011 as a sino-foreign joint stock company with limited liability. The
Company’s H Shares were listed on the Main Board of the Hong Kong Stock Exchange on 26 June 2015.
PRINCIPAL ACTIVITIES
The Group operates as a leading home improvement and furnishings shopping mall operator in China principally engaged in
the operation of owned/leased portfolio shopping malls, managed shopping malls, sales of merchandise and related services
businesses. The principal activities of the Group are as follows:
i. owned/leased portfolio shopping malls including leasing fl oor areas to the tenants and providing comprehensive and
continuous operation and management support to them;
ii. managed shopping malls including providing initiation, consultation and management services to the Group’s partners
and the construction contractors to develop and manage the shopping malls under the Group’s own brand;
iii. sales of merchandise and related services including retail sales of home furnishing merchandise and providing related
decorating services.
Please refer to Note 50 to the Consolidated Financial Statements on pages 238 to 240 for details of the principal activities
of the principal subsidiaries of the Group. There were no signifi cant changes in the nature of the Group’s principal activities
during the Reporting Period.
SUMMARY OF FINANCIAL INFORMATION AND OPERATING RESULTS
Please refer to the section headed “Management Discussion and Analysis” on pages 10 to 44 for a summary of fi nancial
information and operating results of the Group for the end of the Reporting Period.
BUSINESS REVIEW
A review of the business of the Group during the year and a discussion on the Group’s future business development are
provided in the section headed “Chairman’s Statement” on pages 7 to 9 as well as the section headed “Management
Discussion and Analysis” on pages 10 to 44. Description of possible risks that the Group may be facing can be found in the
section headed “Management Discussion and Analysis” on pages 10 to 44. Also, the risk management objectives and policies
of the Group can be found in the section headed “Corporate Governance Report” on page 88. Particulars of important events
affecting the Group that have occurred since the end of the fi nancial year ended 31 December 2016 are provided in Note 51
to the Consolidated Financial Statements on page 240 and the section headed “Management Discussion and Analysis” on
pages 10 to 44. An analysis of the Group’s performance during the year using fi nancial key performance indicators is provided
in the section headed “Management Discussion and Analysis” on pages 10 to 44.
59Annual Report 2016
Report of Directors
ENVIRONMENTAL POLICIES AND PERFORMANCE
We are subject to certain environmental protection laws and regulations, including the Prevention and Control of Water
Pollution Law of the People’s Republic of China (《中華人民共和國水污染防治法》), the Prevention and Control of
Atmospheric Pollution Law of the People’s Republic of China (《中華人民共和國大氣污染防治法》), the Prevention and
Control of Noise Pollution Law of the People’s Republic of China(《中華人民共和國環境噪聲污染防治法》), the Prevention
and Control of Environmental Pollution by Solid Waste Law of the People’s Republic of China (《中華人民共和國固體廢物
污染環境防治法》), the Environmental Impact Assessment Law of the People’s Republic of China (《中華人民共和國環境
影響評價法》), the Administrative Regulations on Environmental Protection for Acceptance Examination upon Completion
of Buildings (《建設項目竣工環境保護驗收管理辦法》) and the Administrative Regulations on Environmental Protection
for Development Projects (《建設項目環境保護管理條例》). Each of our property development projects is required under
People’s Republic of China laws to undergo environmental impact assessments. We must submit the relevant environmental
impact study or report to the environmental authorities, along with other required documents, for evaluation and approval by
the authorized environmental protection authorities. The approval from the relevant government authorities will specify the
standards applicable to the construction project with respect to areas such as air pollution, noise emissions and water and
waste discharge. Such measures are required to be incorporated into the design, construction and operation of the particular
project. Upon completion of each project, the relevant government authorities will also inspect the site to ensure that all
applicable environmental standards have been complied with.
We have taken and will continue to take specifi c measures to ensure our compliance with applicable environmental laws and
regulations, including (i) strictly selecting construction contractors and supervising the process of construction; (ii) applying
for review by the relevant government authorities in a timely manner after the project is completed; and (iii) actively adopting
environmentally friendly equipment and designs. We also undertake voluntary environmental protection actions and make
energy conservation and emission reduction our top considerations when designing our property projects. In 2016, we
incurred environmental compliance costs of approximately RMB179.84 million. We expect the annual costs of compliance
going forward to be substantially similar, assuming that there will not be any material changes in environmental protection
rules and regulations.
As at the end of the Reporting Period, none of our shopping malls had received any material fi nes or penalties associated with
any breach of any environmental laws or regulations since the commencement of their operations.
The Board has overall responsibility for our environmental social and governance (“ESG”) strategy and reporting. The Board
is responsible for evaluating and determining our ESG-related risks, and ensuring that appropriate and effective ESG risk
management and internal control systems are in place. A confi rmation regarding effectiveness of these systems has been
provided to the Board during the year ended 31 December 2016. A separate ESG report complying with the disclosure
requirements under Appendix 27 to the Listing Rules will be published by the Group separately, in any event no later than
three months after the publication of this annual report.

60 Red Star Macalline Group Corporation Ltd.
Report of Directors
COMPLIANCE WITH RELEVANT LAWS AND REGULATIONS
The Group and its activities are required to comply with the requirements of laws and regulations of China, including but
not limited to The Company Laws of the People’s Republic of China (《中華人民共和國公司法》), The Law of the PRC on
Protection of Consumer Rights and Interest (《中華人民共和國消費者權益保護法》), The Law of Administration of Urban
Real Estate of the PRC (《中華人民共和國城市房地產管理法》), Construction Law of the People’s Republic of China (《中
華人民共和國建築法》), laws, regulations and other normative documents. The Group focuses on internal risk management
and control. The independent fi nancial management center, legal department, internal control compliance department are
responsible for conducting analysis and review of the laws and regulations applicable to the Company within the internal
approval process and assign a professional team to effectively conduct management, inspections and rectifi cation, to ensure
that the Group is in compliance with relevant laws and regulations in all major aspects.
The Group has complied with the requirements under the Companies Ordinance, the Listing Rules and the SFO for, among
other things, the disclosure of information and corporate governance. The Group has adopted the Model Code.
RELATIONS WITH EMPLOYEES, SUPPLIERS AND CUSTOMERS
The Group understands well that employees are valuable assets and thus offers competitive remuneration portfolio to
attract and motivate employees. The Group reviews the employees’ remuneration portfolio on a regular basis and makes
necessary adjustment to align the market standards. The Group also understands that it is of great importance to maintain
good relations with suppliers and customers for the realization of the short-term and long-term goals. For the purpose of
maintaining the competitiveness of brands and the leading position, the Group is committed to providing premium products
and services to customers. During the Reporting Period, the Group has no material and signifi cant dispute with suppliers and/
or customers.
KEY RISKS AND UNCERTAINTIES
For details of the Group’s key risks and uncertain factors for the end of the Reporting Period, please refer to pages 10 to 44 in
the section headed “Management Discussion and Analysis”.
61Annual Report 2016
Report of Directors
BANK LOANS AND OTHER BORROWINGS
Please refer to Note 32 to the Consolidated Financial Statements on pages 199 to 200 for details of bank loans and other
borrowings of the Group as of the end of the Reporting Period.
BONDS
On 14 July 2016, the issue of the second tranche Corporate Bonds of the Company was completed with an issue size of
RMB3,000,000,000 at coupon rates of 3.50% and 4.29% for Category I Bonds and Category II Bonds, respectively, and issue
price at 100% of its principal value. Such Corporate Bonds are listed on the Shanghai Stock Exchange.
The net proceeds from the Corporate Bonds are used to repay the loan of the Company and its subsidiaries. For further
details, please refer to the announcements issued by the Company on 8 July, 12 July and 15 July 2016, respectively.
Please refer to Note 33 to the Consolidated Financial Statements on pages 201 to 202 for details of bonds of the Group for
the end of the Reporting Period.
CONTINGENT LIABILITIES
Please refer to Note 47 to the Consolidated Financial Statements on page 227 for details of contingent liabilities of the Group
for the end of the Reporting Period.
INVESTMENT PROPERTIES
All investment properties we owned were for rental income, and they are subject to medium-term lease in the PRC. Set out
below are investment properties that are considered material by our Directors.
No. Property Existing Use
Fair value in
existing state as
at the end of
the Reporting
Period
RMB’000
1. Shanghai Zhenbei Phase II Mall Shopping Mall 4,636,000
No. 1058 Zhenbei Road
Shanghai
The PRC

62 Red Star Macalline Group Corporation Ltd.
Report of Directors
No. Property Existing Use
Fair value in
existing state as
at the end of
the Reporting
Period
RMB’000
2. Shanghai Pudong Hunan Mall Shopping Mall 4,323,000
No. 518 Linyu Road
Pudong New Area
Shanghai
The PRC
3. Zhengzhou Shangdu Mall Shopping Mall 3,496,000
No. 1 Shangdu Road
Zhengdong New District
Zhengzhou City
Henan Province
The PRC
4. Shanghai Wenshui Mall Shopping Mall 3,406,000
No. 1555 Wenshui Road
Baoshan District
Shanghai
The PRC
5. Nanjing Kazimen Mall Shopping Mall 3,382,000
No. 29 Kazimen Street
Qinhuai District
Nanjing City
Jiangsu Province
The PRC
6. Beijing East Fourth-Ring Mall Shopping Mall 3,170,000
No. 193 East Fourth-Ring Middle Road
Chaoyang District
Beijing
The PRC

63Annual Report 2016
Report of Directors
No. Property Existing Use
Fair value in
existing state as
at the end of
the Reporting
Period
RMB’000
7. Shenyang Tiexi Mall Shopping Mall 3,095,000
No. 35 Bei Er East Road
Tiexi District
Shenyang City
Liaoning Province
The PRC
8. Shanghai Pudong Jinqiao Mall Shopping Mall 2,767,000
No. 100 Jinzang Road
Pudong New Area
Shanghai
The PRC
9. Beijing West Fourth-Ring Mall Shopping Mall 2,605,000
No. 113 West Fourth Ring Road
Fengtai District
Beijing
The PRC
10. Beijing North Fourth-Ring Mall Shopping Mall 2,358,000
No. 1 Beishatan,
Chaoyang District
Beijing
The PRC
PROPERTY, PLANT AND EQUIPMENT
Please refer to Note 18 to the Consolidated Financial Statements on pages 178 to 179 for details of movements in the
property, plant and equipment of the Group for the end of the Reporting Period.

64 Red Star Macalline Group Corporation Ltd.
Report of Directors
DISTRIBUTABLE RESERVES
The distributable reserves of the Company as at the end of the Reporting Period amounted to RMB2,548.6 million.
Please refer to the consolidated statement of changes in equity on pages 121 to 123 and Note 49 to the Consolidated
Financial Statements on pages 236 to 237 for the change in reserves of the Group and information about the statement of
fi nancial position of the Company for the end of the Reporting Period.
MATERIAL ACQUISITION AND DISPOSAL OF SUBSIDIARY, ASSOCIATES AND JOINT VENTURES
The Group had no material acquisition or disposal of the subsidiaries, associates and joint ventures during the Reporting
Period.
FINAL DIVIDEND AND TAXATION RELIEF
The Board resolved to propose to the Shareholders in the forthcoming annual general meeting on 8 June 2017 for the
distribution of a fi nal dividend of RMB0.42 per share for the year ended 31 December 2016 payable to the Shareholders
whose names are listed in the registers of members of the Company on 20 June 2017. The proposal for the distribution of the
fi nal dividend above is subject to the consideration and approval of the Shareholders at the AGM.
Pursuant to the PRC Individual Income Tax Law (《中華人民共和國個人所得稅法》), the Implementation Regulations of
the PRC Individual Income Tax Law (《中華人民共和國個人所得稅法實施條例》), other laws and regulations and relevant
regulatory documents promulgated by the State Administration of Taxation of the PRC, the Company shall, as a withholding
agent, withhold and pay individual income tax at the rate of 10% for the individual holders of H Shares in respect of the
dividend for 2016 to be distributed to them. The individual holders of H Shares may be entitled to certain tax preferential
treatments pursuant to the tax treaties between the PRC and the countries (regions) in which the individual holders of H
Shares are domiciled and the tax arrangements between mainland China, Hong Kong or Macau.
For non-resident enterprise holders of H Shares, the Company will withhold and pay enterprise income tax at the tax rate of
10% for such holders of H Shares pursuant to relevant regulatory documents of the State Administration of Taxation of the
PRC.
For investors of the Shanghai Stock Exchange investing in the H Shares of the Company, the Company will distribute the
cash dividend for 2016 to the Shanghai Branch of China Securities Depository and Clearing Corporation Limited which, as the
nominee of the investors of H Shares of Southbound Trading, will then distribute the cash dividends to the relevant investors
of H Shares of Southbound Trading through its depository and clearing system. Pursuant to the Notice on the Tax Policies
Related to the Pilot Program of the Shanghai-Hong Kong Stock Connect (Caishui [2014] No. 81) (《關於滬港股票市場交易
互聯互通機制試點有關稅收政策的通知》), for domestic individual investors, the Company shall withhold and pay individual
65Annual Report 2016
Report of Directors
income tax at the rate of 20% on behalf of the investors. For domestic securities investment funds, the tax payable shall be
the same as that for individual investors. The Company will not withhold and pay the income tax of dividends for domestic
enterprise investors which shall report and pay the relevant tax themselves. The record date and the date of distribution of
cash dividends and other arrangements for the investors of Southbound Trading will be the same as those for the holders of H
Shares of the Company.
Should the holders of H Shares of the Company have any doubt in relation to the aforesaid arrangements, they are
recommended to consult their tax advisors for relevant tax impact in mainland China, Hong Kong and other countries (regions)
on the possession and disposal of the H Shares of the Company.
RETIREMENT BENEFITS
Please refer to Note 39 to the Consolidated Financial Statements on page 208 for details of retirement benefi ts of the Group
for the end of the Reporting Period.
FINANCIAL SUMMARY
The Group’s fi nancial summary for the last fi ve fi nancial years is set out on page 241 of this annual report. This summary does
not form part of the Consolidated Financial Statements.
MAJOR SUPPLIERS AND CUSTOMERS
Purchases from the largest supplier of the Group for the end of the Reporting Period represented approximately 32.7%
of the Group’s total purchases. The total purchases attributable to the fi ve largest suppliers of the Group accounted for
approximately 49.5% of the total purchases of the Group for the end of the Reporting Period.
Sales to the largest third party customer for the end of the Reporting Period represented approximately 0.3% of the Group’s
total revenue. The total sales attributable to the fi ve largest third party customers of the Group accounted for approximately
1.5% of the Group’s total revenue for the end of the Reporting Period.
For the Reporting Period, none of the Directors or their respective Close Associates or any Shareholder (which to the
knowledge of the Directors owns more than 5% of the Company’s share capital) had any interests in the fi ve largest suppliers
or customers of the Group.
CHARITABLE DONATIONS
The donations by the Group for the end of the Reporting Period amounted to RMB5.9 million.

66 Red Star Macalline Group Corporation Ltd.
Report of Directors
CONNECTED AND CONTINUING CONNECTED TRANSACTIONS
Among the related party transactions disclosed in Note 48 to the Consolidated Financial Statements, the following
transactions constitute continuing connected transactions for the Company and are required to be disclosed in this annual
report in accordance with Chapter 14A of the Listing Rules. The Company did not enter into any connected transaction during
the Reporting Period.
(i) Changzhou RSHFC Lease Agreement
On April 1, 2011, the Company’s wholly owned subsidiary, Changzhou Macalline entered into a lease agreement with
Changzhou RSHFC, pursuant to which Changzhou Macalline will lease a piece of property from Changzhou RSHFC for
the operation and management of Changzhou Decoration Mall.
The Changzhou RSHFC Lease Agreement has an initial term of ten years commencing from its signing date. Changzhou
Macalline will pay annual rental and service fees in the fi xed amount of RMB13.8 million per annum for the initial three
years, followed by a 10% increase for the fourth year and a 3% increase for each of the remaining six years. Such
pricing mechanism has been determined by reference to (i) the prevailing market prices of similar properties in the same
area; (ii) costs of acquisition of the property by Changzhou RSHFC; and (iii) depreciation costs of the properties. During
the term of the Changzhou RSHFC Lease Agreement, Changzhou Macalline has the exclusive right to use the leased
property. Subject to applicable laws and regulations, the Changzhou RSHFC Lease Agreement may be renewed based
on the parties’ negotiation following the written notice from Changzhou Macalline at least two months before the expiry
of the lease.
Since Changzhou RSHFC is an individual proprietorship enterprise established by Mr. CHE Jianxing in his personal
capacity, transferring the property to our Group by way of asset transfer would give rise to tax implications for
Changzhou RSHFC under applicable the PRC laws, which would ultimately be translated into our purchase price
for such property. Accordingly, we decided to lease the property from Changzhou RSHFC for our management and
operation of Changzhou Decoration Mall.
For each of the years ended December 31, 2014, 2015 and 2016, Changzhou Macalline paid annual rental and service
fees of RMB14.8 million, RMB15.5 million and RMB16.0 million, respectively, to Changzhou RSHFC pursuant to the
Changzhou RSHFC Lease Agreement. Based on the pricing mechanism as described above, the annual caps for the
lease for each of the years ended/ending December 31, 2015, 2016 and 2017 is expected to be RMB15.5 million,
RMB16.0 million and RMB16.5 million, respectively.
For the Reporting Period, the rental and service fees paid and payable by Changzhou Macalline pursuant to the
Changzhou RSHFC Lease Agreement amounted to RMB16.0 million.

67Annual Report 2016
Report of Directors
(ii) Contract management agreements with Xuzhou RSHFC, Xuzhou RSHFP, Yangzhou RSHFP,
Jining Hongrui and Shaanxi Hongrui
The Company entered into a contract management agreement and the supplemental agreement, as the case may be,
with each of Xuzhou RSHFC, Xuzhou RSHFP, Yangzhou RSHFP, Jining Hongrui and Shaanxi Hongrui (the “Associated
Business Partners”), pursuant to which the Company will manage and operate the home improvement and furnishings
shopping malls owned by each respective Associated Business Partner. As such contract management agreements are
of the same nature and have been entered into with parties connected with us by virtue of being the Associates of Mr.
CHE Jianxing and Ms. CHE Jianfang, these agreements have been classifi ed as aggregated under the Listing Rules.
Under each of the contract management agreements, the Company initially charged our Associated Business Partners
a fi xed amount of the management fee ranging from RMB2.0 million to RMB6.0 million per annum, as the case may
be, which was in line with our pricing policy for contract management arrangements entered into prior to 2013. In
December 2013 and January 2014, the Company entered into supplemental agreements with Xuzhou RSHFC, Xuzhou
RSHFP and Jining Hongrui, under which the Company and the relevant Associated Business Partners agreed to revise
the pricing mechanism relating to the management fee from a fi xed fl at rate to a percentage of the total amount of rental
received by each respective Associated Business Partner, subject to a minimum amount of the annual management
fee. The adjustment was made after arm’s length negotiations between us and each respective Associated Business
Partner to refl ect current market conditions. The terms and conditions under our contract management agreements with
Yangzhou RSHFP and Shaanxi Hongrui remain unchanged, except that the Company waived part of the management
fee payable by Shaanxi Hongrui in 2014 on a one-off basis due to Shaanxi Hongrui’s special request. Each of these fi ve
contract management agreements is for a term ranging from seven to ten years commencing from its signing date.
The amount of the management fee under the fi ve contract management agreements was determined based on: (i) the
local market conditions; (ii) our estimation of the future rental income level for each respective shopping mall; and (iii) our
respective business partner’s expectation of the future rental income.
For each of the years ended December 31, 2014, 2015 and 2016, the Company received management fees in the total
amount of RMB17.0 million, RMB13.0 million and RMB12.5 million under the fi ve contract management agreements
with the Associated Business Partners. Based on (i) the pricing mechanism as described above, (ii) the market
conditions, (iii) our current estimation of the future rental income level for each respective shopping mall; and (iv) our
respective business partner’s expectation of the future rental income, the annual caps for the management fees for
each of the years ended/ending December 31, 2015, 2016 and 2017 is expected to be RMB17.3 million, RMB17.8
million and RMB18.3 million, respectively.
For the Reporting Period, the management fees received and receivable by the Company pursuant to these agreements
and these supplemental agreements amounted to RMB12.5 million.
68 Red Star Macalline Group Corporation Ltd.
Report of Directors
Most of the home improvement and furnishings shopping malls managed and operated by us under the fi ve contract
management agreements are located in Tier III Cities and Other Cities in the PRC. The Associated Business Partners
intended to leverage our operational experience and reputation through cooperation with us. Our Directors believe that
it is in our interest, and in line with our business strategy, to leverage the Associated Business Partners’ knowledge and
experience to expand our geographic coverage and improve our market share and brand awareness in these new local
markets, with relatively low capital need.
(iii) RSED Framework Agreement
Our direct wholly owned subsidiary, Xingyi Tonghui, entered into a pre-paid cards purchase framework agreement with
RSED on March 20, 2015 and a supplemental agreement dated June 3, 2015 (the “RSED Framework Agreement”),
pursuant to which Xingyi Tonghui will sell our single-purpose pre-paid cards to RSED and/or its subsidiaries (“RSED
Group”) for its use as a promotion method in connection with its property sales business. The RSED Framework
Agreement has a term of three years from its signing date to March 20, 2018.
Under the RSED Framework Agreement, Xingyi Tonghui and RSED Group will enter into separate pre-paid card
purchase agreements on normal commercial terms which will set out the purchase price and the purchase volume. The
purchase price shall be determined after arm’s length negotiations by reference to the face value of the pre-paid cards,
the actual purchase volume, and the then market conditions. Xingyi Tonghui shall provide facilities and services for
cardholders to purchase products using the pre-paid cards.
RSED Group is primarily engaged in real estate development, operation and management of department stores, and the
construction and management of multipurpose complexes. Our cooperation with RSED Group could promote the sales
of our pre-paid cards and the performance of Xingyi Tonghui. It would also help to bring new customers to our home
improvement and furnishings shopping malls and as a result increase the sales of our shopping malls.
The annual caps for the RSED Framework Agreement for each of the years ending December 31, 2015, 2016 and
2017 is expected to be RMB100 million, RMB150 million and RMB200 million, respectively, in terms of face value of
the pre-paid cards. Such annual caps were determined based on (i) the pricing mechanism as described above; and
(ii) an estimate of RSED Group’s purchase volume of our pre-paid cards, which is expected to increase taking into
account RSED Group’s current estimate of its contracted sales amount for 2015 to 2017, which is RMB10,000 million,
RMB15,000 million and RMB20,000 million respectively for each of the three years ended/ending December 31, 2017.
For the Reporting Period, there is no actual amount occurred with RSED Group.

69Annual Report 2016
Report of Directors
(iv) Lease Agreement with Shanghai Hongmei in connection with the leasing of the Jinshan Property
On 25 September 2015, the Company entered into a lease agreement with Shanghai Hongmei Properties Limited in
connection with the leasing of the Jinshan Property (the “Lease Agreement”). In June 2016, the Company, its wholly-
owned subsidiary, Shanghai Red Star Macalline Kaiheng Household Co., Ltd. (上海紅星美凱龍楷恒家居有限公
司) (“Red Star Macalline Kaiheng”) and Shanghai Hongmei entered into a supplemental agreement pursuant to which
the rights and obligations of the Company under the Lease Agreement have been transferred to Red Star Macalline
Kaiheng. Other than that, the terms and conditions of the Lease Agreement remain the same.
There was no historical transaction between the Group and Shanghai Hongmei, as the Jinshan Property is a newly built
property.
The Jinshan Property is located at the area under development in Shanghai, the PRC, and the Group has opened the
fi rst upscale large home improvement and furnishings shopping mall, namely, Shanghai Jinshan Shopping Mall (上海金
山商場), in the area in May 2016. The Directors believe that the lease could enable the Group to enter into a neighboring
market of Shanghai at reasonable costs and to further improve the Group’s market share and brand awareness in
Shanghai, which will help the Group to consolidate its leading position in the Shanghai market and will be benefi cial to
its long-term development.
The annual caps in respect of the Lease Agreement based on the annual rent and any other fees payable by the
Company for each of the years ended/ending 31 December 2016, 2017 and 2018 is expected to be RMB7 million,
RMB9 million and RMB12 million, respectively. The rent payable in respect of the lease pursuant to the Properties
Limited Lease Agreement was determined following arm’s length negotiation between the Company and Shanghai
Hongmei with reference to the prevailing pricing mechanisms of other shopping malls operated by the Group in
nearby areas and in similarly-ranked cities, the expected rent that may be received by the Company from the tenants
in connection with the shopping mall to be opened at the Jinshan Property, and development stage of the home
improvement and furnishings market in the local area.
For the Reporting Period, the annual rent and other fees paid and payable by the Company pursuant to the Lease
Agreement amounted to RMB4.7 million.
The Company confi rms that it has complied with the disclosure requirements in accordance with Chapter 14A of Listing
Rules.
The independent non-executive Directors, after taking into consideration of factors such as market environment, transaction
amounts, corporate governance, have confi rmed that the abovementioned continuing connected transactions for the year
ended 31 December 2016 were entered into by the Group: (i) in the ordinary and usual course of its business; (ii) on normal
commercial terms; and (iii) in accordance with the relevant agreements governing them and on terms that were fair and
reasonable and in the interests of the Company and the Shareholders as a whole.

70 Red Star Macalline Group Corporation Ltd.
Report of Directors
The Company has assigned the fi nance department to monitor the continuing connected transactions. The fi nance
department will prepare relevant information and materials in relation to the continuing connected transactions and submit
the same to the Secretariat of the Board of Directors for compliance checking before submitting all relevant information and
materials to the Board for consideration. All relevant information will be attached as appendices to the board resolutions.
In relation to those continuing connected transactions conducted during the Reporting Period, the fi nance department and
the Secretariat of the Board of Directors have reviewed and considered the relevant information and materials to ensure
compliance with relevant requirements (such as not exceeding the annual caps and ensuring the transactions are carried out
in accordance with their respective terms) so as to protect the interests of our Shareholders.
The auditor of the Company has issued its unqualifi ed letter containing its fi ndings and conclusions in respect of the
abovementioned continuing connected transactions in accordance with Rule 14A.56 of the Listing Rules, confi rming that
(i) nothing has come to their attention that causes the auditor to believe that the abovementioned continuing connected
transactions have not been approved by the Board of Directors, (ii) for transactions involving the provision of goods or
services by the Group, nothing has come to their attention that causes the auditor to believe that the transactions were not, in
all material respects, in accordance with the pricing policies of the Group, (iii) nothing has come to their attention that causes
the auditor to believe that the transactions were not entered into, in all material respects, in accordance with the terms of the
relevant agreements governing such transactions; and (iv) with respect to the aggregate amount of each of the transactions,
nothing has come to their attention that causes the auditor to believe that the amounts have exceeded the maximum
aggregate annual value disclosed in the Prospectus and the previous announcement dated 25 September 2015. A copy of
the auditor’s letter has been provided by auditor to the Hong Kong Stock Exchange.
SHARE CAPITAL
Please refer to Note 37 to the Consolidated Financial Statements on pages 204 to 205 for details of movements in the
Company’s total issued shares for the end of the Reporting Period.
EQUITY-LINKED AGREEMENT
There was no equity-linked agreement entered into by the Company for the end of the Reporting Period.
PURCHASE, SALE OR REDEMPTION OF THE COMPANY’S LISTED SECURITIES
During the Reporting Period, neither the Company nor any of its subsidiaries purchased, sold or redeemed any of the
Company’s listed securities.
71Annual Report 2016
Report of Directors
USE OF PROCEEDS FROM GLOBAL OFFERING
The net proceeds from the Global Offering amounted to approximately RMB5,573.3 million. The Board resolved on 31 July
2015 to change the intended use of part of the net proceeds from the Global Offering. For further details, please refer to the
announcement of the Company dated 31 July 2015.
As at the end of the Reporting Period, the Company has utilized 76% of the net proceeds in total for the development of nine
Portfolio Shopping Malls, investment or acquisition of other home improvement and furnishings retailers and other market
participants, refi nancing of our existing indebtedness, development of our O2O business and information technology systems,
working capital and other general corporate purposes.
BOARD OF DIRECTORS
The Directors of the Company during the Reporting Period are:
Executive Directors
Mr. CHE Jianxing (Chairman)
Ms. ZHANG Qi (Vice Chairman)
Ms. CHE Jianfang
Mr. JIANG Xiaozhong
Non-executive Directors
Ms. CHEN Shuhong
Mr. XU Guofeng
Mr. Joseph Raymond GAGNON
Mr. ZHANG Qiqi
Independent Non-executive Directors
Mr. LI Zhenning
Mr. DING Yuan
Mr. LEE Kwan Hung
Mr. QIAN Shizheng (appointed on 19 April 2016)
Mr. ZHOU Qinye (resigned on 19 April 2016)
Each of our Directors entered into a contract with the Company in December 2016. In accordance with Article 90 of the
Articles of Association, the Directors shall be elected at general meetings for a term of three years, which is renewable upon
re-election when it expires.

72 Red Star Macalline Group Corporation Ltd.
Report of Directors
DIRECTORS’, SUPERVISORS’ AND CHIEF EXECUTIVES’ INTERESTS AND SHORT POSITIONS IN SHARES, UNDERLYING SHARES AND DEBENTURES
As at the end of the Reporting Period, the interests and short positions of our Directors, Supervisors and chief executive in the
shares, underlying shares or debentures of the Company or any of our associated corporations (within the meaning of Part XV
of the SFO), which were required (a) to be notifi ed to the Company and the Stock Exchange pursuant to Divisions 7 and 8 of
Part XV of the SFO (including interests and short positions which they were taken or deemed to have under such provisions of
the SFO); or (b) pursuant to section 352 of the SFO, to be entered in the register referred to therein; or (c) to be notifi ed to the
Company and the Stock Exchange pursuant to the Model Code for Securities Transactions by Directors of Listed Issuers as
contained in Appendix 10 to the Listing Rules, were as follows:
SHARES AND UNDERLYING SHARES OF THE COMPANY AND ASSOCIATED CORPORATIONS
(i) The Company
Name of Shareholders Title Class of Shares Nature of interest
Number of
underlying
shares held
Approximate
percentage in
relevant class
of Shares(1)
Approximate
percentage in
total Shares(1)
CHE Jianxing (車建興)(2) Chairman,
Chief Executive Offi cer and
Executive Director
Domestic Shares Interest of controlled
corporation
2,480,315,772
(Long Position)
96.85% 68.44%
CHEN Shuhong (陳淑紅)(3) Non-executive Director Domestic Shares Interest of spouse 2,480,315,772
(Long Position)
96.85% 68.44%
Notes:
(1) As at the end of the Reporting Period, the Company had 3,623,917,038 issued Shares in total, comprising of 2,561,103,969 Domestic Shares and
1,062,813,069 H Shares.
(2) Mr. CHE Jianxing indirectly holds 68.44% of the issued Shares in total of the Company through his 92.00% direct interest in Red Star Macalline
Holding Group Company Limited (紅星美凱龍控股集團有限公司) (formerly known as “Shanghai Red Star Macalline Investments Company Limited”
(上海紅星美凱龍投資有限公司)) (“RSM Holding”, a limited liability company incorporated in the PRC) and is deemed to be interested in the
2,480,315,772 Domestic Shares held by RSM Holding for the purpose of the SFO.
(3) Ms. CHEN Shuhong is the spouse of Mr. CHE Jianxing. Under the SFO, Ms. CHEN Shuhong is deemed to be interested in the same number of
Shares in which Mr. CHE Jianxing is interested.
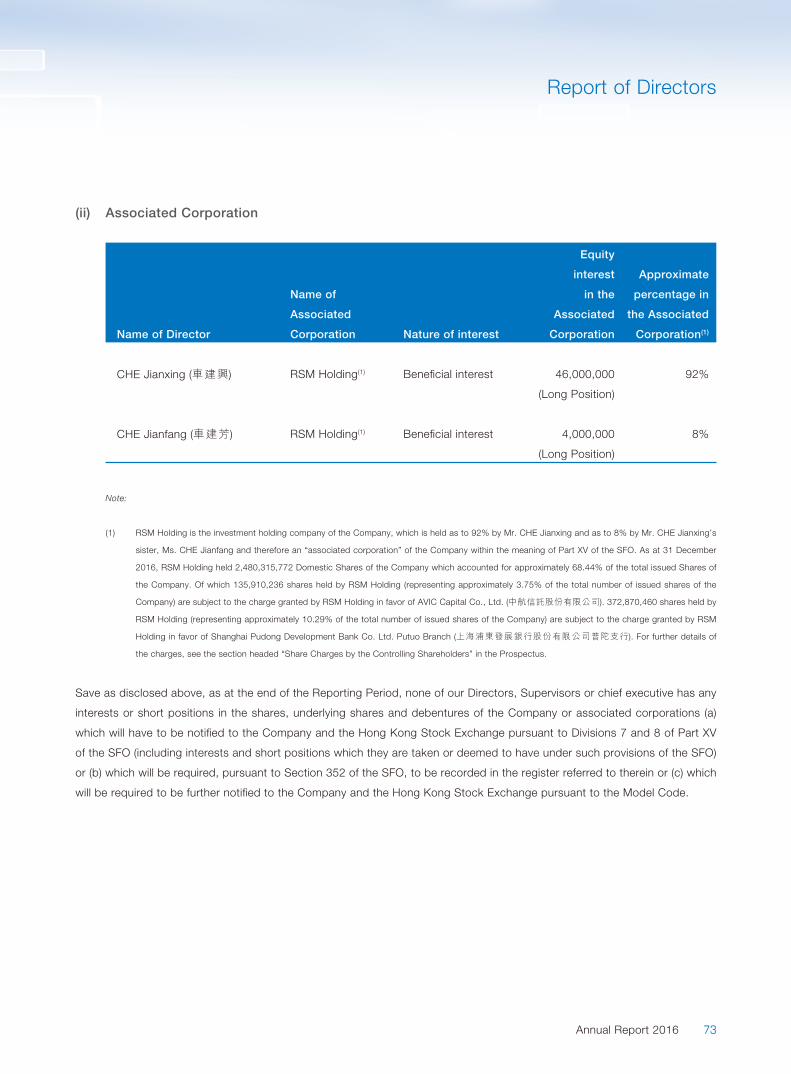
73Annual Report 2016
Report of Directors
(ii) Associated Corporation
Name of Director
Name of
Associated
Corporation Nature of interest
Equity
interest
in the
Associated
Corporation
Approximate
percentage in
the Associated
Corporation(1)
CHE Jianxing (車建興) RSM Holding(1) Benefi cial interest 46,000,000
(Long Position)
92%
CHE Jianfang (車建芳) RSM Holding(1) Benefi cial interest 4,000,000
(Long Position)
8%
Note:
(1) RSM Holding is the investment holding company of the Company, which is held as to 92% by Mr. CHE Jianxing and as to 8% by Mr. CHE Jianxing’s
sister, Ms. CHE Jianfang and therefore an “associated corporation” of the Company within the meaning of Part XV of the SFO. As at 31 December
2016, RSM Holding held 2,480,315,772 Domestic Shares of the Company which accounted for approximately 68.44% of the total issued Shares of
the Company. Of which 135,910,236 shares held by RSM Holding (representing approximately 3.75% of the total number of issued shares of the
Company) are subject to the charge granted by RSM Holding in favor of AVIC Capital Co., Ltd. (中航信託股份有限公司). 372,870,460 shares held by
RSM Holding (representing approximately 10.29% of the total number of issued shares of the Company) are subject to the charge granted by RSM
Holding in favor of Shanghai Pudong Development Bank Co. Ltd. Putuo Branch (上海浦東發展銀行股份有限公司普陀支行). For further details of
the charges, see the section headed “Share Charges by the Controlling Shareholders” in the Prospectus.
Save as disclosed above, as at the end of the Reporting Period, none of our Directors, Supervisors or chief executive has any
interests or short positions in the shares, underlying shares and debentures of the Company or associated corporations (a)
which will have to be notifi ed to the Company and the Hong Kong Stock Exchange pursuant to Divisions 7 and 8 of Part XV
of the SFO (including interests and short positions which they are taken or deemed to have under such provisions of the SFO)
or (b) which will be required, pursuant to Section 352 of the SFO, to be recorded in the register referred to therein or (c) which
will be required to be further notifi ed to the Company and the Hong Kong Stock Exchange pursuant to the Model Code.

74 Red Star Macalline Group Corporation Ltd.
Report of Directors
SUBSTANTIAL SHAREHOLDERS’ INTERESTS AND SHORT POSITIONS IN SHARES AND UNDERLYING SHARES
As at the end of the Reporting Period, the interests or short positions in the shares or underlying shares which will have to
be notifi ed to the Company and the Stock Exchange pursuant to Divisions 2 and 3 of Part XV of the SFO, and which will be
required, pursuant to Section 336 of the SFO, to be recorded in the register referred to therein, as well as persons (other
than the Directors, Supervisors or chief executive of the Company), or corporations deemed, directly and/or indirectly, to be
interested in 5% or more of the nominal value of any class of share capital carrying rights to vote in all circumstances at our
general meetings were as follows:
Name of Shareholders Class of Shares
Capacity/nature
of Interest
Number of
Share interested
Approximate
percentage in
relevant class
of Shares(1)
Approximate
percentage in
total share
capital(1)
RSM Holding Domestic Shares Benefi cial owner 2,480,315,772 96.85% 68.44%
Warburg Pincus & Co.(2) H Shares Interest of controlled corporation 519,225,069 48.85% 14.33%
Warburg Pincus Partners GP LLC(2) H Shares Interest of controlled corporation 519,225,069 48.85% 14.33%
Warburg Pincus Partners, L.P.(2) H Shares Interest of controlled corporation 519,225,069 48.85% 14.33%
Warburg Pincus Real Estate I GP, LLC(2) H Shares Interest of controlled corporation 519,225,069 48.85% 14.33%
Candlewood Investment SRL(2) H Shares Other 338,054,924 31.81% 9.33%
Warburg Pincus Real Estate I L.P.(2) H Shares Interest of controlled corporation 338,054,924 31.81% 9.33%
Springwood Investment SRL(2) H Shares Other 181,170,145 17.05% 5.00%
WPRE I Redstar Manager LLC(2) H Shares Interest of controlled corporation 181,170,145 17.05% 5.00%
WPRE I Redstar, L.P.(2) H Shares Interest of controlled corporation 181,170,145 17.05% 5.00%
Central Huijin Investment Ltd.(3) H Shares Interest of corporation controlled 53,500,000 5.03% 1.48%
China Reinsurance (Group) Corporation(3) H Shares Benefi cial owner 53,500,000 5.03% 1.48%
75Annual Report 2016
Report of Directors
Notes:
(1) As at 31 December 2016, the Company had 3,623,917,038 issued Shares in total, comprising of 2,561,103,969 Domestic Shares and 1,062,813,069 H
Shares.
(2) Warburg Pincus Real Estate I, L.P. is the sole quota-holder of Candlewood Investment SRL (“Candlewood”). Warburg Pincus Real Estate I, L.P. is
100%-controlled by Warburg Pincus Real Estate I GP, LLC.
WPRE I Redstar, L.P. is the sole quota-holder of Springwood Investment SRL (“Springwood”). WPRE Redstar Manager LLC is the general partner of WPRE I
Redstar, L.P.. Warburg Pincus Real Estate I GP, LLC is a member of WPRE Redstar Manager LLC.
Accordingly, Warburg Pincus Real Estate I GP, LLC is deemed to be interested in the shareholding interest of each of Warburg Pincus Real Estate I, L.P.,
Candlewood Investment SRL, WPRE Redstar Manager LLC, WPRE I Redstar, L.P. and Springwood Investment SRL in the Company pursuant to the
disclosure requirements under the SFO.
Warburg Pincus Partners, L.P. is a member of Warburg Pincus Real Estate I GP, LLC. Warburg Pincus Partners GP LLC is a general partner of Warburg
Pincus Partners, L.P.. Warburg Pincus & Co. is a member of Warburg Pincus Partners GP LLC.
Accordingly, Warburg Pincus & Co. is deemed to be interested in the shareholding interest of each of Warburg Pincus Partners GP LLC, Warburg Pincus
Partners, L.P., Warburg Pincus Real Estate I GP, Warburg Pincus Real Estate I, L.P., Candlewood Investment SRL, WPRE Redstar Manager LLC, WPRE I
Redstar, L.P. and Springwood Investment SRL in the Company pursuant to the disclosure requirements under the SFO.
338,054,924 H Shares held by Candlewood are subject to the charge granted by Candlewood in favor of Bank of China Limited Macau Branch.
181,170,145 H Shares held by Springwood are subject to the charge granted by Springwood in favor of Bank of China Limited Macau Branch.
(3) China Reinsurance (Group) Corporation is a joint stock limited company incorporated in the People’s Republic of China listed on the Main Board of The
Stock Exchange of Hong Kong Limited (stock code: 1508) (“China Reinsurance”). Central Huijin Investment Ltd. is a shareholder of China Reinsurance and is
deemed to be interested in 53,500,000 H Shares, pursuant to the disclosure requirement under the SFO.
Save as disclosed above, as at the end of the Reporting Period, the Company is not aware of any other person (other than
the Directors, Supervisors or chief executive of the Company) who had an interest or short position in the shares or underlying
shares of the Company as recorded in the register required to be kept by the Company pursuant to Section 336 of the SFO.
BIOGRAPHIES OF DIRECTORS, SUPERVISORS AND SENIOR MANAGEMENT
Please refer to the section headed “Directors, Supervisors and Senior Management” for biographical details of the Directors,
Supervisors and senior management of the Company.
76 Red Star Macalline Group Corporation Ltd.
Report of Directors
DIRECTORS’ AND SUPERVISORS’ SERVICE CONTRACTS AND INTERESTS IN TRANSACTION, ARRANGEMENT AND CONTRACT OF SIGNIFICANCE
The re-election of each Director was approved by Shareholders at the 2016 third extraordinary general meeting of the
Company held on 30 December 2016. Each of our Directors entered into a contract with the Company in December 2016.
The principal particulars of these service contracts comprise:
(a) a term of three years commencing from the date on which the relevant Shareholders’ approvals for the appointment
were obtained; and
(b) termination provisions in accordance with their respective terms.
Each independent non-executive Director shall be subject to retirement by rotation for every two sessions, while other
Directors shall be subject to retirement by rotation for every three sessions.
No Director has an unexpired service contract with the Company which is not determinable by the Company within one year
without payment of compensation (other than normal statutory obligations).
Ms. NG Ellen Hoi Ying, the shareholder representative Supervisor, entered into service contract with the Company in
December 2016. Mr. PAN Ning and Ms. CHAO Yanping, the employee representative Supervisors, entered into service
contracts with the Company in December 2016. Mr. ZHENG Hongtao and Mr. CHEN Gang, the independent Supervisors,
entered into service contracts with the Company in December 2016.
The principal particulars of these service contracts comprise:
(a) a term of three years commencing from the date on which the relevant Shareholders’ approvals for the appointment
were obtained (save as from the date on which the third session of the supervisory committee commences for the
employee representative Supervisors); and
(b) termination provisions in accordance with their respective terms. The Supervisors may be re-appointed for successive
reappointments.
No Supervisor has an unexpired service contract with the Company which is not determinable by the Company within one
year without payment of compensation (other than normal statutory obligations).
Save as disclosed in this annual report, as at the end of the Reporting Period, none of the Directors and the Supervisors
or entities connected with the Directors and the Supervisors was materially interested, either directly or indirectly, in any
transaction, arrangement or contract which is signifi cant in relation to the business of the Group to which the Company or any
of its subsidiaries was a party.

77Annual Report 2016
Report of Directors
CONTRACT OF SIGNIFICANCE WITH CONTROLLING SHAREHOLDERS
Save as disclosed in this annual report with regard to those transactions entered into with our controlling shareholder RSED,
as at the end of the Reporting Period, there is no other contract of signifi cance entered into between us and our Controlling
Shareholders.
MANAGEMENT CONTRACTS
Other than the service contracts of the Directors, the Company has not entered into any contract with any individual, fi rm or
body corporate to manage or administer the whole or any substantial part of any business of the Company during the year
ended 31 December 2016.
DIRECTORS’ PERMITTED INDEMNITY PROVISION
At no time during the year ended 31 December 2016 and up to the date of this annual report, there was or is, any permitted
indemnity provision being in force for the benefi t of any of the Directors and Supervisors (whether made by the Company
or otherwise) or an associated company (if made by the Company). The Company has arranged appropriate directors’ and
offi cers’ liability insurance coverage for the Directors and senior offi cers of the Group as of the end of the Reporting Period.
DIRECTORS’ AND CONTROLLING SHAREHOLDERS’ INTERESTS IN COMPETING BUSINESS
As disclosed in the Prospectus, Mr. CHE and his Close Associates continue to hold interests in certain businesses which are
in competition, or are likely to compete (the “Restricted Business”), with the core operations (i.e. the business of operating
and managing home improvement and furnishings shopping malls in the PRC) of the Group (the “Core Operations”).
1. Greenland Jinniu Shopping Mall
Mr. CHE, through Chengdu Property (an indirect wholly-owned subsidiary of RSED), holds 50% equity interest in
Greenland Jinniu, which in turn holds Chengdu Jinniu Shopping Mall and its corresponding assets and liabilities. Such
50% equity interest was disposed by the Company to Chengdu Property in the process of disposal of our equity interest
in companies engaging in real estate development business in 2011 considering Greenland Jinniu primarily engages
in real estate development business and Chengdu Jinniu Shopping Mall was then at the stage of construction-in-
process. In order to consolidate the Group’s Core Operations and minimize potential competition and confl ict of
interests with the Controlling Shareholders, the Company entered into a repurchase framework agreement in December
2011 (as supplemented by two supplemental agreements), pursuant to which the Company was granted an option to
repurchase, among others, Chengdu Jinniu Shopping Mall. In anticipation of the opening of Chengdu Jinniu Shopping
Mall, our Group entered into a contract management agreement with Greenland Jinniu in November 2013, pursuant to
which our Group would operate and manage Chengdu Jinniu Shopping Mall under our own brand, pending repurchase
of the shopping mall. After Greenland Jinniu Shopping Mall commenced operations for more than two year since August
2014, our Directors considered that its business operations have reached a mature stage. On 23 October 2015, the
78 Red Star Macalline Group Corporation Ltd.
Report of Directors
Company entered into the Repurchase Agreement with Chengdu Property, pursuant to which the Company agreed
to repurchase 50% of the interest in Chengdu Jinniu Shopping Mall (held by Chengdu Property through Greenland
Jinniu). For further details, please refer to the Prospectus — “Relationship with Our Controlling Shareholders” and
the Company’s announcement dated 23 October 2015. As at the end of the Reporting Period, the Company has not
exercised the repurchase option as referred to in the Repurchase Framework Agreement.
2. Interest in Certain Project Companies
Mr. CHE, through RSED and its subsidiaries, holds minority equity interest in 64 Project Companies which hold certain
Managed Shopping Malls. On 23 October 2015, the Company entered into an equity transfer framework agreement
with RSED pursuant to which the Company agreed to acquire 100% equity interest in Shanghai Red Star Macalline
Industrial Company Limited (上海紅星美凱龍實業有限公司) (“Target Company”), which upon completion of a
restructuring, will hold equity interests in the Project Companies. If the Target Company fails to acquire the relevant
equity interest in the Project Companies, the Company can exercise an option to purchase such equity interest in the
relevant Project Companies. For further details, please refer to the Prospectus — “Relationship with Our Controlling
Shareholders” and the Company’s announcement dated 23 October 2015. As at the end of the Reporting Period,
the equity interest of the relevant Project Companies subject to the equity transfer framework agreement have been
transferred to the Company and therefore Mr. CHE no longer has a competing interest outside of the Company.
3. Property held by Changzhou RSHFC
Changzhou Macalline, a wholly-owned subsidiary of the Company, has leased a piece of property from Changzhou
RSHFC for the operation and management of Changzhou Decoration Mall. Changzhou RSHFC is an individual
proprietary enterprise (個人獨資企業) established by Mr. CHE under the PRC laws. Prior to April 2011, Changzhou
RSHFC had used the property to operate its Portfolio Shopping Mall then named as “Changzhou Red Star Mall”. In
order to consolidate the Group’s Core Operations and minimize potential competition and confl ict of interests with the
Controlling Shareholders, Changzhou RSHFC ceased to engage in home improvement and furnishing shopping mall
business from April 2011 and leased property to Changzhou Macalline in view of the transfer of such property to the
Group would give rise to tax implications.
We have adopted corporate governance measures to manage potential confl ict of interest between the Group and the
Controlling Shareholders. As the transactions contemplated under the Repurchase Agreement in relation to the repurchase
of 50% interest in Chengdu Jinniu Shopping Mall and the equity transfer framework agreement in relation to the acquisition of
Project Companies constitute connected transactions, the Directors who have a material interest have abstained from voting
on the board resolution to approve the transactions. For further details, please refer to “Connected and Continuing Connected
Transactions” of this annual report.
Save as disclosed in the Prospectus and in this annual report, none of Directors and Controlling Shareholders has interest in
business which is in competition, or is likely to compete, with the Company.
79Annual Report 2016
Report of Directors
NON-COMPETITION UNDERTAKING
In order to ensure that there is no competition between our Core Operations and the other business activities of Mr. CHE
and his Close Associates, Mr. CHE and RSM Holding (formerly known as Shanghai Red Star Macalline Investment Company
Limited) have entered into a non-competition undertaking (the “Non-Competition Undertaking”) in favor of our Company,
under which they have undertaken that they will not and will use their best efforts to procure that their respective Close
Associates (other than any member of our Group) will not, directly or indirectly, whether as principal or agent, either on their
own account or in conjunction with or on behalf of any person, fi rm, or company, engage, participate or hold any right or
interest in any Restricted Business.
Under the Non-Competition Undertaking, Mr. CHE and RSM Holding have, among others, (i) undertaken to offer new
business opportunity in any Restricted Business to the Company on terms and conditions no less favorable than those offered
to them or their respective Close Associates; (ii) undertaken to assist our repurchase of the relevant shopping malls, including
Chengdu Jinniu Shopping Mall; and (iii) granted an option and right of fi rst refusal for the Company to purchase the property
leased from Changzhou RSHFC. For further details, please refer to the Prospectus — “Relationship with Our Controlling
Shareholders”.
Mr. CHE and RSM Holding have confi rmed their compliance with the Non-Competition Undertaking during the Reporting
Period. The independent non-executive Directors have also reviewed the compliance with the Non-Competition Undertaking
by the Mr. CHE and RSM Holding and are satisfi ed that they have complied with the undertakings.
DIRECTORS’ AND SUPERVISORS’ RIGHTS TO ACQUIRE SHARES OR DEBENTURES
Save as disclosed in the section headed “Directors’, Supervisors’ and Chief Executives’ Interests and Short Positions in
Shares, Underlying Shares and Debentures” above, at no time during the Reporting Period was the Company or any of its
subsidiaries or holding company or any subsidiary of the Company’s holding company, a party to any arrangement that
would enable the Directors or the Supervisors to acquire benefi ts by means of acquisition of shares in, or debentures of,
the Company or any other body corporate, and none of the Directors or the Supervisors or any of their spouses or children
under the age of 18 were granted any right to subscribe for the equity or debt securities of the Company or any other body
corporate or had exercised any such right.

80 Red Star Macalline Group Corporation Ltd.
Report of Directors
EMOLUMENTS OF THE DIRECTORS, SUPERVISORS AND SENIOR MANAGEMENT AND THE FIVE HIGHEST PAID INDIVIDUALS
Please refer to Notes 13 and 14 to the Consolidated Financial Statements on pages 167 to 172 for details of the emoluments
of the Directors, Supervisors and senior management and the fi ve highest paid individuals of the Company.
The table below shows the remuneration of senior management by band:
(RMB)
2016
(members of
senior
management)
2015
(members of
senior
management)
1–1,000,000 — 1
1,000,000–1,500,000 — 5
1,500,000–2,000,000 5 6
2,000,000–2,500,000 2 —
2,500,000–3,000,000 3 —
3,000,000–3,500,000 1 —
3,500,000–4,000,000 — —
4,000,000–4,500,000 1 —
REMUNERATION POLICY AND DIRECTORS’ REMUNERATION
The remuneration of our employees consists of basic salary and performance bonuses. The Company conducts annual
evaluations of our employees, supplemented by random checks from time to time. The evaluation results are linked directly
with the employees’ compensation. Selected employees with outstanding work performance and records are promoted to
managerial positions.
In accordance with the applicable PRC laws and regulations, as well as compulsory requirements of the local authorities
where our shopping malls are located, the Company contributed to various social insurance plans such as pension
contribution plans, medical insurance plans, unemployment insurance plans, maternity insurance plans and work injury
insurance plans for our employees. The amount of required contribution as a percentage of our employees’ salaries varies
from place to place, depending on relevant salary levels, location of the operation and other factors such as the average age
of our employees.
Our Directors receive compensation in the form of Directors’ fees, salaries, housing allowances and other allowances, benefi ts
in kind, the employer’s contribution to the pension schemes and discretionary bonuses.
Please refer to Note 13 to the Consolidated Financial Statements on pages 167 to 171 for details of the Directors’
remuneration for the end of the Reporting Period.

81Annual Report 2016
Report of Directors
CONFIRMATION OF INDEPENDENCE FROM THE INDEPENDENT NON-EXECUTIVE DIRECTORS
The Company has received from each of the independent non-executive Directors, namely Mr. ZHOU Qinye (resigned on 19
April 2016), Mr. LI Zhenning, Mr. DING Yuan, Mr. LEE Kwan Hung and Mr. QIAN Shizheng (appointed on 19 April 2016), the
confi rmation of their respective independence pursuant to Rule 3.13 of the Listing Rules. The Company has duly reviewed
the confi rmation of independence of each of these Directors. The Company considers that the independent non-executive
Directors have been independent from the date of their appointment to the end of the Reporting Period or their respective
date of resignation (as the case may be) and remain so as at the date of this annual report (as the case may be).
MATERIAL LEGAL PROCEEDINGS
As at the end of the Reporting Period, the Company was not involved in any material litigation or arbitration and no material
litigation or arbitration were pending or threatened or made against the Company so far as the Company is aware.
COMPLIANCE WITH THE CORPORATE GOVERNANCE CODE
During the Reporting Period, except deviation from code provision A.2.1 of the Corporate Governance Code, the Company
has complied with the provisions of the Corporate Governance Code as set out in Appendix 14 to the Listing Rules, which
sets out principles of good corporate governance in relation to, among other matters, the Directors, the chairman and
chief executive offi cer, board composition, the appointment, re-election and removal of directors, their responsibilities
and remuneration and communications with shareholders. Our Directors are satisfi ed that suffi cient corporate governance
measures have been put in place to manage confl icts of interest between our Group and the Controlling Shareholders and/or
Directors to protect the interest of our minority shareholders.
Please refer to section headed “Corporate Governance Report” on page 88 for details.
AUDITOR
The Consolidated Financial Statements have been audited by Deloitte Touche Tohmatsu, Certifi ed Public Accountants.
Deloitte Touche Tohmatsu shall retire and being eligible, offer itself for re-appointment, and a resolution to this effect shall be
proposed at the forthcoming AGM.
The Company has not changed its auditor in any of the preceding three years.

82 Red Star Macalline Group Corporation Ltd.
Report of Directors
AUDIT COMMITTEE
The Audit Committee has reviewed the accounting principles and policies adopted by the Group and the Consolidated
Financial Statements.
PRE-EMPTIVE RIGHTS
There is no provision for pre-emptive rights under the Articles of Association or the laws of the PRC.
SUFFICIENCY OF PUBLIC FLOAT
The Hong Kong Stock Exchange had granted a waiver under Rule 8.08(1)(d) of the Listing Rules to accept a lower public fl oat
percentage of the Company’s issued share capital (the “Minimum Public Float”) on the conditions that:
i. the Minimum Public Float of the Company should be at the highest of (a) 15.10%; (b) such percentage of Shares held
by the public after completion of the Global Offering; and (c) such percentage of Shares held by the public after the
exercise of the over-allotment option;
ii. the Company will confi rm suffi ciency of public fl oat in successive annual reports after Listing; and
iii. the Company will implement appropriate measures to ensure continual maintenance of the Minimum Public Float
prescribed by the Hong Kong Stock Exchange.
The over-allotment option has not been exercised. Accordingly, the Company has complied with the public fl oat requirement
which is at the highest of such percentage (being 15.10%) of Shares held by the public immediately after the Global Offering.
Based on the information that is publicly available to the Company and within the knowledge of the Directors as at the date of
this annual report, the Company has maintained the prescribed public fl oat under the waiver.
VOTING BY POLL
During the Reporting Period, all votes of shareholders were taken by poll in the annual general meeting and extraordinary
general meetings of the Company. Pursuant to the Rule 13.39(4) of the Listing Rules, all votes of shareholders will be taken
by poll except where the chairman, in good faith, decides to allow a resolution which relates purely to a procedural or
administrative matter to be voted on by a show of hands.

83Annual Report 2016
Report of Directors
CLOSURE OF REGISTERS OF MEMBERS
The Registers of Members will be closed from 9 May 2017 to 8 June 2017, and from 15 June 2017 to 20 June 2017, during
which periods no transfer of shares will be registered. In order to qualify for attending and voting at the forthcoming AGM,
unregistered holders of shares of the Company shall lodge share transfer documents with the Company’s branch share
registrar and transfer offi ce in Hong Kong, Computershare Hong Kong Investor Services Limited at Shops 1712–1716, 17th
Floor, Hopewell Centre, 183 Queen’s Road East, Hong Kong for registration before 4:30 p.m. on 8 May 2017. In order to
qualify for the proposed fi nal dividend (subject to the approval by the Shareholders at the forthcoming AGM), unregistered
holders of shares of the Company shall lodge share transfer documents with Computershare Hong Kong Investor Services
Limited at the above mentioned address for registration before 4:30 p.m. on 14 June 2017.
CHANGES IN INFORMATION OF DIRECTORS AND SUPERVISORS
Pursuant to Rule 13.51B of the Listing Rules, the changes in information of Directors and Supervisors of the Company during
the Reporting Period are set out below:
Name Position Details of Changes
Mr. ZHOU Qinye Independent
non-executive Director
Mr. ZHOU Qinye resigned as an independent non-executive Director
on 19 April 2016.
Mr. QIAN Shizheng Independent
non-executive Director
Mr. QIAN Shizheng was appointed as an independent non-executive
Director on 19 April 2016.
Mr. QIAN Shizheng ceased to be an independent director of
Shanghai Chengtou Holding Co., Ltd. (a company listed on the
Shanghai Stock Exchange, stock code: 600649) since February
2017.
Mr. DING Yuan Independent
non-executive Director
Mr. DING Yuan has been an independent non-executive director,
chairman of the remuneration committee and member of the
nomination and audit committee of Man Wah Holdings Limited (敏華
控股有限公司), a company listed on the Hong Kong Stock Exchange
(stock code: 1999) since December 2016.
FUTURE DEVELOPMENT
Please refer to the section headed “Outlook and Prospects” on pages 43 to 44 for future development of the Company.
84 Red Star Macalline Group Corporation Ltd.
Report of Directors
IMPORTANT EVENTS AFTER THE REPORTING PERIOD
The Company received the “Notice of Acceptance of Registration” (Zhong Shi Xie Zhu [2016] SCP No. 400) (the “Notice”) from
the National Association of Financial Market Institutional Investors (中國銀行間市場交易商協會) (the “Association”), according
to which the Company can issue a super short-term commercial papers in tranches with a registered amount of RMB3 billion
in Shanghai Pudong Development Bank. Please refer to the Company’s related announcements on 19 January 2017 for
details.
At the board meeting held on 28 February 2017, the Board resolved to submit to the extraordinary general meeting, the
domestic shareholders’ class meeting and the H shareholders’ class meeting held on 19 April 2017, respectively, for
consideration and approval by the shareholders by way of special resolution a proposal for extension of the validity period of
the shareholders’ approval for the proposed A share offering for a future period of 12 months commencing from the date of
passing the relevant special resolutions.
By Order of the Board
CHE Jianxing
Chairman
Shanghai, 20 March 2017

85
Report of Supervisors
Annual Report 2016
1. MEETINGS OF THE SUPERVISORY COMMITTEE AND RELEVANT RESOLUTIONS
The Supervisory Committee convened a total of fi ve meetings in 2016, and details of the relevant meetings and the resolutions
are as follows:
(1) The third extraordinary meeting of the second session of the Supervisory Committee was convened on 31 January
2016. The resolution in respect of the election of chairman of the second session of the Supervisory Committee of the
Company was reviewed and passed.
(2) The fourth meeting of the second session of the Supervisory Committee was convened on 21 March 2016. The
resolution in respect of the Report of the Supervisory Committee for the year ended 31 December 2015, the resolution
in respect of the 2015 profi t distribution plan of the Company, and the resolution in respect of re-appointment of
Deloitte Touche Tohmatsu CPA, Ltd and Deloitte Touche Tohmatsu as the audit institutions of the Company for the year
of 2016 were reviewed and passed.
(3) The fi fth meeting of the second session of the Supervisory Committee was convened on 22 August 2016. The resolution
in respect of the reviewed fi nancial statements for the six months ended 30 June 2016, the resolution in respect of the
fi nancial statements for the fi rst half of 2016, the resolution in respect of the interim dividend for the six months ended
30 June 2016, the resolution in respect of the interim report and interim results announcement for the six months ended
30 June 2016, and the resolution in respect of the Report on Self-evaluation of Internal Control of the Company as at 30
June 2016 were reviewed and passed.
(4) The fourth extraordinary meeting of the second session of the Supervisory Committee was convened on 15 November
2016. The resolution in respect of the nomination of Ms. NG Ellen Hoi Ying as a candidate for supervisor of the third
session of the Supervisory Committee, the resolution in respect of the nomination of Mr. CHEN Gang as a candidate
for supervisor of the third session of the Supervisory Committee, and the resolution in respect of the nomination of Mr.
ZHENG Hongtao as a candidate for supervisor of the third session of the Supervisory Committee were reviewed and
passed.
(5) The fi rst extraordinary meeting of the third session of the Supervisory Committee was convened on 30 December 2016.
The resolution in respect of the election of chairman of the third session of the Supervisory Committee was reviewed
and passed.

86 Red Star Macalline Group Corporation Ltd.
Report of Supervisors
2. INDEPENDENT OPINION OF THE SUPERVISORY COMMITTEE REGARDING CERTAIN MATTERS
(1) Statutory compliance: during the year of 2016, members of the Supervisory Committee continued to supervise the
Company’s operations through attending Board meetings, reviewing reports on special projects, conducting on-
site inspections and meetings with staff, conducting audit and specifi c survey. With reference to various regulations,
the Supervisory Committee was of the opinion that the decision-making process was lawful, the internal control
was effective, and the Directors and the senior management of the Company have diligently carried out their duties,
and there is no behavior of violation of the laws, regulations, the Articles of Association, nor had they prejudiced the
Company’s and Shareholders’ interests. The Supervisory Committee had reviewed the Company’s internal control audit
report for the year 2016 prepared by Deloitte & Touche, and was of the view that the report refl ected the actual situation
of the Company’s corporate governance and internal control, with an objective opinion on audit and agreed to publish
the relevant report.
(2) Financial monitoring: during the Reporting Period, the Supervisory Committee diligently performed its duty of monitoring
the Company’s fi nancial situation, including reviewing the Company’s operations and its risks and providing audited
opinions to each periodic report. The Supervisory Committee was of the opinion that the Company’s fi nancial report
refl ected a true and fair view on the Company’s fi nancial position and operating results.
(3) Use of proceeds from fund raising exercises: the Supervisory Committee continued to review the deposit and use of
proceeds raised from the Global Offering of H Shares by the Company during the year and was not aware of any issues
regarding the raised funds. During the Reporting Period, the Company completed the issuance of the second tranche
of Corporate Bonds on the Shanghai Stock Exchange, with the size of RMB3,000,000,000 and the coupon rates of
the Category I Bonds and the Category II Bonds are 3.50% and 4.29%, respectively.. The Supervisory Committee had
monitored the issuance of relevant bonds and the use of funds thereof, and had found no violation of regulations.
(4) Stock incentive plan: during the Reporting Period, the Company has no stock incentive plan.
(5) Major asset acquisitions and disposals: during the Reporting Period, the Company did not conduct any major asset
acquisitions and disposals.
(6) Connected and continuing connected transactions: During the Reporting Period, the Supervisory Committee has
monitored the continuing connected transactions of the Company for the year, including: (i) the lease agreement
with Changzhou RSHFC, (ii) the management agreements with Xuzhou RSHFC, Xuzhou RSHFP, Yangzhou RSHFP,
Jining Hongrui and Shaanxi Hongrui, (iii) the RSED Framework Agreement with RSED and (iv) the Lease Agreement
with Shanghai Hongmei in connection with the leasing of the Jinshan Property. The Company did not enter into any
connected transaction during the Reporting Period.

87Annual Report 2016
Report of Supervisors
The independent non-executive Directors, after taking into consideration factors such as market environment, transaction
amounts, corporate governance, have confi rmed that the abovementioned continuing connected transactions for the year
ended 31 December 2016 were entered into by the Group: (i) in the ordinary and usual course of its business; (ii) on normal
commercial terms; and (iii) in accordance with the relevant agreements governing them and on terms that were fair and
reasonable and in the interests of the Company and the Shareholders as a whole.
The Company has assigned the fi nance department to monitor the continuing connected transactions. The fi nance
department will prepare relevant information and materials in relation to the continuing connected transactions and submit
the same to the Secretariat of the Board of Directors for compliance checking before submitting all relevant information and
materials to the Board for consideration. All relevant information will be attached as appendices to the board resolutions.
In relation to the continuing connected transactions conducted during the Reporting Period, the fi nance department and
the Secretariat of the Board of Directors have reviewed and considered the relevant information and materials to ensure
compliance with relevant requirements (such as not exceeding the annual caps and ensuring the transactions are carried out
in accordance with their respective terms) so as to protect the interests of our Shareholders.
The auditors of the Company has issued its unqualifi ed letter containing its fi ndings and conclusions in respect of the
abovementioned continuing connected transactions in accordance with Rule 14A.56 of the Listing Rules, confi rming that
(i) nothing has come to their attention that causes the auditors to believe that the abovementioned continuing connected
transactions have not been approved by the Board, (ii) for transactions involving the provision of goods or services by the
Group, nothing has come to their attention that causes the auditors to believe that the transactions were not, in all material
respects, in accordance with the pricing policies of the Group, (iii) nothing has come to their attention that causes the auditors
to believe that the transactions were not entered into, in all material respects, in accordance with the terms of the relevant
agreements governing such transactions; and (iv) with respect to the aggregate amount of each of the transactions, nothing
has come to their attention that causes the auditors to believe that the amounts have exceeded the maximum aggregate
annual value disclosed in the Prospectus and the announcement dated 25 September 2015. A copy of the auditors’ letter has
been provided by the auditors of the Company to the Hong Kong Stock Exchange.
In the future, with the further development of the Company’s businesses, the Supervisory Committee will, base on its existing
work nature, fi rmly implement the Company’s established strategies and policies, fulfi ll its duties as prescribed by national
laws and regulations as well as the Articles of Association, and supervise the Company to operate in such a way as to
practically guarantee and safeguard the legitimate interests of the Company and Shareholders.
The Supervisory Committee of Red Star Macalline Group Corporation Ltd.
20 March 2017

88
Corporate Governance Report
Red Star Macalline Group Corporation Ltd.
The Group is committed to high-standard corporate governance so as to protect the interests and legal rights of the
Shareholders and to promote the Company’s value and accountability. H Shares of the Company were listed on the main
board of the Hong Kong Stock Exchange on 26 June 2015.
The Company adopted the following corporate governance principles and practices:
COMPLIANCE WITH THE CORPORATE GOVERNANCE CODE
Other than deviation from code provision A.2.1, during the Reporting Period, the Company has complied with the
provisions of the Corporate Governance Code, Appendix 14 to the Listing Rules, which sets out the principles of good
corporate governance principles in relation to, among other matters, the directors, the chairman and the chief executive,
board composition, the appointment, re-election and removal of directors, their responsibilities and remuneration; and
communications with shareholders. Directors are satisfi ed that suffi cient corporate governance measures have been put in
place to manage confl icts of interest between the Group and the Controlling Shareholders and/or Directors to protect the
minority Shareholders’ interests.
DEVIATION FROM CODE PROVISION A.2.1 OF THE CORPORATE GOVERNANCE CODE
Mr. CHE Jianxing (“Mr. CHE”) is the Chairman and chief executive offi cer of the Company. In view of Mr. CHE’s experience,
personal profi le and his roles in our Group as mentioned above and that Mr. CHE has assumed the role of chief executive
offi cer and the general manager of the Group since June 2007, the Board considers it benefi cial to the business prospect
and operational effi ciency of the Group that Mr. CHE, in addition to acting as the Chairman of the Board, continues to act as
the chief executive offi cer of the Company. While this will constitute a deviation from Code Provision A.2.1 of the Corporate
Governance Code, the Board believes that this structure will not impair the balance of power and authority between the
Board and the management of the Company, given that: (i) decision to be made by our Board requires approval by at least a
majority of our Directors and that the Board comprises 4 independent non-executive Directors out of the 12 Directors, which
is in compliance with the Listing Rules requirement of one-third, and we believe that there is suffi cient check and balance in
the Board; (ii) Mr. CHE and the other Directors are aware of and undertake to fulfi ll their fi duciary duties as Directors, which
require, among other things, that he acts for the benefi t and in the best interests of the Company and will make decisions for
the Group accordingly; and (iii) the balance of power and authority is ensured by the operations of the Board which comprises
experienced and high caliber individuals who meet regularly to discuss issues affecting the operations of the Company.
Moreover, the overall strategic and other key business, fi nancial, and operational policies of the Group are made collectively
after thorough discussion at both Board and senior management levels.
The Board will continue to review the effectiveness of the corporate governance structure of our Group in order to assess
whether separation of the roles of Chairman and chief executive offi cer is necessary.
COMPLIANCE WITH THE MODEL CODE
The Company has adopted a code of conduct regarding Directors’ and Supervisors’ securities transactions on terms as
required under the Model Code. The Company has made specifi c queries to the Directors and Supervisors, and all Directors
and Supervisors have confi rmed their compliance with the provisions set out in the Model Code during the Reporting Period.

89Annual Report 2016
Corporate Governance Report
BOARD OF DIRECTORS
Board Composition
As at the end of the Reporting Period, the Board comprises 12 Directors, including 4 executive Directors, 4 non-executive
Directors and 4 independent non-executive Directors. The following list sets forth the information in respect of the current
members of the Board.
Name Positions
Date of
Re-appointment(1)
Mr. CHE Jianxing(2) Chairman and Executive Director 30 December 2016
Ms. ZHANG Qi Vice Chairman and Executive Director 30 December 2016
Ms. CHE Jianfang Executive Director 30 December 2016
Mr. JIANG Xiaozhong Executive Director 30 December 2016
Ms. CHEN Shuhong Non-executive Director 30 December 2016
Mr. XU Guofeng(3) Non-executive Director 30 December 2016
Mr. Joseph Raymond GAGNON Non-executive Director 30 December 2016
Mr. ZHANG Qiqi Non-executive Director 30 December 2016
Mr. LI Zhenning Independent non-executive Director 30 December 2016
Mr. DING Yuan Independent non-executive Director 30 December 2016
Mr. LEE Kwan Hung Independent non-executive Director 30 December 2016
Mr. QIAN Shizheng(4) Independent non-executive Director 30 December 2016
Notes:
(1) The Directors were re-elected at the extraordinary general meeting held on 30 December 2016.
(2) Mr. CHE Jianxing is the husband of Ms. CHEN Shuhong and the brother of Ms. CHE Jianfang.
(3) Mr. XU Guofeng is the husband of Ms. CHE Jianfang.
(4) With effect from 19 April 2016, Mr. ZHOU Qinye resigned as an independent non-executive Director. On 19 April 2016, Mr. QIAN Shizheng was appointed as an independent non-executive director.
Biographies of the Directors are set out in the section headed “Directors, Supervisors and Senior Management” of this annual
report.

90 Red Star Macalline Group Corporation Ltd.
Corporate Governance Report
During the Reporting Period, the Board complied with the requirements of appointing at least three independent non-executive Directors (among whom at least one independent non-executive Director holds the appropriate professional qualifi cations or accounting or relevant fi nancial management knowledge) set out in Rules 3.10(1) and 3.10(2) of the Listing Rules at any time.
The Company also complied with the requirements of appointing independent non-executive Directors, accounting for one-third of the members of the Board set out in Rule 3.10A of the Listing Rules. Independence of each independent non-executive Director has been confi rmed in accordance with Rule 3.13 of the Listing Rules, and the Company regards them as independent.
The Company regards increasing diversity at the Board level as an essential element in supporting the attainment of its strategic objectives and its sustainable development. In designing the Board’s composition, Board diversity has been considered from a number of aspects, including but not limited to gender, age, cultural and educational background, ethnicity, professional experience, skills, knowledge and length of service. All Board appointments will be based on meritocracy, and candidates will be considered against objective criteria, having due regard for the benefi ts of diversity on the Board.
All Directors (including the independent non-executive Directors) enabled the Board with different valuable experiences in business and professional knowledge so that the Board of Directors could fulfi ll its function effi ciently and effectively. The independent non-executive Directors were invited to join the Audit Committee, the Remuneration and Evaluation Committee, the Nomination Committee and the Strategy and Investment Committee.
Board Meeting
In accordance with the Articles of Association, the board meetings are divided into regular meetings and provisional meetings. Board meetings shall be convened at least four times a year and be called for by the Chairman. A notice of at least 14 days shall be sent to all Directors before the meeting is convened so that they may attend the meeting and include any relevant matters for discussion in the meeting agenda.
Other than the connected transactions to be reviewed by the Board set out in the Articles of Association, Board meetings shall be attended by more than half of the Directors.
Minutes of the Board meetings and Committee meetings shall record all matters considered and decisions made by the Board and Committees, including all questions raised by the Directors. Drafts of the minutes of the Board meetings and Committee meetings are/will be sent to each Director within a reasonable period of time after the meeting.
Save as disclosed in the Prospectus and in this annual report, to the best knowledge of the Company, there are no fi nancial, business, family, or other material relationships among members of the Board.
Appointment, Re-election and Re-appointment of Directors
In accordance with the provisions set out in the Articles of Association, the Directors shall be elected by the general meeting of Shareholders and shall serve three-year terms. Upon expiration of the term, the Directors may be re-elected and re-appointed. Each independent non-executive Director shall be subject to retirement by rotation once every two sessions. The Company has implemented a set of effective programs to the appointment of new Directors. The Nomination Committee and Remuneration and Evaluation Committee have priority to discuss nomination of the new Directors and shall submit proposals to the Board. New directors shall be elected by the general meeting of Shareholders.
The Company has entered into service contracts or appointment letters for a service term of three-year with all Directors (including the non-executive Directors).

91Annual Report 2016
Corporate Governance Report
Directors’ Training
Introductory and Continuous Professional Development
All newly appointed Directors are granted with necessary induction training and information so as to have an appropriate
understanding of the operating status and business of the Company as well as their responsibilities under relevant laws,
rules, provisions and articles. The Company also arranges periodical seminars for the Directors in order to provide the latest
information on any development and changes in the Listing Rules, and other relevant laws and regulations. The Directors
are also informed about the performance, current status and prospect of the Company regularly, so as to fulfi ll their
responsibilities.
Trainings attended by all Directors in the Reporting Period are as below:
Name of Directors
Training
Description
CHE Jianxing A, B
ZHANG Qi A, B
CHE Jianfang A, B
JIANG Xiaozhong A, B
CHEN Shuhong A, B
XU Guofeng A, B
Joseph Raymond GAGNON A, B
ZHANG Qiqi A, B
ZHOU Qinye (resigned as independent non-executive Director with effect from 19 April 2016) A, B
LI Zhenning A, B
DING Yuan A, B
LEE Kwan Hung A, B
QIAN Shizheng (appointed as independent non-executive Director with effect from 19 April 2016) A, B
Notes:
A. Trainings related to governance of listed company and directors’ responsibility, organized by law fi rms, compliance advisor, external auditor and etc.;
B. Reading provisions connected to company governance, Directors’ responsibilities and internal control risk management and attending lecture, forum and
conference, etc.

92 Red Star Macalline Group Corporation Ltd.
Corporate Governance Report
Duties Performed by the Board and Management
The Board is responsible for the general meeting of Shareholders and perform the following duties: to approve and supervise
all policy issues, overall strategy, budgeting, internal control and risk management system, material transactions (especially
the transactions in which the parties with confl ict of interest may be involved), Director appointment and other material
fi nancial and operating affairs. The Directors may seek independent professional opinions when fulfi lling their duties, and the
cost will be borne by the Company. The Company also encourages the Directors to seek independent consultation with senior
management of the Company.
The senior management is responsible for daily management, administration and operation of the Group, and the Board shall
discuss the authorization function and duty periodically. Any material transactions established by the management shall be
approved by the Board in advance.
CORPORATE GOVERNANCE FUNCTION
The Board is responsible for establishing the corporate governance policy of the Company and fulfi lling the following
corporate governance duties:
(1) To develop and review the corporate governance policy and routines of the Company;
(2) To review and monitor training and continuous professional development of the Directors and senior management;
(3) To review and monitor policies and routines of the Company in compliance with the requirements of all applicable laws
and regulations;
(4) To establish, review and monitor code of conduct and compliance guidelines suitable for the employees and Directors (if
available); and
(5) To review the Company’s compliance with the disclosure requirements as set out in the Corporate Governance Code
and Corporate Governance Report.
DIRECTORS’ LIABILITY INSURANCE
The Company has purchased appropriate insurance against the litigations raised against the Directors on 21 June 2016.
93Annual Report 2016
Corporate Governance Report
BOARD COMMITTEES
The Board delegates responsibilities to various committees. In accordance with the relevant PRC laws and regulations,
the Corporate Governance Code, the Company has established four Board committees, namely the Audit Committee, the
Remuneration and Evaluation Committee, the Nomination Committee and the Strategy and Investment Committee.
AUDIT COMMITTEE
We have established an Audit Committee with written terms of reference in compliance with Rule 3.21 of the Listing Rules
and Code Provision C.3 and Code Provision D.2 of the Corporate Governance Code. The Audit Committee consists of three
independent non-executive Directors as at the end of the Reporting Period, namely Mr. DING Yuan, Mr. LI Zhenning and Mr.
QIAN Shizheng. Mr. DING Yuan, who holds the appropriate professional qualifi cations as required under Rules 3.10(2) and
3.21 of the Listing Rules, serves as the chairman of the Audit Committee. The primary duties of the Audit Committee include,
but not limited to, the following:
• proposing the appointment or change of external auditors;
• overseeing the internal audit system of the Company and its implementation;
• maintaining close communication between the internal auditors and external auditors;
• examining the fi nancial information of the Company and its disclosure, and auditing signifi cant connected transactions
as authorized by the Board;
• Monitoring integrity of the Company’s fi nancial statements, annual reports and accounts, interim reports, other
periodic reports, agreed proceedings, audit reports (hereinafter referred to as the “Materials”) and reviewing signifi cant
judgments on fi nancial reporting set out in the Materials. Making judgments on the completeness, accuracy and
truthfulness of the preparation and disclosure of the Company’s fi nancial reports;
• examining the rationality, effi ciency and implementation of the risk management and internal control systems of the
Company and its subsidiaries and branch offi ces, and making recommendations to the Board;
• providing comments regarding the performance of internal auditors;
• overseeing the corporate governance of the Company, making recommendations to the Board, and reviewing the
corporate governance report disclosed in our annual report; and
• dealing with other matters that are authorized by the Board.

94 Red Star Macalline Group Corporation Ltd.
Corporate Governance Report
As at the end of the Reporting Period, the Audit Committee has performed its duties with due prudence in accordance with
the requirements of Company Law, the Articles of Association, the Terms of Reference of the Audit Committee of the Board
of the Company and the relevant laws and regulations. The Audit Committee convened two meetings, details of which are set
out below:
Name of Meeting Dates of Meetings Contents of Meeting Attendance at the Meeting
Audit Committee 21 March 2016 1. To review and discuss the report prepared by the auditor of the Group in respect of the annual results of the Group as of 31 December 2015;
2. To review and make recommendation to the Board about the audited fi nancial statements, results announcement and annual report as of 31 December 2015;
3. To review and make recommendation to the Board about the audited fi nancial statements for the years of 2015, 2014 and 2013 of the Group for its A-share IPO application;
4. To review and make recommendation to the Board about the profi t distribution program of the Company for the year 2015;
5. To consider and make recommendation to the Board about the resolution of re-appointment of Deloitte Touche Tohmatsu CPA, Ltd and Deloitte Touche Tohmatsu as the audit institutions of the Company for the year 2016;
6. To review the expected connected transaction of the Company for the year 2016;
7. To review the work plan of internal review center for the year 2016;
8. To review the corporate governance report of the Company;
9. To review and make recommendation to the Board about the resolution of the audited self-evaluation report of internal control of the Company as of 31 December 2015.
Mr. DING Yuan, Mr. LI Zhenning and Mr. ZHOU Qinye attended the meeting

95Annual Report 2016
Corporate Governance Report
Name of Meeting Dates of Meetings Contents of Meeting Attendance at the Meeting
22 August 2016 1. To review and discuss the report prepared by the auditor of the Group to the Audit Committee in respect of the annual results of the Group for the six months ended 30 June 2016;
2. To review and make recommendation to the Board about the draft of the reviewed fi nancial statements (“Financial Statements”) for the six months ended 30 June 2016;
3. To review and make recommendation to the Board about the proposal of the Financial Statements in the fi rst half of 2016;
4. To review and make recommendation to the Board about the proposal of the interim dividend for the six months ended 30 June 2016;
5. To review and make recommendation to the Board about the draft of the interim results announcement to be published on the websites of Hong Kong Stock Exchange and the Company prepared in accordance with Financial Statements for the six months ended 30 June 2016;
6. To review and make recommendation to the Board about the draft of the interim report to be published on the websites of the Hong Kong Stock Exchange and the Company for the six months ended 30 June 2016;
7. To review the summary of internal audit work of the Group in the fi rst half of 2016 and proposed working plan in the second half of 2016;
8. To review and make recommendation to the Board about the proposal of the self-evaluation report of internal control as of 30 June 2016;
9. To review the summary of work on risk management and internal control of the Group in the fi rst half of 2016 and proposed working plan in the second half of 2016.
Mr. DING Yuan, Mr. QIAN Shizheng, and Mr. LI Zhenning attended the meeting

96 Red Star Macalline Group Corporation Ltd.
Corporate Governance Report
The Audit Committee oversees and monitors the risk management and internal control systems of the Company on an
ongoing basis and review with our external auditors and management periodically, not less than annually, the scope,
adequacy and effectiveness of the Company’s corporate accounting and fi nancial controls, risk management and internal
control systems, and any related signifi cant fi ndings regarding risks or exposures and consider recommendations for
improvement of such controls. The review should cover all material controls, including fi nancial, operational and compliance
controls. Further details regarding the annual review conducted by the Audit Committee are set out in the section headed
“Risk Management and Internal Control”.
REMUNERATION AND EVALUATION COMMITTEE
The Company established a Remuneration and Evaluation Committee with written terms of reference in compliance with Code
Provision B.1 of the Corporate Governance Code.
As at the end of the Reporting Period, the Remuneration and Evaluation Committee consists of three Directors, including one
executive Director and two independent non-executive Directors, namely Mr. CHE Jianxing, Mr. LI Zhenning and Mr. QIAN
Shizheng. Mr. QIAN Shizheng serves as the chairman of the Remuneration and Evaluation Committee.
The primary duties of the Remuneration and Evaluation Committee include, but are not limited to, the following:
• formulating the remuneration plans for Directors, Supervisors and members of the senior management in accordance
with the terms of reference of the Directors, Supervisors and members of the senior management and the importance of
their positions as well as the remuneration benchmarks of relevant positions in other comparable companies;
• the remuneration plans include, but are not limited to, criteria and procedures of performance evaluation, the main
evaluation system as well as the main reward and penalty scheme and system, etc.;
• making recommendations to the Board on the remuneration packages of individual executive Directors and senior
management;
• examining the performance of Directors, Supervisors and members of the senior management of our Company, and
conducting annual performance evaluation;
• supervising the implementation of our Company’s remuneration plan and incentive system; and
• dealing with other matters that are authorized by the Board.
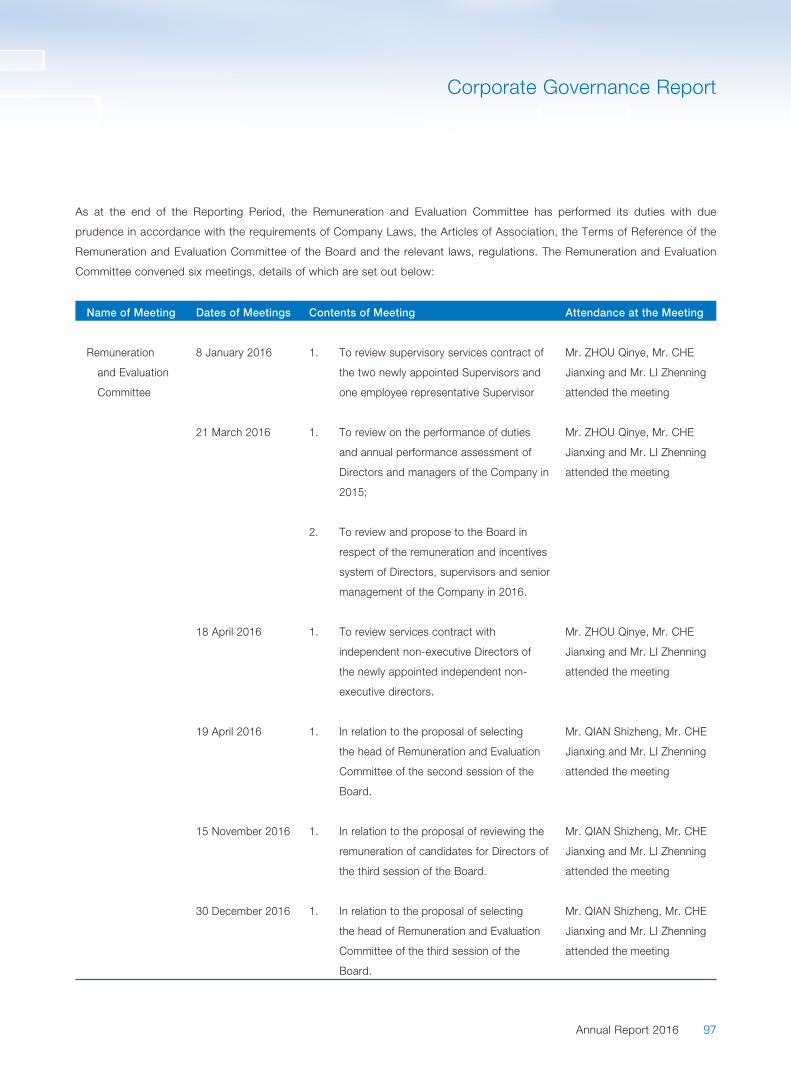
97Annual Report 2016
Corporate Governance Report
As at the end of the Reporting Period, the Remuneration and Evaluation Committee has performed its duties with due
prudence in accordance with the requirements of Company Laws, the Articles of Association, the Terms of Reference of the
Remuneration and Evaluation Committee of the Board and the relevant laws, regulations. The Remuneration and Evaluation
Committee convened six meetings, details of which are set out below:
Name of Meeting Dates of Meetings Contents of Meeting Attendance at the Meeting
Remuneration
and Evaluation
Committee
8 January 2016 1. To review supervisory services contract of
the two newly appointed Supervisors and
one employee representative Supervisor
Mr. ZHOU Qinye, Mr. CHE
Jianxing and Mr. LI Zhenning
attended the meeting
21 March 2016 1. To review on the performance of duties
and annual performance assessment of
Directors and managers of the Company in
2015;
Mr. ZHOU Qinye, Mr. CHE
Jianxing and Mr. LI Zhenning
attended the meeting
2. To review and propose to the Board in
respect of the remuneration and incentives
system of Directors, supervisors and senior
management of the Company in 2016.
18 April 2016 1. To review services contract with
independent non-executive Directors of
the newly appointed independent non-
executive directors.
Mr. ZHOU Qinye, Mr. CHE
Jianxing and Mr. LI Zhenning
attended the meeting
19 April 2016 1. In relation to the proposal of selecting
the head of Remuneration and Evaluation
Committee of the second session of the
Board.
Mr. QIAN Shizheng, Mr. CHE
Jianxing and Mr. LI Zhenning
attended the meeting
15 November 2016 1. In relation to the proposal of reviewing the
remuneration of candidates for Directors of
the third session of the Board.
Mr. QIAN Shizheng, Mr. CHE
Jianxing and Mr. LI Zhenning
attended the meeting
30 December 2016 1. In relation to the proposal of selecting
the head of Remuneration and Evaluation
Committee of the third session of the
Board.
Mr. QIAN Shizheng, Mr. CHE
Jianxing and Mr. LI Zhenning
attended the meeting

98 Red Star Macalline Group Corporation Ltd.
Corporate Governance Report
NOMINATION COMMITTEE
The Company has established a Nomination Committee with written terms of reference in compliance with Code Provision
A.5 of the Corporate Governance Code. As at the end of the Reporting Period, the Nomination Committee consists of three
Directors, including one executive Director and two independent non-executive Directors, namely Mr. CHE Jianxing, Mr. LEE
Kwan Hung and Mr. LI Zhenning. Mr. LI Zhenning serves as the chairman of the Nomination Committee.
The primary duties of the Nomination Committee include, but are not limited to, the following:
• making recommendations to the Board on size and composition of the Board in accordance with our Company’s
operating activities, asset size and shareholding structure;
• researching and developing criteria and procedures for the election of the Board members, general managers and other
members of the senior management, and making recommendations to the Board;
• conducting thorough investigation on suitable candidates for Directors, general managers and other members of the
senior management, and making recommendation to the Board;
• reviewing and examining candidates for Directors, general managers and other members of the senior management and
making recommendations to the Board; and
• dealing with other matters that are authorized by the Board.
As at the end of the Reporting Period, the Nomination Committee has performed its duties with due prudence in accordance
with the requirements of Company Law, the Articles of Association, the Terms of Reference of the Nomination Committee of
the Board and the relevant laws, regulations. The Nomination Committee convened four meetings, details of which are set out
below:
Name of Meeting Dates of Meetings Contents of Meeting Attendance at the Meeting
Nomination
Committee
31 January 2016 1. To review the structure, number of
persons, constituents and the diversity of
members of the Board, various committees
under the Board, general manager and
other senior management persons in 2015;
Mr. LI Zhenning, Mr. CHE
Jianxing and Mr. LEE Kwan
Hung attended the meeting
2. To review the principle of director’s
nomination of the third session of the
Board, and continue to play a role in the
strategy and governance of the Company.

99Annual Report 2016
Corporate Governance Report
Name of Meeting Dates of Meetings Contents of Meeting Attendance at the Meeting
28 March 2016 1. In relation to the proposal of nominating
additional independent non-executive
Directors of the second session of the
Board.
Mr. LI Zhenning, Mr. CHE
Jianxing and Mr. LEE Kwan
Hung attended the meeting
15 November 2016 1. In relation to the proposal of nominating Mr.
CHE Jianxing as the candidate of executive
Director of the third session of the Board;
Mr. LI Zhenning, Mr. CHE
Jianxing and Mr. LEE Kwan
Hung attended the meeting
2. In relation to the proposal of nominating
Ms. CHE Jianfang as the candidate of
executive Director of the third session of
the Board;
3. In relation to the proposal of nominating
Ms. CHEN Shuhong as the candidate of
non-executive Director of the third session
of the Board;
4. In relation to the proposal of nominating
Mr. XU Guofeng as the candidate of non-
executive Director of the third session of
the Board;
5. In relation to the proposal of nominating
Mr. JIANG Xiaozhong as the candidate of
executive Director of the third session of
the Board;
6. In relation to the proposal of nominating
Ms. ZHANG Qi as the candidate of
executive Director of the third session of
the Board;
7. In relation to the proposal of nominating Mr.
Joseph Raymond Gagnon as the candidate
of non-executive Director of the third
session of the Board;
8. In relation to the proposal of nominating
Mr. ZHANG Qiqi as the candidate of non-
executive Director of the third session of
the Board;
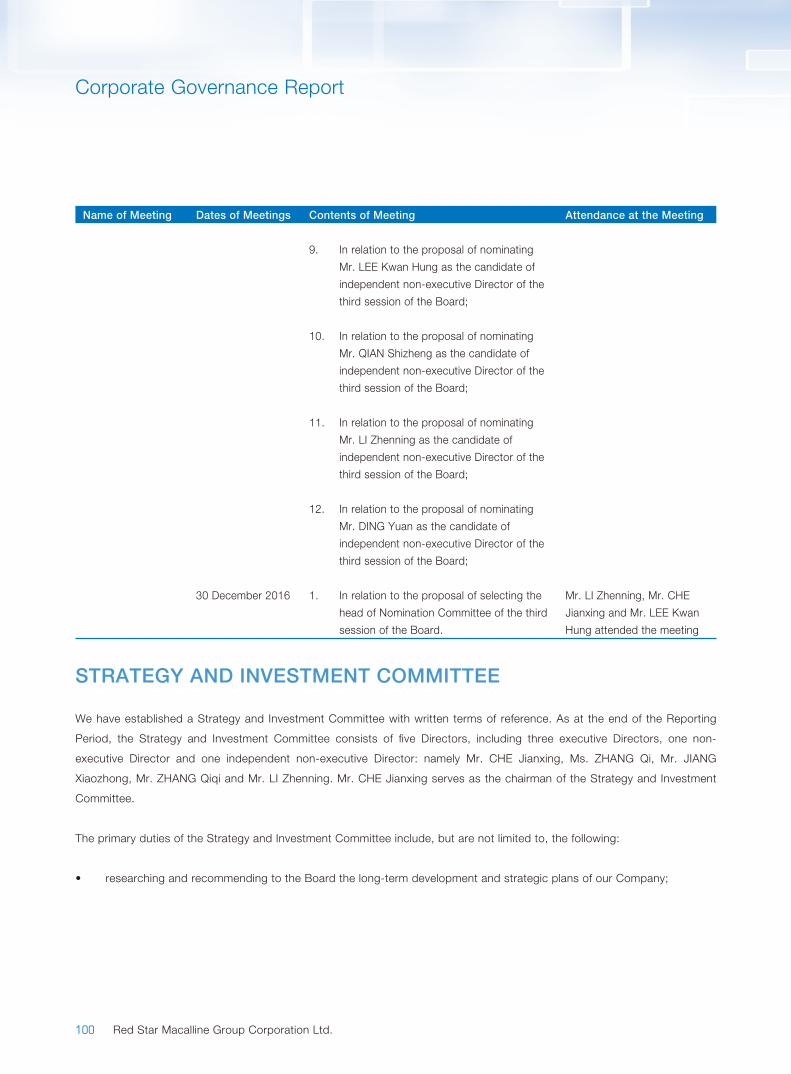
100 Red Star Macalline Group Corporation Ltd.
Corporate Governance Report
Name of Meeting Dates of Meetings Contents of Meeting Attendance at the Meeting
9. In relation to the proposal of nominating
Mr. LEE Kwan Hung as the candidate of
independent non-executive Director of the
third session of the Board;
10. In relation to the proposal of nominating
Mr. QIAN Shizheng as the candidate of
independent non-executive Director of the
third session of the Board;
11. In relation to the proposal of nominating
Mr. LI Zhenning as the candidate of
independent non-executive Director of the
third session of the Board;
12. In relation to the proposal of nominating
Mr. DING Yuan as the candidate of
independent non-executive Director of the
third session of the Board;
30 December 2016 1. In relation to the proposal of selecting the
head of Nomination Committee of the third
session of the Board.
Mr. LI Zhenning, Mr. CHE
Jianxing and Mr. LEE Kwan
Hung attended the meeting
STRATEGY AND INVESTMENT COMMITTEE
We have established a Strategy and Investment Committee with written terms of reference. As at the end of the Reporting
Period, the Strategy and Investment Committee consists of fi ve Directors, including three executive Directors, one non-
executive Director and one independent non-executive Director: namely Mr. CHE Jianxing, Ms. ZHANG Qi, Mr. JIANG
Xiaozhong, Mr. ZHANG Qiqi and Mr. LI Zhenning. Mr. CHE Jianxing serves as the chairman of the Strategy and Investment
Committee.
The primary duties of the Strategy and Investment Committee include, but are not limited to, the following:
• researching and recommending to the Board the long-term development and strategic plans of our Company;
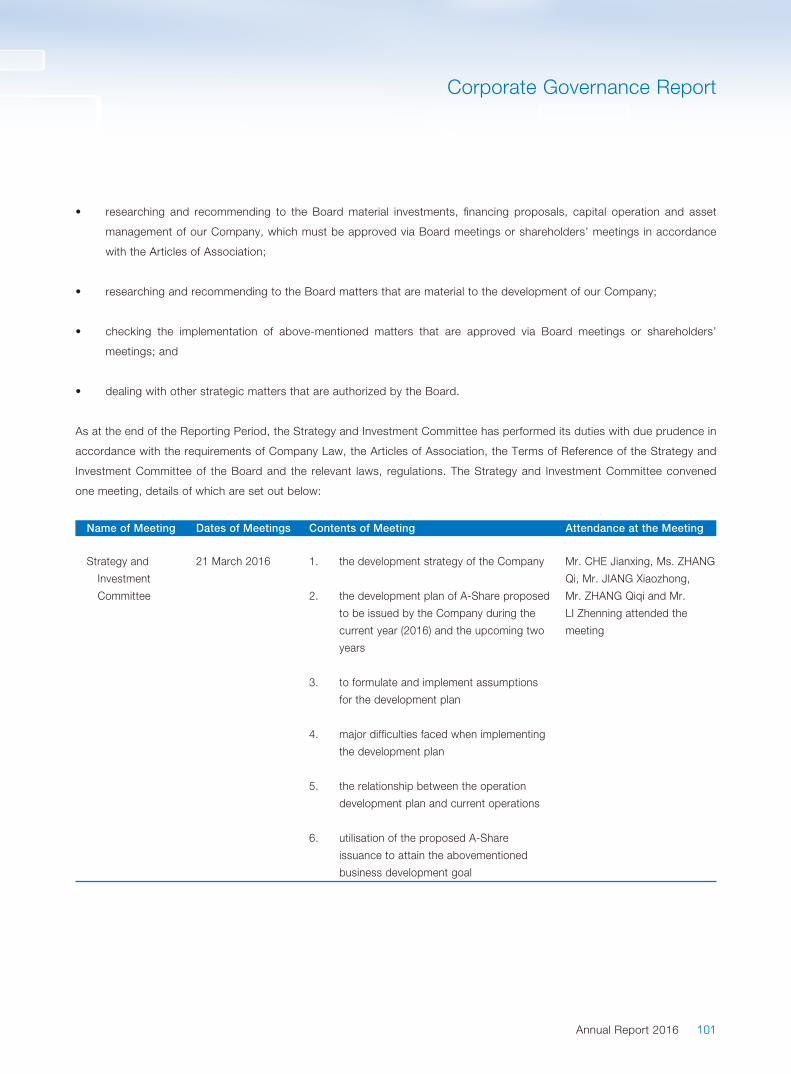
101Annual Report 2016
Corporate Governance Report
• researching and recommending to the Board material investments, fi nancing proposals, capital operation and asset
management of our Company, which must be approved via Board meetings or shareholders’ meetings in accordance
with the Articles of Association;
• researching and recommending to the Board matters that are material to the development of our Company;
• checking the implementation of above-mentioned matters that are approved via Board meetings or shareholders’
meetings; and
• dealing with other strategic matters that are authorized by the Board.
As at the end of the Reporting Period, the Strategy and Investment Committee has performed its duties with due prudence in
accordance with the requirements of Company Law, the Articles of Association, the Terms of Reference of the Strategy and
Investment Committee of the Board and the relevant laws, regulations. The Strategy and Investment Committee convened
one meeting, details of which are set out below:
Name of Meeting Dates of Meetings Contents of Meeting Attendance at the Meeting
Strategy and
Investment
Committee
21 March 2016 1. the development strategy of the Company Mr. CHE Jianxing, Ms. ZHANG
Qi, Mr. JIANG Xiaozhong,
Mr. ZHANG Qiqi and Mr.
LI Zhenning attended the
meeting
2. the development plan of A-Share proposed
to be issued by the Company during the
current year (2016) and the upcoming two
years
3. to formulate and implement assumptions
for the development plan
4. major diffi culties faced when implementing
the development plan
5. the relationship between the operation
development plan and current operations
6. utilisation of the proposed A-Share
issuance to attain the abovementioned
business development goal
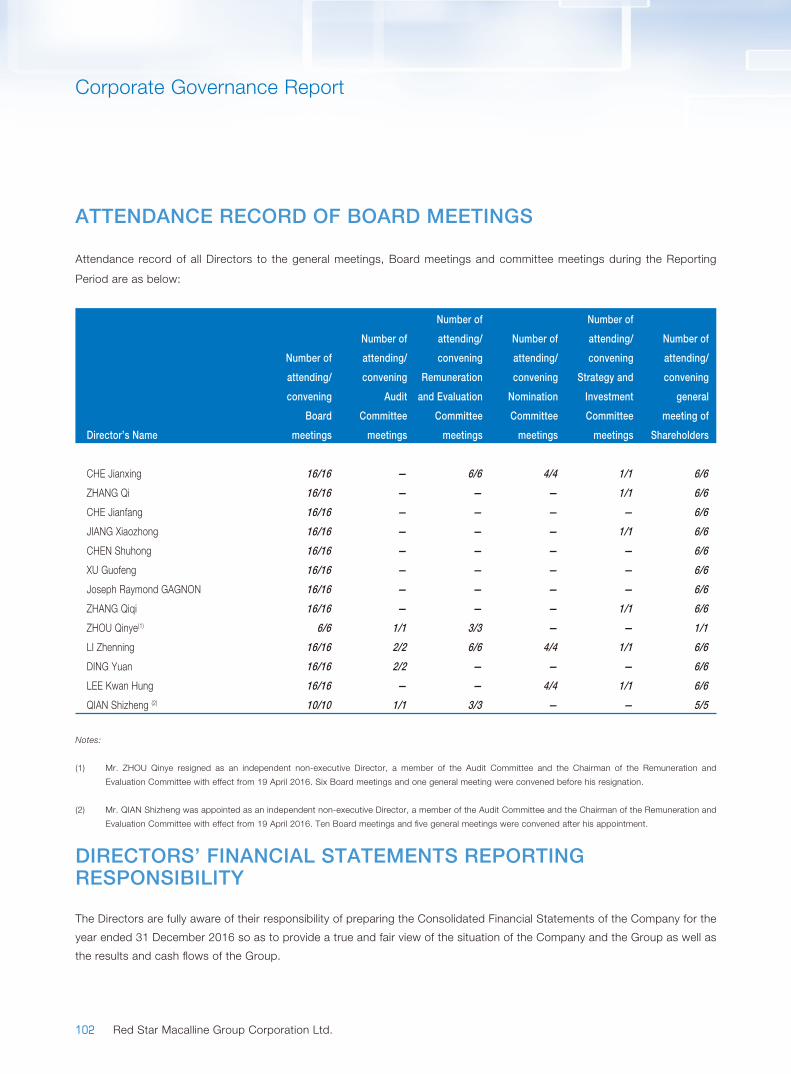
102 Red Star Macalline Group Corporation Ltd.
Corporate Governance Report
ATTENDANCE RECORD OF BOARD MEETINGS
Attendance record of all Directors to the general meetings, Board meetings and committee meetings during the Reporting
Period are as below:
Director’s Name
Number of
attending/
convening
Board
meetings
Number of
attending/
convening
Audit
Committee
meetings
Number of
attending/
convening
Remuneration
and Evaluation
Committee
meetings
Number of
attending/
convening
Nomination
Committee
meetings
Number of
attending/
convening
Strategy and
Investment
Committee
meetings
Number of
attending/
convening
general
meeting of
Shareholders
CHE Jianxing 16/16 — 6/6 4/4 1/1 6/6
ZHANG Qi 16/16 — — — 1/1 6/6
CHE Jianfang 16/16 — — — — 6/6
JIANG Xiaozhong 16/16 — — — 1/1 6/6
CHEN Shuhong 16/16 — — — — 6/6
XU Guofeng 16/16 — — — — 6/6
Joseph Raymond GAGNON 16/16 — — — — 6/6
ZHANG Qiqi 16/16 — — — 1/1 6/6
ZHOU Qinye(1) 6/6 1/1 3/3 — — 1/1
LI Zhenning 16/16 2/2 6/6 4/4 1/1 6/6
DING Yuan 16/16 2/2 — — — 6/6
LEE Kwan Hung 16/16 — — 4/4 1/1 6/6
QIAN Shizheng (2) 10/10 1/1 3/3 — — 5/5
Notes:
(1) Mr. ZHOU Qinye resigned as an independent non-executive Director, a member of the Audit Committee and the Chairman of the Remuneration and
Evaluation Committee with effect from 19 April 2016. Six Board meetings and one general meeting were convened before his resignation.
(2) Mr. QIAN Shizheng was appointed as an independent non-executive Director, a member of the Audit Committee and the Chairman of the Remuneration and
Evaluation Committee with effect from 19 April 2016. Ten Board meetings and fi ve general meetings were convened after his appointment.
DIRECTORS’ FINANCIAL STATEMENTS REPORTING RESPONSIBILITY
The Directors are fully aware of their responsibility of preparing the Consolidated Financial Statements of the Company for the
year ended 31 December 2016 so as to provide a true and fair view of the situation of the Company and the Group as well as
the results and cash fl ows of the Group.
103Annual Report 2016
Corporate Governance Report
The management has provided necessary explanation and information to the Board, thus the Board is able to evaluate the
fi nancial statements of the Company which are submitted for approval of the Board with full knowledge. The Company has
also provided continuously updated information about performance, status and prospect of the Company to all members of
the Board.
The Directors were not aware of any material uncertainties with respect to any event or situation which may pose important
threat to the sustainable operation of the Group.
Statement of the Directors’ reporting responsibilities of Consolidated Financial Statements of the Company made by auditors
of the Company is recorded in Independent Auditor’s Report on pages 111 to 117 of this annual report.
RISK MANAGEMENT AND INTERNAL CONTROL
The Board has established the risk management and internal control systems, monitored and reviewed their effectiveness
on an ongoing basis in compliance with Paragraph C.2 of the Corporate Governance Code. Such systems are designed to
manage rather than eliminate the risk of failure to achieve business objectives, to promote effective and effi cient operation,
and can only provide reasonable and not absolute assurance against material misstatement or loss.
The Board reviews the effectiveness of the risk management and internal control systems on an annual basis, and assesses
all important monitoring aspects including fi nancial monitoring, operation monitoring and compliance monitoring as per fi ve
internal control elements, namely, internal environment, risk assessment, control activities, information and communication
and internal supervision and make sure the adequacy of resources, staff qualifi cations and experience, training programmes
and budget of the Company’s accounting, internal audit and fi nancial reporting functions to ensure that effective risk
management and internal control systems are in place.
RISK MANAGEMENT AND INTERNAL CONTROL ORGANISATIONAL SYSTEM
The Company has established a complete risk management and internal control organisational system, which consists of the
Board, the Audit Committee, the Internal Control Management Committee (a sub-committee under the Audit Committee),
the Internal Control Compliance Department, the Audit Department and all divisions of the Company. Various functions of
the Company form the fi rst line of defence of risk management and internal control, which are responsible for the direct
identifi cation and management of the risks arising in the course of business during our daily operation, and developing
response strategies and specifi c solutions. The Internal Control Compliance Department and Internal Control Management
Committee form the second line of defence of risk management and internal control, which is responsible for building and
maintaining the comprehensive risk management framework of the Company, and coordinating the establishment of risk
management between various functions of the headquarter and different regions and shopping malls. The Audit Department
and the Audit Committee forms the third line of defence, which is responsible for conducting independent supervision which
involves supervision and examination to determine if the Company is able to conduct risk management and internal control in
accordance with relevant policies, systems and processes for risk management and internal control, and if such measures are
effective. The Board undertakes the ultimate responsibility for the establishment and perfection of the risk management and
internal control systems as well as the effective implementation of risk management, and acts as the ultimate decision-making
body in the Company with respect to risk management and internal control.
104 Red Star Macalline Group Corporation Ltd.
Corporate Governance Report
In addition, the Board arranges adequate training courses and related budget in respect of the risk management and internal
control systems on an annual basis, and has also conducted periodic training on the concept, knowledge, process of risk
management and methods of internal control to ensure the adequacy of management resources in risk management and
internal control.
CARRYING OUT RISK MANAGEMENT WORK
In order to better cope with the changing market environment and ensure the realization of the Company’s business
objectives, in 2016, the Company initiated the construction of a comprehensive risk management system at the company-
wide level. The system is designed to manage various potential risks to which the Company is exposed in the course
of operation through procedures and measures of risk identifi cation, risk assessment, risk response, risk reporting and
monitoring. The Company has systematically established a database for risks based on the status quo of our current business
and management, with a view to achieving comprehensive identifi cation of and response to risks.
On the basis of risk identifi cation, the Company has established the major risk evaluation criteria from two dimensions,
namely the probability of occurrence and the magnitude of infl uence of relevant risks. Various forms of measures, including
risk questionnaire, risk investigation and interviews, as well as forum for risk assessment, were conducted to carry out the
multilevel and comprehensive risk assessment work. These measures are developed to identify major risk areas affecting the
objectives of the Company and to specify the priority and allocation of resources on risk management.
In order to align the risk points with specifi c control measures and responsibilities of different roles in the management
system, and to ensure suffi cient control of such risks, the Company implements basic risk management measures of internal
control through specifi c business processes, including preparation and disclosure of fi nancial reports, inside information
processing and disclosure and other management procedures and internal control measures for signifi cant procedures in
accordance with laws, regulations and regulatory requirements of Listing Rules.
In respect of external information and communication, the company developed information disclosure and reporting
management rules, such as Information Disclosure Management System, News Release and News Spokesman System, etc.,
to establish a standardized information collection, collation, validation and disclosure of the insider control program, which
identifi ed the message security measures. Before the information is completely disclosed to the public, the Company will
ensure that the information is absolutely confi dential. For information which confi dentiality is diffi cult to maintain or is already
leaked, our Company will disclose the relevant information in a timely manner, so as to ensure the effective protection of
investors and the interests of related parties.
The major risks to which the Company are exposed will vary with the changes in internal and external business environment
and business situations. The Company will continuously monitor the information on signifi cant risks and changes in risks
arising from the operation and management of the different risk liability departments and conduct supervision and evaluation
on whether each of the departments is able to carry out risk management and the effectiveness of their efforts in accordance
with relevant provisions, with a view to further improve the risk management mechanism.

105Annual Report 2016
Corporate Governance Report
OPERATION OF INTERNAL CONTROL MECHANISM
The management of the Company has set up the Internal Control Management Committee, which leads the Internal Control
Compliance Department in the overall planning, design and guidance in relation to the building of the risk management
and internal control management system. In 2016, the Internal Control Compliance Department played a leading role in
the establishment of the internal control evaluation working group, which carried out self-evaluation of internal control and
assessment of the effectiveness of the design and implementation of internal control for the Company’s main business
and matters. For all defi ciencies in internal control as identifi ed in the assessment, the management of the Company has
developed feasible rectifi cation plans and promoted the implementation of such rectifi cation. The Internal Control Compliance
Department has followed up on such areas subject to rectifi cation, and continued to monitor the progress and the overall
effectiveness of the rectifi cation of defi ciencies, thus achieving the organized operation of overall internal control.
The Board and the Audit Committee are responsible for the continuous supervision and review of the effective implementation
of the Company’s risk management and internal control management system and the defi ciencies of internal control. Specifi c
supervision and review is carried out by the Audit Department. The Audit Department exercises the right of audit supervision
independently without any interference from other departments, units and individuals. This mechanism is designed to maintain
the independence, impartiality and authority of the internal audit function.
The Board has reviewed risk management and internal control work carried out in 2016. There has been no signifi cant risk
control failure, and no signifi cant risk control weakness has been identifi ed within the Company. The management processes
including fi nancial report and information disclosure of the Company are in strict compliance with the Listing Rules. The Board
has reviewed the risk management and internal control work conducted by the Company during the Reporting Period and
considers the risk management and internal control system effective and suffi cient within the Group.
AUDITOR’S REMUNERATION
Statement of the Company’s external auditor related to the reporting responsibilities of consolidated fi nancial statements is
recorded in the Independent Auditor’s Report on pages 111 to 117 of this annual report.
Remuneration of the Company’s external auditor Deloitte Touche Tohmatsu paid/payable for the year ended 31 December
2016 was RMB18.2 million. As at the end of the Reporting Period, the external auditor did not provide any non-audit service.
COMPANY SECRETARY
Mr. GUO Binghe, the company secretary of the Company, is responsible for raising corporate governance-related
suggestions to the Board, and ensuring compliance with policies and procedures of the Board, applicable laws, rules and
regulations.
106 Red Star Macalline Group Corporation Ltd.
Corporate Governance Report
In order to maintain high-standard corporate governance and ensure that the Company complies with the Listing Rules and
applicable Hong Kong laws, we also appointed Ms. LEUNG Suet Lun, a manager of the listing services department of TMF
Hong Kong Limited, as an assistant company secretary, to work closely with and provide assistance to Mr. GUO in the
discharge of his duties as the company secretary.
For the year ended 31 December 2016, Mr. GUO and Ms. LEUNG have already completed professional training of no less
than 15 hours in accordance with Rule 3.29 of the Listing Rules, respectively.
COMMUNICATION WITH SHAREHOLDERS AND INVESTOR RELATIONS
The Company believes that effective communication with Shareholders is very signifi cant to the investor relations
enhancement and investors’ understanding of the Company’s business, performance and strategies. We are also deeply
convinced of the importance of disclosing information of the Company in time without preservation to the Shareholders and
investors knowledgeably.
The annual general meeting of Shareholders of the Company provides the shareholders with opportunities to communicate
with the Directors directly. The chairman of the Board and directors of the committees will attend the meeting if possible, to
answer questions raised by the shareholders. The external auditor of the Company will attend the meeting and answer the
questions regarding auditing items, preparation and contents of the auditor’s report, accounting policy and independence of
the auditor.
The Company adopted a shareholder communication policy so as to promote the effectiveness of communication and
establish a bridge between the Company and its Shareholders. Further, a website (www.chinaredstar.com) and enquiry
channels for the investors (e-mail: [email protected]) are also available. The Company will release the latest information
about the business operation and development, corporate governance practices and other latest information to the public on
the website.
SHAREHOLDERS’ RIGHTS
In order to protect shareholders’ interest and rights, the Company will submit the items for the review of the Shareholders’
general meeting in the form of an independent resolution. The resolution submitted to the Shareholders’ general meeting will
be voted pursuant to the Listing Rules, and the voting result will be published on the websites of the Stock Exchange and the
Company in time after the meeting.
107Annual Report 2016
Corporate Governance Report
Extraordinary Shareholders’ Meeting Convening and Proposal
Pursuant to the Articles of Association, where the Shareholders separately or jointly holding more than 10% of the Shares
request the Board to convene an extraordinary Shareholders’ meeting or Shareholders’ class meeting, the following
procedures shall be followed:
(1) Shareholders who separately or jointly hold more than 10% of the Shares may request the Board to convene an
extraordinary Shareholders’ meeting or Shareholders’ class meeting by signing a written requirement or several
copies with the same format and to illustrate the subject of the meetings. The Board shall convene an extraordinary
Shareholders’ meeting or Shareholders’ class meeting as soon as possible upon the receipt of the aforesaid written
request. The Shareholders shall calculate the aforesaid number of shareholdings as of the date of the submission of the
written requirement.
(2) If the Board fails to issue a notice of meeting within 30 days upon the receipt of the aforesaid written request, the
Supervisory Committee may convene a meeting itself within four months upon the Board’s receipt of such request; if
the Supervisory Committee fails to convene and chair the meeting, the Shareholders who separately or jointly hold more
than 10% of the Shares of our Company for more than 90 consecutive days may convene and preside over themselves,
of which the convening procedure shall be at best the same as if convened by the Board. If the Shareholders call
and convene a meeting by themselves due to the Board being unable to convene a meeting in accordance with the
aforesaid requirement, the expenses reasonably incurred therefrom shall be borne by the Company and be deducted
from the amounts due to the relevant Directors as a result of negligence of duty.
A general Shareholders’ meeting convened by Shareholders themselves shall be chaired by a person elected by the convener.
If no chairman is recommended, the chairman can be elected from the Shareholders. If for any reason the Shareholders
cannot elect a chairman, the meeting shall be chaired by the attending Shareholder (including proxy) representing most voting
Shares at the meeting.
The Shareholder(s) holding, separately or jointly, 3% or more of the total shares of our Company may put forward extempore
proposals to the Company 10 days prior to the convening of the general meeting by submitting the proposals in writing to the
convener. The convener shall issue a supplementary notice of the general meeting to the Shareholders within two days upon
the receipt of the proposals.
Queries Made to Board of Directors
The Shareholders may send queries for attention of the Board to [email protected] by e-mail.
Articles of Association
The amended Articles of Association were approved by the Shareholders on 31 January 2016 and has become effective
since the same date. Save as this, for the year ended 31 December 2016, there had been no alternations to the Articles of
Association.

108
Social Responsibility Report
Red Star Macalline Group Corporation Ltd.
INTRODUCTION
This social responsibility report does not constitute an ESG report under Appendix 27 of the Listing Rules. An ESG report
complying with the disclosure requirements under Appendix 27 of the Listing Rules will be published by the Group separately.
RESPONSIBILITY TO THE INDUSTRY
As a leading brand in the home furnishing circulation industry, Red Star Macalline has been committed to promoting the
development and reform of the industry through profound market researches and strategic innovations. Red Star Macalline
has been making positive efforts in the introduction and development of new brands and new business models. For example,
Red Star Betterhome is a home improvement conglomerate which integrates home improvement R&D and design, technology
R&D and construction, main materials, furniture and soft decoration, smart home and housing equipment, introducing a new
business model of integrated services to the home furnishings industry.
As a leading company in the home furnishings industry, Red Star Macalline encourages home furnishing enterprises to
focus on originality and adhere to the principle of originality and innovated design, in order to provide customers with
better products and improve Chinese residents’ home improvement tastes. In 2016, Red Star Macalline announced the
implementation of the “1001” Strategy to build a design platform which provides house purchasing design, decoration and
space design, household products design and soft decoration design services, in an effort to fully integrate the aesthetic
principle of design into the whole industrial chains of pan-home consumption. In the future, the design platform will not only
employ international designers, but also will serve as an incubator for original Chinese designers. In addition, it will enable the
Group to work together with users, manufacturers and service providers to build an industrial chain for original design.
RESPONSIBILITY TO OUR PARTNERS
We are committed to implementing a set of code of business conduct focusing on integrity and make positive efforts in
performing our social responsibilities. A strict supplier admission and assessment mechanism has been established to ensure
product brands in Red Star Macalline’s shopping malls meet the quality requirements of environmental protection.
As for cooperation with our business partners, we made analysis of each supplier’s competitive landscape and issued a brand
operation and development report on a regular basis to give brand-specifi c improvement suggestions based on its operating
condition, in order to promote the development and innovation of its products as well as the transformation and upgrading of
its marketing model. These measures were widely accepted and recognized by a large number of cooperative brands, and
enabled us to become a benchmark enterprise in the home improvement and furniture industry which can truly provide value-
added services.
RESPONSIBILITY TO OUR CUSTOMERS
Adhering to the principle of “Customers are the base of a corporation”, we are committed to obtaining customer satisfaction
and loyalty and building a strong brand by offering our clients superior and high-quality services and satisfying their demands
in the aspects of product price, environmental protection quality and complaint settlement.
109Annual Report 2016
Social Responsibility Report
The Group held the “race for green” campaign for the fourth consecutive years in 2016. Subject to national standards,
industry standards and the latest domestic and international quality management systems, the race for green evaluation
project in which a comprehensive evaluation is conducted on household products and their manufacturers has become a
quality award highly recognized by consumers and the whole industry. In this race for green campaign, Red Star Macalline
seriously promised “to be responsible for the home environmental protection of every family” and formally announces to
incorporate green environmental protection into its corporate mission, which was the fi rst time that Red Star Macalline took
green environmental protection as one of its corporate strategies, indicating that green environmental protection will become
a major transformation and upgrading direction in home furnishings industry.
RESPONSIBILITY TO OUR STAFF
Adhering to the principle of openness, fairness, recruiting on a selective basis in “non-discriminatory employment”, Red Star
Macalline recruits and selects suitable talents for the development of the Company through various channels. Advocating
the employment philosophy of “high effi ciency and high salary”, Red Star Macalline provides competitive remuneration
package and benefi ts for its employees. In addition, we pay active attention to the growth of our employees. A wider career
development platform is provided to our employees by establishing management school, creating and improving the staff
training system, and formulating the supporting staff development system with “Sudoku” and other professional development
evaluation tools.
Furthermore, Red Star Macalline is devoted to assisting its employees in improving their physical health, alleviating
their working pressure, and balancing their work and life by creating a safe, healthy and comfortable working and living
environment and implementing various activities to care for its employees.
RESPONSIBILITY TO ENVIRONMENT AND SOCIAL PUBLIC
Paying high attention to resource conservation and environmental protection, Red Star Macalline incorporates environmental
protection into each link and phase of its business operation. It is the only marketplace winning the title of “China Green Home
Shopping Mall Model” (中國綠色生態家居示範商場) in domestic home furnishings industry. We are committed to saving
energy cost while lowering carbon emission through formulating a series of energy conservation and emission reduction
strategies against the major consumed energy resources including water, electricity, gas and construction materials.
Red Star Macalline insists on sharing its development achievements with society while pursuing its self-growth. As a leader
in the home furnishing industry, we spare no effort to spread home culture with our expertise, and propagandize home
aesthetics and family concept by pushing professional articles and holding such activities as “Family Day”.
Red Star Macalline also takes an active part in public welfare undertakings. In 2016, we sponsored the activity of “Caring
for the Children in Mountain Areas” together with large-scale media to call for donations and contributions from all orders
of society. We also actively interacted with the left-behind children to warm their inner solitude. Red Star Macalline made
charitable donation in a total amount of RMB5.9 million in 2016.
110 Red Star Macalline Group Corporation Ltd.
Social Responsibility Report
THE MAIN AWARDS OF RED STAR MACALLINE ON PERFORMING THE SOCIAL RESPONSIBILITY IN 2016
Awards/honors Issuing organization
Most Infl uential Top Ten Design Companies
of the Year (年度十大最具影響力設計機構)
The Committee of China International Architectural Decoration
and Design Art Fair (中國國際建築裝飾及設計藝術博覽會組委會)
The Most Popular Furniture Store among
Dealers (全國最受經銷商喜愛的家具賣場)
“Oscar” Award Ceremony of Furniture in China
(中國家具「奧斯卡」頒獎盛典)
2016 Retail Innovation Prize
(2016零售創新大獎)
China Chain Store & Franchise Association (中國連鎖經營協會)
The Quality Leader in National Furniture Industry
(全國傢俱行業質量領軍企業)
China Association for Quality Inspection (中國質量檢驗協會)
Top 100 Best Employers in China
(中國年度最佳僱主全國100強僱主)
Zhilian Zhaopin (智聯招聘)
The Most Innovative Enterprise of
Talent Development in China
(中國人才發展創新企業獎)
Xinhua Daily Media Group (Training Magazine)
(中國新華報業傳媒集團《培訓》雜誌)
The Best Enterprise University
(中國人才發展創新企業獎)
Overseas Management College of Shanghai Jiaotong University
(上海交通大學海外管理學院)
Best Learner of Studying Ecological Operation
(最佳學習生態運營獎)
www.online-edu.org (中國在線教育資訊網)
Brand Enterprise of Environmental Protection
(綠色環保品牌企業)
China Furniture & Decoration Chamber of Commerce
(中國工商聯家具裝飾業商會)
111
Independent Auditor’s Report
Annual Report 2016
TO THE MEMBERS OF RED STAR MACALLINE GROUP CORPORATION LTD.
(Incorporated in the People’s Republic of China with limited liability)
OPINION
We have audited the consolidated fi nancial statements of Red Star Macalline Group Corporation Ltd. (the “Company”) and its
subsidiaries (collectively referred to as the “Group”) set out on pages 118 to 240, which comprise the consolidated statement
of fi nancial position as at 31 December 2016, and the consolidated statement of profi t or loss and other comprehensive
income, consolidated statement of changes in equity and consolidated statement of cash fl ows for the year then ended, and
a summary of signifi cant accounting policies and other explanatory information.
In our opinion, the consolidated fi nancial statements give a true and fair view of the consolidated fi nancial position of the
Group as at 31 December 2016, and of its consolidated fi nancial performance and its consolidated cash fl ows for the year
then ended in accordance with International Financial Reporting Standards (“IFRSs”) issued by the International Accounting
Standards Board and have been properly prepared in compliance with the disclosure requirements of the Hong Kong
Companies Ordinance.
BASIS FOR OPINION
We conducted our audit in accordance with Hong Kong Standards on Auditing (“HKSAs”) issued by the Hong Kong Institute
of Certifi ed Public Accountants (the “HKICPA”). Our responsibilities under those standards are further described in the
Auditor’s Responsibilities for the Audit of the Consolidated Financial Statements section of our report. We are independent
of the Group in accordance with the HKICPA’s Code of Ethics for Professional Accountants (“the Code”), and we have
fulfi lled our other ethical responsibilities in accordance with the Code. We believe that the audit evidence we have obtained is
suffi cient and appropriate to provide a basis for our opinion.
KEY AUDIT MATTERS
Key audit matters are those matters that, in our professional judgment, were of most signifi cance in our audit of the
consolidated fi nancial statements of the current period. These matters were addressed in the context of our audit of the
consolidated fi nancial statements as a whole, and in forming our opinion thereon, and we do not provide a separate opinion
on these matters.

112 Red Star Macalline Group Corporation Ltd.
Independent Auditor’s Report
Key audit matter How our audit addressed the key audit matter
Revenue recognition regarding initiation and entrance fees
We identifi ed revenue recognition regarding initiation
and entrance fees as a key audit matter due to the
signifi cance of the revenue to the consolidated fi nancial
statements as a whole.
Revenue in relation to the initiation and entrance fees
is recognised when it is probable that the economic
benefi ts associated with the transaction will fl ow to the
Group.
The Group recognised revenue in relation to the initiation
and entrance fees of RMB1,402 million for the year
ended 31 December 2016.
The relevant disclosures are set out in note 5 and 6 to
the consolidated fi nancial statements.
Our audit procedures in relation to revenue recognition
regarding initiation and entrance fees included:
— Testing key controls in relation to revenue recognition
regarding initiation and entrance fees, including
preparation and periodic review of the status of the
Group’s ongoing projects and analysis on whether such
projects meet criteria of revenue recognition;
— Reviewing the signed agreements to understand the
transactions;
— Obtaining relevant evidences in relation to the status
of the underlying projects (including, where relevant,
land use rights certifi cates, physical inspection of the
latest status of the underlying projects and interview the
contracted counterparties on a sample basis);
— Circulating confi rmations to contracted counterparties, on
a sample basis, to verify the occurrence and accuracy of
the amounts recognised as revenue;
— Checking the deposits/payments received, on a sample
basis, to the bank statements and inspecting the
underlying receipts documentation; and
— Challenging and assessing the reasonableness of the
judgement made by the management on whether it is
probable that the economic benefi ts associated with the
transaction will fl ow to the Group.

113Annual Report 2016
Independent Auditor’s Report
Key audit matter How our audit addressed the key audit matter
Impairment of trade receivables regarding initiation and entrance fees
We identifi ed impairment of trade receivables regarding
initiation and entrance fees as a key audit matter
due to the signifi cance of the balance to the fi nancial
statements as a whole, combined with the use of
judgment and estimates in assessing the recoverability of
trade receivables.
The allowance for doubtful debts on trade receivables
regarding initiation and entrance fees as at 31 December
2016 amounted to RMB318 million and the impairment
loss recorded in profi t for the year was RMB197 million.
The relevant disclosures are set out in notes 5 and 28 to
the consolidated fi nancial statements.
Our audit procedures in relation to impairment of trade
receivables regarding initiation and entrance fees included:
— Obtaining an understanding of how allowance for
doubtful debts is estimated by the management and
testing the key controls in relation to impairment of trade
receivables;
— Challenging and assessing the reasonableness of the
key assumptions used by management in determining
whether there is objective evidence of allowance for bad
and doubtful debts;
— Obtaining and verifying evidence regarding the progress
of the underlying projects and further investigating
whether there is objective evidence of allowance for bad
and doubtful debts; and
— Testing subsequent settlements on a sample basis.
114 Red Star Macalline Group Corporation Ltd.
Independent Auditor’s Report
Key audit matter How our audit addressed the key audit matter
Impairment of intangible assets – Trademark License of JiSheng Wellborn (the “JSWB License”)
We identifi ed impairment of the JSWB License as a key
audit matter due to the signifi cance of the balance to the
fi nancial statements as a whole, combined with the key
judgment associated with the impairment testing of the
JSWB License.
The impairment of JSWB License amounted to RMB100
million for the year, whilst the carrying value (after
impairment) of JSWB License was RMB380 million as at
31 December 2016.
Signifi cant judgement is required by the management
in assessing the impairment of the License, which is
determined with reference to the value in use, based
on the cash fl ow forecast for each cash generating unit
(CGU).
The details of JSWB License are set out in notes 5 and
20 of the consolidated fi nancial statements.
Our audit procedures in relation to impairment of JSWB License
included:
— assessing the competence, capabilities and objectivity of
the independent valuer;
— involving our internal valuation experts to evaluate work of
the valuer, in particular:
• The valuation models used by the valuer; and
• The key assumptions applied in the valuation such
as discount rates; and
— challenging the reasonableness of key input data used
in the valuation, based on supporting evidence obtained
and our knowledge of business and industry.
OTHER INFORMATION
The directors of the Company are responsible for the other information. The other information comprises the information
included in the annual report, but does not include the consolidated fi nancial statements and our auditor’s report thereon.
Our opinion on the consolidated fi nancial statements does not cover the other information and we do not express any form of
assurance conclusion thereon.
In connection with our audit of the consolidated fi nancial statements, our responsibility is to read the other information and,
in doing so, consider whether the other information is materially inconsistent with the fi nancial statements or our knowledge
obtained in the audit or otherwise appears to be materially misstated. If, based on the work we have performed, we conclude
that there is a material misstatement of this other information, we are required to report that fact. We have nothing to report in
this regard.

115Annual Report 2016
Independent Auditor’s Report
RESPONSIBILITIES OF DIRECTORS AND THOSE CHARGED WITH GOVERNANCE FOR THE CONSOLIDATED FINANCIAL STATEMENTS
The directors of the Company are responsible for the preparation of the consolidated fi nancial statements that give a true and
fair view in accordance with IFRSs and the disclosure requirements of the Hong Kong Companies Ordinance, and for such
internal control as the directors determine is necessary to enable the preparation of consolidated fi nancial statements that are
free from material misstatement, whether due to fraud or error.
In preparing the consolidated fi nancial statements, the directors are responsible for assessing the Group’s ability to continue
as a going concern, disclosing, as applicable, matters related to going concern and using the going concern basis of
accounting unless the directors either intend to liquidate the Group or to cease operations, or have no realistic alternative but
to do so.
Those charged with governance are responsible for overseeing the Group’s fi nancial reporting process.
AUDITOR’S RESPONSIBILITIES FOR THE AUDIT OF THE CONSOLIDATED FINANCIAL STATEMENTS
Our objectives are to obtain reasonable assurance about whether the consolidated fi nancial statements as a whole are free
from material misstatement, whether due to fraud or error, and to issue an auditor’s report that includes our opinion solely
to you, as a body, in accordance with our agreed terms of engagement, and for no other purpose. We do not assume
responsibility towards or accept liability to any other person for the contents of this report. Reasonable assurance is a high
level of assurance, but is not a guarantee that an audit conducted in accordance with HKSAs will always detect a material
misstatement when it exists. Misstatements can arise from fraud or error and are considered material if, individually or in
the aggregate, they could reasonably be expected to infl uence the economic decisions of users taken on the basis of these
consolidated fi nancial statements.

116 Red Star Macalline Group Corporation Ltd.
Independent Auditor’s Report
As part of an audit in accordance with HKSAs, we exercise professional judgment and maintain professional skepticism
throughout the audit. We also:
o Identify and assess the risks of material misstatement of the consolidated fi nancial statements, whether due to fraud
or error, design and perform audit procedures responsive to those risks, and obtain audit evidence that is suffi cient
and appropriate to provide a basis for our opinion. The risk of not detecting a material misstatement resulting from
fraud is higher than for one resulting from error, as fraud may involve collusion, forgery, intentional omissions,
misrepresentations, or the override of internal control.
o Obtain an understanding of internal control relevant to the audit in order to design audit procedures that are appropriate
in the circumstances, but not for the purpose of expressing an opinion on the effectiveness of the Group’s internal
control.
o Evaluate the appropriateness of accounting policies used and the reasonableness of accounting estimates and related
disclosures made by the directors.
o Conclude on the appropriateness of the directors’ use of the going concern basis of accounting and, based on the audit
evidence obtained, whether a material uncertainty exists related to events or conditions that may cast signifi cant doubt
on the Group’s ability to continue as a going concern. If we conclude that a material uncertainty exists, we are required
to draw attention in our auditor’s report to the related disclosures in the consolidated fi nancial statements or, if such
disclosures are inadequate, to modify our opinion. Our conclusions are based on the audit evidence obtained up to the
date of our auditor’s report. However, future events or conditions may cause the Group to cease to continue as a going
concern.
o Evaluate the overall presentation, structure and content of the consolidated fi nancial statements, including the
disclosures, and whether the consolidated fi nancial statements represent the underlying transactions and events in a
manner that achieves fair presentation.
o Obtain suffi cient appropriate audit evidence regarding the fi nancial information of the entities or business activities
within the Group to express an opinion on the consolidated fi nancial statements. We are responsible for the direction,
supervision and performance of the group audit. We remain solely responsible for our audit opinion.
117Annual Report 2016
Independent Auditor’s Report
We communicate with those charged with governance regarding, among other matters, the planned scope and timing of the
audit and signifi cant audit fi ndings, including any signifi cant defi ciencies in internal control that we identify during our audit.
We also provide those charged with governance with a statement that we have complied with relevant ethical requirements
regarding independence, and to communicate with them all relationships and other matters that may reasonably be thought
to bear on our independence, and where applicable, related safeguards.
From the matters communicated with those charged with governance, we determine those matters that were of most
signifi cance in the audit of the consolidated fi nancial statements of the current period and are therefore the key audit matters.
We describe these matters in our auditor’s report unless law or regulation precludes public disclosure about the matter or
when, in extremely rare circumstances, we determine that a matter should not be communicated in our report because
the adverse consequences of doing so would reasonably be expected to outweigh the public interest benefi ts of such
communication.
The engagement partner on the audit resulting in the independent auditor’s report is KAY, Man Wo, Dick.
Deloitte Touche Tohmatsu
Certifi ed Public Accountants
Hong Kong
20 March 2017

118
Consolidated Statement of Profi t or Loss and Other Comprehensive IncomeFor the year ended 31 December 2016
Red Star Macalline Group Corporation Ltd.
NOTES 2016 2015
RMB’000 RMB’000
Revenue 6 9,282,393 8,756,120
Cost of sales and services (2,658,172) (2,241,981)
Gross profi t 6,624,221 6,514,139
Other income 7 199,430 194,302
Changes in fair value of investment properties 17 2,652,234 2,381,694
Other gains and losses 8 (567,294) (206,330)
Selling and distribution expenses (1,205,698) (1,196,889)
Administrative expenses (1,149,310) (882,418)
Other expenses 9 (16,103) (120,834)
Share of profi t of associates 83,831 62,954
Share of profi t of joint ventures 55,087 50,024
Finance costs 10 (949,156) (854,285)
Profi t before tax 12 5,727,242 5,942,357
Income tax expense 11 (1,358,832) (1,572,602)
Profi t and total comprehensive income for the year 4,368,410 4,369,755
Profi t and total comprehensive income for the year attributable to:
Owners of the Company 4,036,269 4,098,068
Non-controlling interests 332,141 271,687
4,368,410 4,369,755
EARNINGS PER SHARE 16
— Basic (RMB) 1.11 1.22
— Diluted (RMB) N/A 1.22

119
Consolidated Statement of Financial Position
As at 31 December 2016
Annual Report 2016
NOTES 2016 2015
RMB’000 RMB’000
NON-CURRENT ASSETS
Investment properties 17 77,090,000 70,593,000
Property, plant and equipment 18 353,592 333,293
Goodwill 19 16,592 16,592
Intangible assets 20 467,822 539,267
Interests in associates 21 290,176 159,207
Interests in joint ventures 22 829,421 749,334
Available-for-sale investments 23 544,401 402,930
Loan receivables 24 160,223 112,580
Deferred tax assets 25 577,294 347,444
Restricted bank deposits 29 70,451 71,758
Other non-current assets 26 2,642,634 2,003,413
83,042,606 75,328,818
CURRENT ASSETS
Inventories 35,707 16,173
Loan receivables 24 500,441 160,100
Other fi nancial assets 27 — 61,000
Trade and other receivables 28 2,008,532 1,627,561
Tax recoverable 82,781 41,834
Restricted bank deposits 29 17,265 —
Bank balances and cash 30 6,150,150 5,954,087
8,794,876 7,860,755
CURRENT LIABILITIES
Trade and other payables 31 6,598,760 5,766,274
Rental and service fee received in advance 2,066,352 1,776,581
Tax liabilities 205,472 285,375
Bank and other borrowings 32 2,787,296 2,297,382
Bonds 33 1,889,468 497,195
13,547,348 10,622,807
NET CURRENT LIABILITY (4,752,472) (2,762,052)
TOTAL ASSETS LESS CURRENT LIABILITIES 78,290,134 72,566,766

120 Red Star Macalline Group Corporation Ltd.
Consolidated Statement of Financial PositionAs at 31 December 2016
NOTES 2016 2015
RMB’000 RMB’000
NON-CURRENT LIABILITIES
Deferred tax liabilities 25 11,634,375 10,667,539
Bank and other borrowings 32 8,447,537 7,027,170
Bonds 33 8,434,101 7,335,011
Obligations under fi nance leases 34 419,693 349,065
Deferred income 35 195,413 194,354
Other non-current liabilities 36 1,471,340 1,725,423
30,602,459 27,298,562
NET ASSETS 47,687,675 45,268,204
CAPITAL AND RESERVES
Share capital 37 3,623,917 3,623,917
Share premium 5,617,001 5,617,001
Reserves 34,229,707 31,903,641
Equity attributable to owners of the Company 43,470,625 41,144,559
Non-controlling interests 38 4,217,050 4,123,645
TOTAL EQUITY 47,687,675 45,268,204
The consolidated fi nancial statements on pages 118 to 240 were approved and authorised for issue by the Board of Directors
on 20 March 2017 and are signed on its behalf by:
CHE Jianxing CHEN Shuhong
DIRECTOR DIRECTOR

121
Consolidated Statement of Changes in Equity
For the year ended 31 December 2016
Annual Report 2016
Share
capital
Share
premium
Statutory
surplus
reserve
Merge
reserve
Share
options
reserve
Other
reserves
Retained
earnings
Attributable
to owners
of the
Company
Non-
controlling
interests Total
RMB’000 RMB’000 RMB’000 RMB’000 RMB’000 RMB’000 RMB’000 RMB’000 RMB’000 RMB’000
(note a) (note b) (note c)
At 1 January 2016 3,623,917 5,617,001 1,030,718 (182,045) 169,331 89,338 30,796,299 41,144,559 4,123,645 45,268,204
Profi t and total
comprehensive income
for the year — — — — — — 4,036,269 4,036,269 332,141 4,368,410
Appropriate to reserve — — 195,394 — — — (195,394) — — —
Dividends (note 15) — — — — — — (1,703,241) (1,703,241) — (1,703,241)
Dividends declared to
non-controlling
shareholders of
subsidiaries — — — — — — — — (194,713) (194,713)
Capital injection by
non-controlling
shareholders of
subsidiaries — — — — — 593 — 593 19,757 20,350
Acquisition of additional
interests in subsidiaries — — — — — (7,555) — (7,555) (6,445) (14,000)
Disposal of subsidiaries
(note 41) — — — — — — — — (407) (407)
Deregistration of subsidiaries — — — — — — — — (137) (137)
Deemed distribution to
non-controlling
shareholders of
subsidiaries (note d) — — — — — — — — (56,791) (56,791)
At 31 December 2016 3,623,917 5,617,001 1,226,112 (182,045) 169,331 82,376 32,933,933 43,470,625 4,217,050 47,687,675
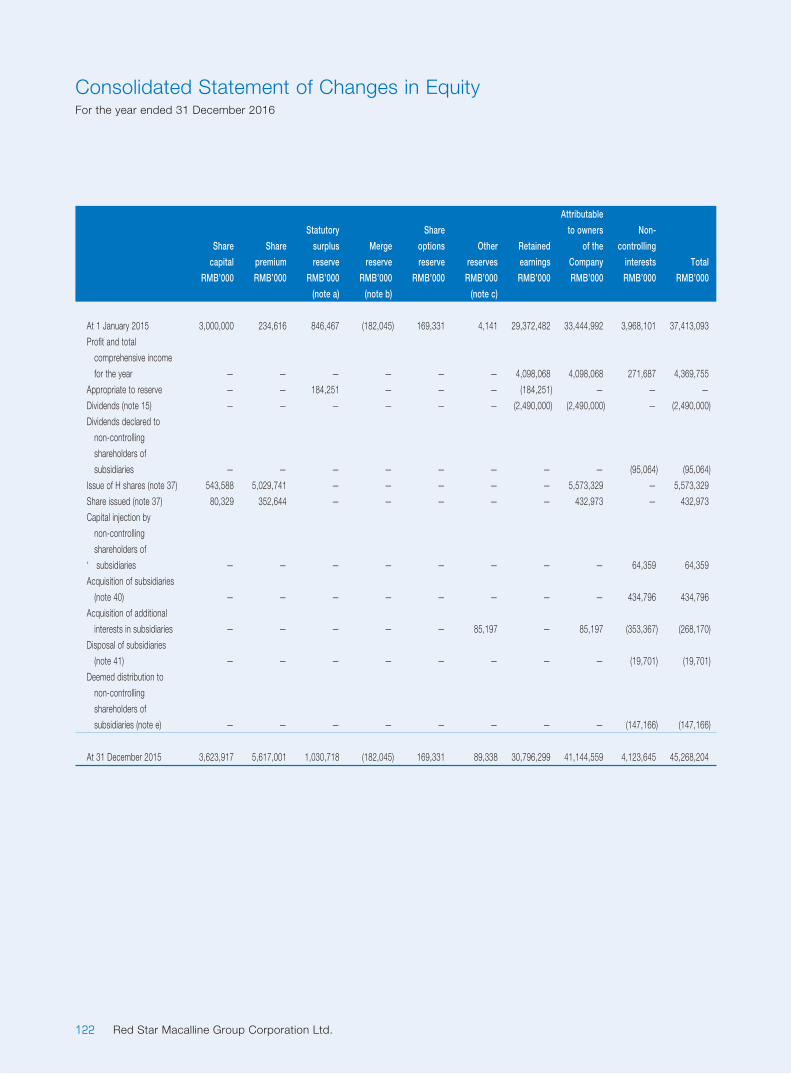
122 Red Star Macalline Group Corporation Ltd.
Consolidated Statement of Changes in EquityFor the year ended 31 December 2016
Share
capital
Share
premium
Statutory
surplus
reserve
Merge
reserve
Share
options
reserve
Other
reserves
Retained
earnings
Attributable
to owners
of the
Company
Non-
controlling
interests Total
RMB’000 RMB’000 RMB’000 RMB’000 RMB’000 RMB’000 RMB’000 RMB’000 RMB’000 RMB’000
(note a) (note b) (note c)
At 1 January 2015 3,000,000 234,616 846,467 (182,045) 169,331 4,141 29,372,482 33,444,992 3,968,101 37,413,093
Profi t and total
comprehensive income
for the year — — — — — — 4,098,068 4,098,068 271,687 4,369,755
Appropriate to reserve — — 184,251 — — — (184,251) — — —
Dividends (note 15) — — — — — — (2,490,000) (2,490,000) — (2,490,000)
Dividends declared to
non-controlling
shareholders of
subsidiaries — — — — — — — — (95,064) (95,064)
Issue of H shares (note 37) 543,588 5,029,741 — — — — — 5,573,329 — 5,573,329
Share issued (note 37) 80,329 352,644 — — — — — 432,973 — 432,973
Capital injection by
non-controlling
shareholders of
‘ subsidiaries — — — — — — — — 64,359 64,359
Acquisition of subsidiaries
(note 40) — — — — — — — — 434,796 434,796
Acquisition of additional
interests in subsidiaries — — — — — 85,197 — 85,197 (353,367) (268,170)
Disposal of subsidiaries
(note 41) — — — — — — — — (19,701) (19,701)
Deemed distribution to
non-controlling
shareholders of
subsidiaries (note e) — — — — — — — — (147,166) (147,166)
At 31 December 2015 3,623,917 5,617,001 1,030,718 (182,045) 169,331 89,338 30,796,299 41,144,559 4,123,645 45,268,204

123Annual Report 2016
Consolidated Statement of Changes in EquityFor the year ended 31 December 2016
Notes:
(a) In accordance with the Articles of Association of the Company and all subsidiaries established in the PRC, the Company and subsidiaries are required
to transfer 10% of the profi t after taxation to the statutory surplus reserve until the reserve reaches 50% of the registered capital. Transfer to this reserve
must be made before distributing dividends to equity holders. The statutory surplus reserve can be used to make up for previous years’ losses, expand the
existing operations or convert into additional capital of the subsidiaries.
(b) Merge reserve represents the differences between the existing book values of net assets of the combining entities or businesses under common control and
the fair value of consideration paid when the Group acquired entities or businesses from the ultimate holding company or ultimate shareholder.
(c) Other reserve represents the differences between the amount by which non-controlling interests are adjusted and the fair value of consideration paid or
received when the Group acquired or disposed of partial interests in existing subsidiaries.
(d) In December 2015, the Group acquired 60.0% interest of a piece of land parcel held by 蘇州凱潤置業有限公司 Suzhou Kairun Properties Company Limited
(“Suzhou Kairun”) for a consideration of RMB258,000,000 from RSM Enterprise Development. In 2016, 蘇州市木瀆集團有限公司 Suzhou Mudu Group
Company Limited(“Suzhou Mudu”) was established following the split of Suzhou Kairun and such piece of land parcel was injected into Suzhou Mudu. The
Group held 60% equity interests in Suzhou Mudu.
The changes of the net assets, which mainly represented payables due to the non-controlling shareholder of Suzhou Mudu, arising from the split was
recognized as deemed distribution to non-controlling shareholders of subsidiaries.
(e) The amount mainly represents the impact of repurchase of the transferred shopping mall held by 瀋陽晶森宏普房產開發有限公司 Shenyang Jingsen
Hongpu Property Development Company Limited (“Shenyang Jingsen”). In June 2015, the Group completed the repurchase of this transferred shopping
mall and the change of the net assets of the transferred shopping mall attributable to non-controlling interests arising from the repurchase (which mainly
represented payables due to related parties) was recognised as deemed distribution to non-controlling shareholders of subsidiaries.

124
Consolidated Statement of Cash FlowsFor the year ended 31 December 2016
Red Star Macalline Group Corporation Ltd.
2016 2015
RMB’000 RMB’000
OPERATING ACTIVITIES
Profi t before tax 5,727,242 5,942,357
Adjustments for:
Finance costs 949,156 854,285
Interest income (96,127) (100,836)
Dividend income from unlisted equity investments (3,060) (5,965)
Share of profi t of associates (83,831) (62,954)
Share of profi t of joint ventures (55,087) (50,024)
Depreciation of property, plant and equipment 97,750 102,019
Amortisation of intangible assets 24,204 25,811
Allowance provided for doubtful debts 336,462 198,599
Impairment loss on intangible assets 100,000 —
Impairment loss on available-for-sale equity investments 122,225 —
Changes in fair value of investment properties (2,652,234) (2,381,694)
Release of deferred income regarding assets related government plants (5,007) —
Loss on disposal of property, plant and equipment 4,448 441
Loss on disposal of intangible assets 168 2,575
Gain on disposal of subsidiaries, net (20) (1,930)
Gain on disposal of an associate — (3,969)
Loss (gain) from business combination achieved in stages 8,402 (2,236)
Gain from bargain purchases in business combinations (356) (1,845)
Operating cash fl ows before movements in working capital 4,474,335 4,514,634
(Increase) decrease in inventories (20,146) 21,347
Increase in trade and other receivables (902,985) (483,495)
Increase in other non-current assets (40,343) (5,195)
Increase (decrease) in rental and service fee received in advance 294,190 (331,312)
Increase in trade and other payables, and other non-current liabilities 837,974 338,335
Cash generated from operations 4,643,025 4,054,314
Income tax paid (749,284) (744,981)
NET CASH FROM OPERATING ACTIVITIES 3,893,741 3,309,333

125Annual Report 2016
Consolidated Statement of Cash FlowsFor the year ended 31 December 2016
2016 2015
RMB’000 RMB’000
INVESTING ACTIVITIES
Interest received 95,984 100,836
Assets-related government grants received 6,066 —
Dividends received from an associate — 37,000
Dividends received from unlisted equity investments 3,060 5,965
Payments for investment properties (2,479,899) (2,926,311)
Payments for acquisition of land use rights (360,774) —
Payments for deposit for acquisition of offi ce premises (210,081) —
Payments for property, plant and equipment (124,359) (76,942)
Payments for intangible assets (52,779) (19,531)
Proceeds on disposal of property, plant and equipment 520 3,728
Proceeds on disposal of intangible assets 15 794
Placement of loan receivables (376,000) (242,870)
Repayment of loan receivables 171,100 115,000
Net cash outfl ow on acquisitions of subsidiaries (note 40) (783,364) (433,494)
Payments of consideration for acquisitions of subsidiaries in prior year (196,840) —
Prepayment for repurchase interests in a transferred shopping mall — (247,705)
Payments for acquisition/establishment of associates (40,788) —
Payments for establishment of joint ventures (25,000) —
Payments for acquisition of available-for-sale investments (273,701) (74,730)
Proceeds on withdrawal of (payment of) debt investment 61,000 (61,000)
(Net cash outfl ow) proceeds on disposal of subsidiaries (note 41) (17,574) 4,112
Placement of bank deposits with original maturity
over three months (159,725) (105,623)
Withdrawal of bank deposits with original maturity
over three months 107,623 72,456
Payment of restricted bank deposits (17,265) (64,578)
Withdrawal of restricted bank deposits 1,307 49,472
Advance to related parties and third parties (395,010) (208,242)
Repayment from related parties and third parties 49,824 158,678
NET CASH USED IN INVESTING ACTIVITIES (5,016,660) (3,912,985)

126 Red Star Macalline Group Corporation Ltd.
Consolidated Statement of Cash FlowsFor the year ended 31 December 2016
2016 2015
RMB’000 RMB’000
FINANCING ACTIVITIES
Issue of H shares — 5,782,298
Listing expenses paid — (208,969)
Share issued — 432,973
Proceeds from new borrowings raised 5,164,130 4,579,180
Proceeds from new bonds raised 2,959,905 4,960,000
Payment of issuance costs of bonds (575) (1,330)
Repayment of borrowings (3,253,849) (7,110,627)
Redemption of bonds (500,000) (600,000)
Capital injection by non-controlling shareholders of subsidiaries 20,350 64,359
Payment for acquisition of additional interests in subsidiaries (27,450) (254,720)
Interest paid (1,098,446) (1,221,869)
Dividends paid (1,703,241) (2,490,000)
Dividends paid to non-controlling shareholders of subsidiaries (85,063) (69,814)
Advance from related parties and third parties — 26,979
Repayment to related parties and third parties (208,881) (377,939)
Deposits arising from counter guarantee agreements repaid to related parties — (650,809)
NET CASH FROM FINANCING ACTIVITIES 1,266,880 2,859,712
NET INCREASE IN CASH AND CASH EQUIVALENTS 143,961 2,256,060
CASH AND CASH EQUIVALENTS AT BEGINNING OF THE YEAR 5,848,464 3,592,404
CASH AND CASH EQUIVALENTS AT END OF THE YEAR,
represented by bank balances and cash (note 30) 5,992,425 5,848,464

127
Notes to the Consolidated Financial Statements
For the year ended 31 December 2016
Annual Report 2016
1. GENERAL INFORMATION
The Company was incorporated in the People’s Republic of China (the “PRC”) on 6 January 2011 as a sino-foreign joint
stock limited company under the PRC laws upon the conversion of 上海紅星美凱龍企業管理有限公司Shanghai Red
Star Macalline Enterprise Management Company Limited (formerly known as 上海紅星美凱龍家居家飾品有限公司
Shanghai Red Star Macalline Home Furnishing Company Limited), a company with limited liability incorporated in the
PRC. The parent and ultimate holding company of the Company is 紅星美凱龍控股集團有限公司Red Star Macalline
Holding Group Limited (“RSM Holding”, formerly known as 上海紅星美凱龍投資有限公司 Shanghai Red Star Macalline
Investment Company Limited), a company with limited liability incorporated in the PRC. The ultimate controlling
shareholder is Mr. Che Jianxing.
The Company was listed on the Main Board of The Stock Exchange of Hong Kong Limited (the “Stock Exchange”) on
26 June 2015.
The respective addresses of the registered offi ce and the principal place of business of the Company are disclosed
in the corporate information section of the annual report. The principal activities of the Company and its subsidiaries
(collectively the “Group”) are operating and managing home furnishing shopping malls. The Group is also involved in
pan home furnishings consumption, including internet home decoration, internet retail, as well as logistics and delivery
services.
The consolidated fi nancial statements are presented in Renminbi (“RMB”), which is also the functional currency of the
Company and its subsidiaries. Details of the Company’s subsidiaries are set out in note 50.
2. BASIS OF PRESENTATION OF CONSOLIDATED FINANCIAL STATEMENTS
The Group’s current liabilities exceed its current assets at the end of current year. Taking into account the available
facilities from bank and non-bank fi nancial institutions, the available approved limits for placement of bonds and cash
fl ows from operations, the directors of the Company believe that the Group will continue to operate as a going concern
and consequently, the consolidated fi nancial statements have been prepared on a going concern basis.
128 Red Star Macalline Group Corporation Ltd.
Notes to the Consolidated Financial StatementsFor the year ended 31 December 2016
3. APPLICATION OF NEW AND REVISED INTERNATIONAL FINANCIAL REPORTING STANDARDS (“IFRSs”)
Amendments to IFRSs that are mandatorily effective for the current year
The Group has applied the following amendments to IFRSs issued by the International Accounting Standards Board
(“IASB”) for the fi rst time in the current year:
Amendments to IFRS 11 Accounting for Acquisitions of Interest in Joint Operations
Amendments to IAS 1 Disclosure Initiative
Amendments to IAS 16 and IAS 38 Clarifi cation of Acceptable Methods of Depreciation and
Amortisation
Amendments to IAS 16 and IAS 41 Agriculture: Bearer Plants
Amendments to IFRS 10, IFRS 12 and IAS 28 Investment Entities: Applying the Consolidation Exception
Amendments to IFRSs Annual Improvements to IFRSs 2012–2014 Cycle
The application of amendments to IFRSs in the current year has had no material impact on the Group’s fi nancial
performance and positions for the current and prior years and/or on the disclosures set out in these consolidated
fi nancial statements.
New and amendments to IFRSs and International Financial Reporting Interpretations Committee (“IFRIC”) in issue but not yet effective
The Group has not early applied the following new and amendments to IFRSs that have been issued but are not yet
effective:
IFRSs
IFRS 9 Financial Instruments1
IFRS 15 Revenue from Contracts with Customers1
IFRS 16 Leases2
IFRIC 22 Foreign Currency Transactions and Advance Consideration1
Amendments to IFRS 2 Classifi cation and Measurement of Share-based Payment Transactions1
Amendments to IFRS 4 Applying IFRS 9 Financial Instruments with IFRS 4 Insurance Contracts1
Amendments to IFRS 15 Clarifi cations to IFRS 15 Revenue from Contracts with Customers1
Amendments to IFRS 10 and IAS 28 Sale or Contribution of Assets between an Investor and its Associate or
Joint Venture3
Amendments to IAS 7 Disclosure Initiative4
Amendments to IAS 12 Recognition of Deferred Tax Assets for Unrealised Losses4
Amendments to IAS 40 Transfers of Investment Property1
Amendments to IFRSs Annual Improvements to IFRS Standards 2014–2016 Cycle5
1 Effective for annual periods beginning on or after 1 January 20182 Effective for annual periods beginning on or after 1 January 20193 Effective for annual periods beginning on or after a date to be determined4 Effective for annual periods beginning on or after 1 January 20175 Effective for annual periods beginning on or after 1 January 2017 or 1 January 2018, as appropriate

129Annual Report 2016
Notes to the Consolidated Financial StatementsFor the year ended 31 December 2016
3. APPLICATION OF NEW AND REVISED INTERNATIONAL FINANCIAL REPORTING STANDARDS (“IFRSs”) (continued)
IFRS 9 Financial Instruments
IFRS 9 introduces new requirements for the classifi cation and measurement of fi nancial assets, fi nancial liabilities,
general hedge accounting and impairment requirements for fi nancial assets.
Key requirements of IFRS 9 which are relevant to the Group are:
All recognised fi nancial assets that are within the scope of IFRS 9 are required to be subsequently measured at
amortised cost or fair value. Specifi cally, debt investments that are held within a business model whose objective is
to collect the contractual cash fl ows, and that have contractual cash fl ows that are solely payments of principal and
interest on the principal outstanding are generally measured at amortised cost at the end of subsequent accounting
periods.
Debt instruments that are held within a business model whose objective is achieved both by collecting contractual cash
fl ows and selling fi nancial assets, and that have contractual terms that give rise on specifi ed dates to cash fl ows that
are solely payments of principal and interest on the principal amount outstanding, are generally measured as fi nancial
assets at fair value through other comprehensive income (“FVTOCI”). All other debt investments and equity investments
are measured at their fair value at the end of subsequent accounting periods. In addition, under IFRS 9, entities may
make an irrevocable election to present subsequent changes in the fair value of an equity investment (that is not held for
trading) in other comprehensive income, with only dividend income generally recognised in profi t or loss.
In relation to the impairment of fi nancial assets, IFRS 9 adopts an expected credit loss model, as opposed to an
incurred credit loss model under IAS 39. The expected credit loss model requires an entity to account for expected
credit losses and changes in those expected credit losses at the reporting date to refl ect changes in credit risk since
initial recognition. In other words, it is no longer necessary for a credit event to have occurred before credit losses are
recognised.
Based on the Group’s fi nancial instruments and risk management policies as at 31 December 2016, application of
IFRS 9 in the future may have a material impact on the classifi cation and measurement of the Group’s fi nancial assets.
The Group’s available-for-sale investments, including those currently stated at cost less impairment, will either be
measured as fair value through profi t or loss or be designated as FVTOCI (subject to fulfi llment of the designation
criteria). In addition, the expected credit loss model may result in early provision of credit losses which are not yet
incurred in relation to the Group’s fi nancial assets measured at amortised cost. However, it is not practicable to provide
a reasonable estimate of the fi nancial effect on the Group’s fi nancial statements until a detailed review has been
completed.

130 Red Star Macalline Group Corporation Ltd.
Notes to the Consolidated Financial StatementsFor the year ended 31 December 2016
3. APPLICATION OF NEW AND REVISED INTERNATIONAL FINANCIAL REPORTING STANDARDS (“IFRSs”) (continued)
IFRS 15 Revenue from Contracts with Customers
IFRS 15 was issued which establishes a single comprehensive model for entities to use in accounting for revenue arising
from contracts with customers. IFRS 15 will supersede the current revenue recognition guidance including IAS 18
Revenue, IAS 11 Construction Contracts and the related Interpretations when it becomes effective.
The core principle of IFRS 15 is that an entity should recognise revenue to depict the transfer of promised goods or
services to customers in an amount that refl ects the consideration to which the entity expects to be entitled in exchange
for those goods or services. Specifi cally, the Standard introduces a 5-step approach to revenue recognition:
Step 1: Identify the contract(s) with a customer
Step 2: Identify the performance obligations in the contract
Step 3: Determine the transaction price
Step 4: Allocate the transaction price to the performance obligations in the contract
Step 5: Recognise revenue when (or as) the entity satisfi es a performance obligation
Under IFRS 15, an entity recognises revenue when (or as) a performance obligation is satisfi ed, i.e. when ‘control’ of the
goods or services underlying the particular performance obligation is transferred to the customer. Far more prescriptive
guidance has been added in IFRS 15 to deal with specifi c scenarios. Furthermore, extensive disclosures are required by
IFRS 15.
In 2016, the IASB issued Clarifi cations to IFRS 15 in relation to the identifi cation of performance obligations, principal
versus agent considerations, as well as licensing application guidance.
The directors of the Company consider that the performance obligations may not be similar to the current identifi cation
of separate revenue components under IAS 18. The Group needs to distinguish more specifi c goods and services
transferred from the comprehensive services stated in the contracts and identify performance obligations. In addition,
the allocation of total consideration to the respective performance obligations will be based on relative fair values
which will potentially affect the timing and amounts of revenue recognition, and more disclosures relating to revenue
is required. However, it is not practicable to provide a reasonable estimate of the effect of IFRS 15 until the Group
performs a detailed review. In addition, the application of IFRS 15 in the future may result in more disclosures in the
consolidated fi nancial statements.

131Annual Report 2016
Notes to the Consolidated Financial StatementsFor the year ended 31 December 2016
3. APPLICATION OF NEW AND REVISED INTERNATIONAL FINANCIAL REPORTING STANDARDS (“IFRSs”) (continued)
IFRS 16 Leases
IFRS 16 introduces a comprehensive model for the identifi cation of lease arrangements and accounting treatments
for both lessors and lessees. IFRS 16 will supersede IAS 17 Leases and the related interpretations when it becomes
effective.
IFRS 16 distinguishes lease and service contracts on the basis of whether an identifi ed asset is controlled by a
customer. Distinctions of operating leases and fi nance leases are removed for lessee accounting, and is replaced by a
model where a right-of-use asset and a corresponding liability have to be recognised for all leases by lessees, except for
short-term leases and leases of low value assets.
The right-of-use asset is initially measured at cost and subsequently measured at cost (subject to certain exceptions)
less accumulated depreciation and impairment losses, adjusted for any remeasurement of the lease liability. The lease
liability is initially measured at the present value of the lease payments that are not paid at that date. Subsequently, the
lease liability is adjusted for interest and lease payments, as well as the impact of lease modifi cations, amongst others.
For the classifi cation of cash fl ows, the Group currently presents upfront prepaid lease payments as investing cash fl ows
in relation to leasehold lands for owned use and those classifi ed as investment properties while other operating lease
payments are presented as operating cash fl ows. Under the IFRS 16, lease payments in relation to lease liability will be
allocated into a principal and an interest portion which will be presented as fi nancing cash fl ows.
Under IAS 17, the Group has already recognised an asset and a related fi nance lease liability for fi nance lease
arrangement and prepaid lease payments for leasehold lands where the Group is a lessee. The application of IFRS 16
may result in potential changes in classifi cation of these assets depending on whether the Group presents right-of-use
assets separately or within the same line item at which the corresponding underlying assets would be presented if they
were owned.
In contrast to lessee accounting, IFRS 16 substantially carries forward the lessor accounting requirements in IAS 17,
and continues to require a lessor to classify a lease either as an operating lease or a fi nance lease.
Furthermore, extensive disclosures are required by IFRS 16.
As at 31 December 2016, the Group has non-cancellable operating lease commitments of RMB5,099,266,000 as
disclosed in note 44. A preliminary assessment indicates that these arrangements will meet the defi nition of a lease
under IFRS 16, and hence the Group will recognise a right-of-use asset and a corresponding liability in respect of all
these leases unless they qualify for low value or short-term leases upon the application of IFRS 16. In addition, the
application of new requirements may result changes in measurement, presentation and disclosure as indicated above.
However, it is not practicable to provide a reasonable estimate of the fi nancial effect until the directors complete a
detailed review.

132 Red Star Macalline Group Corporation Ltd.
Notes to the Consolidated Financial StatementsFor the year ended 31 December 2016
4. SUMMARY OF SIGNIFICANT ACCOUNTING POLICIES
The consolidated fi nancial statements have been prepared in accordance with IFRSs issued by the IASB. In addition,
the consolidated fi nancial statements include applicable disclosures required by the Rules Governing the Listing of
Securities on the Stock Exchange (“Listing Rules”) and by the Hong Kong Companies Ordinance (“CO”).
The consolidated fi nancial statements have been prepared on the historical cost basis except for investment properties
and certain fi nancial instruments that are measured at fair values at the end of each reporting period, as explained in the
accounting policies set out below.
Historical cost is generally based on the fair value of the consideration given in exchange for goods and services.
Fair value is the price that would be received to sell an asset or paid to transfer a liability in an orderly transaction
between market participants at the measurement date, regardless of whether that price is directly observable or
estimated using another valuation technique. In estimating the fair value of an asset or a liability, the Group takes into
account the characteristics of the asset or liability if market participants would take those characteristics into account
when pricing the asset or liability at the measurement date. Fair value for measurement and/or disclosure purposes in
the consolidated fi nancial statements is determined on such a basis, except for leasing transactions that are within the
scope of IAS 17, and measurements that have some similarities to fair value but are not fair value, such as net realisable
value in IAS 2 or value in use in IAS 36.
A fair value measurement of a non-fi nancial asset takes into account a market participant’s ability to generate economic
benefi ts by using the asset in its highest and best use or by selling it to another market participant that would use the
asset in its highest and best use.
In addition, for fi nancial reporting purposes, fair value measurements are categorised into Level 1, 2 or 3 based on the
degree to which the inputs to the fair value measurements are observable and the signifi cance of the inputs to the fair
value measurement in its entirety, which are described as follows:
• Level 1 inputs are quoted prices (unadjusted) in active markets for identical assets or liabilities that the entity can
access at the measurement date;
• Level 2 inputs are inputs, other than quoted prices included within Level 1, that are observable for the asset or
liability, either directly or indirectly; and
• Level 3 inputs are unobservable inputs for the asset or liability.
The principal accounting policies are set out below.
133Annual Report 2016
Notes to the Consolidated Financial StatementsFor the year ended 31 December 2016
4. SUMMARY OF SIGNIFICANT ACCOUNTING POLICIES (continued)
Basis of consolidation
The consolidated fi nancial statements incorporate the fi nancial statements of the Company and entities controlled by
the Company and its subsidiaries. Control is achieved when the Company:
• has power over the investee;
• is exposed, or has rights, to variable returns from its involvement with the investee; and
• has the ability to use its power to affect its returns.
The Group reassesses whether or not it controls an investee if facts and circumstances indicate that there are changes
to one or more of the three elements of control listed above.
Consolidation of a subsidiary begins when the Group obtains control over the subsidiary and ceases when the Group
loses control of the subsidiary. Specifi cally, income and expenses of a subsidiary acquired or disposed of during the
year are included in the consolidated statement of profi t or loss and other comprehensive income from the date the
Group gains control until the date when the Group ceases to control the subsidiary.
Profi t or loss and each item of other comprehensive income are attributed to the owners of the Company and to the
non-controlling interests. Total comprehensive income of subsidiaries is attributed to the owners of the Company and to
the non-controlling interests even if this results in the non-controlling interests having a defi cit balance.
When necessary, adjustments are made to the fi nancial statements of subsidiaries to bring their accounting policies into
line with the Group’s accounting policies.
All intragroup assets and liabilities, equity, income, expenses and cash fl ows relating to transactions between members
of the Group are eliminated in full on consolidation.
Changes in the Group’s ownership interests in existing subsidiaries
Changes in the Group’s ownership interest in existing subsidiaries that do not result in the Group losing control over
the subsidiary are accounted for as equity transactions. The carrying amounts of the Group’s interests and the non-
controlling interests are adjusted to refl ect the changes in their relative interests in the subsidiary. Any difference
between the amount by which the non-controlling interests are adjusted and the fair value of the consideration paid or
received is recognised directly in equity and attributed to owners of the Company.

134 Red Star Macalline Group Corporation Ltd.
Notes to the Consolidated Financial StatementsFor the year ended 31 December 2016
4. SUMMARY OF SIGNIFICANT ACCOUNTING POLICIES (continued)
Basis of consolidation (continued)
Changes in the Group’s ownership interests in existing subsidiaries (continued)
When the Group loses control of a subsidiary, a gain or loss is recognised in profi t or loss and is calculated as the
difference between (i) the aggregate of the fair value of the consideration received and the fair value of any retained
interest and (ii) the previous carrying amount of the assets (including goodwill), and liabilities of the subsidiary and
any non-controlling interests. All amounts previously recognised in other comprehensive income in relation to that
subsidiary are accounted for as if the Group had directly disposed of the related assets or liabilities of the subsidiary
(i.e. reclassifi ed to profi t or loss or transferred to another category of equity as specifi ed/permitted by applicable IFRSs).
The fair value of any investment retained in the former subsidiary at the date when control is lost is regarded as the fair
value on initial recognition for subsequent accounting under IAS 39, when applicable, the cost on initial recognition of an
investment in an associate or a joint venture.
Merger accounting for business combination involving entities under common control
The consolidated fi nancial statements incorporate the fi nancial statements items of the combining entities or businesses
in which the common control combination occurs as if they had been consolidated from the date when the combining
entities or businesses fi rst came under the control of the controlling party.
The net assets of the combining entities or businesses are consolidated using the existing book values from the
controlling party’s perspective. No amount is recognised in respect of goodwill or excess of acquirer’s interest in the
net fair value of acquiree’s identifi able assets, liabilities and contingent liabilities over cost at the time of common control
combination, to the extent of the continuation of the controlling party’s interest.
The consolidated statement of profi t or loss and other comprehensive income include the results of each of the
combining entities or businesses from the earliest date presented or since the date when the combining entities or
businesses fi rst came under the common control, where this is a shorter period, regardless of the date of the common
control combination.
Business combinations other than common control combination
Acquisitions of businesses are accounted for using the acquisition method. The consideration transferred in a business
combination is measured at fair value, which is calculated as the sum of the acquisition-date fair values of the assets
transferred by the Group, liabilities incurred by the Group to the former owners of the acquiree and the equity interests
issued by the Group in exchange for control of the acquiree. Acquisition-related costs are generally recognised in profi t
or loss as incurred.
135Annual Report 2016
Notes to the Consolidated Financial StatementsFor the year ended 31 December 2016
4. SUMMARY OF SIGNIFICANT ACCOUNTING POLICIES (continued)
Business combinations other than common control combination (continued)
At the acquisition date, the identifi able assets acquired and the liabilities assumed are recognised at their fair value at
the acquisition date, except that:
• deferred tax assets or liabilities and liabilities or assets related to employee benefi t arrangements are recognised
and measured in accordance with IAS 12 and IAS 19 respectively;
• liabilities or equity instruments related to share-based payment arrangements of the acquire or share-based
payment arrangements of the Group entered into to replace the share-based payment arrangements of the
acquiree are measured in accordance with IFRS 2 at the acquisition date; and
• assets (or disposal groups) that are classifi ed as held for sale in accordance with IFRS 5 are measured in
accordance with that Standard.
Goodwill is measured as the excess of the sum of the consideration transferred, the amount of any non-controlling
interests in the acquiree, and the fair value of the acquirer’s previously held equity interest in the acquiree (if any) over
the net of the acquisition-date amounts of the identifi able assets acquired and the liabilities assumed. If, after re-
assessment, the net of the acquisition-date amounts of the identifi able assets acquired and liabilities assumed exceeds
the sum of the consideration transferred, the amount of any non-controlling interests in the acquiree and the fair value
of the acquirer’s previously held interest in the acquire (if any), the excess is recognised immediately in profi t or loss as
a bargain purchase gain.
Non-controlling interests that are present ownership interests and entitle their holders to a proportionate share of the
entity’s net assets in the event of liquidation are initially measured at the non-controlling interests’ proportionate share of
the recognised amounts of the acquiree’s identifi able net assets. Other types of non-controlling interests are measured
at their fair value or, when applicable, on the basis specifi ed in another IFRS.
When a business combination is achieved in stages, the Group’s previously held equity interest in the acquiree is
remeasured to its fair value at the acquisition date (i.e. the date when the Group obtains control), and the resulting
gain or loss, if any, is recognised in profi t or loss. Amounts arising from interests in the acquiree prior to the acquisition
date that have previously been recognised in other comprehensive income are reclassifi ed to profi t or loss where such
treatment would be appropriate if that interests were disposed of.

136 Red Star Macalline Group Corporation Ltd.
Notes to the Consolidated Financial StatementsFor the year ended 31 December 2016
4. SUMMARY OF SIGNIFICANT ACCOUNTING POLICIES (continued)
Goodwill
Goodwill arising on an acquisition of a business is carried at cost as established at the date of acquisition of the
business (see the accounting policy above) less accumulated impairment losses, if any.
For the purposes of impairment testing, goodwill is allocated to each of the cash-generating units (or groups of cash-
generating units) that is expected to benefi t from the synergies of the combination.
A cash-generating unit to which goodwill has been allocated is tested for impairment annually, or more frequently
whenever there is indication that the unit may be impaired. For goodwill arising on an acquisition in a reporting period,
the cash-generating unit to which goodwill has been allocated is tested for impairment before the end of that reporting
period. If the recoverable amount of the cash-generating unit is less than the carrying amount of the unit, the impairment
loss is allocated fi rst to reduce the carrying amount of any goodwill allocated to the unit and then to the other assets
of the unit pro rata on the basis of the carrying amount of each asset in the unit. Any impairment loss for goodwill
is recognised directly in profi t or loss in the consolidated statement of comprehensive income. An impairment loss
recognised for goodwill is not reversed in subsequent periods.
On disposal of the relevant cash-generating unit, the attributable amount of goodwill is included in the determination of
the amount of profi t or loss on disposal.
The Group’s policy for goodwill arising on the acquisition of an associate is described below.
Acquisition of assets and liabilities through acquisition of subsidiary
Where an acquisition of an assets or a group of assets and liabilities that not constitute a business, the Group identify
and recognise the individual identifi able assets acquired and liabilities assumed by allocating purchase price to the
individual identifi able assets and liabilities on the basis of their relative fair values at the date of purchase and no
goodwill will be recognised in respect of these transactions.
Investments in associates and joint ventures
An associate is an entity over which the Group has signifi cant infl uence and that is neither a subsidiary nor an interest
in a joint venture. Signifi cant infl uence is the power to participate in the fi nancial and operating policy decisions of the
investee but is not control or joint control over those policies.

137Annual Report 2016
Notes to the Consolidated Financial StatementsFor the year ended 31 December 2016
4. SUMMARY OF SIGNIFICANT ACCOUNTING POLICIES (continued)
Investments in associates and joint ventures (continued)
A joint venture is a joint arrangement whereby the parties that have joint control of the arrangement have rights to the
net assets of the joint arrangement. Joint control is the contractually agreed sharing of control of an arrangement, which
exists only when decisions about the relevant activities require unanimous consent of the parties sharing control.
The results and assets and liabilities of associates or joint ventures are incorporated in the consolidated fi nancial
statements using the equity method of accounting. The fi nancial statements of associates or joint ventures used for
equity accounting purposes are prepared using uniform accounting policies as those of the Group for like transactions
and events in similar circumstances.
Under the equity method, investments in associates or joint ventures are initially recognised in the consolidated
statement of fi nancial position at cost and adjusted thereafter to recognise the Group’s share of the profi t or loss and
other comprehensive income of the associates or joint ventures. When the Group’s share of losses of an associate or
a joint venture exceeds the Group’s interest in that associate or joint venture (which includes any long-term interests
that, in substance, form part of the Group’s net investment in the associate or joint venture), the Group discontinues
recognising its share of further losses. Additional losses are recognised only to the extent that the Group has incurred
legal or constructive obligations or made payments on behalf of the associate or joint venture.
An investment in an associate or a joint venture is accounted for using the equity method from the date on which the
investee becomes an associate or a joint venture. On acquisition of the investment in an associate or a joint venture, any
excess of the cost of the investment over the Group’s share of the net fair value of the identifi able assets and liabilities
of the investee is recognised as goodwill, which is included within the carrying amount of the investment. Any excess
of the Group’s share of the net fair value of the identifi able assets and liabilities over the cost of the investment, after
reassessment, is recognised immediately in profi t or loss in the period in which the investment is acquired.
The requirements of IAS 39 are applied to determine whether it is necessary to recognise any impairment loss with
respect to the Group’s investment in an associate or a joint venture. When necessary, the entire carrying amount of
the investment (including goodwill) is tested for impairment in accordance with IAS 36 as a single asset by comparing
its recoverable amount (higher of value in use and fair value less costs of disposal) with its carrying amount. Any
impairment loss recognised forms part of the carrying amount of the investment. Any reversal of that impairment loss
is recognised in accordance with IAS 36 to the extent that the recoverable amount of the investment subsequently
increases.
138 Red Star Macalline Group Corporation Ltd.
Notes to the Consolidated Financial StatementsFor the year ended 31 December 2016
4. SUMMARY OF SIGNIFICANT ACCOUNTING POLICIES (continued)
Investments in associates and joint ventures (continued)
The Group discontinues the use of the equity method from the date when the investment ceases to be an associate
or a joint venture, or when the investment (or a portion thereof) is classifi ed as held for sale. When the Group retains
an interest in the former associate or joint venture and the retained interest is a fi nancial asset, the Group measures
the retained interest at fair value at that date and the fair value is regarded as its fair value on initial recognition in
accordance with IAS 39. The difference between the carrying amount of the associate or joint venture at the date the
equity method was discontinued, and the fair value of any retained interest and any proceeds from disposing of a
part of interest in the associate or joint venture is included in the determination of the gain or loss on disposal of the
associate or joint venture. In addition, the Group accounts for all amounts previously recognised in other comprehensive
income in relation to that associate or joint venture on the same basis as would be required if that associate or joint
venture had directly disposed of the related assets or liabilities. Therefore, if a gain or loss previously recognised in
other comprehensive income by that associate or joint venture would be reclassifi ed to profi t or loss on the disposal of
the related assets or liabilities, the Group reclassifi es the gain or loss from equity to profi t or loss (as a reclassifi cation
adjustment) when the equity method is discontinued.
When the Group reduces its ownership interest in an associate or a joint venture but the Group continues to use
the equity method, the Group reclassifi es to profi t or loss the proportion of the gain or loss that had previously been
recognised in other comprehensive income relating to that reduction in ownership interest if that gain or loss would be
reclassifi ed to profi t or loss on the disposal of the related assets or liabilities.
When a group entity transacts with an associate or a joint venture of the Group, profi ts and losses resulting from the
transactions with the associate or joint venture are recognised in the consolidated fi nancial statements only to the extent
of interests in the associate that are not related to the Group.
Revenue recognition
Revenue is measured at the fair value of the consideration received or receivable and represents amounts receivable for
goods or services provided in the normal course of business, net of discounts and sales related taxes.
Initiation, entrance and membership fees
Initiation and entrance fee, which is not related to other goods and service provided, is recognised as revenue when no
signifi cant uncertainty as to its collectability exists.

139Annual Report 2016
Notes to the Consolidated Financial StatementsFor the year ended 31 December 2016
4. SUMMARY OF SIGNIFICANT ACCOUNTING POLICIES (continued)
Revenue recognition (continued)
Rendering of services
Revenue from a contract to provide services is recognised by reference to the stage of completion of the contract
(provided that it is probable that the economic benefi ts will fl ow to the Group and the outcome of the transaction
involving the rendering of services can be estimated reliably)
Sale of goods
Revenue from the sale of goods is recognised when the goods are delivered and titles have passed, at which time all
the following conditions are satisfi ed:
• the Group has transferred to the buyer the signifi cant risks and rewards of ownership of the goods;
• the Group retains neither continuing managerial involvement to the degree usually associated with ownership nor
effective control over the goods sold;
• the amount of revenue can be measured reliably;
• it is probable that the economic benefi ts associated with the transaction will fl ow to the Group; and
• the costs incurred or to be incurred in respect of the transaction can be measured reliably.
Dividend and interest income
Dividend income from investments is recognised when the shareholders’ rights to receive payment have been
established (provided that it is probable that the economic benefi ts will fl ow to the Group and the amount of revenue
can be measured reliably).
Interest income from a fi nancial asset is recognised when it is probable that the economic benefi ts will fl ow to the Group
and the amount of income can be measured reliably. Interest income is accrued on a time basis, by reference to the
principal outstanding and at the effective interest rate applicable, which is the rate that exactly discounts the estimated
future cash receipts through the expected life of the fi nancial asset to that asset’s net carrying amount on initial
recognition.

140 Red Star Macalline Group Corporation Ltd.
Notes to the Consolidated Financial StatementsFor the year ended 31 December 2016
4. SUMMARY OF SIGNIFICANT ACCOUNTING POLICIES (continued)
Revenue recognition (continued)
Rental income
The Group’s accounting policy for recognition of revenue from operating leases is described in the accounting policy for
leasing below.
Construction contracts
When the outcome of a construction contract can be estimated reliably, revenue and costs are recognised by reference
to the stage of completion of the contract activity at the end of the reporting period, measured based on the proportion
of contract costs incurred for work performed to date relative to the estimated total contract costs, except where this
would not be representative of the stage of completion. Variations in contract work, claims and incentive payments are
included to the extent that the amount can be measured reliably and its receipt is considered probable.
When the outcome of a construction contract cannot be estimated reliably, contract revenue is recognised to the extent
of contract costs incurred that it is probable will be recoverable. Contract costs are recognised as expenses in the
period in which they are incurred.
When it is probable that total contract costs will exceed total contract revenue, the expected loss is recognised as an
expense immediately.
When contract costs incurred to date plus recognised profi ts less recognised losses exceed progress billings, the
surplus is shown as amounts due from customers for contract work. For contracts where progress billings exceed
contract costs incurred to date plus recognised profi ts less recognized losses, the surplus is shown as the amounts due
to customers for contract work. Amounts received before the related work is performed are included in the consolidated
statement of fi nancial position, as a liability, as advances received. Amounts billed for work performed but not yet paid
by the customer are included in the consolidated statement of fi nancial position under trade and other receivables.

141Annual Report 2016
Notes to the Consolidated Financial StatementsFor the year ended 31 December 2016
4. SUMMARY OF SIGNIFICANT ACCOUNTING POLICIES (continued)
Leasing
Leases are classifi ed as fi nance leases whenever the terms of the lease transfer substantially all the risks and rewards of
ownership to the lessee. All other leases are classifi ed as operating leases.
The Group as lessor
Rental income from operating leases is recognised in profi t or loss on a straight-line basis over the term of the relevant
lease.
The Group as lessee
Assets held under fi nance leases are recognised as assets of the Group at their fair value at the inception of the lease
or, if lower, at the present value of the minimum lease payments. The corresponding liability to the lessor is included in
the consolidated statement of fi nancial position as a fi nance lease obligation.
Lease payments are apportioned between fi nance expenses and reduction of the lease obligation so as to achieve a
constant rate of interest on the remaining balance of the liability. Finance expenses are recognised immediately in profi t
or loss, unless they are directly attributable to qualifying assets, in which case they are capitalised in accordance with
the Group’s general policy on borrowing costs (see the accounting policy below).
Operating lease payments are recognised as an expense on a straight-line basis over the lease term, except where
another systematic basis is more representative of the time pattern in which economic benefi ts from the leased assets
are consumed.
Leasehold land and building
When a lease includes both land and building elements, the Group assesses the classifi cation of each element as a
fi nance or an operating lease separately based on the assessment as to whether substantially all the risks and rewards
incidental to ownership of each element have been transferred to the Group, unless it is clear that both elements are
operating leases in which case the entire lease is classifi ed as an operating lease. Specifi cally, the minimum lease
payments (including any lump-sum upfront payments) are allocated between the land and the building elements in
proportion to the relative fair values of the leasehold interests in the land element and building element of the lease at
the inception of the lease.

142 Red Star Macalline Group Corporation Ltd.
Notes to the Consolidated Financial StatementsFor the year ended 31 December 2016
4. SUMMARY OF SIGNIFICANT ACCOUNTING POLICIES (continued)
Foreign currencies
In preparing the fi nancial statements of each individual group entity, transactions in currencies other than the functional
currency of that entity (foreign currencies) are recorded in the respective functional currency (i.e. the currency of the
primary economic environment in which the entity operates) at the rates of exchanges prevailing on the dates of the
transactions. At the end of the reporting period, monetary items denominated in foreign currencies are retranslated at
the rates prevailing at that date. Non-monetary items carried at fair value that are denominated in foreign currencies
are retranslated at the rates prevailing on the date when the fair value was determined. Non-monetary items that are
measured in terms of historical cost in a foreign currency are not retranslated.
Exchange differences arising on the settlement of monetary items, and on the retranslation of monetary items, are
recognised in profi t or loss in the period in which they arise.
Borrowing costs
Borrowing costs directly attributable to the acquisition, construction or production of qualifying assets, which are assets
that necessarily take a substantial period of time to get ready for their intended use or sale, are added to the cost of
those assets until such time as the assets are substantially ready for their intended use or sale.
Investment income earned on the temporary investment of specifi c borrowings pending their expenditure on qualifying
assets is deducted from the borrowing costs eligible for capitalisation.
All other borrowing costs are recognised in profi t or loss in the period in which they are incurred.

143Annual Report 2016
Notes to the Consolidated Financial StatementsFor the year ended 31 December 2016
4. SUMMARY OF SIGNIFICANT ACCOUNTING POLICIES (continued)
Government grants
Government grants are not recognised until there is reasonable assurance that the Group will comply with the
conditions attaching to them and that the grants will be received.
Government grants are recognised in profi t or loss on a systematic basis over the periods in which the Group
recognises as expenses the related costs for which the grants are intended to compensate. Specifi cally, government
grants whose primary condition is that the Group should purchase, construct or otherwise acquire non-current assets
are recognised as deferred income in the consolidated statement of fi nancial position and transferred to profi t or loss
over the useful lives of the related assets.
Government grants that are receivable as compensation for expenses or losses already incurred or for the purpose of
giving immediate fi nancial support to the Group with no future related costs are recognised in profi t or loss in the period
in which they become receivable.
Retirement benefi t costs
Payments to state-managed retirement benefi t schemes are recognised as an expense when employees have rendered
service entitling them to the contributions.
Short-term employee benefi ts
Short-term employee benefi ts are recognised at the undiscounted amount of the benefi ts expected to be paid as and
when employees rendered the services. All short-term employee benefi ts are recognised as an expense unless another
IFRS requires or permits the inclusion of the benefi t in the cost of an asset.
A liability is recognised for benefi ts accruing to employees (such as wages and salaries, annual leave and sick leave)
after deducting any amount already paid.
Share-based payment transactions of the Company
Equity-settled share-based payments to employees and others providing similar services are measured at the fair value
of the equity instruments at the grant date. The fair value determined at the grant date of the equity-settled share-
based payments is expensed on a straight-line basis over the vesting period, based on the Group’s estimate of equity
instruments that will eventually vest, with a corresponding increase in equity.

144 Red Star Macalline Group Corporation Ltd.
Notes to the Consolidated Financial StatementsFor the year ended 31 December 2016
4. SUMMARY OF SIGNIFICANT ACCOUNTING POLICIES (continued)
Share-based payment transactions of the Company (continued)
At the end of the reporting period, the Group revises its estimate of the number of equity instruments expected to
vest. The impact of the revision of the original estimates, if any, is recognised in profi t or loss such that the cumulative
expense refl ects the revised estimate, with a corresponding adjustment to share options reserve.
For share options that vest immediately at the date of grant, the fair value of the share options granted is expensed
immediately to profi t or loss.
Taxation
Income tax expense represents the sum of the tax currently payable and deferred tax.
Current tax
The tax currently payable is based on taxable profi t for the year. Taxable profi t differs from profi t as reported in the
consolidated statement of profi t or loss and other comprehensive income because it excludes items of income or
expense that are taxable or deductible in other years and it further excludes items that are never taxable or deductible.
The Group’s liability for current tax is calculated using tax rates that have been enacted or substantively enacted by the
end of the reporting period.
Deferred tax
Deferred tax is recognised on temporary differences between the carrying amounts of assets and liabilities in the
consolidated fi nancial statements and the corresponding tax base used in the computation of taxable profi t. Deferred
tax liabilities are generally recognised for all taxable temporary differences. Deferred tax assets are generally recognised
for all deductible temporary difference to the extent that it is probable that taxable profi ts will be available against which
those deductible temporary differences can be utilised. Such assets and liabilities are not recognised if the temporary
difference arises from goodwill or from the initial recognition (other than in a business combination) of other assets and
liabilities in a transaction that affects neither the taxable profi t nor the accounting profi t.
Deferred tax liabilities are recognised for taxable temporary differences associated with investments in subsidiaries,
associates and interests in joint arrangements, except where the Group is able to control the reversal of the temporary
difference and it is probable that the temporary difference will not reverse in the foreseeable future. Deferred tax assets
arising from deductible temporary differences associated with such investments and interests are only recognised to the
extent that it is probable that there will be suffi cient taxable profi ts against which to utilise the benefi ts of the temporary
differences and they are expected to reverse in the foreseeable future.

145Annual Report 2016
Notes to the Consolidated Financial StatementsFor the year ended 31 December 2016
4. SUMMARY OF SIGNIFICANT ACCOUNTING POLICIES (continued)
Taxation (continued)
Deferred tax (continued)
The carrying amount of deferred tax assets is reviewed at the end of the reporting period and reduced to the extent that
it is no longer probable that suffi cient taxable profi ts will be available to allow all or part of the asset to be recovered.
Deferred tax assets and liabilities are measured at the tax rates that are expected to apply in the period in which the
liability is settled or the asset is realised, based on tax rates (and tax laws) that have been enacted or substantively
enacted by the end of the reporting period.
The measurement of deferred tax liabilities and assets refl ects the tax consequences that would follow from the manner
in which the Group expects, at the end of the reporting period, to recover or settle the carrying amount of its assets and
liabilities.
Current and deferred tax is recognised in profi t or loss, except when it relates to items that are recognised in other
comprehensive income or directly in equity, in which case, the current and deferred tax are also recognised in other
comprehensive income or directly in equity respectively. Where current tax or deferred tax arises from the initial
accounting for a business combination, the tax effect is included in the accounting for the business combination.
Property, plant and equipment
Property, plant and equipment including buildings held for use in the production or supply of goods or services, or
for administrative purposes (other than properties under construction as described below) are stated at cost less
subsequent accumulated depreciation and accumulated impairment losses, if any.
Properties in the course of construction for production, supply or administrative purposes are carried at cost, less any
recognised impairment loss. Costs include professional fees and, for qualifying assets, borrowing costs capitalised in
accordance with the Group’s accounting policy. Such properties are classifi ed to the appropriate categories of property,
plant and equipment when completed and ready for intended use. Depreciation of these assets, on the same basis as
other property assets, commences when the assets are ready for their intended use.
Depreciation is recognised so as to write off the cost of items of property, plant and equipment other than properties
under construction less their residual values over their estimated useful lives, using the straight-line method. The
estimated useful lives, residual values and depreciation method are reviewed at the end of the reporting period, with the
effect of any changes in estimate accounted for on a prospective basis.

146 Red Star Macalline Group Corporation Ltd.
Notes to the Consolidated Financial StatementsFor the year ended 31 December 2016
4. SUMMARY OF SIGNIFICANT ACCOUNTING POLICIES (continued)
Property, plant and equipment (continued)
Assets held under fi nance leases are depreciated over their expected useful lives on the same basis as owned assets.
However, when there is no reasonable certainty that ownership will be obtained by the end of the lease term, assets are
depreciated over the shorter of the lease term and their useful lives.
An item of property, plant and equipment is derecognised upon disposal or when no future economic benefi ts are
expected to arise from the continued use of the asset. Any gain or loss arising on the disposal or retirement of an item
of property, plant and equipment is determined as the difference between the sales proceeds and the carrying amount
of the asset and is recognised in profi t or loss.
Buildings under development for future owner-occupied purpose
When buildings are in the course of development for production or for administrative purposes, the amortisation
of prepaid lease payments provided during the construction period is included as part of costs of buildings under
construction. Buildings under construction are carried at cost, less any identifi ed impairment losses. Depreciation of
buildings commences when they are available for use (i.e. when they are in the location and condition necessary for
them to be capable of operating in the manner intended by management).
Investment properties
Investment properties are properties held to earn rentals and/or for capital appreciation (including properties under
construction for such purposes).
Investment properties are initially measured at cost, including any directly attributable expenditure. Subsequent to initial
recognition, investment properties are measured at their fair values. Gains or losses arising from changes in the fair
value of investment properties are included in profi t or loss for the period in which they arise.
Construction costs incurred for investment properties under construction are capitalised as part of the carrying amount
of the investment properties under construction
An investment property is derecognised upon disposal or when the investment property is permanently withdrawn
from use and no future economic benefi ts are expected from its disposals. Any gain or loss arising on derecognition of
the property (calculated as the difference between the net disposal proceeds and the carrying amount of the asset) is
included in profi t or loss in the period in which the property is derecognised.

147Annual Report 2016
Notes to the Consolidated Financial StatementsFor the year ended 31 December 2016
4. SUMMARY OF SIGNIFICANT ACCOUNTING POLICIES (continued)
Intangible assets
Intangible assets acquired separately
Intangible assets acquired separately and with fi nite useful lives are carried at costs less accumulated amortisation and
any accumulated impairment losses. Amortisation for intangible assets with fi nite useful lives is provided on a straight-
line basis over their estimated useful lives. The estimated useful life and amortisation method are reviewed at the end of
the reporting period, with the effect of any changes in estimate being accounted for on a prospective basis.
An intangible asset is derecognised on disposal, or when no future economic benefi ts are expected from use or
disposal. Gains and losses arising from derecognition of an intangible asset, measured as the difference between
the net disposal proceeds and the carrying amount of the asset, are recognised in profi t or loss when the asset is
derecognised.
Internally-generated intangible assets — research and development expenditure
Expenditure on research activities is recognised as an expense in the period in which it is incurred. An internally-
generated intangible asset arising from development activities (or from the development phase of an internal project) is
recognised if, and only if, all of the following have been demonstrated:
• the technical feasibility of completing the intangible asset so that it will be available for use or sale;
• the intention to complete the intangible asset and use or sell it;
• the ability to use or sell the intangible asset;
• how the intangible asset will generate probable future economic benefi ts;
• the availability of adequate technical, fi nancial and other resources to complete the development and to use or sell
the intangible asset; and
• the ability to measure reliably the expenditure attributable to the intangible asset during its development.

148 Red Star Macalline Group Corporation Ltd.
Notes to the Consolidated Financial StatementsFor the year ended 31 December 2016
4. SUMMARY OF SIGNIFICANT ACCOUNTING POLICIES (continued)
Intangible assets (continued)
Internally-generated intangible assets — research and development expenditure (continued)
The amount initially recognised for internally-generated intangible asset is the sum of the expenditure incurred from the
date when the intangible asset fi rst meets the recognition criteria listed above. Where no internally-generated intangible
asset can be recognised, development expenditure is recognised in profi t or loss in the period in which it is incurred.
Subsequent to initial recognition, internally-generated intangible assets are reported at cost less accumulated
amortisation and accumulated impairment losses (if any), on the same basis as intangible assets that are acquired
separately.
Impairment of tangible and intangible assets other than goodwill
At the end of the reporting period, the Group reviews the carrying amounts of its tangible and intangible assets with
fi nite useful lives to determine whether there is any indication that those assets have suffered an impairment loss. If
any such indication exists, the recoverable amount of the asset is estimated in order to determine the extent of the
impairment loss (if any). When it is not possible to estimate the recoverable amount of an individual asset, the Group
estimates the recoverable amount of the cash-generating unit to which the asset belongs. When a reasonable and
consistent basis of allocation can be identifi ed, corporate assets are also allocated to individual cash-generating units,
or otherwise they are allocated to the smallest group of cash-generating units for which a reasonable and consistent
allocation basis can be identifi ed.
Recoverable amount is the higher of fair value less costs of disposal and value in use. In assessing value in use, the
estimated future cash fl ows are discounted to their present value using a pre-tax discount rate that refl ects current
market assessments of the time value of money and the risks specifi c to the asset for which the estimates of future cash
fl ows have not been adjusted.
If the recoverable amount of an asset (or a cash-generating unit) is estimated to be less than its carrying amount, the
carrying amount of the asset (or the cash-generating unit) is reduced to its recoverable amount. An impairment loss is
recognised immediately in profi t or loss.
When an impairment loss subsequently reverses, the carrying amount of the asset (or cash-generating unit) is increased
to the revised estimate of its recoverable amount, but so that the increased carrying amount does not exceed the
carrying amount that would have been determined had no impairment loss been recognised for the asset (or cash-
generating unit) in prior years. A reversal of an impairment loss is recognised immediately in profi t or loss.

149Annual Report 2016
Notes to the Consolidated Financial StatementsFor the year ended 31 December 2016
4. SUMMARY OF SIGNIFICANT ACCOUNTING POLICIES (continued)
Inventories
Inventories are stated at the lower of cost and net realisable value. Cost is calculated using the standard cost method.
Net realisable value represents the estimated selling price for inventories less all estimated costs of completion and
costs necessary to make the sale.
Provisions
Provisions are recognised when the Group has a present obligation (legal or constructive) as a result of a past event, it
is probable that the Group will be required to settle the obligation, and a reliable estimate can be made of the amount of
the obligation.
The amount recognised as a provision is the best estimate of the consideration required to settle the present obligation
at the end of the reporting period, taking into account the risks and uncertainties surrounding the obligation. When a
provision is measured using the cash fl ows estimated to settle the present obligation, its carrying amount is the present
value of those cash fl ows (where the effect of the time value of money is material).
When some or all of the economic benefi ts required to settle a provision are expected to be recovered from a third
party, a receivable is recognised as an asset if it is virtually certain that reimbursement will be received and the amount
of the receivable can be measured reliably.
Financial instruments
Financial assets and fi nancial liabilities are recognised when a group entity becomes a party to the contractual
provisions of the instrument.
Financial assets and fi nancial liabilities are initially measured at fair value. Transaction costs that are directly attributable
to the acquisition or issue of fi nancial assets and fi nancial liabilities (other than fi nancial assets and fi nancial liabilities at
fair value through profi t or loss (“FVTPL”)) are added to or deducted from the fair value of the fi nancial assets or fi nancial
liabilities, as appropriate, on initial recognition. Transaction costs directly attributable to the acquisition of fi nancial
assets or fi nancial liabilities at fair value through profi t or loss are recognised immediately in profi t or loss.

150 Red Star Macalline Group Corporation Ltd.
Notes to the Consolidated Financial StatementsFor the year ended 31 December 2016
4. SUMMARY OF SIGNIFICANT ACCOUNTING POLICIES (continued)
Financial instruments (continued)
Financial assets
The Group’s fi nancial assets are classifi ed into available-for-sale fi nancial assets and loans and receivables. The
classifi cation depends on the nature and purpose of the fi nancial assets and is determined at the time of initial
recognition. All regular way purchases or sales of fi nancial assets are recognised and derecognised on a trade date
basis. Regular way purchases or sales are purchases or sale of fi nancial assets that require delivery of assets within the
time frame established by regulation or convention in the market place.
Effective interest method
The effective interest method is a method of calculating the amortised cost of a fi nancial asset and of allocating interest
income over the relevant period. The effective interest rate is the rate that exactly discounts estimated future cash
receipts (including all fees paid or received that form an integral part of the effective interest rate, transaction costs and
other premiums or discounts) through the expected life of the fi nancial asset, or, where appropriate, a shorter period to
the net carrying amount on initial recognition.
Interest income is recognised on an effective interest basis for debt instruments other than those fi nancial assets
classifi ed as at FVTPL.
Loans and receivables
Loans and receivables are non-derivative fi nancial assets with fi xed or determinable payments that are not quoted in an
active market. Loans and receivables (including loan receivables, other non-current assets, trade and other receivables,
restricted bank deposits, and bank balances and cash) are measured at amortised cost using the effective interest
method, less any impairment.
Interest income is recognised by applying the effective interest rate, except for short-term receivables where the
recognition of interest would be immaterial.
Available-for-sale fi nancial assets
Available-for-sale fi nancial assets are non-derivatives that are either designated or not classifi ed as fi nancial assets at
FVTPL, loans and receivables or held-to-maturity investments.

151Annual Report 2016
Notes to the Consolidated Financial StatementsFor the year ended 31 December 2016
4. SUMMARY OF SIGNIFICANT ACCOUNTING POLICIES (continued)
Financial instruments (continued)
Financial assets (continued)
Available-for-sale fi nancial assets (continued)
Available-for-sale equity investments that do not have a quoted market price in an active market and whose fair value
cannot be reliably measured and derivatives that are linked to and must be settled by delivery of such unquoted equity
instruments, they are measured at cost less any identifi ed impairment losses at the end of each reporting period (see
accounting policy on impairment loss on fi nancial assets below).
Dividends on available-for-sale equity instruments are recognised in profi t or loss when the Group’s right to receive the
dividends is established.
Impairment of fi nancial assets
Financial assets, other than those at FVTPL, are assessed for indicators of impairment at the end of the reporting
period. Financial assets are considered to be impaired where there is objective evidence that, as a result of one or more
events that occurred after the initial recognition of the fi nancial assets, the estimated future cash fl ows of the fi nancial
assets have been affected.
For an AFS equity investment, a signifi cant or prolonged decline in the fair value of that investment below its cost is
considered to be objective evidence of impairment.
For all other fi nancial assets, objective evidence of impairment could include:
• signifi cant fi nancial diffi culty of the issuer or counterparty; or
• breach of contract, such as default or delinquency in interest or principal payments; or
• it becoming probable that the borrower will enter bankruptcy or fi nancial re-organisation.
For certain categories of fi nancial assets, such as trade receivables, assets are assessed for impairment on a collective
basis even if they were assessed not to be impaired individually. Objective evidence of impairment for a portfolio of
receivables could include the Group’s past experience of collecting payments, an increase in the number of delayed
payments in the portfolio past the average credit period, as well as observable changes in national or local economic
conditions that correlate with default on receivables.

152 Red Star Macalline Group Corporation Ltd.
Notes to the Consolidated Financial StatementsFor the year ended 31 December 2016
4. SUMMARY OF SIGNIFICANT ACCOUNTING POLICIES (continued)
Financial instruments (continued)
Financial assets (continued)
Impairment of fi nancial assets (continued)
For fi nancial assets carried at amortised cost, the amount of impairment loss recognised is the difference between the
asset’s carrying amount and the present value of the estimated future cash fl ows discounted at the fi nancial asset’s
original effective interest rate.
For fi nancial assets carried at cost, the amount of the impairment loss is measured as the difference between the
asset’s carrying amount and the present value of the estimated future cash fl ows discounted at the current market
rate of return for a similar fi nancial asset. Such impairment loss will not be reversed in subsequent periods (see the
accounting policy below).
The carrying amount of the fi nancial asset is reduced by the impairment loss directly for all fi nancial assets with the
exception of trade and other receivables, where the carrying amount is reduced through the use of an allowance
account. Changes in the carrying amount of the allowance account are recognised in profi t or loss. When a receivable
is considered uncollectible, it is written off against the allowance account. Subsequent recoveries of amounts previously
written off are credited to profi t or loss.
When an available-for-sale fi nancial asset is considered to be impaired, cumulative gains or losses previously
recognised in other comprehensive income are reclassifi ed to profi t or loss in the period.
For fi nancial assets measured at amortised cost, if, in a subsequent period, the amount of the impairment loss
decreases and the decrease can be related objectively to an event occurring after the impairment was recognised, the
previously recognised impairment loss is reversed through profi t or loss to the extent that the carrying amount of the
investment at the date the impairment is reversed does not exceed what the amortised cost would have been had the
impairment not been recognised.
In respect of available-for-sale equity securities, impairment losses previously recognised in profi t or loss are not
reversed through profi t or loss. Any increase in fair value subsequent to an impairment loss is recognised in other
comprehensive income and accumulated under the heading of investments revaluation reserve. In respect of available-
for-sale debt securities, impairment losses are subsequently reversed through profi t or loss if an increase in the fair value
of the investment can be objectively related to an event occurring after the recognition of the impairment loss.

153Annual Report 2016
Notes to the Consolidated Financial StatementsFor the year ended 31 December 2016
4. SUMMARY OF SIGNIFICANT ACCOUNTING POLICIES (continued)
Financial instruments (continued)
Financial liabilities and equity instruments
Classifi cation as debt or equity
Debt and equity instruments issued by a group entity are classifi ed as either fi nancial liabilities or as equity in
accordance with the substance of the contractual arrangements and the defi nitions of a fi nancial liability and an equity
instrument.
Equity instruments
An equity instrument is any contract that evidences a residual interest in the assets of an entity after deducting all of its
liabilities. Equity instruments issued by a group entity are recognised at the proceeds received, net of direct issue costs.
Financial liabilities
Financial liabilities including trade and other payables, bank and other borrowings, bonds, obligations under fi nance
leases and other non-current liabilities are subsequently measured at amortised cost, using the effective interest
method.
Effective interest method
The effective interest method is a method of calculating the amortised cost of a fi nancial liability and of allocating
interest expense over the relevant period. The effective interest rate is the rate that exactly discounts estimated future
cash payments through the expected life of the fi nancial liability, or, where appropriate, a shorter period, to the net
carrying amount on initial recognition. Interest expense is recognised on an effective interest basis.
Financial guarantee contracts
A fi nancial guarantee contract is a contract that requires the issuer to make specifi ed payments to reimburse the holder
for a loss it incurs because a specifi ed debtor fails to make payment when due in accordance with the terms of a debt
instrument.

154 Red Star Macalline Group Corporation Ltd.
Notes to the Consolidated Financial StatementsFor the year ended 31 December 2016
4. SUMMARY OF SIGNIFICANT ACCOUNTING POLICIES (continued)
Financial instruments (continued)
Financial liabilities and equity instruments (continued)
Financial guarantee contracts (continued)
Financial guarantee contracts issued by the Group are initially measured at their fair values and, if not designated as at
FVTPL, are subsequently measured at the higher of:
(i) the amount of obligation under the contract, as determined in accordance with IAS 37; and
(ii) the amount initially recognised less, where appropriate, cumulative amortisation over the guarantee period
Derecognition
The Group derecognises a fi nancial asset only when the contractual rights to the cash fl ows from the asset expire, or
when it transfers the fi nancial asset and substantially all the risks and rewards of ownership of the asset to another
entity. If the Group neither transfers nor retains substantially all the risks and rewards of ownership and continues to
control the transferred asset, the Group continues to recognise the asset to the extent of its continuing involvement
and recognises an associated liability. If the Group retains substantially all the risks and rewards of ownership of a
transferred fi nancial asset, the Group continues to recognise the fi nancial asset and also recognises a collateralized
borrowing for the proceeds received.
On derecognition of a fi nancial asset in its entirety, the difference between the asset’s carrying amount and the
sum of the consideration received and receivable and the cumulative gain or loss that had been recognised in other
comprehensive income and accumulated in equity is recognised in profi t or loss.
155Annual Report 2016
Notes to the Consolidated Financial StatementsFor the year ended 31 December 2016
5. CRITICAL ACCOUNTING JUDGEMENTS AND KEY SOURCES OF ESTIMATION UNCERTAINTY
In the process of applying the Group’s accounting policies, which are described in note 4, the directors of the Company
are required to make judgments, estimates and assumptions about the carrying amounts of assets and liabilities
that are not readily apparent from other sources. The estimates and associated assumptions are based on historical
experience and other factors that are considered to be relevant. Actual results may differ from these estimates.
The estimates and underlying assumptions are reviewed on an ongoing basis. Revisions to accounting estimates are
recognised in the period in which the estimate is revised if the revision affects only that period, or in the period of the
revision and future periods if the revision affects both current and future periods.
Critical judgements in applying the entity’s accounting policies
The following are the critical judgements, apart from those involving estimations (see below), that the directors of the
Company have made in the process of applying the entity’s accounting policies and that have the most signifi cant effect
on the amounts recognised in fi nancial statements.
Revenue recognition — Initiation and entrance fees
The Group enters into contract management arrangements with its partners to manage their shopping malls under the
Group’s brand name. The Group usually charge its partners initiation and entrance fees. The directors of the Company
were required to consider when it is appropriate to recognise the revenue from initiation and entrance fees.

156 Red Star Macalline Group Corporation Ltd.
Notes to the Consolidated Financial StatementsFor the year ended 31 December 2016
5. CRITICAL ACCOUNTING JUDGEMENTS AND KEY SOURCES OF ESTIMATION UNCERTAINTY (continued)
Critical judgements in applying the entity’s accounting policies (continued)
Revenue recognition — Initiation and entrance fees (continued)
In making their judgment, the directors of the Company considered the detailed criteria for the recognition of revenue
set out in IAS 18. As the initiation and entrance fees permits only initiation, and all other services or products are paid
for separately, and there is a separate annual management fee, the directors of the Company are satisfi ed that initiation
and entrance fees are recognised as revenue when no signifi cant uncertainty as to its collectability exists.
Deferred taxation on investment properties
For the purposes of measuring deferred tax arising from investment properties that are measured using the fair value
model under IAS 40 amounting to RMB77,090,000,000 as at 31 December 2016 (2015: RMB70,593,000,000), the
directors of the Company concluded that the Group’s investment properties are held under a business model whose
objective is to consume substantially all of the economic benefi ts embodied in the investment properties over time.
Therefore, in determining the Group’s deferred tax on investment properties, the directors of the Company have
determined that the presumption that investment properties measured using the fair value model are recovered through
sale is rebutted and the Group estimated the deferred tax on the basis of recovering through use.
Key sources of estimation uncertainty
The following are the key assumptions concerning the future, and other key sources of estimation uncertainty at the end
of the reporting period, which may have a signifi cant risk of causing a material adjustment to the carrying amounts of
assets and liabilities within the next twelve months from the end of the reporting period.

157Annual Report 2016
Notes to the Consolidated Financial StatementsFor the year ended 31 December 2016
5. CRITICAL ACCOUNTING JUDGEMENTS AND KEY SOURCES OF ESTIMATION UNCERTAINTY (continued)
Key sources of estimation uncertainty (continued)
Trade and other receivables
The Group makes allowances for bad and doubtful debts based on an assessment of the recoverability of trade and
other receivables. In determining whether there is objective evidence of allowance for bad and doubtful debts, the
Group takes into consideration the collectability, aged analysis of trade and other receivables and estimation of future
cash fl ows. The amount of the allowance for bad and doubtful debts is measured as the difference between the asset’s
carrying amount and the present value of estimated future cash fl ows. Where the actual future cash fl ows are less than
expected, an allowance for bad and doubtful debts may arise.
The carrying amount of trade and other receivables of the Group is RMB2,008,532,000, which is after allowance for bad
and doubtful debts as at 31 December 2016 (2015: RMB1,627,561,000).
Intangible assets
The intangible assets are amortised on a straight-line basis over estimated useful lives. The management assessed the
estimated useful lives of intangible assets annually.
In addition, the management considers the potential impairment based on the recoverable amount. The intangible
assets with fi nite useful lives are reviewed for impairment when events or circumstances indicate the carrying value may
not be recoverable. Factors that would indicate potential impairment may include, but are not limited to, the signifi cant
change in technology, and operating or cash fl ow losses associated with the intangible assets.
Determining whether intangible assets is impaired requires an estimation of the recoverable amount of the cash-
generating units (“CGUs”) to which intangible assets has been allocated. The recoverable amount of CGUs at the end of
the reporting period is based on the value in use calculation which requires the management of the Group to estimate
the future cash fl ows expected to arise from the CGUs and a suitable discount rate in order to calculate the present
value. Where the actual future cash fl ows are less than expected, a material impairment loss may arise.

158 Red Star Macalline Group Corporation Ltd.
Notes to the Consolidated Financial StatementsFor the year ended 31 December 2016
5. CRITICAL ACCOUNTING JUDGEMENTS AND KEY SOURCES OF ESTIMATION UNCERTAINTY (continued)
Key sources of estimation uncertainty (continued)
Intangible assets (continued)
The carrying amount of intangible assets of the Group is RMB467,822,000, which is after impairment as at 31
December 2016 (2015: RMB539,267,000).
Investment properties
Investment properties of RMB77,090,000,000 as at 31 December 2016 (2015: RMB70,593,000,000) are stated at fair
values based on the valuation performed by independent professional valuers. In determining the fair values, the valuers
have based on a method of valuation which involves certain estimates of market condition. In relying on the valuation
report, the directors of the Company have exercised their judgment and are satisfi ed that the assumptions used in the
valuation are refl ective of the current market conditions. Changes to these assumptions would result in changes in the
fair values of the Group’s investment properties and the corresponding adjustments to the amount of fair value gain or
loss reported in profi t or loss.
Property, plant and equipment
The management determines the estimated useful lives, residual values and the depreciation method in determining
the related depreciation charges for its property, plant and equipment. This estimate is based on the management’s
experience of the actual useful lives and residual values of items of property, plant and equipment of similar nature
and functions. The management will accelerate the depreciation charge where the economic useful lives are shorter
than previously estimated due to removal or closure of shopping malls. The management will also write-off or write-
down the carrying value of the items which are technically obsolete or non-strategic assets that have been abandoned.
Actual economic useful lives may differ from estimated economic useful lives. Periodic review could result in a change in
depreciation period and therefore depreciation charge in the future periods.
In addition, management assesses impairment whenever events or changes in circumstances indicate that the
carrying amount of an item of property, plant and equipment may not be recoverable. When the recoverable amounts
of property, plant and equipment differ from the original estimates, adjustment will be made and recognised in the
period in which such event takes place. The carrying amounts of property, plant and equipment as of the Group at 31
December 2016 was RMB353,592,000 (2015: RMB333,293,000).

159Annual Report 2016
Notes to the Consolidated Financial StatementsFor the year ended 31 December 2016
6. SEGMENT INFORMATION AND REVENUE
The Group is organised into business units based on their types of activities. These business units are the basis of
information that is prepared and reported to the Group’s chief operating decision maker (i.e. the Chairman of the
Company) for the purposes of resource allocation and assessment of performance. The Group’s operating segments
under IFRS 8 are identifi ed as the following four business units:
Owned/leased Portfolio Shopping Malls: this segment derives revenue from leasing fl oor areas to the tenants and
providing comprehensive and continuous operation and management support to them.
Managed Shopping Malls: this segment derives revenue from providing initiation, consultation and management
services to the Group’s partners and the construction contractors to develop and manage the shopping malls under the
Group’s own brand.
Sales of merchandise and related services: this segment derives revenue from retail sales of home furnishing
merchandise and providing related decorating services.
Other: this segment derives revenue from providing other comprehensive service to the customers, including strategy
consultation, home design consultation, construction service, internet home decoration, internet retail, as well as
logistics and delivery services.
The accounting policies applied in determining segment revenue and segment results of the operating segments are
the same as the Group’s accounting policies described in note 4. Segment profi t represents the profi t earned by each
segment without allocation of other income, changes in fair value of investment properties, other gains and losses, other
expense, share of profi ts of associates, share of results of joint ventures, fi nance costs, central administrative expenses
and income tax expenses. This is the measure reported to the Group’s chief operating decision maker for the purpose
of resource allocation and performance assessment.
No segment assets and liabilities, and other segment information are presented as they were not regularly provided to
the chief operating decision maker for the purpose of resource allocation and performance assessment.
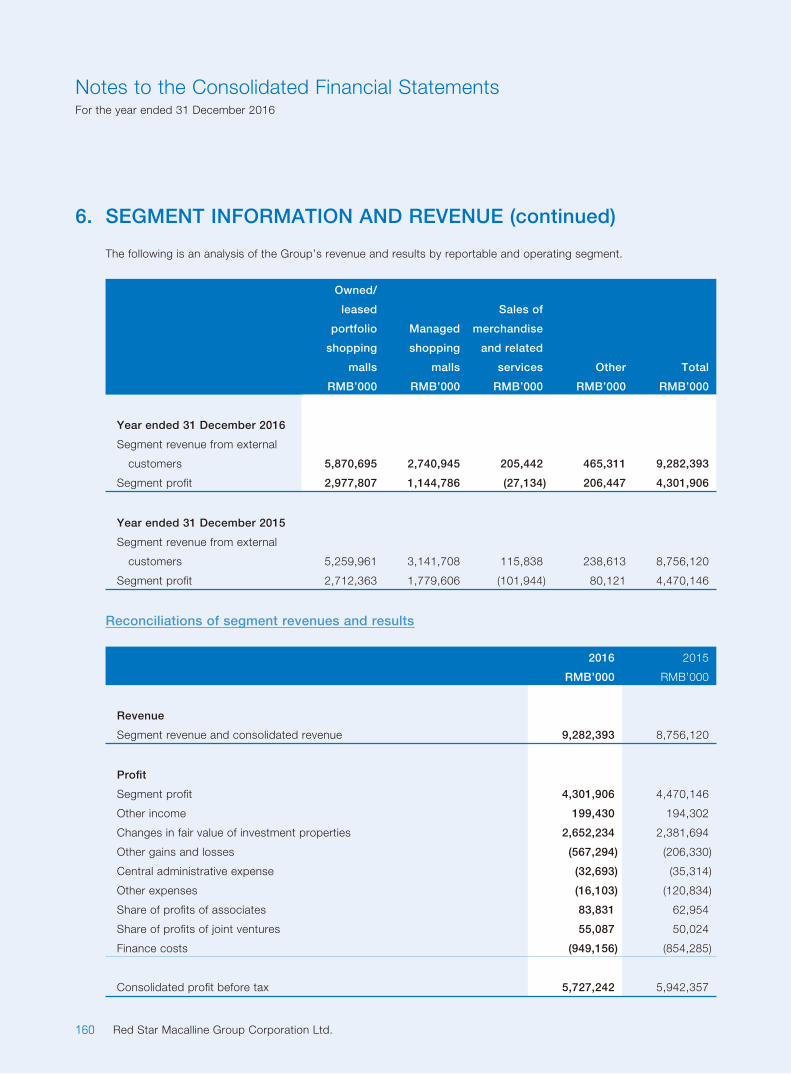
160 Red Star Macalline Group Corporation Ltd.
Notes to the Consolidated Financial StatementsFor the year ended 31 December 2016
6. SEGMENT INFORMATION AND REVENUE (continued)
The following is an analysis of the Group’s revenue and results by reportable and operating segment.
Owned/
leased
portfolio
shopping
malls
Managed
shopping
malls
Sales of
merchandise
and related
services Other Total
RMB’000 RMB’000 RMB’000 RMB’000 RMB’000
Year ended 31 December 2016
Segment revenue from external
customers 5,870,695 2,740,945 205,442 465,311 9,282,393
Segment profi t 2,977,807 1,144,786 (27,134) 206,447 4,301,906
Year ended 31 December 2015
Segment revenue from external
customers 5,259,961 3,141,708 115,838 238,613 8,756,120
Segment profi t 2,712,363 1,779,606 (101,944) 80,121 4,470,146
Reconciliations of segment revenues and results
2016 2015
RMB’000 RMB’000
Revenue
Segment revenue and consolidated revenue 9,282,393 8,756,120
Profi t
Segment profi t 4,301,906 4,470,146
Other income 199,430 194,302
Changes in fair value of investment properties 2,652,234 2,381,694
Other gains and losses (567,294) (206,330)
Central administrative expense (32,693) (35,314)
Other expenses (16,103) (120,834)
Share of profi ts of associates 83,831 62,954
Share of profi ts of joint ventures 55,087 50,024
Finance costs (949,156) (854,285)
Consolidated profi t before tax 5,727,242 5,942,357

161Annual Report 2016
Notes to the Consolidated Financial StatementsFor the year ended 31 December 2016
6. SEGMENT INFORMATION AND REVENUE (continued)
Revenue from major products and services
The following is an analysis of the Group’s revenue from external customers:
2016 2015
RMB’000 RMB’000
Revenue from own/leased portfolio shopping malls 5,870,695 5,259,961
Revenue from managed shopping malls:
— Initiation and entrance fees 1,401,718 1,409,903
— Annual management fees 1,327,764 1,268,071
— Construction consultation and management fees 11,463 463,734
2,740,945 3,141,708
Revenue from sales of merchandise and related services:
— Sales of merchandise 22,543 58,292
— Provision of related services 182,899 57,546
205,442 115,838
Others 465,311 238,613
9,282,393 8,756,120
Geographical information
All the revenue and operating results of the Group are derived from the PRC based on location of the operations. All the
Group’s non-current assets are located in PRC based on geographical location of the assets.
Revenue from major customers
No revenue from transactions with a single external customer amounted to 10% or more of the Group’s revenue during
the year.

162 Red Star Macalline Group Corporation Ltd.
Notes to the Consolidated Financial StatementsFor the year ended 31 December 2016
7. OTHER INCOME
2016 2015
RMB’000 RMB’000
Interest income on:
— bank deposits 87,792 79,492
— other loans and receivables 8,335 21,344
Total interest income 96,127 100,836
Government grants (note) 85,928 67,599
Dividends from unlisted equity investments 3,060 5,965
Compensation received and receivable 14,315 19,902
199,430 194,302
Note: The amount mainly represented the government grants received by the Group based on certain proportions of taxes actually paid by the Group.
8. OTHER GAINS AND LOSSES
2016 2015
RMB’000 RMB’000
Allowance for doubtful receivables, net (336,462) (198,599)
Impairment loss on available-for-sale equity investments (122,225) —
Impairment loss on intangible assets (100,000) —
Loss on disposal of property, plant and equipment (4,448) (441)
Loss on disposal of intangible assets (168) (2,575)
Gain on disposal of subsidiaries, net (note 41) 20 1,930
Gain on disposal of an associate — 3,969
(Loss) gain from business combination achieved in stages (8,402) 2,236
Gain from bargain purchases in business combinations (note 40) 356 1,845
Net foreign exchange losses (4,558) (953)
Others 8,593 (13,742)
(567,294) (206,330)

163Annual Report 2016
Notes to the Consolidated Financial StatementsFor the year ended 31 December 2016
9. OTHER EXPENSES
2016 2015
RMB’000 RMB’000
Donations 5,882 2,337
Compensation paid and payable (note) 124 73,087
Listing expense for H Share IPO — 45,410
Listing expense for A Share IPO 10,097 —
16,103 120,834
Note: The amount in 2015 mainly represented the compensation made to the property owners and the tenants arising from the closure of leased shopping
malls, and the compensation made by the Group as it was accused in legal actions involving the alleged default of the Group in accordance with the
terms of contract.
10. FINANCE COSTS
2016 2015
RMB’000 RMB’000
Interest on bank and other borrowings 668,620 950,851
Interest on fi nance leases 27,039 23,324
Interest on bonds 513,576 276,549
Total borrowing costs 1,209,235 1,250,724
Less: amount capitalized in the cost of qualifying assets (note) (260,079) (396,439)
949,156 854,285
Note: The weighted average capitalisation rate on funds borrowed for the year ended 31 December 2016 is 5.5% per annum.

164 Red Star Macalline Group Corporation Ltd.
Notes to the Consolidated Financial StatementsFor the year ended 31 December 2016
11. INCOME TAX EXPENSE
2016 2015
RMB’000 RMB’000
Income tax expenses comprise:
Current tax:
PRC enterprise income tax 637,295 737,550
Overprovision in prior years (8,861) (11,471)
628,434 726,079
Deferred tax — current year (note 25) 730,398 846,523
Income tax expenses 1,358,832 1,572,602
Under the Law of People’s Republic of China on Enterprise Income Tax (the “EIT Law”) and Implementation Regulation
of the EIT Law, the tax rate of the Company and its PRC subsidiaries is 25% except for certain subsidiaries of the Group
in the PRC are under the Western China Development Plan and were approved to enjoy the preferential tax rate of 15%
in accordance with the EIT LAW and relevant regulations.

165Annual Report 2016
Notes to the Consolidated Financial StatementsFor the year ended 31 December 2016
11. INCOME TAX EXPENSE (continued)
The tax charge for the year can be reconciled to the profi t before tax per consolidated statement of profi t or loss and
other comprehensive income as follows:
2016 2015
RMB’000 RMB’000
Profi t before tax 5,727,242 5,942,357
Tax at the PRC enterprise income tax rate of 25% 1,431,811 1,485,589
Tax effect of share of profi t of associates (20,958) (15,739)
Tax effect of share of profi t of joint ventures (13,772) (12,506)
Tax effect of dividends from unlisted equity investments (765) (1,491)
Tax effect of expenses that are not deductible for tax purpose (note 1) 24,623 39,181
Tax effect of debt restructure within the Group (note 2) (25,000) (51,268)
Effect of tax losses not recognised and deductible temporary differences
not recognised 85,516 160,346
Utilisation of tax losses not previously recognised (15,289) (6,862)
Effect of preferential tax rate of subsidiaries (98,473) (13,177)
Overprovision in prior year (8,861) (11,471)
1,358,832 1,572,602
Note 1: Expenses not deductible for tax purpose mainly comprised of expenses exceeding the standard allowable deduction and donations.
Note 2: Pursuant to the debt forgiveness arrangement between the Company and its certain subsidiaries, the Company would waive the debt due from
these subsidiaries. The losses arising from such debt forgiveness of the Company are tax deductible, while the gains of these subsidiaries are
not taxable as they have accumulated tax losses which were not recognised as deferred tax assets, therefore there is a decrease of income tax
expense in the consolidated fi nancial statements.
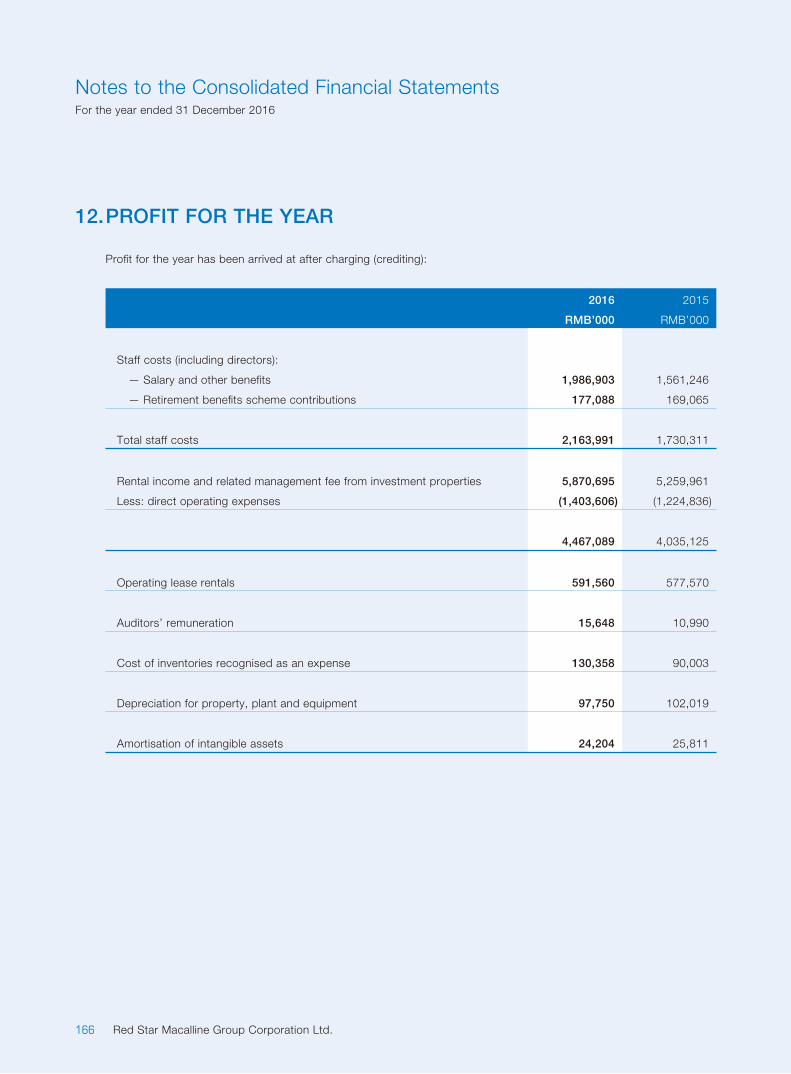
166 Red Star Macalline Group Corporation Ltd.
Notes to the Consolidated Financial StatementsFor the year ended 31 December 2016
12. PROFIT FOR THE YEAR
Profi t for the year has been arrived at after charging (crediting):
2016 2015
RMB’000 RMB’000
Staff costs (including directors):
— Salary and other benefi ts 1,986,903 1,561,246
— Retirement benefi ts scheme contributions 177,088 169,065
Total staff costs 2,163,991 1,730,311
Rental income and related management fee from investment properties 5,870,695 5,259,961
Less: direct operating expenses (1,403,606) (1,224,836)
4,467,089 4,035,125
Operating lease rentals 591,560 577,570
Auditors’ remuneration 15,648 10,990
Cost of inventories recognised as an expense 130,358 90,003
Depreciation for property, plant and equipment 97,750 102,019
Amortisation of intangible assets 24,204 25,811

167Annual Report 2016
Notes to the Consolidated Financial StatementsFor the year ended 31 December 2016
13. DIRECTORS’, CHIEF EXECUTIVE’S AND SUPERVISORS’ EMOLUMENTS
Details of the emoluments paid or payable to directors, supervisors and chief executive are as follows:
Fees
Salaries and
other benefi ts
Retirement
benefi t
scheme
contributions
Performance
related
incentive
payments Total
RMB’000 RMB’000 RMB’000 RMB’000 RMB’000
For the year ended
31 December 2016
Executive directors
Mr. Che Jianxing — 6,659 42 1,650 8,351
Ms. Zhang Qi — 6,041 42 1,500 7,583
Ms. Che Jianfang — 2,459 42 1,205 3,706
Mr. Jiang Xiaozhong — 1,859 42 3,600 5,501
— 17,018 168 7,955 25,141
The executive directors’ remuneration shown above were mainly for their services in connection with the management
of the affairs of the Company and the Group.
Fees
Salaries and
other benefi ts
Retirement
benefi t
scheme
contributions
Performance
related
incentive
payments Total
RMB’000 RMB’000 RMB’000 RMB’000 RMB’000
Non-executive directors
Ms. Chen Shuhong — 1,259 42 400 1,701
Mr. Xu Guofeng (note 1) — — — — —
Mr. Joseph Raymond Gagnon
(note 2) — — — — —
Mr. Zhang Qiqi (note 2) — — — — —
— 1,259 42 400 1,701

168 Red Star Macalline Group Corporation Ltd.
Notes to the Consolidated Financial StatementsFor the year ended 31 December 2016
13. DIRECTORS’, CHIEF EXECUTIVE’S AND SUPERVISORS’ EMOLUMENTS (continued)
The non-executive directors’ remuneration shown above were mainly for their services in connection with the
management of the affairs of the Company and the Group.
Fees
Salaries and
other benefi ts
Retirement
benefi t
scheme
contributions
Performance
related
incentive
payments Total
RMB’000 RMB’000 RMB’000 RMB’000 RMB’000
Independent non-executive
directors
Mr. Li Zhenning 600 — — — 600
Mr. Ding Yuan 800 — — — 800
Mr. Zhou Qinye
(resigned in April 2016) — — — — —
Mr. Lee Kwan Hung 600 — — — 600
Mr. Qian Shizheng
(appointed in April 2016) 450 — — — 450
2,450 — — — 2,450
The independent non-executive directors’ remuneration shown above were mainly for their services as directors of the
Company.
Fees
Salaries and
other benefi ts
Retirement
benefi t
scheme
contributions
Performance
related
incentive
payments Total
RMB’000 RMB’000 RMB’000 RMB’000 RMB’000
Supervisors
Mr. Pan Ning — 1,259 42 300 1,601
Ms. Ng Ellen Hoi Ying (note 2) — — — — —
Ms. Chao Yanping — 751 42 — 793
Mr. Chen Gang
(appointed in January 2016) — 165 — — 165
Mr. Zheng Hongtao
(appointed in January 2016) — 165 — — 165
Total — 2,340 84 300 2,724

169Annual Report 2016
Notes to the Consolidated Financial StatementsFor the year ended 31 December 2016
13. DIRECTORS’, CHIEF EXECUTIVE’S AND SUPERVISORS’ EMOLUMENTS (continued)
The supervisors’ remuneration shown above were mainly for their services in connection with the management of the
affairs of the Company and the Group.
Fees
Salaries and
other
benefi ts
Retirement
benefi t
scheme
contributions
Performance
related
incentive
payments Total
RMB’000 RMB’000 RMB’000 RMB’000 RMB’000
For the year ended
31 December 2015
Executive directors
Mr. Che Jianxing — 6,658 40 — 6,698
Ms. Zhang Qi — 6,040 40 — 6,080
Ms. Che Jianfang — 2,408 40 — 2,448
Mr. Jiang Xiaozhong — 1,858 40 — 1,898
— 16,964 160 — 17,124
The executive directors’ remuneration shown above were mainly for their services in connection with the management
of the affairs of the Company and the Group.
Fees
Salaries and
other
benefi ts
Retirement
benefi t
scheme
contributions
Performance
related
incentive
payments Total
RMB’000 RMB’000 RMB’000 RMB’000 RMB’000
Non-executive directors
Ms. Chen Shuhong — 1,258 40 — 1,298
Mr. Xu Guofeng — 2,458 40 — 2,498
Mr. Joseph Raymond Gagnon
(note 2) — — — — —
Mr. Zhang Qiqi (note 2) — — — — —
— 3,716 80 — 3,796

170 Red Star Macalline Group Corporation Ltd.
Notes to the Consolidated Financial StatementsFor the year ended 31 December 2016
13. DIRECTORS’, CHIEF EXECUTIVE’S AND SUPERVISORS’ EMOLUMENTS (continued)
The non-executive directors’ remuneration shown above were mainly for their services in connection with the
management of the affairs of the Company and the Group.
Fees
Salaries and
other
benefi ts
Retirement
benefi t
scheme
contributions
Performance
related
incentive
payments Total
RMB’000 RMB’000 RMB’000 RMB’000 RMB’000
Independent non-executive
directors
Mr. Xia Bing
(resigned in February 2015) 100 — — — 100
Mr. Li Zhenning 600 — — — 600
Mr. Ding Yuan 800 — — — 800
Mr. Zhou Qinye 600 — — — 600
Mr. Lee Kwan Hung
(appointed in February 2015) 550 — — — 550
2,650 — — — 2,650
The independent non-executive directors’ remuneration shown above were mainly for their services as directors of the
Company.
Fees
Salaries and
other
benefi ts
Retirement
benefi t
scheme
contributions
Performance
related
incentive
payments Total
RMB’000 RMB’000 RMB’000 RMB’000 RMB’000
Supervisors
Mr. Pan Ning — 1,258 40 — 1,298
Ms. Ng Ellen Hoi Ying (note 2) — — — — —
Ms. Chao Yanping — 751 40 — 791
— 2,009 80 — 2,089
Total 2,650 22,689 320 — 25,659

171Annual Report 2016
Notes to the Consolidated Financial StatementsFor the year ended 31 December 2016
13. DIRECTORS’, CHIEF EXECUTIVE’S AND SUPERVISORS’ EMOLUMENTS (continued)
The supervisors’ remuneration shown above were mainly for their services in connection with the management of the
affairs of the Company and the Group.
Note 1: The director’s emoluments were borne by a related party of the Company.
Note 2: These directors and supervisor’s emoluments were borne by one shareholder of the Company.
Mr. Che Jianxing is also the chief executive of the Company and his emolument for the role as chief executive is also
included above.
Performances bonuses were determined by the management having regard to the performance of the directors and
supervisors of the Company and the Group’s operating results.
During the year, no emoluments were paid by the Group to any director or supervisor of the Company as an inducement
to join or upon joining the Group or as compensation for loss of offi ce (2015: nil). No director or supervisor of the
Company waived any emoluments during the year (2015: nil).
14. EMPLOYEES’ EMOLUMENTS
All of the fi ve individuals with the highest emoluments in the Group were directors or supervisors of the Company for the
year ended 31 December 2015, whose emoluments are included in the disclosures above.
Of the fi ve individuals with the highest emoluments in the Group, four were directors or supervisors of the Company for
the year ended 31 December 2016, whose emoluments are included in the disclosures above. The emoluments of the
remaining one for the year ended 31 December 2016 were as follows:
2016
RMB’000
Salaries and other benefi ts 1,364
Performance related incentive payments 3,090
4,454
Performances bonuses were determined by the management having regard to the performance of this individual and the
Group’s operating results.
During the year, no emoluments were paid by the Group to this individual as an inducement to join or upon joining the
Group or as compensation for loss of offi ce (2015: nil).

172 Red Star Macalline Group Corporation Ltd.
Notes to the Consolidated Financial StatementsFor the year ended 31 December 2016
14. EMPLOYEES’ EMOLUMENTS (continued)
His emoluments is within the following bands:
2016
No. of
employees
HK$5,000,001 to HK$5,500,000 1
1
15. DIVIDENDS
2016 2015
RMB’000 RMB’000
Dividends recognised as distribution during the year
— 2015 Final (RMB0.47 per share) 1,703,241 —
— 2014 Final (RMB0.83 per share) — 2,490,000
1,703,241 2,490,000
Subsequent to the end of the reporting period, a fi nal dividend in respect of the year ended 31 December 2016 of
RMB0.42 per share has been proposed by the directors of the Company and is subject to approval by the shareholders
in the forthcoming annual general meeting.

173Annual Report 2016
Notes to the Consolidated Financial StatementsFor the year ended 31 December 2016
16. EARNINGS PER SHARE
The calculation of basic and diluted earnings per share for the year ended 31 December 2016 and 2015 is based on the
following data:
2016 2015
RMB’000 RMB’000
Earning for the purpose of basic and diluted earnings (2015: basic and diluted)
per share (profi t for the year attributable to owners of the Company) 4,036,269 4,098,068
Number of ordinary shares
(2015: weighted average number of ordinary shares)
for the purpose of basic and diluted earnings per share 3,623,917,038 3,352,560,031
No diluted earnings per share is presented for 2016 as there was no dilutive potential ordinary shares.
The computation of diluted earnings per share in 2015 does not assume the exercise of the Company’s over-allotment
options granted pursuant to the listing of the Company’s shares in the Stock Exchange as the exercise price of the
options was higher than the average market price for the shares during the outstanding period. The over-allotment
options were subsequently lapsed on 19 July 2015. The Group did not have any other dilutive potential ordinary shares
in issue during 2015.

174 Red Star Macalline Group Corporation Ltd.
Notes to the Consolidated Financial StatementsFor the year ended 31 December 2016
17. INVESTMENT PROPERTY
Completed
investment
properties
Investment
properties
under
development Total
RMB’000 RMB’000 RMB’000
Fair Value
At 1 January 2015 56,239,000 6,727,000 62,966,000
Additions 206,865 3,004,257 3,211,122
Acquisition of subsidiaries (note 40) 922,302 1,111,882 2,034,184
Transfer 2,943,000 (2,943,000) —
Change in fair value recognised
in profi t or loss 1,517,833 863,861 2,381,694
At 31 December 2015 61,829,000 8,764,000 70,593,000
Additions 679,028 2,333,957 3,012,985
Acquisition of subsidiaries (note 40) 831,781 — 831,781
Transfer 6,411,000 (6,411,000) —
Change in fair value recognised
in profi t or loss 1,971,191 681,043 2,652,234
At 31 December 2016 71,722,000 5,368,000 77,090,000
The investment properties are all situated on the land under medium-term lease in the PRC. The fair values of the
Group’s investment properties at the end of the reporting period were valued by Jones Lang LaSalle, a fi rm of
independent qualifi ed professional valuers not connected with the Group, who have appropriate qualifi cations and
recent experiences in the valuation of similar properties in the relevant locations.
The valuation of completed investment properties has been arrived at with adoption of income approach based on the
rental income of the property derived from the existing lease and achievable in the existing market with due allowance
for the reversionary income potential of the leases, which have been then capitalised to determine the market value at
an appropriate capitalisation rate.
The valuation of certain investment properties at an early development stage has been arrived at by direct comparison
approach assuming sale of the property interests in their existing state with the benefi t of immediate vacant possession
and by making reference to comparable sales transactions as available in the relevant market.

175Annual Report 2016
Notes to the Consolidated Financial StatementsFor the year ended 31 December 2016
17. INVESTMENT PROPERTY (continued)
The valuation of other investment properties under development has been arrived at with adoption of residual approach
which assumed that they will be developed and completed in accordance with the latest development proposal. In
arriving at the opinion of value, reference has been made to comparable evidence as available in the relevant market
and the valuation also take into account the accrued construction cost and professional fees relevant to the stage of
construction as at the valuation date and the remainder of the cost and fees expected to be incurred for completing the
development.
In estimating the fair value of the properties, the highest and best use of the properties is their current use.
The following table gives information about how the fair values of these investment properties are determined (in
particular, the valuation techniques and inputs used), as well as the fair value hierarchy into which the fair value
measurements are categorised based on the degree to which the inputs to the fair value measurements is observable.
At 31 December 2016
Investment properties
held by the Group
in the consolidated
statement of
fi nancial position
Fair value
hierarchy
Valuation technique(s) and
key input(s)
Signifi cant
unobservable input(s) Range
Completed investment
properties
Level 3 Income approach
The key inputs are:
Market rent per square meter
per month;
Capitalisation rate
Market rent per square meter per
month (leased fl oor area)*
RMB14.1 to RMB341
Capitalisation rate** 5.5% to 8.0%
Certain investment properties
at an early development
stage
Level 3 Direct comparison approach
The key input is:
Price of the land per square
meter
Price of the land per square
meter (gross fl oor area)***
RMB2,169 to RMB4,369
Other investment properties
under development
Level 3 Residual approach
The key inputs are:
Market rent per square meter
per month;
Capitalisation rate
Market rent per square meter per
month (leased fl oor area)*
RMB38.5 to RMB103
Capitalisation rate** 6.5% to 7.5%

176 Red Star Macalline Group Corporation Ltd.
Notes to the Consolidated Financial StatementsFor the year ended 31 December 2016
17. INVESTMENT PROPERTY (continued)
At 31 December 2015
Investment properties
held by the Group
in the consolidated
statement of
fi nancial position
Fair value
hierarchy
Valuation technique(s) and
key input(s)
Signifi cant
unobservable input(s) Range
Completed investment
properties
Level 3 Income approach
The key inputs are: Market rent per
square meter per month;
Capitalisation rate
Market rent per square meter per
month (leased fl oor area)*
RMB31 to RMB327
Capitalisation rate** 5.5% to 8.0%
Certain investment properties
at an early development stage
Level 3 Direct comparison approach
The key input is:
Price of the land per square meter
Price of the land per square meter
(gross fl oor area)***
RMB1,323 to RMB5,110
Other investment properties
under development
Level 3 Residual approach
The key inputs are:
Market rent per square meter per
month;
Capitalisation rate
Market rent per square meter per
month (leased fl oor area)*
RMB38 to RMB101
Capitalisation rate** 6.5% to 7.5%
* A slight increase in the market rent per square meter per month (leased fl oor area) used would result in a signifi cant increase in the fair value
measurement of the investment properties, and vice versa.
** A slight increase in the capitalisation rate used would result in a signifi cant decrease in the fair value measurement of the investment properties, and
vice versa.
*** A slight increase in the price of the land per square meter (gross fl oor area) used would result in a signifi cant increase in the fair value measurement
of the investment properties, and vice versa.
There were no transfers into or out of Level 3 during the year.
In estimating the fair value of the investment properties, the Group uses market observable data to the extent it
is available. The management of the Group works closely with the valuers to establish the appropriate valuation
techniques and inputs to the model.

177Annual Report 2016
Notes to the Consolidated Financial StatementsFor the year ended 31 December 2016
17. INVESTMENT PROPERTY (continued)
The unrealised gain on property revaluation amounting to RMB2,652,234,000 was recognised in profi t or loss during the
current year (2015: RMB2,381,694,000).
The Group has pledged investment properties of approximately RMB54,814,000,000 and RMB45,009,000,000 at 31
December 2016 and 2015, respectively. to secure bank and other borrowing granted to the Group as set out in note
32.
The Group was in process of obtaining the relevant ownership property certifi cates for the investment properties under
development with carrying amounts of RMB13,309,000,000 and RMB8,779,000,000 as at 31 December 2016 and
2015, respectively. In the opinion of the directors of the Company, the relevant property ownership certifi cates can be
obtained in due time without incurring signifi cant costs.
The Group has not fully obtained the relevant land use right certifi cates and ownership property certifi cates for
investment properties in respect of the transferred shopping malls held by each of 雲南紅星美凱龍置業有限公
司 Yunnan Red Star Macalline Property Company Limited (“Yunnan Property”) and 大連紅星美凱龍投資發展有限
公司 Dalian Red Star Macalline Investment Development Company Limited (“Dalian Investment”), which amounted
to RMB2,280,000,000 as at 31 December 2016 (2015: RMB2,223,000,000). In the opinion of the directors of the
Company, the relevant land use right certifi cates and property ownership certifi cates can be fully obtained in due time
without incurring signifi cant costs.
Save the transferred shopping malls as disclosed above, the Group has not obtained relevant land use right certifi cates
and ownership property certifi cates for certain investment properties, of which the relevant certifi cates are held by
上海紅星美凱龍企業發展有限公司 Shanghai Red Star Macalline Enterprise Development Company Limited (“RSM
Enterprise Development”) and its subsidiaries, joint ventures and associates (collectively refer to as “RSM Enterprise
Development Group”), amounting to RMB1,660,000,000 as at 31 December 2016 (2015: RMB1,548,000,000).
One shopping mall was situated on the land which is for scientifi c research and design use. The carrying amount of
the investment property in respect of this shopping mall was RMB1,645,000,000 as at 31 December 2016 (2015:
RMB1,675,000,000).
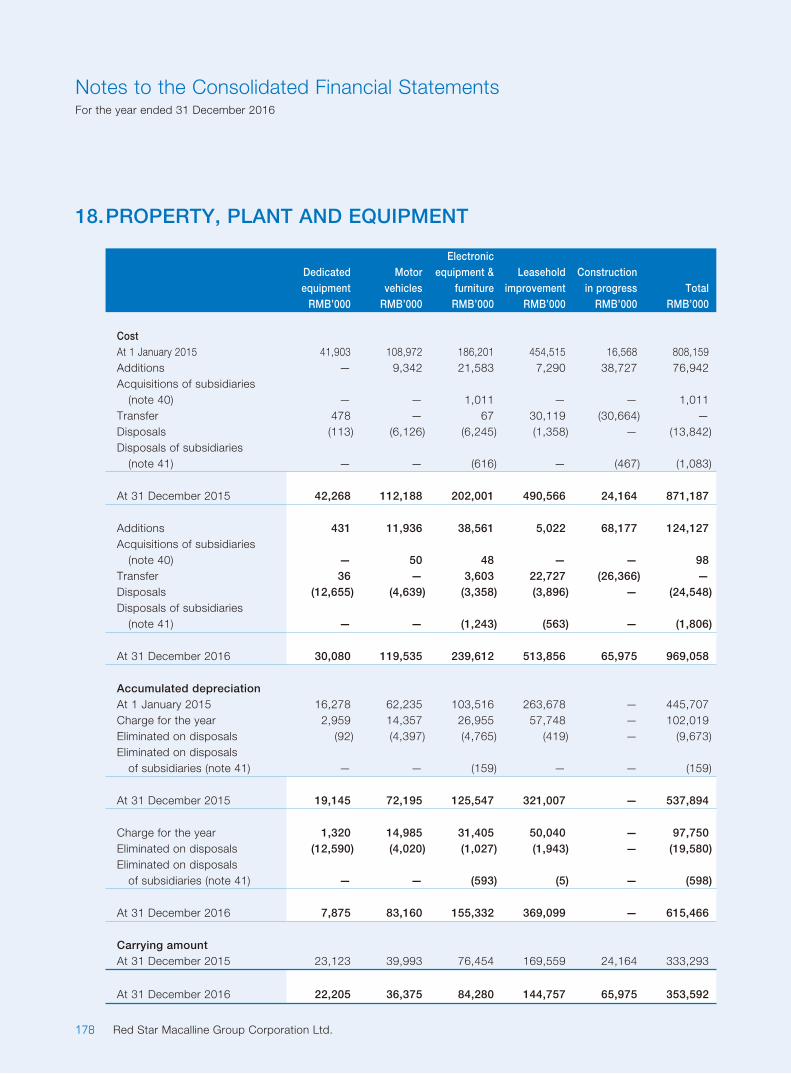
178 Red Star Macalline Group Corporation Ltd.
Notes to the Consolidated Financial StatementsFor the year ended 31 December 2016
18. PROPERTY, PLANT AND EQUIPMENT
Dedicatedequipment
Motorvehicles
Electronicequipment &
furnitureLeasehold
improvementConstruction
in progress TotalRMB’000 RMB’000 RMB’000 RMB’000 RMB’000 RMB’000
CostAt 1 January 2015 41,903 108,972 186,201 454,515 16,568 808,159Additions — 9,342 21,583 7,290 38,727 76,942Acquisitions of subsidiaries (note 40) — — 1,011 — — 1,011Transfer 478 — 67 30,119 (30,664) —Disposals (113) (6,126) (6,245) (1,358) — (13,842)Disposals of subsidiaries (note 41) — — (616) — (467) (1,083)
At 31 December 2015 42,268 112,188 202,001 490,566 24,164 871,187
Additions 431 11,936 38,561 5,022 68,177 124,127Acquisitions of subsidiaries (note 40) — 50 48 — — 98Transfer 36 — 3,603 22,727 (26,366) —Disposals (12,655) (4,639) (3,358) (3,896) — (24,548)Disposals of subsidiaries (note 41) — — (1,243) (563) — (1,806)
At 31 December 2016 30,080 119,535 239,612 513,856 65,975 969,058
Accumulated depreciationAt 1 January 2015 16,278 62,235 103,516 263,678 — 445,707Charge for the year 2,959 14,357 26,955 57,748 — 102,019Eliminated on disposals (92) (4,397) (4,765) (419) — (9,673)Eliminated on disposals of subsidiaries (note 41) — — (159) — — (159)
At 31 December 2015 19,145 72,195 125,547 321,007 — 537,894
Charge for the year 1,320 14,985 31,405 50,040 — 97,750Eliminated on disposals (12,590) (4,020) (1,027) (1,943) — (19,580)Eliminated on disposals of subsidiaries (note 41) — — (593) (5) — (598)
At 31 December 2016 7,875 83,160 155,332 369,099 — 615,466
Carrying amountAt 31 December 2015 23,123 39,993 76,454 169,559 24,164 333,293
At 31 December 2016 22,205 36,375 84,280 144,757 65,975 353,592
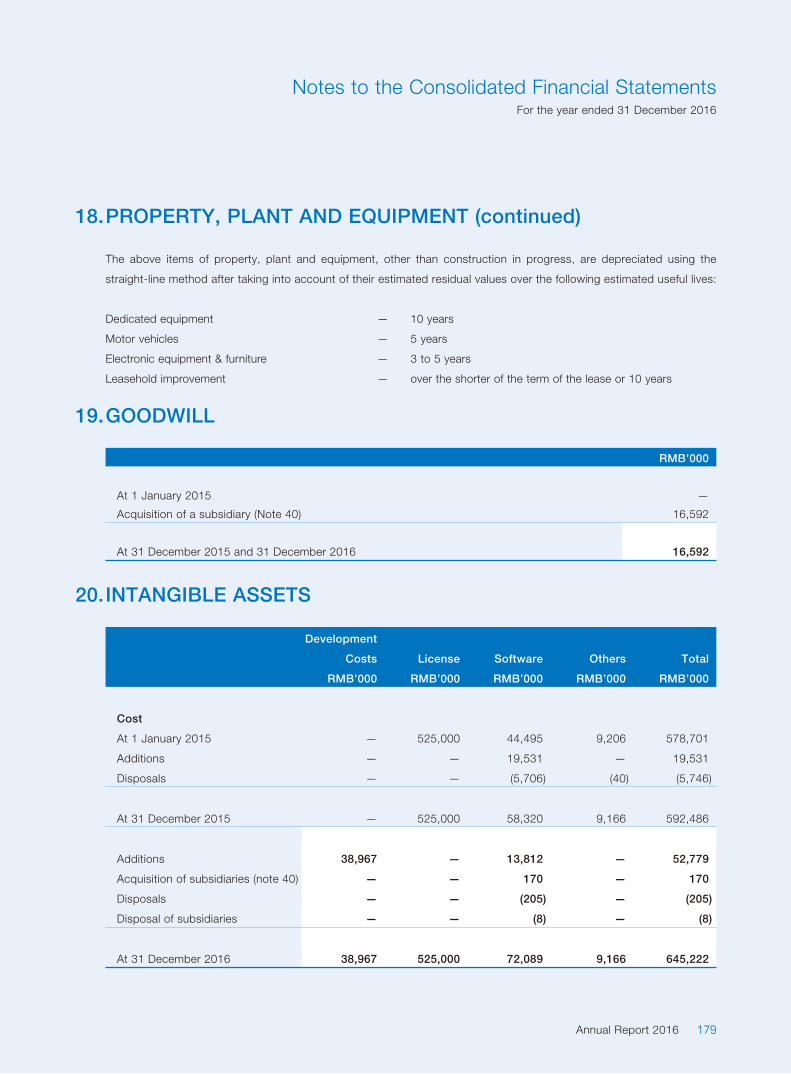
179Annual Report 2016
Notes to the Consolidated Financial StatementsFor the year ended 31 December 2016
18. PROPERTY, PLANT AND EQUIPMENT (continued)
The above items of property, plant and equipment, other than construction in progress, are depreciated using the
straight-line method after taking into account of their estimated residual values over the following estimated useful lives:
Dedicated equipment — 10 years
Motor vehicles — 5 years
Electronic equipment & furniture — 3 to 5 years
Leasehold improvement — over the shorter of the term of the lease or 10 years
19. GOODWILL
RMB’000
At 1 January 2015 —
Acquisition of a subsidiary (Note 40) 16,592
At 31 December 2015 and 31 December 2016 16,592
20. INTANGIBLE ASSETS
Development
Costs License Software Others Total
RMB’000 RMB’000 RMB’000 RMB’000 RMB’000
Cost
At 1 January 2015 — 525,000 44,495 9,206 578,701
Additions — — 19,531 — 19,531
Disposals — — (5,706) (40) (5,746)
At 31 December 2015 — 525,000 58,320 9,166 592,486
Additions 38,967 — 13,812 — 52,779
Acquisition of subsidiaries (note 40) — — 170 — 170
Disposals — — (205) — (205)
Disposal of subsidiaries — — (8) — (8)
At 31 December 2016 38,967 525,000 72,089 9,166 645,222
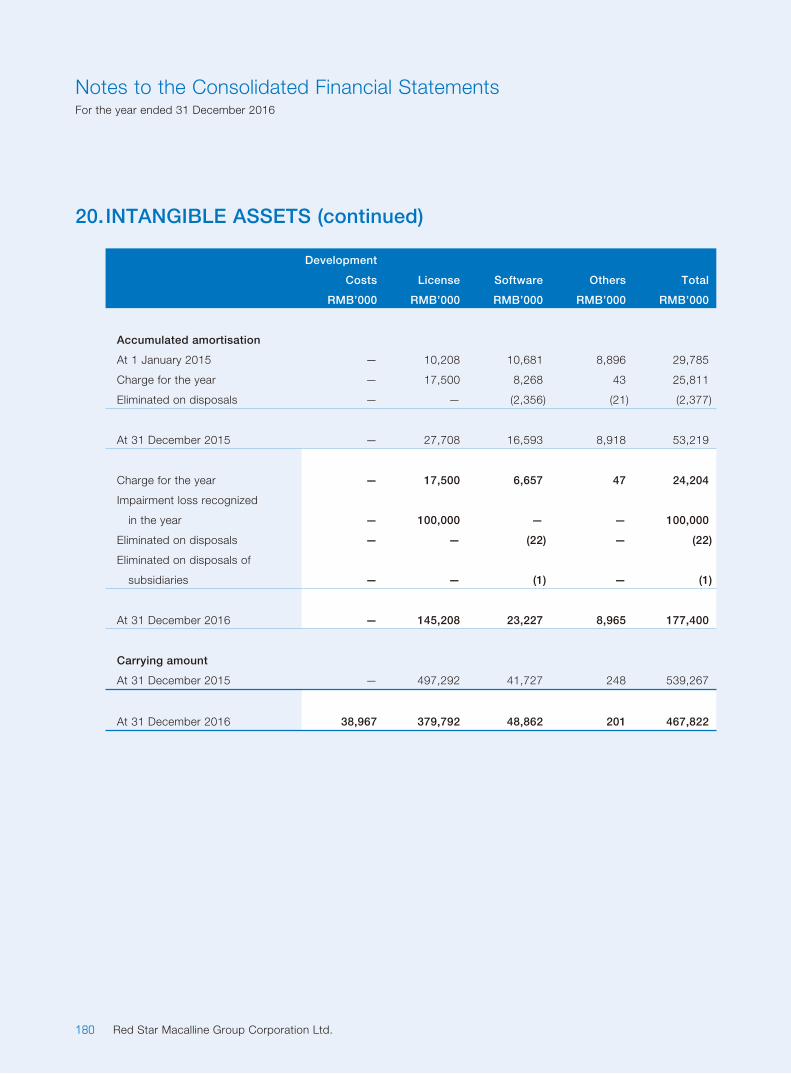
180 Red Star Macalline Group Corporation Ltd.
Notes to the Consolidated Financial StatementsFor the year ended 31 December 2016
20. INTANGIBLE ASSETS (continued)
Development
Costs License Software Others Total
RMB’000 RMB’000 RMB’000 RMB’000 RMB’000
Accumulated amortisation
At 1 January 2015 — 10,208 10,681 8,896 29,785
Charge for the year — 17,500 8,268 43 25,811
Eliminated on disposals — — (2,356) (21) (2,377)
At 31 December 2015 — 27,708 16,593 8,918 53,219
Charge for the year — 17,500 6,657 47 24,204
Impairment loss recognized
in the year — 100,000 — — 100,000
Eliminated on disposals — — (22) — (22)
Eliminated on disposals of
subsidiaries — — (1) — (1)
At 31 December 2016 — 145,208 23,227 8,965 177,400
Carrying amount
At 31 December 2015 — 497,292 41,727 248 539,267
At 31 December 2016 38,967 379,792 48,862 201 467,822
181Annual Report 2016
Notes to the Consolidated Financial StatementsFor the year ended 31 December 2016
20. INTANGIBLE ASSETS (continued)
In May 2014, the Company entered into a trademark licensing agreement with JiSheng Wellborn (“JSWB”), a high-end
home furnishing shopping mall operator, pursuant to which JSWB authorises the Group to use eight of its registered
trademarks in the Group’s managed shopping malls or sub-license the trademarks to a third party in home furnishing
retail business for 30 years from 1 June 2014 to 30 May 2044 for a cash consideration of RMB525,000,000. The
consideration was recognised as intangible assets and will be amortised over the useful life of 30 years.
The home improvement and furnishings retail industry is highly competitive and the development of new JSWB
managed shopping malls did not meet the expansion plan during past few years, which is regarded as an indication that
the JSWB license may be impaired. The recoverable amount of JSWB has been determined based on a value in use
calculation. That calculation uses cash fl ow projections based on fi nancial budgets approved by management covering
a 5— year period, and discount rate of 14% (2015: 15%). The cash fl ows beyond the 5-year period are extrapolated
steadily. Other key assumptions for the value in use calculations relate to the estimation of cash infl ows/outfl ows
which include budgeted revenue (including the number of new JSWB managed shopping malls developed) and gross
margin, such estimation is based on the similar home furnishing shopping mall’s past performance and management’s
expectations for the market development.
In the opinion of the management, the recoverable amount of JSWB is less than its carrying amount, thus an impairment
loss of RMB100,000,000 has been provided during the year.
The above intangible assets have fi nite useful lives. Such intangible assets are amortised on a straight-line basis over
the following periods.
Licenses — 30 years
Software — from 2 to 10 years
Others — 3 years

182 Red Star Macalline Group Corporation Ltd.
Notes to the Consolidated Financial StatementsFor the year ended 31 December 2016
21. INTERESTS IN ASSOCIATES
2016 2015RMB’000 RMB’000
Cost of investments in unlisted associates 206,637 146,850Share of post-acquisition profi ts and other comprehensive income, net of dividends received 83,539 12,357
290,176 159,207
As at 31 December 2016 and 2015, the Group had interests in the following associates:
Name of entityPlace of registration
Proportion of nominalvalue of registered capital
Proportion ofvoting power held Principal activities
2016 2015 2016 2015
深圳市紅星美凱龍世紀中心 家居生活廣場有限公司 Shenzhen Red Star Macalline Century Center Home Furnishing Plaza Company Limited (“Shenzhen Red Star”)
The PRC 37% 37% 37% 37% Shopping malls operation
海爾消費金融有限公司 Haier Consume Financing Company Limited (“Haier Financing”) (note a)
The PRC 25% 25% 25% 25% Consume fi nancing
武漢紅星美凱龍正達物流有限公司 Wuhan Red Star Macalline Zhengda Logistics Company Limited (“Wuhan Zhengda”) (note b)
The PRC 40% 40% 40% 40% Logistics storage
上海嘉展建築工程有限公司 Shanghai Jiazhan Construction Engineering Company Limited
The PRC 5% N/A 33% N/A Home decoration
杭州紅星美凱龍環球家居有限公司 Hangzhou Red Star Macalline Global Home Living Company Limited (“Hangzhou Global”) (note c)
The PRC 19% N/A 33% N/A Shopping malls operation
美屋三六五(天津)科技有限公司 Meiwu 365 (Tianjin) Technology Company Limited
The PRC 10% N/A 25% N/A Virtual reality platform for home decoration
愛菠蘿網絡科技(北京)有限公司 ArtPollo Network Technology (Beijing) Company Limited
The PRC 15% N/A 25% N/A E-commerce platform for artwork
183Annual Report 2016
Notes to the Consolidated Financial StatementsFor the year ended 31 December 2016
21. INTERESTS IN ASSOCIATES (continued)
The above table lists the associates of the Group which, in the opinion of the directors of the Company, principally
affected the results or assets of the Group. To give details of other associates would, in the opinion of the directors of
the Company, result in particulars of excessive length.
Notes:
(a) The Group has pledged its equity interest in Haier Financing to secure other borrowing granted to Haier Financing as set out in note 47(b).
(b) During the year ended 31 December 2015, the Group disposed 18% equity interest in its subsidiary, Wuhan Zhengda, to a third party. After the
disposal, the Group held 40% equity interest in Wuhan Zhengda and accounted for as interest in an associate. Details are set out in note 41.
(c) In September 2016, certain third parties made capital contribution to Hangzhou Global. Upon the completion of the capital contribution, the
Company held 19.0% of the equity interest of Hangzhou Global which was accounted for as interests in an associate. Details are set out in note 41.
Aggregate information of associates that are not individually material
2016 2015
RMB’000 RMB’000
The Group’s share of profi t and total comprehensive income for the year 83,831 62,954
Aggregate carrying amount of the Group’s interests in these associates 290,176 159,207
22. INTERESTS IN JOINT VENTURES
2016 2015
RMB’000 RMB’000
Cost of investment in unlisted joint ventures: 286,877 261,877
Share of post-acquisition profi ts and other comprehensive income,
net of dividends received 542,544 487,457
829,421 749,334

184 Red Star Macalline Group Corporation Ltd.
Notes to the Consolidated Financial StatementsFor the year ended 31 December 2016
22. INTERESTS IN JOINT VENTURES (continued)
As at 31 December 2016 and 2015, the Group had interests in the following joint ventures:
Name of entity
Place of
registration
Proportion of nominal
value of registered capital
Proportion of
voting power held Principal activities
2016 2015 2016 2015
成都東泰商城有限公司
Chengdu Dongtai Shopping
Mall Company Limited
(“Chengdu Dongtai”)
The PRC 50% 50% 50% 50% Shopping malls
operation
上海名藝商業企業發展有限公司
Shanghai Mingyi Enterprise
Development Company Limited
The PRC 50% 50% 50% 50% Shopping malls
operation
蕪湖紅星美凱龍股權
投資基金管理有限公司
Wuhu Red Star Macalline Equity
Investment Fund Management
Company Limited
The PRC 50% N/A 50% N/A Investment holding
廈門寶象紅星美凱龍
家居生活廣場有限公司
Xiamen Baoxiang Red Star Macalline
Home Furnishing Plaza Company
Limited (“Xiamen Baoxiang”)
The PRC 50% N/A 50% N/A Shopping malls
operation
The above table lists the joint ventures of the Group which, in the opinion of the directors of the Company, principally
affected the results or assets of the Group. To give details of other joint ventures would, in the opinion of the directors of
the Company, result in particulars of excessive length.
Summarised fi nancial information of material joint venture
Summarised fi nancial information in respect of the Group’s material joint venture is set out below. The summarised
fi nancial information below represents amounts shown in the joint venture’s fi nancial statements prepared in
accordance with IFRSs.
The material joint venture is accounted for using the equity method in the consolidated fi nancial statements.
185Annual Report 2016
Notes to the Consolidated Financial StatementsFor the year ended 31 December 2016
22. INTERESTS IN JOINT VENTURES (continued)
Summarised fi nancial information of material joint venture (continued)
Chengdu Dongtai
2016 2015
RMB’000 RMB’000
Current assets 368,542 359,315
Non-current assets 1,740,938 1,686,867
Current liabilities 109,788 97,374
Non-current liabilities 455,700 517,649
2016 2015
RMB’000 RMB’000
Revenue 166,519 161,907
Profi t and total comprehensive income for the year 112,833 88,296
Reconciliation of the above summarised fi nancial information to the carrying amount of the interest in the joint venture
recognised in the consolidated fi nancial statements:
2016 2015
RMB’000 RMB’000
Net assets of the joint venture 1,543,992 1,431,159
Proportion of the Group’s ownership interest in the joint venture 50% 50%
Carrying amount of the Group’s interest in Chengdu Dongtai 771,996 715,580

186 Red Star Macalline Group Corporation Ltd.
Notes to the Consolidated Financial StatementsFor the year ended 31 December 2016
22. INTERESTS IN JOINT VENTURES (continued)
Aggregate information of joint ventures that are not individually material
2016 2015
RMB’000 RMB’000
The Group’s share of (loss) profi t and comprehensive (expense) income (1,329) 5,876
Aggregate carrying amount of the Group’s interests in these joint ventures 57,425 33,754
23. AVAILABLE-FOR-SALE INVESTMENTS
2016 2015
RMB’000 RMB’000
Unlisted equity investments, at cost:
— Oppein (as defi ned below) (notes a, b) 157,560 157,560
— Other private entities established in the PRC (note b) 386,841 245,370
544,401 402,930
Notes:
(a) The amounts represented 4.99% equity interest in Oppein Home Group Inc (“Oppein”), a private entity established in the PRC and involved in
furniture manufacture.
(b) The available-for-sale investments are measured at cost less impairment at the end of the reporting periods because the range of reasonable fair
value estimates is so signifi cant that the directors of the Company are of the opinion that their fair values cannot be measured reliably.

187Annual Report 2016
Notes to the Consolidated Financial StatementsFor the year ended 31 December 2016
24. LOAN RECEIVABLES
2016 2015
RMB’000 RMB’000
Non-current
Zhejiang Mingdu (as defi ned below) (note a) 55,000 30,000
Daqing Xusheng (as defi ned below) (note b) 40,223 46,080
Anhui Tenghui Investment (as defi ned below) (note g) 65,000 —
Ningbo Longkai Industrial (as defi ned below) (note c) — 36,500
160,223 112,580
Current
Zhejiang Mingdu (as defi ned below) (note d) 45,000 70,000
Zhejiang Borui (as defi ned below) (note e) 110,000 30,100
Wuhan Zhuyeshan (as defi ned below) (note f) 60,000 60,000
Ningbo Longkai Industrial (note c) 36,500 —
Huaihua Xingqi (as defi ned below) (note h) 36,000 —
Langfang Aris (as defi ned below) (note i) 30,000 —
Microfi nance loans (note j) 184,789 —
Less: allowance for doubtful debts (1,848) —
500,441 160,100
Notes:
(a) The amounts represent long-term loan to 浙江名都投資有限公司 Zhejiang Mingdu Investment Company Limited (“Zhejiang Mingdu”), a non-
controlling shareholder of a subsidiary, under entrusted loan arrangement. The entrusted loan is unsecured, carried fi xed interest rate of 4.75% per
annum, and is repayable in 2018.
(b) The amounts represent long-term loan to 大慶旭生房地產開發有限公司 Daqing Xusheng Properties Development Company Limited (“Daqing
Xusheng”), a non-controlling shareholder of a subsidiary, under entrusted loan arrangement. The entrusted loan is secured by 30% equity interest of
this subsidiary held by Daqing Xusheng, carried variable interests of 122% of People’s Bank of China Benchmark Rate (“PBOCBR”) per annum, and
is repayable in 2020.
(c) The amounts represent long-term loan to 寧波隆凱實業有限公司 Ningbo Longkai Industrial Company Limited (“Ningbo Longkai Industrial”). The loan
is secured by 20% equity interest of a project company (which is operating and managing a home furnishing shopping mall) held by Ningbo Longkai
Industrial, carried fi xed interest rate of 8% per annum, and is repayable in 2017. The amounts were classifi ed as short-term as at 31 December 2016.

188 Red Star Macalline Group Corporation Ltd.
Notes to the Consolidated Financial StatementsFor the year ended 31 December 2016
24. LOAN RECEIVABLES (continued)
Notes: (continued)
(d) The amounts represent short-term loan to Zhejiang Mingdu, a non-controlling shareholder of a subsidiary, under entrusted loan arrangement. The
entrusted loan is unsecured, carried fi xed interests of 6.4% per annum, and is repayable in 2017.
(e) The amounts represent short-term loan to 浙江博瑞控股集團有限公司 Zhejiang Borui Holding Group Company Limited (“Zhejiang Borui”), a non-
controlling shareholder of a subsidiary, under entrusted loan arrangement. The entrusted loan is secured by 40% equity interest of this subsidiary
held by Zhejiang Borui. The balances amounting to RMB100,000,000 and RMB10,000,000 carried fi xed interests of 6.02% and 8% per annum,
respectively, and is repayable in 2017.
(f) The amounts represent short-term loan to 武漢竹葉山集團股份有限公司 Wuhan Zhuyeshan Group Company Limited (“Wuhan Zhuyeshan”) under
entrusted loan arrangement. The entrusted loan is secured by 99% equity interest of a project company (which is operating and managing a home
furnishing shopping mall) held by Wuhan Zhuyeshan, carried fi xed interests of 12.0% per annum, and is repayable in 2017.
(g) The amounts represent long-term loan to 安徽騰輝投資集團有限公司 Anhui Tenghui Investment Group Company Limited (“Anhui Tenghui
Investment”) under entrusted loan arrangement. The entrusted loan is secured by 30% equity interest of Anhui Tenghui Investment held by its
shareholders. The entrusted loan carried fi xed interest rate of 6.0% per annum, and is repayable in 2018.
(h) The amounts represent short-term loan to 懷化星旗房地產開發建設有限公司 Huaihua Xingqi Real Estate Development Construction Company
Limited (“Huaihua Xingqi”). The loan is secured by 100% equity interest of Huaihua Xingqi held by its shareholders. The entrusted loan carried fi xed
interest rate of 15% per annum, and is repayable on demand.
(i) The amounts represent short-term loan to 廊坊愛依瑞斯傢俱有限公司 Langfang Aris Furniture Company Limited (“Langfang Aris”). The loan is
guaranteed by proceeds collected on behalf of Langfang Aris in four home furnishing shopping malls in Beijing, carried fi xed interest rate of 12% per
annum, and is repayable in 2017.
(j) The amounts represented loans offered to small and medium enterprises (“SMEs”), microenterprises and entrepreneurial individuals by a subsidiary of
the Company, a licensed microfi nance company. Such loans receivable consisted of credit loans, guaranteed loans and collateral-backed loans. All
these loans are with the maturity no more than 12 months and carrying the interest rate ranging from 7.1% to 15.7% per annum. As at 31 December
2016, 22.6% of loans receivable were guaranteed loans, and 29.1% of loans receivable were collateral-backed loans. The Group seeks to maintain
strict control over its outstanding microfi nance loans to minimise credit risk. Overdue balances are reviewed regularly by management. The Group
has provided impairment allowance individually or collectively for all outstanding microfi nance loans:
RMB’000
At 1 January and 31 December 2015 —
Impairment losses recognised during the year 1,848
At 31 December 2016 1,848

189Annual Report 2016
Notes to the Consolidated Financial StatementsFor the year ended 31 December 2016
25. DEFERRED TAXATION
The following are the major deferred tax assets (liabilities) recognised and movements thereon:
Debt
restructure
within
the Group
Investment
properties
Unpaid
staff welfare
and
other
expenses
Allowance
for
bad debts
Deferred
income
Unrealised
profi t Tax losses Other Total
RMB’000 RMB’000 RMB’000 RMB’000 RMB’000 RMB’000 RMB’000 RMB’000 RMB’000
At 1 January 2015 55,451 (9,865,513) 209,538 36,439 36,310 19,232 89,436 22,808 (9,396,299)
(Charge) credit to
profi t or loss 51,268 (874,761) (69,893) 43,469 (1,036) (3,907) 7,607 730 (846,523)
Acquisitions of
subsidiaries (note 42) — (79,706) — — — — — 6,005 (73,701)
Disposal of
subsidiaries (note 43) — — (707) — — — (2,865) — (3,572)
At 31 December 2015 106,719 (10,819,980) 138,938 79,908 35,274 15,325 94,178 29,543 (10,320,095)
Credit (charge) to
profi t or loss 895 (966,900) 3,741 108,607 280 12,860 104,496 5,623 (730,398)
Acquisitions of
subsidiaries (note 40) — (5,903) — — — — — — (5,903)
Disposal of
subsidiaries (note 41) — — (14) — — — (671) — (685)
At 31 December 2016 107,614 (11,792,783) 142,665 188,515 35,554 28,185 198,003 35,166 (11,057,081)
For the purpose of presentation in the consolidated statement of fi nancial position, certain deferred tax assets and
liabilities have been offset. The following is the analysis of the deferred tax balances for fi nancial reporting purpose:
2016 2015
RMB’000 RMB’000
Deferred tax assets 577,294 347,444
Deferred tax liabilities (11,634,375) (10,667,539)
(11,057,081) (10,320,095)

190 Red Star Macalline Group Corporation Ltd.
Notes to the Consolidated Financial StatementsFor the year ended 31 December 2016
25. DEFERRED TAXATION (continued)
No deferred taxation asset has been recognised in respect of the following unutilised tax losses and deductible
temporary differences due to the unpredictability of future profi t streams.
2016 2015
RMB’000 RMB’000
Unutilised tax losses 1,794,057 1,717,631
Deductible temporary differences 311,329 106,847
2,105,386 1,824,478
The unrecognised tax losses will expire in at the end of the following years:
2016 2015
RMB’000 RMB’000
To be expired on:
31 December 2016 — 33,407
31 December 2017 97,326 179,796
31 December 2018 239,867 329,262
31 December 2019 407,693 479,218
31 December 2020 660,701 695,948
31 December 2021 388,470 —
1,794,057 1,717,631
191Annual Report 2016
Notes to the Consolidated Financial StatementsFor the year ended 31 December 2016
26. OTHER NON-CURRENT ASSETS
2016 2015
RMB’000 RMB’000
Prepayment for acquisition of land use rights 360,774 242,319
Prepayment for construction of investment properties 588,890 468,910
Prepayment for acquisition of investment properties (note a) 43,235 304,454
Amounts due from a third party (note b) 150,000 —
Amounts due from non-controlling shareholders
of subsidiaries (note c) 106,000 121,324
Prepayment to a related party for repurchase interests
in a transferred shopping mall (note d) (note 48) 247,705 247,705
Amount due from a related party (note 48) 287,388 42,092
Deposits paid for construction of investment properties 197,460 135,252
Deposits for acquisition of offi ce premises (note g) 210,081 —
Deposits paid under medium term operating lease 84,288 55,278
Preliminary development cost (note e) 141,963 141,562
Equity investment with fi xed return (note f) 198,400 219,400
Others 26,450 25,117
2,642,634 2,003,413
Notes:
(a) Prepayment for acquisition of investment properties:
2016 2015
RMB’000 RMB’000
Lanzhou Gaoke (i) — 194,000
Lanzhou Nanmiantan (ii) — 70,000
Others 43,235 40,454
43,235 304,454
i. The amount represented short-term loan to 蘭州高科新元房地產開發有限公司 Lanzhou Gaoke Xinyuan Properties Development Company
Limited (“Lanzhou Gaoke”) under entrusted loan arrangement for development of a shopping mall on certain land parcel held by Lanzhou
Gaoke. The entrusted loans is secured by the land use right of this land parcel, carried fi xed interests of 8.0% per annum, and is repayable in
2016.
192 Red Star Macalline Group Corporation Ltd.
Notes to the Consolidated Financial StatementsFor the year ended 31 December 2016
26. OTHER NON-CURRENT ASSETS (continued)
Notes: (continued)
(a) Prepayment for acquisition of investment properties: (continued)
ii. The amount represented short-term loan to 蘭州市南面灘工貿有限公司 Lanzhou Nanmiantan Company Limited (“Lanzhou Nanmiantan”)
under entrusted loan arrangement for development of a shopping mall on certain land parcel held by Lanzhou Nanmiantan. The entrusted
loans is secured by the land use right of this land parcel, carried fi xed interests of 8.0% per annum, and is repayable in 2016.
Pursuant to the respective agreement entered into between the Group and Lanzhou Gaoke/Lanzhou Nanmiantan, the Group will acquire the
shopping malls under development with the land use rights of these land parcel and the consideration will be partially settled by the entrusted loans.
The directors of the Company recognised the entrusted loans as deemed prepayment for acquisition of investment properties in other non-current
assets. The Group has completed the acquisitions during the year.
(b) The amounts of RMB150,000,000 were secured by 100% equity interest of a project company (which is operating and managing a home furnishing
shopping mall), interest free and repayable in 2018.
(c) The amounts were unsecured, interest free and repayable on demand. In the opinion of the directors of the Company, the amounts are to be settled
after twelve months from the end of the reporting period and were therefore classifi ed as non-current assets.
(d) In October 2015, the Company entered into a repurchase agreement with 成都紅星美凱龍置業有限公司 Chengdu Red Star Macalline Property
Company Limited (“Chengdu Property”), a subsidiary of RSM Enterprise Development, pursuant to which Chengdu Property has agreed to sell and
the Company has agreed to repurchase 50% of the interests in the transferred shopping mall held by 上海綠地集團成都金牛房地產開發有限公
司 Greenland Group Chengdu Jinniu Real Estate Development Co., Ltd. for a consideration of not more than RMB495,410,000. As at 31 December
2016 and 2015, the Company has paid RMB247,705,000, approximately 50% of the consideration.
(e) The amounts represented the preliminary development cost incurred for the project situated on one parcel of land, of which the relevant land use
right certifi cate is held by a non-controlling shareholder of a subsidiary. Pursuant to the agreement entered into between the Group and this non-
controlling shareholder, the relevant land use right certifi cate would be transferred to the Group as the capital contribution by the non-controlling
shareholder.
(f) The amounts represented investments held by the Group. Under agreements with other shareholders of these investees, the Group has contractual
rights to receive annual payments equal to stated interest rates applied to principal amounts and withdraw principal amounts upon the expiry of the
pre-agreed periods. In the opinion of the directors of the Company, such equity investments are fi nancial assets classifi ed as “loans and receivables”
in substance.
(g) In December 2016, the Group entered into an agreement with a third party, pursuant to which the Group will acquire offi ce premises at a total
consideration of approximately RMB2,100,810,000. As at 31 December 2016, the Group has paid deposit of approximately RMB210,081,000.
27. OTHER FINANCIAL ASSETS
The other fi nancial assets as at 31 December 2015 represented the debt investments in the PRC carrying interest rate
ranging from 5.88% to 6.02% per annum and maturity period of approximately three months. The Group has received
all the principal and interest in February 2016.

193Annual Report 2016
Notes to the Consolidated Financial StatementsFor the year ended 31 December 2016
28. TRADE AND OTHER RECEIVABLES
2016 2015
RMB’000 RMB’000
Trade receivables
— due from third parties 1,429,845 1,224,167
— due from related parties (note 48) 30 211
Less: allowance for doubtful debts (594,507) (257,813)
835,368 966,565
Bills receivable 900 2,200
836,268 968,765
Prepayments to third parties 155,502 92,877
Deferred A share IPO expense 9,340 —
Other taxes recoverable 87,842 29,978
Amounts due from third parties (note a) 313,185 258,472
Amounts due from non-controlling
shareholders of subsidiaries (note a) 81,504 27,324
Amounts due from related parties (note 48) 130,056 143,842
Deposits 81,689 81,890
Proceeds to be collected on behalf of the tenants (note b) 350,458 72,636
Other 27,933 23,956
Less: allowance for doubtful debts (65,245) (72,179)
1,172,264 658,796
2,008,532 1,627,561
Notes:
(a) The amounts were unsecured, interest free and repayable on demand.
(b) The Group collect the proceeds from the sale of merchandise by the tenants and remit the proceeds within settlement periods (normally seven days)
as pre-agreed with the tenants. The amounts represent the proceeds to be collected on behalf of the tenants from certain banks in the PRC as the
customers pay through credit card.

194 Red Star Macalline Group Corporation Ltd.
Notes to the Consolidated Financial StatementsFor the year ended 31 December 2016
28. TRADE AND OTHER RECEIVABLES (continued)
The following is an analysis of trade receivables and bills receivable by age, net of allowance for doubtful debts,
presented based on the date of recognition of revenue at the end of the reporting period:
2016 2015
RMB’000 RMB’000
Less than 1 year 466,277 715,619
1–2 years 266,285 207,786
2–3 years 99,797 37,996
Over 3 years 3,909 7,364
836,268 968,765
The Group has not granted any credit period to its customers. Before accepting any new customers, the Group uses
past experience to assess the potential customers’ credit quality and defi nes credit limits for the customers. Limits
attributed to customers are reviewed regularly.
The Group recognise allowance for doubtful debts based on estimated irrecoverable amounts determined by reference
to past default experience of the counterparty and an analysis of the counterparty’s current fi nancial position.
Trade receivables disclosed above include amounts (see below for aged analysis) which are past due at the end of
the reporting period for which the Group has not recognised an allowance for doubtful debts as there has not been
a signifi cant change in credit quality and the amounts are still considered recoverable. As at 31 December 2016, the
Group held collateral for trade receivables of RMB51,000,000 (2015: RMB51,000,000).
Aging of trade receivables which are past due but not impaired
2016 2015
RMB’000 RMB’000
Less than 1 year 372,710 555,250
The Group has provided impairment allowance individually or collectively for all trade receivables over 1 year.

195Annual Report 2016
Notes to the Consolidated Financial StatementsFor the year ended 31 December 2016
28. TRADE AND OTHER RECEIVABLES (continued)
Movement in the allowance for doubtful debts
2016 2015
RMB’000 RMB’000
Balance at beginning of the year 329,992 153,936
Impairment losses recognised during the year 341,274 203,599
Impairment losses reversed (6,660) (5,000)
Amounts written off during the year as uncollectible (4,854) (22,543)
Balance at end of the year 659,752 329,992
Included in the allowance for doubtful debts of the Group are individually impaired trade receivables with an aggregate
balance of RMB556,524,000 as at 31 December 2016 (2015: RMB224,292,000), which were in severe fi nancial
diffi culties.
29. RESTRICTED BANK DEPOSITS
2016 2015
RMB’000 RMB’000
Deposits pledged for banking facilities
(including bank borrowings) granted to the Group (note a) 70,461 69,126
Other restricted bank deposits 17,255 2,632
87,716 71,758
Analysed for reporting purposes as:
— Non-current (note b) 70,451 71,758
— Current 17,265 —
87,716 71,758
Notes:
(a) The amounts represented bank deposits denominated in RMB pledged to banks as securities for certain banking facilities (including bank
borrowings) granted to the Group.
(b) Deposits pledged as securities for bank and other borrowings granted to the Group that are not expected to be released within twelve months after
the end of the reporting period are classifi ed as non-current assets.
196 Red Star Macalline Group Corporation Ltd.
Notes to the Consolidated Financial StatementsFor the year ended 31 December 2016
29. RESTRICTED BANK DEPOSITS (continued)
The restricted bank deposits carry prevailing market interest rates as follows:
2016 2015
% %
Range of interest rate per annum 3.08–4.35 2.85–3.25
30. BANK BALANCES AND CASH
Bank balances and cash of the Group comprise cash and short-term bank deposits. The bank balances carry interest
at market rates which range from 0.35% to 3.05% per annum as at 31 December 2016 (2015: 0.35% to 3.25% per
annum).
2016 2015
RMB’000 RMB’000
Cash 45,829 14,882
Bank deposits with original maturity
within three months or less 5,946,596 5,833,582
Cash and cash equivalents 5,992,425 5,848,464
Bank deposits with original maturity
over three months 157,725 105,623
Bank balances and cash 6,150,150 5,954,087
The bank balances carry prevailing market interest rates as follows:
2016 2015
% %
Range of interest rate per annum 0.35–3.05 0.35–3.25
Bank balances and cash as at 31 December 2016 and 2015 were mainly denominated in RMB which is not a freely
convertible currency in the international market. The exchange rate of RMB is determined by the government of the PRC
and the remittance of these funds out of the PRC is subject to exchange restrictions imposed by the government of the
PRC.

197Annual Report 2016
Notes to the Consolidated Financial StatementsFor the year ended 31 December 2016
31. TRADE AND OTHER PAYABLES
2016 2015
RMB’000 RMB’000
Trade payable (note a) 353,219 279,541
Other payables:
Staff cost payables 540,096 389,088
Dividends payable to a non-controlling shareholder of a subsidiary 138,500 28,850
Other tax payables 254,410 213,035
Interests payables 120,291 83,467
Amounts due to third parties (note b) 237,122 216,979
Amount due to non-controlling shareholders of subsidiaries (note b) 323,202 137,918
Amounts due to related parties (note 48) 19,961 228,842
Consideration payable to a related party
for acquisition of subsidiaries (note c) (note 48) 30,989 175,572
Consideration payable to a third party for acquisition of a subsidiary (note d) — 53,308
Consideration payable for acquisition of additional interests in subsidiaries — 13,450
Construction costs payables 599,650 732,925
Proceeds collected on behalf of the tenants (note e) 1,303,285 809,945
Deposit received from the tenants 1,809,313 1,489,485
Received in advance arising from pre-paid cards (note f) 88,342 139,693
Intention deposit received (note g) 270,400 390,890
Accrued rental and other expenses 302,218 269,178
Other 207,762 114,108
6,245,541 5,486,733
6,598,760 5,766,274

198 Red Star Macalline Group Corporation Ltd.
Notes to the Consolidated Financial StatementsFor the year ended 31 December 2016
31. TRADE AND OTHER PAYABLES (continued)
Notes:
(a) The following is an analysis of trade payables by aging presented based on the invoice date at the end of the reporting period:
2016 2015
RMB’000 RMB’000
Less than 1 year 343,198 268,677
1–2 years 5,012 5,731
2–3 years 4,555 5,034
Above 3 years 454 99
353,219 279,541
(b) The amounts were unsecured, interest free and repayable on demand.
(c) The amounts represented consideration payable to RSM Enterprise Development for acquisition of 蘇州凱潤置業有限公司 Suzhou Kairun Properties
Company Limited (“Suzhou Kairun”) and 上海紅星美凱龍實業有限公司 Shanghai Red Star Macalline Industrial Company Limited (“RSM Industrial”),
which has been fully paid in 2016. Details are set out in note 40.
(d) The amounts represented consideration payable to a third party for acquisition of 呼和浩特市紅星美凱龍世博家居廣場有限責任公司 Huhehaote
Red Star Macalline Shibo Home Furnishing Plaza Company Limited (“Huhehaote Shibo ”), which has been fully paid in 2016. Details are set out in
note 40.
(e) The amounts represented the proceeds (from the sale of merchandise by the tenants) collected on behalf of the tenants and will be remitted within
settlement periods (normally seven days) as pre-agreed with the tenants.
(f) In 2013, the Group were approved by Shanghai Municipal Commission of Commerce to issue single-purpose pre-paid cards. The proceeds of
pre-paid cards will be transferred to the tenants within settlement periods (normally seven days) once the customers purchase merchandise in the
shopping malls.
(g) The amounts represent the intention deposits received from customers before the formal contract management arrangements were entered into. The
amounts will be deemed as initiation and entrance fees received in advance upon the formal arrangements are entered into, or remitted upon the
termination of the collaboration.

199Annual Report 2016
Notes to the Consolidated Financial StatementsFor the year ended 31 December 2016
32. BANK AND OTHER BORROWINGS
2016 2015
RMB’000 RMB’000
Bank loans
— Secured (note a) 9,705,833 8,349,819
— Unsecured (note b) 19,000 535,000
Other loans, secured (note a, c) 1,510,000 439,733
11,234,833 9,324,552
Notes:
(a) Bank and other loans were secured by certain investment properties and bank deposits of the Group, details of which are set out in notes 17 and 29.
Bank and other loans of RMB1,820,803,000 and RMB1,801,418,000 as at 31 December 2016 and 2015, respectively were also guaranteed by
certain related parties, details of which are set out in note 48.
(b) The balances as at 31 December 2016 and 2015 are not guaranteed.
(c) The other loans as at 31 December 2015 mainly represented the entrusted debt investment from certain third parties with a principle of
RMB1,200,000,000, which is secured by certain investment properties of the Group, carried fi xed interest rate of 7.59% per annum, and is repayable
by installments at the end of each quarter staring from 2014, and will be mature on 28 November 2023. The Group has early repaid a large portion of
this entrusted debt investment during the years ended 31 December 2015 and 2016.
The Group’s borrowing as at 31 December 2016 included entrusted debt investment from a third party with a principal of RMB250,000,000, which
is secured by certain investment properties of the Group and the future lease income of a shopping mall, carried fi xed interest rate of 5.23% per
annum, and will be mature on 3 February 2021.
The remaining balances represented two trust loans from certain third parties with principals of RMB490,000,000 and RMB700,000,000, which were
secured by certain investment properties of the Group, carried fi xed rate of 4.99% and 4.75% per annum, and will be mature on 25 May 2018 and 25
July 2018, respectively.

200 Red Star Macalline Group Corporation Ltd.
Notes to the Consolidated Financial StatementsFor the year ended 31 December 2016
32. BANK AND OTHER BORROWINGS (continued)
Notes: (continued)
(c) (continued)
2016 2015
RMB’000 RMB’000
Fixed-rate borrowings 1,510,010 839,733
Variable-rate borrowings 9,724,823 8,484,819
11,234,833 9,324,552
The borrowings are repayable:
Within one year or on demand 2,787,296 2,297,382
More than one year, but not exceeding two years 3,344,038 2,192,768
More than two years, but not exceeding fi ve years 3,444,250 3,339,116
More than fi ve years 1,659,249 1,495,286
11,234,833 9,324,552
Less: Amount due within one year shown under current liabilities 2,787,296 2,297,382
Amount due after one year 8,447,537 7,027,170
The ranges of effective interest rates (which are also equal to contracted interest rates) on the Group’s borrowings are
as follows:
2016 2015
% %
Fixed rate bank borrowings 4.58–7.59 5.15–7.59
Floating rate bank borrowings 3.92–6.41 5.89–7.38
The fl oating rate bank borrowings are arranged at the interest rate based on benchmark interest rates of the People’s
Bank of China.
The Group’s bank and other borrowings are denominated in RMB.
201Annual Report 2016
Notes to the Consolidated Financial StatementsFor the year ended 31 December 2016
33. BONDS
2016 2015
RMB’000 RMB’000
Unguaranteed medium term note:
— Bonds 2017 (as defi ned below) (note a) 894,941 889,791
— Bonds 2018 (as defi ned below) (note b) 497,031 495,449
— Bonds 2016 (as defi ned below) (note c) — 497,195
Private placement notes:
— Private Bonds 2017 (as defi ned below) (note d) 994,527 989,277
Corporate bonds:
— Corporate Bonds 2020 (as defi ned below) (note e) 4,973,683 4,960,494
— Corporate Bonds 2021 (as defi ned below) (note f) 1,485,447 —
— Corporate Bonds 2023 (as defi ned below) (note g) 1,477,940 —
10,323,569 7,832,206
Notes:
(a) In August 2012, the Company established a medium term note program (the “Program 2012”) under which it may issue bonds in series or tranches
of aggregate nominal amount of up to RMB1,500,000,000. On 13 December 2012, the Company issued bonds due in 2017 (the “Bonds 2017”) with
an aggregated nominal value of RMB900,000,000 at the face value under the Program 2012. The Bonds 2017 carry interest at the rate of 6.11% per
annum, payable annually on December 13, in each year, and will mature on 13 December 2017.
(b) In August 2013, the Company established a medium term note program (the “Program 2013”) under which it may issue bonds in series or tranches
of aggregate nominal amount of up to RMB1,000,000,000. On 11 September 2013, the Company issued bonds due in 2018 (the “Bonds 2018”) with
an aggregated nominal value of RMB500,000,000 at the face value under the Program 2013. The Bonds 2018 carry interest at the rate of 7.50% per
annum, payable annually on September 11, in each year, and will mature on 11 September 2018.
(c) On 5 December 2013, the Company issued bonds due in 2016 (the “Bonds 2016”) with an aggregated nominal value of RMB500,000,000 at the face
value under the Program 2013. The Bonds 2016 carry interest at the rate of 7.50% per annum, payable annually on December 5, in each year, and
will mature on 5 December 2016.
(d) On 8 December 2014, the Company issued private placement notes due in 2017 (the “Private Bonds 2017”) with an aggregated nominal value of
RMB1,000,000,000 at the face value. The Private Bonds 2017 carry interest at the rate of 8.00% per annum, payable annually on December 8, in
each year, and will mature on 8 December 2017.
(e) On 11 October 2015, the Company issued corporate bonds due in 2020 (the “Corporate Bonds 2020”) with an aggregated nominal value of
RMB5,000,000,000 at the face value. The Corporate Bonds 2020 carry interest at the rate of 4.50% per annum, payable annually on 11 October, in
each year, and will mature on 11 October 2020. At the end of the fi rst three-year period, the Company has an option to adjust the coupon rate and
the holders of the Corporate Bonds 2020 also have a right to put all or part of the Corporate Bonds 2020 back to the Company at its principal value.
(f) On 14 July 2016, the Company issued corporate bonds due in 2021 (the “Corporate Bonds 2021”) with an aggregated nominal value of
RMB1,500,000,000 at the face value. The Corporate Bonds 2021 carry interest at the rate of 3.50% per annum, payable annually on 14 July, in each
year, and will mature on 14 July 2021. At the end of the fi rst three-year period, the Company has an option to adjust the coupon rate and the holders
of the Corporate Bonds 2021 also have a right to put all or part of the Corporate Bonds 2021 back to the Company at its principal value.

202 Red Star Macalline Group Corporation Ltd.
Notes to the Consolidated Financial StatementsFor the year ended 31 December 2016
33. BONDS (continued)
Notes: (continued)
(g) On 14 July 2016, the Company issued corporate bonds due in 2023 (the “Corporate Bonds 2023”) with an aggregated nominal value of
RMB1,500,000,000 at the face value. The Corporate Bonds 2023 carry interest at the rate of 4.29% per annum, payable annually on 14 July, in each
year, and will mature on 14 July 2023. At the end of the fi rst fi ve-year period, the Company has an option to adjust the coupon rate and the holders
of the Corporate Bonds 2023 also have a right to put all or part of the Corporate Bonds 2023 back to the Company at its principal value.
The movements of Bonds 2017, Bonds 2018, Bonds 2016, Private Bonds 2017, Corporate Bonds 2020, Corporate
Bonds 2021 and Corporate Bonds 2023 are set out below:
2016 2015
RMB’000 RMB’000
As at 1 January 7,887,566 3,494,977
Net proceeds from Corporate Bonds 2020 issued on 11 October 2015 — 4,958,670
Net proceeds from Corporate Bonds 2021 issued on 14 July 2016 1,483,203 —
Net proceeds from Corporate Bonds 2023 issued on 14 July 2016 1,476,127 —
Redemption of Bonds 2016 on 5 December 2016 (500,000)
Redemption of Bonds 2015 on 31 August 2015 — (600,000)
Interests and issue cost amortised year 513,576 276,549
Interest paid during the year (434,990) (242,630)
As at 31 December 10,425,482 7,887,566
The balance of Bonds 2017, Bonds 2018, Bonds 2016, Private Bonds 2017, Corporate Bonds 2020, Corporate Bonds
2021 and Corporate Bonds 2023 at the end of the reporting period represented by:
2016 2015
RMB’000 RMB’000
Other payables — accrued interests 101,913 55,360
Bonds (current) 1,889,468 497,195
Bonds (non-current) 8,434,101 7,335,011
10,425,482 7,887,566
The balances of Bonds 2017, Bonds 2018, Bonds 2016, Private Bonds 2017, Corporate Bonds 2020, Corporate Bonds
2021 and Corporate Bonds 2023 represent the contractually determined stream of future cash fl ows discounted at the
rate of interest determined by the market instruments of comparable credit status taken into account the business risk
and fi nancial risk of the Company. The effective interest rate of Bonds 2017, Bonds 2018, Bonds 2016, Private Bonds
2017, Corporate Bonds 2020, Corporate Bonds 2021 and Corporate Bonds 2023 is 6.76% per annum, 7.89% per
annum, 8.11% per annum, 8.48% per annum, 4.80% per annum, 3.90% per annum and 4.65% per annum respectively.

203Annual Report 2016
Notes to the Consolidated Financial StatementsFor the year ended 31 December 2016
34. OBLIGATIONS UNDER FINANCE LEASES
The Group leased one of its shopping malls under fi nance leases. The lease term is 40 years, which is for the major part
of the economic life of this property in the opinion of the directors of the Company. Interest rates are fi xed at 6.55% per
annum on the contract date. In 2016, the Group entered into a supplementary agreement with the lessor for additional
rental. The lease term of the new contract is 33 years and interest rates are fi xed at 4.90% per annum on the contract
date. No arrangements have been entered into for contingent rental payments.
Minimum lease payments
Present value of minimum
lease payments
31/12/2016 31/12/2015 31/12/2016 31/12/2015
RMB’000 RMB’000 RMB’000 RMB’000
Within 1 year 36,183 26,315 34,787 25,404
Over 1 year but less than 2 years 31,249 26,315 28,156 23,798
Over 2 years but less than 5 years 93,747 78,944 74,948 63,082
More than 5 years 833,309 728,043 295,079 239,974
994,488 859,617 432,970 352,258
Less: unearned fi nance income (561,518) (507,359) N/A N/A
Present value of lease obligations 432,970 352,258 432,970 352,258
Less: Amount due within one year shown
under current liabilities (13,277) (3,193)
Amount due after one year 419,693 349,065
35. DEFERRED INCOME
2016 2015
RMB’000 RMB’000
As at 1 January 194,354 198,498
Received during the year 6,066 —
Released to profi t or loss (5,007) (4,144)
As at 31 December 195,413 194,354
The Group received government subsidies of approximately RMB6,066,000 during the year ended 31 December 2016
for the development of certain shopping malls (2015: Nil). The amounts are treated as deferred income and will be
recognised in profi t or loss on a systematic basis over the estimated useful lives of the shopping malls.

204 Red Star Macalline Group Corporation Ltd.
Notes to the Consolidated Financial StatementsFor the year ended 31 December 2016
36. OTHER NON-CURRENT LIABILITIES
2016 2015
RMB’000 RMB’000
Initiation and entrance fees received in advance 415,321 696,821
Rental payable (note a) 336,482 330,307
Amounts due to non-controlling shareholders of subsidiaries (note b) 719,537 698,295
1,471,340 1,725,423
Notes:
(a) Lease payments under an operating lease is recognised as an expense on a straight-line basis over the lease term. For operating leases with
increased annual payments, the differences between the rental expenses recognised on a straight-line basis and the actual annual payments are
recognised as liabilities.
(b) The amounts are unsecured, interest free and repayable on demand after the subsidiaries become profi table. In the opinion of the directors of
the Company, the amounts are to be settled after twelve months from the end of the reporting period and are therefore classifi ed as non-current
liabilities.
37. SHARE CAPITAL
Domestic shares Foreign shares Listed H shares Total
Number of
share Amount
Number of
share Amount
Number of
share Amount
Number of
share Amount
’000 RMB’000 ’000 RMB’000 ’000 RMB’000 ’000 RMB’000
Registered, issued and fully
paid at RMB1.0 per share:
At 1 January 2015 2,561,104 2,561,104 438,896 438,896 — — 3,000,000 3,000,000
Share issued (note a) — — 80,329 80,329 — — 80,329 80,329
Issuance of H shares (note b) — — — — 543,588 543,588 543,588 543,588
Conversion into H shares (note b) — — (519,225) (519,225) 519,225 519,225 — —
At 31 December 2015 and 2016 2,561,104 2,561,104 — — 1,062,813 1,062,813 3,623,917 3,623,917

205Annual Report 2016
Notes to the Consolidated Financial StatementsFor the year ended 31 December 2016
37. SHARE CAPITAL (continued)
Notes:
(a) On 4 January 2015, Candlewood Investment SRL (“Candlewood”) and Springwood Investment SRL (“Springwood”) entered into a capital increase
and subscription agreement with the Company, RSM Investment and other shareholders of the Company, pursuant to which Candlewood and
Springwood further subscribed for 60,917,952 shares and 19,411,086 shares of the Company for RMB5.39 each. The total consideration amounted
to approximately RMB432,973,000, out of which approximately RMB80,329,000 was paid up as registered share capital and approximately
RMB352,644,000 as the share premium of the Company. The capital contribution was fully completed on 12 February 2015. After the capital
contribution, the registered capital of the Company increased from RMB3,000,000,000 to RMB3,080,329,038.
(b) On 26 June 2015, upon the approval of the Stock Exchange, the Company has completed its initial public offering of 543,588,000 H shares,
which are listed on the Main Board of the Stock Exchange. Moreover, the 519,225,069 foreign shares held by Candlewood and Springwood were
converted into H shares upon completion of the initial public offering.
(c) Except for the currency in which dividends are paid, H shares and domestic shares rank pari passu in all respects with each other.
38. NON-CONTROLLING INTERESTS
The table below shows details of non-wholly owned subsidiaries of the Group that have material non-controlling
interests:
Name of subsidiary
Place of
Establishment
and principal
place of business
Proportion of
equity interest held by
non-controlling interest
Year end December 31
Profi t allocated to
non-controlling interests
Year ended December 31
Accumulated
non-controlling interests
Year ended December 31
2016 2015 2016 2015 2016 2015
RMB’000 RMB’000 RMB’000 RMB’000
Zhengzhou Red Star Macalline International
Home Furnishing Company Limited
(“Zhengzhou International”) (note 1) PRC 40.50% 40.50% 99,195 123,161 1,049,901 1,006,036
Chengdu Changyi Red Star Macalline
Home Furnishing Market Management
Company Limited (“Chengdu Changyi”) (note 1) PRC 50.00% 50.00% 27,391 31,720 535,269 507,878
Individual immaterial subsidiaries
with non-controlling interests 205,555 116,806 2,631,880 2,609,731
332,141 271,687 4,217,050 4,123,645
Note 1: Pursuant to the agreements between the Group and the respective non-controlling shareholder of Zhengzhou International and Chengdu
Changyi, the Group hold majority of voting power in Zhengzhou International and Chengdu Changyi. Therefore the Group has control over these
entities and accounted for as subsidiaries.

206 Red Star Macalline Group Corporation Ltd.
Notes to the Consolidated Financial StatementsFor the year ended 31 December 2016
38. NON-CONTROLLING INTERESTS (continued)
2016 2015
Zhengzhou International RMB’000 RMB’000
Current assets 270,768 193,478
Non-current assets 3,553,125 3,368,295
Current liabilities 147,860 288,221
Non-current liabilities 1,047,711 784,026
Equity attributable to owners of the Company 1,578,421 1,483,490
Non-controlling interests 1,049,901 1,006,036
2016 2015
RMB’000 RMB’000
Revenue 228,963 304,910
Changes in fair value of investment properties 160,018 115,585
Expenses 143,985 174,173
Profi t and total comprehensive income 244,996 246,322
Profi t and total comprehensive income attributable to owners of the Company 145,801 123,161
Profi t and total comprehensive income attributable to the non-controlling interests 99,195 123,161
244,996 246,322
Dividends paid to non-controlling interests 55,330 65,500
Net cash infl ow from operating activities 106,673 231,490
Net cash (outfl ow) infl ow from investing activities (243,181) 127,019
Net cash infl ow (outfl ow) from fi nancing activities 118,131 (336,036)
Net cash (outfl ow) infl ow (18,377) 22,473

207Annual Report 2016
Notes to the Consolidated Financial StatementsFor the year ended 31 December 2016
38. NON-CONTROLLING INTERESTS (continued)
2016 2015
Chengdu Changyi RMB’000 RMB’000
Current assets 166,695 125,732
Non-current assets 1,391,467 1,342,246
Current liabilities 168,619 141,389
Non-current liabilities 347,771 339,599
Equity attributable to owners of the Company 506,503 479,112
Non-controlling interests 535,269 507,878
2016 2015
RMB’000 RMB’000
Revenue 70,495 81,057
Changes in fair value of investment properties 23,922 20,443
Expenses 39,635 38,060
Profi t and total comprehensive income 54,782 63,440
Profi t and total comprehensive income attributable to owners of the Company 27,391 31,720
Profi t and total comprehensive income attributable to the non-controlling interests 27,391 31,720
54,782 63,440
Dividends paid to non-controlling interests — 20,864
Net cash infl ow from operating activities 65,074 58,988
Net cash (outfl ow) infl ow from investing activities (56,949) 165,337
Net cash (outfl ow) from fi nancing activities (8,627) (232,765)
Net cash outfl ow (502) (8,440)
208 Red Star Macalline Group Corporation Ltd.
Notes to the Consolidated Financial StatementsFor the year ended 31 December 2016
39. RETIREMENT BENEFIT PLANS
According to the relevant laws and regulations in the PRC, the group entities in the PRC are required to participate
in a defi ned contribution retirement scheme administrated by the local municipal government. The group entities in
the PRC contribute funds which are calculated on a certain percentage of the average employee salary as agreed by
local municipal government to the scheme to fund the retirement benefi ts of the employees. The principal obligation
of the Group with respect to the retirement benefi t scheme is to make the required contributions under the scheme.
The total cost charged to profi t or loss for the years ended 31 December 2016 amounted to RMB177,088,000 (2015:
RMB169,065,000) represent contributions paid or payable to the scheme by the Group.
40. ACQUISITIONS OF SUBSIDIARIES
Acquisitions in 2016:
Acquisition of安徽騰輝物流有限公司
Anhui Tenghui Logistics Company Limited (“Anhui Tenghui Logistics”)
In June 2016, the Group acquired 100.0% equity interest in Anhui Tenghui Logistics for a consideration of
RMB50,000,000 from an independent third party. The Group also agreed to assume liabilities of RMB173,000,000
of the acquiree. Anhui Tenghui Logistics is principally engaged in leasing of warehouses and was acquired so as to
continue the expansion of the Group’s principal business.
Acquisition of安徽騰輝投資集團合肥有限公司
Anhui Tenghui Investment Group Hefei Company Limited (“Anhui Tenghui Investment Hefei”)
The Group held 5.0% equity interest in Anhui Tenghui Investment Hefei and accounted for as available-for-sale
investments before the acquisition. In December 2016, the Group acquired 95.0% equity interest in Anhui Tenghui
Investment Hefei for a consideration of RMB30,000,000 from an independent third party. The Group also agreed to
assume liabilities of approximately RMB534,598,000 of the acquiree. Anhui Tenghui Investment Hefei is principally
engaged in operating and managing a home furnishing shopping mall and was acquired so as to continue the expansion
of the Group’s principal business.
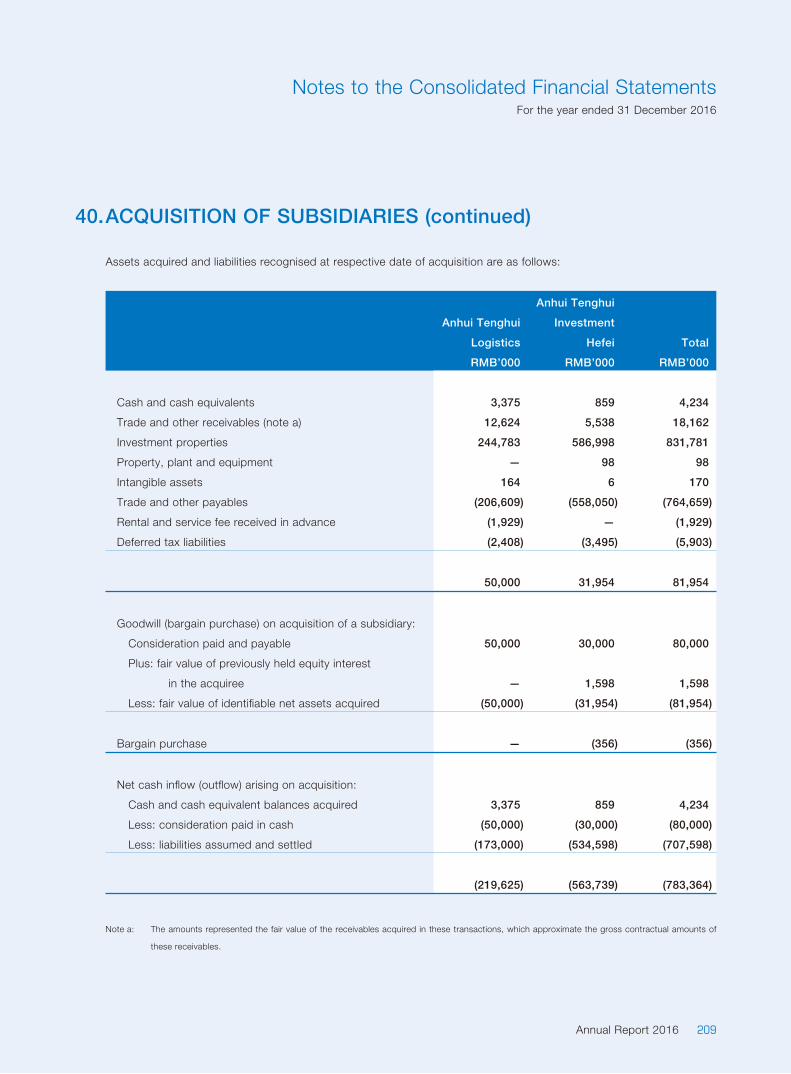
209Annual Report 2016
Notes to the Consolidated Financial StatementsFor the year ended 31 December 2016
40. ACQUISITION OF SUBSIDIARIES (continued)
Assets acquired and liabilities recognised at respective date of acquisition are as follows:
Anhui Tenghui
Logistics
Anhui Tenghui
Investment
Hefei Total
RMB’000 RMB’000 RMB’000
Cash and cash equivalents 3,375 859 4,234
Trade and other receivables (note a) 12,624 5,538 18,162
Investment properties 244,783 586,998 831,781
Property, plant and equipment — 98 98
Intangible assets 164 6 170
Trade and other payables (206,609) (558,050) (764,659)
Rental and service fee received in advance (1,929) — (1,929)
Deferred tax liabilities (2,408) (3,495) (5,903)
50,000 31,954 81,954
Goodwill (bargain purchase) on acquisition of a subsidiary:
Consideration paid and payable 50,000 30,000 80,000
Plus: fair value of previously held equity interest
in the acquiree — 1,598 1,598
Less: fair value of identifi able net assets acquired (50,000) (31,954) (81,954)
Bargain purchase — (356) (356)
Net cash infl ow (outfl ow) arising on acquisition:
Cash and cash equivalent balances acquired 3,375 859 4,234
Less: consideration paid in cash (50,000) (30,000) (80,000)
Less: liabilities assumed and settled (173,000) (534,598) (707,598)
(219,625) (563,739) (783,364)
Note a: The amounts represented the fair value of the receivables acquired in these transactions, which approximate the gross contractual amounts of
these receivables.

210 Red Star Macalline Group Corporation Ltd.
Notes to the Consolidated Financial StatementsFor the year ended 31 December 2016
40. ACQUISITION OF SUBSIDIARIES (continued)
Acquisition-related costs for these acquisitions are not material and have been excluded from the consideration
transferred and have been recognised as an expense during the year, within the ‘administrative expenses’ line item in
the consolidated statement of profi t or loss and other comprehensive income.
Included in the profi t for the year ended 31 December 2016 is RMB3,696,000 and RMB nil in respect of Anhui Tenghui
Logistics and Anhui Tenghui Investment Hefei after the respective acquisition. Included in the revenue for the year
ended 31 December 2016 is RMB2,640,000 and RMB nil in respect of Anhui Tenghui Logistics and Anhui Tenghui
Investment Hefei after the respective acquisition.
Had these acquisitions been effected at 1 January 2016, the revenue of the Group for the year ended 31 December
2016 would have been RMB9,288 million, and the profi t for the year ended 31 December 2016 would have been
RMB4,300 million.
Acquisitions in 2015:
Acquisition of Kuming Diken
In June 2015, the Group acquired 63.0% equity interest in Kuming Diken for a consideration of RMB177,691,000 from
an independent third party. Kuming Diken was holding the land use right for a piece of land parcel and has not carried
out any substantial business activities. The acquisition has been accounted for as acquisition of assets, which do not
constitute a business.
Acquisition of Suzhou Zhongxiang
Suzhou Zhongxiang was established by the Group and a third party in October 2009, the Group held 33% equity
interest in Suzhou Zhongxiang and accounted for as interest in an associate. In July 2015, the Group acquired
additional 22% equity interest in Suzhou Zhongxiang for a cash consideration of RMB74,076,000 from a third party.
Suzhou Zhongxiang is principally engaged in operating and managing a home furnishing shopping mall and was
acquired so as to continue the expansion of the Group’s principal business.
211Annual Report 2016
Notes to the Consolidated Financial StatementsFor the year ended 31 December 2016
40. ACQUISITION OF SUBSIDIARIES (continued)
Acquisitions in 2015: (continued)
Acquisition of Huhehaote Shibo
The Group held 9% equity interest in Huhehaote Shibo and accounted for as available-for-sale investments before
the acquisition. In July 2015, the Group acquired 51% equity interest in Huhehaote Shibo for a cash consideration
of RMB51,000,000 from a third party. Huhehaote Shibo was developing a home furnishing shopping mall and was
acquired so as to continue the expansion of the Group’s principal business.
Acquisition of Jiabeide (as defi ned below)
家倍得裝飾有限公司 Jiabeide Decorating Company Limited (“Jiabeide”) was established by the Group, the Group held
50% of its equity interest and accounted for its interest in Jiabeide as a joint venture. In July 2015, the Group entered
into an agreement with other shareholders of Jiabeide, pursuant to which, the Group has the practical ability to direct
the relevant activities of Jiabeide unilaterally, therefore the Group has control over Jiabeide and accounts for its interest
in Jiabeide as a subsidiary. Jiabeide is principally engaged in retail sales of home furnishing merchandise and providing
related decorating services and was acquired so as to continue the expansion of the Group’s principal business.
Acquisition of Suzhou Kairun
In December 2015, the Group acquired 60.0% equity interest in Suzhou Kairun for a consideration of RMB258,000,000
from RSM Enterprise Development. Suzhou Kairun was holding the land use right for a piece of land parcel and has not
carried out any substantial business activities. The acquisition has been accounted for as acquisition of assets, which
do not constitute a business.
Acquisition of RSM Industrial
In December 2015, the Group acquired 100.0% equity interest in RSM Industrial for a consideration of
RMB206,841,000 from RSM Enterprise Development. RSM Industrial was holding equity investments (accounted for as
available-for-sale investments and other non-current assets) and has not carried out any substantial business activities.
The acquisition has been accounted for as acquisition of assets, which do not constitute a business.

212 Red Star Macalline Group Corporation Ltd.
Notes to the Consolidated Financial StatementsFor the year ended 31 December 2016
40. ACQUISITION OF SUBSIDIARIES (continued)
Acquisitions in 2015: (continued)
Assets acquired and liabilities recognised at respective date of acquisition are as follows:
Kuming
Diken
Suzhou
Zhongxiang
Huhehaote
Shibo Jiabeide
Suzhou
Kairun
RSM
Industrial Total
RMB’000 RMB’000 RMB’000 RMB’000 RMB’000 RMB’000 RMB’000
Cash and cash equivalents 485 5,955 1,010 31,243 — 4,350 43,043
Trade and other receivables (note a) — 311 58,454 4,649 — 77,200 140,614
Investment properties 278,581 922,302 403,301 — 430,000 — 2,034,184
Property, plant and equipment — 123 26 862 — — 1,011
Available-for-sale investments — — — — — 148,230 148,230
Other non-current assets (note a) — — — — — 190,250 190,250
Deferred tax assets — 5,485 71 788 — 1,250 7,594
Borrowings — (447,000) — — — — (447,000)
Trade and other payables — (142,203) (357,655) (36,334) — (214,439) (750,631)
Deferred tax liabilities — (79,706) (1,589) — — — (81,295)
279,066 265,267 103,618 1,208 430,000 206,841 1,286,000
Goodwill (bargain purchase)
on acquisition of a subsidiary:
Consideration paid and payable 177,691 74,076 51,000 — 258,000 206,841 767,608
Plus: fair value of previously
held equity interest in
the acquiree — 88,413 9,326 604 — — 98,343
Plus: non-controlling interests
(note b) 101,375 119,370 41,447 604 172,000 — 434,796
Less: fair value of identifi able net
assets acquired (279,066) (265,267) (103,618) (1,208) (430,000) (206,841) (1,286,000)
Goodwill (bargain purchase) — 16,592 (1,845) — — — 14,747
Net cash infl ow (outfl ow) arising
on acquisition:
Cash and cash equivalent
balances acquired 485 5,955 1,010 31,243 — 4,350 43,043
Less: consideration paid in cash 62,192 74,076 51,000 — 225,960 63,309 476,537
(note c) (note d) (note d)
(61,707) (68,121) (49,990) 31,243 (225,960) (58,959) (433,494)
213Annual Report 2016
Notes to the Consolidated Financial StatementsFor the year ended 31 December 2016
40. ACQUISITION OF SUBSIDIARIES (continued)
Acquisitions in 2015: (continued)
Note a: The amounts represented the fair value of the receivables acquired in these transactions, which approximate the gross contractual amounts of
these receivables.
Note b: The non-controlling interests in the acquiree at the respective acquisition date was initially measured at the non-controlling interests’
proportionate share of the recognised amount of the acquiree’s identifi able net assets.
Note c: The Group has prepaid cash consideration of RMB62,191,000 in 2014, which was accounted for as other non-current assets. The remaining
consideration of RMB53,308,000 was outstanding as at 31 December 2015 and recorded as other payable disclosed in note 31.
Note d: The remaining consideration of RMB32,040,000 and RMB143,532,000 for Suzhou Kairun and RSM Industrial was outstanding as at 31
December 2015 and recorded as other payable disclosed in note 31, respectively.
Acquisition-related costs for these acquisitions are not material and have been excluded from the consideration
transferred and have been recognised as an expense during the year, within the ‘administrative expenses’ line item in
the consolidated statement of profi t or loss and other comprehensive income.
Included in the profi t for the year ended 31 December 2015 is RMB814,000, RMB17,630,000, RMB78,996,000,
RMB746,000, RMB nil and RMB nil in respect of Kunming Diken, Suzhou Zhongxiang, Huhehaote Shibo, Jiabeide,
Suzhou Kairun and RSM Industrial after the respective acquisition. Included in the revenue for the year ended 31
December 2015 is RMB nil, RMB20,971,000, RMB nil, RMB45,283,000, RMB nil and RMB nil in respect of Kunming
Diken, Suzhou Zhongxiang, Huhehaote Shibo, Jiabeide, Suzhou Kairun and RSM Industrial after the respective
acquisition.
Had these acquisitions been effected at 1 January 2015, the revenue of the Group for the year ended 31 December
2015 would have been RMB8,842 million, and the profi t for the year ended 31 December 2015 would have been
RMB4,448 million.

214 Red Star Macalline Group Corporation Ltd.
Notes to the Consolidated Financial StatementsFor the year ended 31 December 2016
41. DISPOSAL OF SUBSIDIARIES
Disposals in 2016:
Disposal of 武漢星典裝飾工程有限責任公司
Wuhan Xingdian Home Decorating Company Limited (“Wuhan Xingdian”)
In January 2016, the Group disposed 60% equity interest in its subsidiary, Wuhan Xingdian, to a third party for a cash
consideration of RMB96,000.
Disposal of 河南星時代裝飾設計工程有限公司
Henan Xingshidai Home Decorating Design Company Limited (“Henan Xingshidai”)
In January 2016, the Group disposed 60% equity interest in its subsidiary, Henan Xingshidai, to a third party for a cash
consideration of RMB150,000.
Disposal of 上海津麗龍裝飾設計工程有限公司
Shanghai Jinlilong Home Decorating Design Company Limited (“Shanghai Jinlilong”)
In January 2016, the Group disposed 80% equity interest in its subsidiary, Shanghai Jinlilong, to a third party for a cash
consideration of RMB926,000.
Disposal of 成都尚鼎居裝飾工程有限公司
Chengdu Shangdingju Home Decorating Company Limited (“Chengdu Shangdingju”)
In January 2016, the Group disposed 70% equity interest in its subsidiary, Chengdu Shangdingju, to a third party for a
cash consideration of RMB320,000.
Deemed disposal of 杭州紅星美凱龍環球家居有限公司
Hangzhou Red Star Macalline Global Home Company Limited (“Hangzhou Global”)
In September 2016, certain third parties made capital contribution to Hangzhou Global. Upon the completion of the
capital contribution, the Company held 19.0% of the equity interest of Hangzhou Global which was accounted for as
interests in an associate and Hangzhou Global ceased to be a subsidiary of the Group.
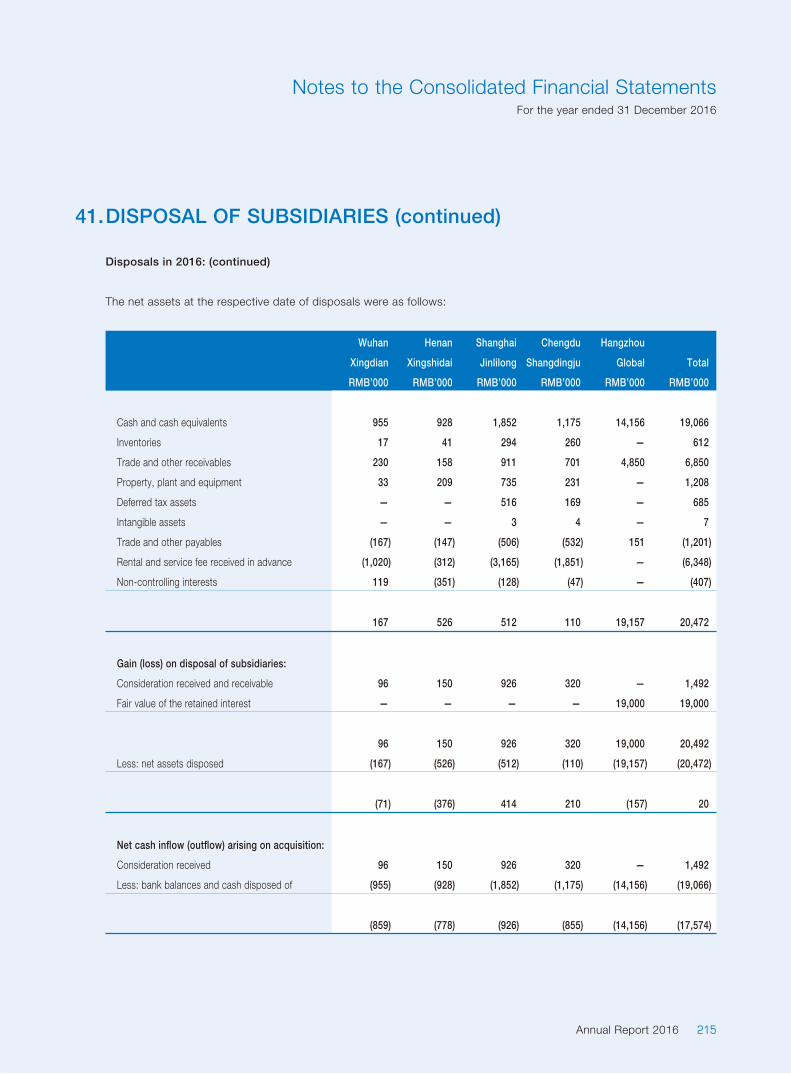
215Annual Report 2016
Notes to the Consolidated Financial StatementsFor the year ended 31 December 2016
41. DISPOSAL OF SUBSIDIARIES (continued)
Disposals in 2016: (continued)
The net assets at the respective date of disposals were as follows:
Wuhan
Xingdian
Henan
Xingshidai
Shanghai
Jinlilong
Chengdu
Shangdingju
Hangzhou
Global Total
RMB’000 RMB’000 RMB’000 RMB’000 RMB’000 RMB’000
Cash and cash equivalents 955 928 1,852 1,175 14,156 19,066
Inventories 17 41 294 260 — 612
Trade and other receivables 230 158 911 701 4,850 6,850
Property, plant and equipment 33 209 735 231 — 1,208
Deferred tax assets — — 516 169 — 685
Intangible assets — — 3 4 — 7
Trade and other payables (167) (147) (506) (532) 151 (1,201)
Rental and service fee received in advance (1,020) (312) (3,165) (1,851) — (6,348)
Non-controlling interests 119 (351) (128) (47) — (407)
167 526 512 110 19,157 20,472
Gain (loss) on disposal of subsidiaries:
Consideration received and receivable 96 150 926 320 — 1,492
Fair value of the retained interest — — — — 19,000 19,000
96 150 926 320 19,000 20,492
Less: net assets disposed (167) (526) (512) (110) (19,157) (20,472)
(71) (376) 414 210 (157) 20
Net cash infl ow (outfl ow) arising on acquisition:
Consideration received 96 150 926 320 — 1,492
Less: bank balances and cash disposed of (955) (928) (1,852) (1,175) (14,156) (19,066)
(859) (778) (926) (855) (14,156) (17,574)

216 Red Star Macalline Group Corporation Ltd.
Notes to the Consolidated Financial StatementsFor the year ended 31 December 2016
41. DISPOSAL OF SUBSIDIARIES (continued)
Disposals in 2015:
Disposal of Wuhan Zhengda
In November 2015, the Group disposed 18% equity interest in its subsidiary, Wuhan Zhengda, to a third party for a
cash consideration of RMB9,000,000. After the disposal, the Group held 40% equity interest in Wuhan Zhengda and
accounted for as interest in an associate.
Disposal of 上海景旺裝飾設計工程有限公司
Shanghai Jingwang Home Decorating Design Company Limited (“Shanghai Jingwang”)
In December 2015, the Group disposed 65% equity interest in its subsidiary, Shanghai Jingwang, to a third party for a
cash consideration of RMB191,000.
Disposal of 上海臻星裝飾工程有限公司
Shanghai Zhenxing Home Decorating Company Limited (“Shanghai Zhenxing”)
In December 2015, the Group disposed 70% equity interest in its subsidiary, Shanghai Zhenxing, to a third party for a
cash consideration of RMB56,000.
Disposal of 成都心屋裝飾工程設計有限公司
Chengdu Xinwu Home Decorating Design Company Limited (“Chengdu Xinwu”)
In December 2015, the Group disposed 65% equity interest in its subsidiary, Chengdu Xinwu, to a third party for a cash
consideration of RMB1 yuan.

217Annual Report 2016
Notes to the Consolidated Financial StatementsFor the year ended 31 December 2016
41. DISPOSAL OF SUBSIDIARIES (continued)
Disposals in 2015: (continued)
The net assets at the respective date of disposals were as follows:
Wuhan
Zhengda
Shanghai
Jingwang
Shanghai
Zhenxing
Chengdu
Xinwu Total
RMB’000 RMB’000 RMB’000 RMB’000 RMB’000
Cash and cash equivalents 303 1,300 695 2,837 5,135
Inventories 2 262 20 691 975
Trade and other receivables 66,009 931 766 1,137 68,843
Property, plant and equipment 481 228 59 156 924
Deferred tax assets 47 1,176 1,067 1,282 3,572
Other non-current assets 49,636 — — — 49,636
Trade and other payables (67,023) (2,936) (2,808) (9,300) (82,067)
Non-controlling interests (20,771) (336) 60 1,346 (19,701)
28,684 625 (141) (1,851) 27,317
Gain (loss) on disposal of subsidiary:
Consideration received and receivable 9,000 191 56 — 9,247
Fair value of the retained interest 20,000 — — — 20,000
29,000 191 56 — 29,247
Less: net assets disposed (28,684) (625) 141 1,851 (27,317)
316 (434) 197 1,851 1,930
Net cash infl ow (outfl ow) arising on acquisition:
Consideration received 9,000 191 56 — 9,247
Less: bank balances and cash disposed of (303) (1,300) (695) (2,837) (5,135)
8,697 (1,109) (639) (2,837) 4,112

218 Red Star Macalline Group Corporation Ltd.
Notes to the Consolidated Financial StatementsFor the year ended 31 December 2016
42. PLEDGED ASSETS
The following assets were pledged to secure certain bank and other borrowings, and banking facilities granted to the
Group as set out in note 32 at the end of the reporting period:
2016 2015
RMB’000 RMB’000
Investment properties 54,814,000 45,009,000
Restricted bank deposits 70,461 69,126
54,884,461 45,078,126
43. CAPITAL COMMITMENTS
2016 2015
RMB’000 RMB’000
Contracted but not provided for in the consolidated fi nancial statements:
— Capital expenditure in respect of acquisition and construction
of investment properties (including through acquisition of subsidiaries) 4,359,469 2,483,600
In addition, the Group has entered into agreements with its partners, pursuant to which the Group’s commitments to
contribute funds for development of investment properties jointly with the partners amounted to RMB1,342,613,000 as
at 31 December 2015.

219Annual Report 2016
Notes to the Consolidated Financial StatementsFor the year ended 31 December 2016
44. OPERATING LEASES
The Group as lessee
Minimum lease payments paid under operating leases during the year ended 31 December 2016 was RMB591,560,000
(2015: RMB577,570,000). The Group leases various shopping malls under non-cancellable operating lease agreements.
The lease terms are from 1 to 20 years, and the majority of lease agreements are renewable at the end of the lease
period at market rate.
At the end of the reporting period, the Group had commitments for future minimum lease payments under non-
cancellable operating leases which fall due as follows:
2016 2015
RMB’000 RMB’000
Within one year 529,273 551,469
In the second to fi fth years inclusive 1,911,516 2,114,832
Over fi ve years 2,658,477 3,235,381
5,099,266 5,901,682
The Group as lessor
Property rental and management fee income earned during the year ended 31 December 2016 was RMB5,870,675,000
(2015: RMB5,259,961,000). The properties held by the Group for rental purpose have committed tenants from 6 to 18
months, most of which are fi xed rental.
At the end of the reporting period, the Group had contracted with tenants for the following future minimum lease
payments under non-cancellable operating leases:
2016 2015
RMB’000 RMB’000
Within one year 3,280,715 2,356,705
In the second year 258,927 64,242
3,539,642 2,420,947
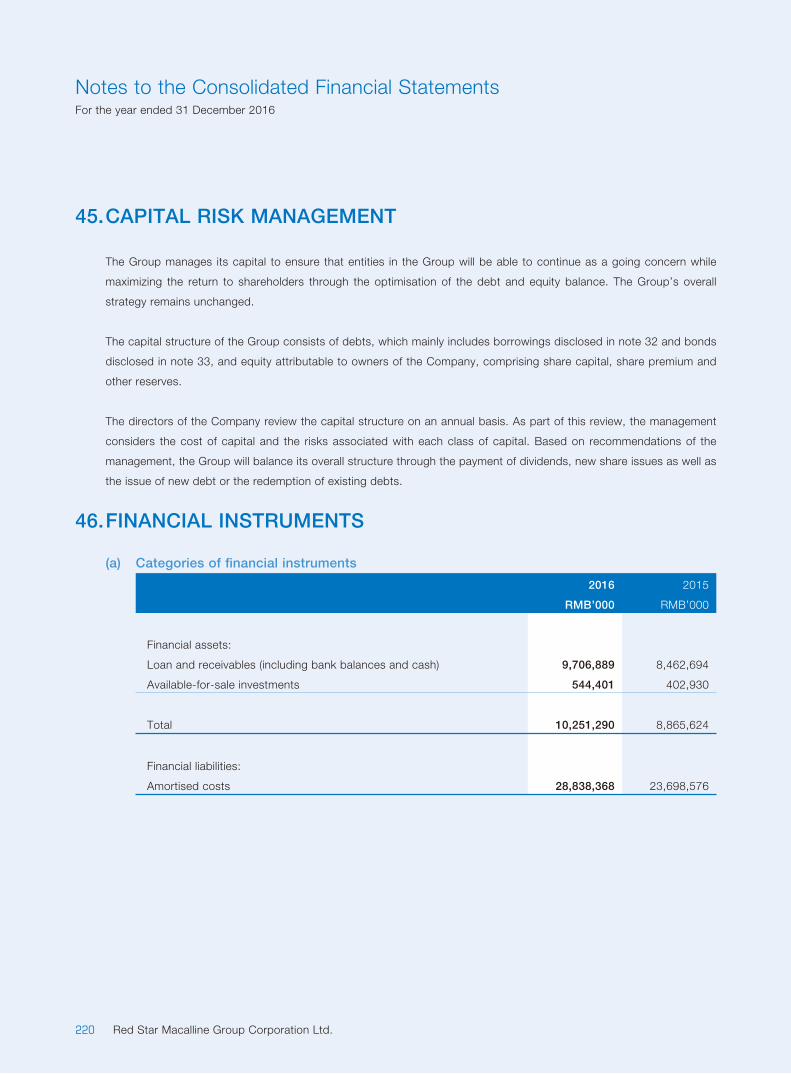
220 Red Star Macalline Group Corporation Ltd.
Notes to the Consolidated Financial StatementsFor the year ended 31 December 2016
45. CAPITAL RISK MANAGEMENT
The Group manages its capital to ensure that entities in the Group will be able to continue as a going concern while
maximizing the return to shareholders through the optimisation of the debt and equity balance. The Group’s overall
strategy remains unchanged.
The capital structure of the Group consists of debts, which mainly includes borrowings disclosed in note 32 and bonds
disclosed in note 33, and equity attributable to owners of the Company, comprising share capital, share premium and
other reserves.
The directors of the Company review the capital structure on an annual basis. As part of this review, the management
considers the cost of capital and the risks associated with each class of capital. Based on recommendations of the
management, the Group will balance its overall structure through the payment of dividends, new share issues as well as
the issue of new debt or the redemption of existing debts.
46. FINANCIAL INSTRUMENTS
(a) Categories of fi nancial instruments
2016 2015
RMB’000 RMB’000
Financial assets:
Loan and receivables (including bank balances and cash) 9,706,889 8,462,694
Available-for-sale investments 544,401 402,930
Total 10,251,290 8,865,624
Financial liabilities:
Amortised costs 28,838,368 23,698,576
221Annual Report 2016
Notes to the Consolidated Financial StatementsFor the year ended 31 December 2016
46. FINANCIAL INSTRUMENTS (continued)
(b) Financial risk management objectives and policies
The Group’s major fi nancial assets and liabilities include available-for-sale investments, loan receivables, trade
and other receivables, restricted bank deposits, bank balances and cash, trade and other payables, bank and
other borrowings, bonds and obligations under fi nance leases. Details of these fi nancial instruments are set out
in respective notes. The risks associated with these fi nancial instruments and the policies on how to mitigate
these risks are set out below. The management of the Group manages and monitors these exposures to ensure
appropriate measures are implemented on a timely and effective manner.
Market risk
The Group’s activities expose primarily to the market risks of changes in interest rates. There has been no change
in the Group’s exposure to these risks or the manner in which it manages and measures the risks.
(i) Currency risk
The Group collects all of its revenue in RMB and incurs almost all of its expenditures in RMB. A small portion
of bank balances and cash of the Group are denominated in Hong Kong dollars (“HKD”) and United States
dollars (“USD”). The Group pays all dividends in respect of H shares in HKD. The Group currently does not
have a foreign currency hedging policy as the directors of the Company consider that the foreign exchange
risk exposure of the Group is minimal. However, the Group monitors currency risk exposure by periodically
reviewing foreign currency exchange rates and will consider hedging signifi cant foreign currency exposure
should the need arise.
No sensitivity analysis has been presented as the directors of the Company consider that the foreign
exchange risk exposure of the Group is minimal.
(ii) Interest risk
The Group is exposed to cash fl ow interest rate risk due to the fl uctuation of the prevailing market interest
rates on bank balances, restricted bank deposits, loan receivables and bank and other borrowings which
carry at prevailing deposit interest rates or variable interest rates based on the interest rates quoted by the
People’s Bank of China.
The Group’s fair value interest rate risk relates primarily to its fi xed rate bank and other borrowings as well
as bonds. The Group currently does not use any derivative contracts to hedge its exposure to interest rate
risk. However, the Group monitors fair value interest rate risk exposure by closely monitoring the fair value
interest rate risk profi le and will consider hedging signifi cant interest rate exposure should the need arise.
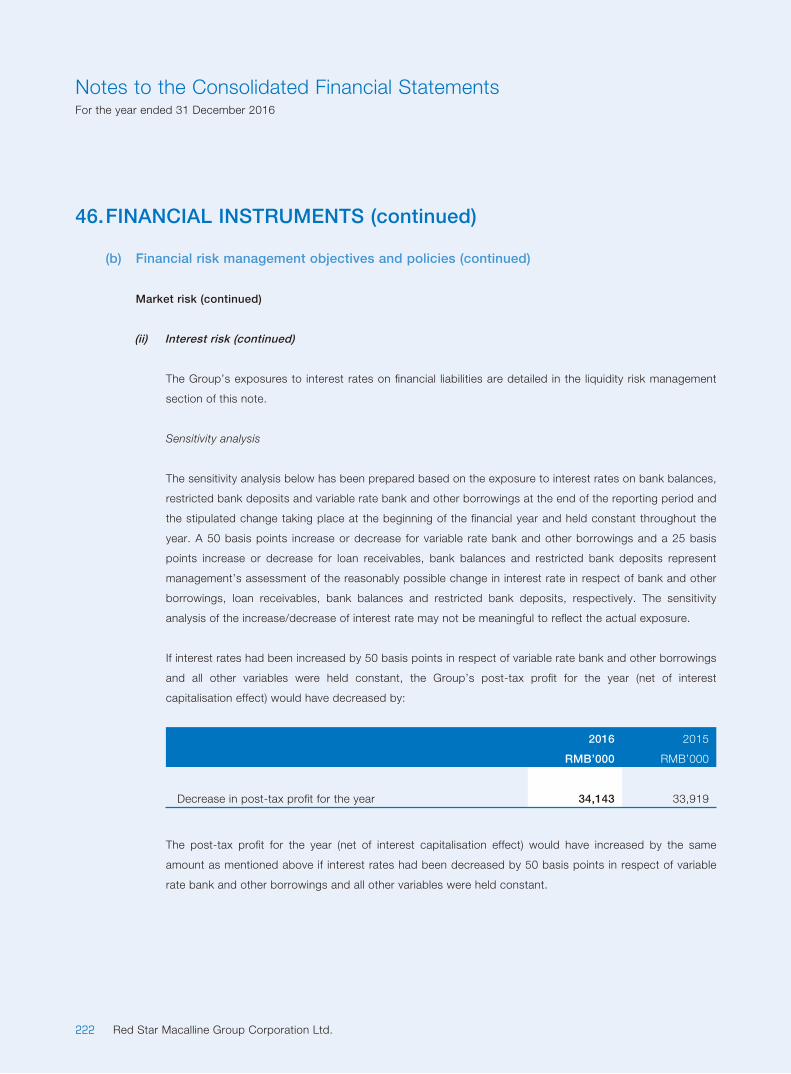
222 Red Star Macalline Group Corporation Ltd.
Notes to the Consolidated Financial StatementsFor the year ended 31 December 2016
46. FINANCIAL INSTRUMENTS (continued)
(b) Financial risk management objectives and policies (continued)
Market risk (continued)
(ii) Interest risk (continued)
The Group’s exposures to interest rates on fi nancial liabilities are detailed in the liquidity risk management
section of this note.
Sensitivity analysis
The sensitivity analysis below has been prepared based on the exposure to interest rates on bank balances,
restricted bank deposits and variable rate bank and other borrowings at the end of the reporting period and
the stipulated change taking place at the beginning of the fi nancial year and held constant throughout the
year. A 50 basis points increase or decrease for variable rate bank and other borrowings and a 25 basis
points increase or decrease for loan receivables, bank balances and restricted bank deposits represent
management’s assessment of the reasonably possible change in interest rate in respect of bank and other
borrowings, loan receivables, bank balances and restricted bank deposits, respectively. The sensitivity
analysis of the increase/decrease of interest rate may not be meaningful to refl ect the actual exposure.
If interest rates had been increased by 50 basis points in respect of variable rate bank and other borrowings
and all other variables were held constant, the Group’s post-tax profi t for the year (net of interest
capitalisation effect) would have decreased by:
2016 2015
RMB’000 RMB’000
Decrease in post-tax profi t for the year 34,143 33,919
The post-tax profi t for the year (net of interest capitalisation effect) would have increased by the same
amount as mentioned above if interest rates had been decreased by 50 basis points in respect of variable
rate bank and other borrowings and all other variables were held constant.
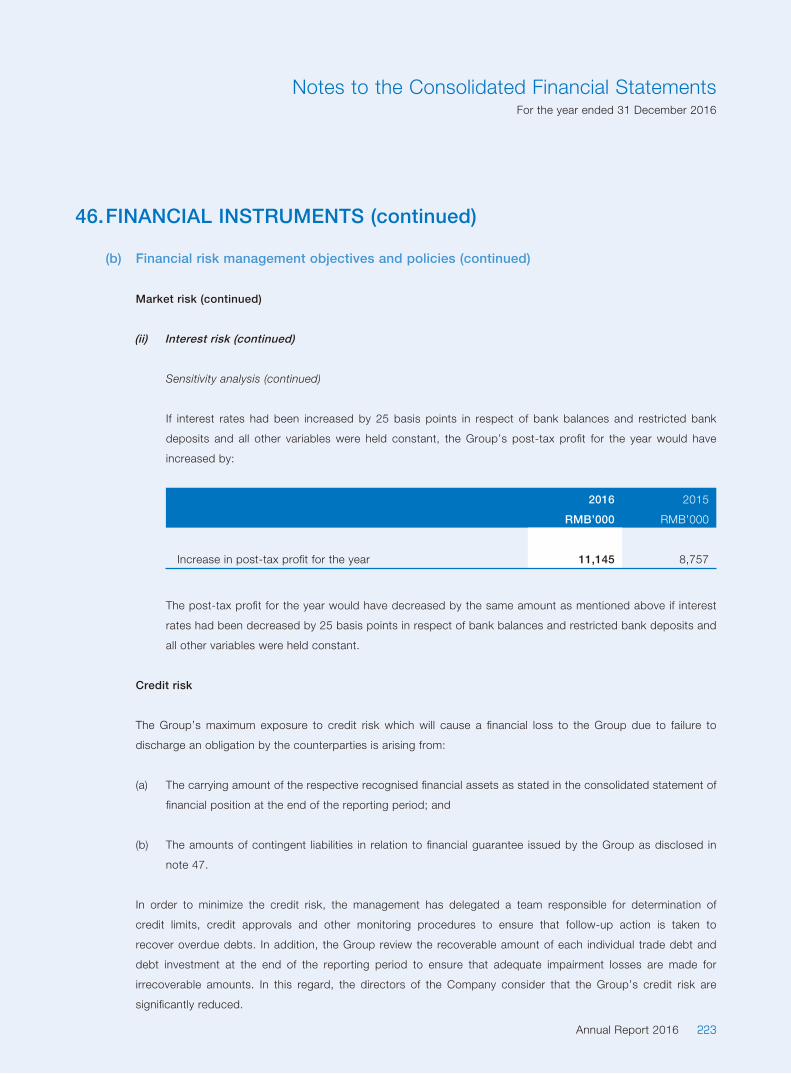
223Annual Report 2016
Notes to the Consolidated Financial StatementsFor the year ended 31 December 2016
46. FINANCIAL INSTRUMENTS (continued)
(b) Financial risk management objectives and policies (continued)
Market risk (continued)
(ii) Interest risk (continued)
Sensitivity analysis (continued)
If interest rates had been increased by 25 basis points in respect of bank balances and restricted bank
deposits and all other variables were held constant, the Group’s post-tax profi t for the year would have
increased by:
2016 2015
RMB’000 RMB’000
Increase in post-tax profi t for the year 11,145 8,757
The post-tax profi t for the year would have decreased by the same amount as mentioned above if interest
rates had been decreased by 25 basis points in respect of bank balances and restricted bank deposits and
all other variables were held constant.
Credit risk
The Group’s maximum exposure to credit risk which will cause a fi nancial loss to the Group due to failure to
discharge an obligation by the counterparties is arising from:
(a) The carrying amount of the respective recognised fi nancial assets as stated in the consolidated statement of
fi nancial position at the end of the reporting period; and
(b) The amounts of contingent liabilities in relation to fi nancial guarantee issued by the Group as disclosed in
note 47.
In order to minimize the credit risk, the management has delegated a team responsible for determination of
credit limits, credit approvals and other monitoring procedures to ensure that follow-up action is taken to
recover overdue debts. In addition, the Group review the recoverable amount of each individual trade debt and
debt investment at the end of the reporting period to ensure that adequate impairment losses are made for
irrecoverable amounts. In this regard, the directors of the Company consider that the Group’s credit risk are
signifi cantly reduced.

224 Red Star Macalline Group Corporation Ltd.
Notes to the Consolidated Financial StatementsFor the year ended 31 December 2016
46. FINANCIAL INSTRUMENTS (continued)
(b) Financial risk management objectives and policies (continued)
Credit risk (continued)
The Group doesn’t have signifi cant concentration of credit risk on trade receivables as trade receivables consist of
a large number of customers, spread across diverse geographical areas.
The Group has concentration of credit risk on the Group’s amounts due from related parties. However, the credit
risk on amounts due from related parties is limited as the related parties are at a good fi nancial position.
The Group has concentration of credit risk on liquid funds which are deposited with several banks. However, the
credit risk on liquid funds is limited because the counterparties are banks with high credit ratings assigned by
international credit-rating agencies.
Liquidity risk
The directors of the Company have built an appropriate liquidity risk management framework to meet the Group’s
short, medium and long-term funding and liquidity management requirements. The Group manages liquidity risk
by maintaining adequate reserves, banking facilities and reserve borrowing facilities, by continuously monitoring
forecast and actual cash fl ows and matching the maturity profi les of fi nancial assets and liabilities.
In addition, the following table details the Group’s remaining contractual maturity for its non-derivative fi nancial
liabilities based on the agreed repayment terms. The table has been drawn up based on the undiscounted cash
fl ows of fi nancial liabilities based on the earliest date on which the Group can be required to pay. The table
includes both interest and principal cash fl ows.
The amounts included below for variable interest rate instruments for non-derivative fi nancial liabilities are subject
to change if changes in variable interest rates different to those estimates of interest rates determined at the end
of each year.

225Annual Report 2016
Notes to the Consolidated Financial StatementsFor the year ended 31 December 2016
46. FINANCIAL INSTRUMENTS (continued)
(b) Financial risk management objectives and policies (continued)
Liquidity risk (continued)
Weighted
effective
average
interest rate
On demand
or less than
1 year
1 year to
2 years
2 years to
5 years
Over
5 years
Total
undiscounted
cash fl ows
Carrying
amount
% RMB’000 RMB’000 RMB’000 RMB’000 RMB’000 RMB’000
As at 31 December
2016
Trade and other payables 5,804,254 — — — 5,804,254 5,804,254
Other non-current
liabilities — 739,537 65,145 251,337 1,056,019 1,056,019
Bank and other borrowings
— fi xed rate 5.05 85,692 1,261,406 209,588 29,624 1,586,310 1,510,010
Bank and other borrowings
— variable rate 5.10 2,838,043 2,252,012 3,413,493 1,716,000 10,219,548 9,724,823
Bonds 4.95 2,414,340 5,879,350 2,248,050 1,628,700 12,170,440 10,323,569
Obligation under
fi nancial leases 6.33 36,183 31,249 93,747 833,309 994,488 419,693
Financial guarantee
contracts 273,000 — — — 273,000 —
11,451,512 10,163,554 6,030,023 4,458,970 32,104,059 28,838,368
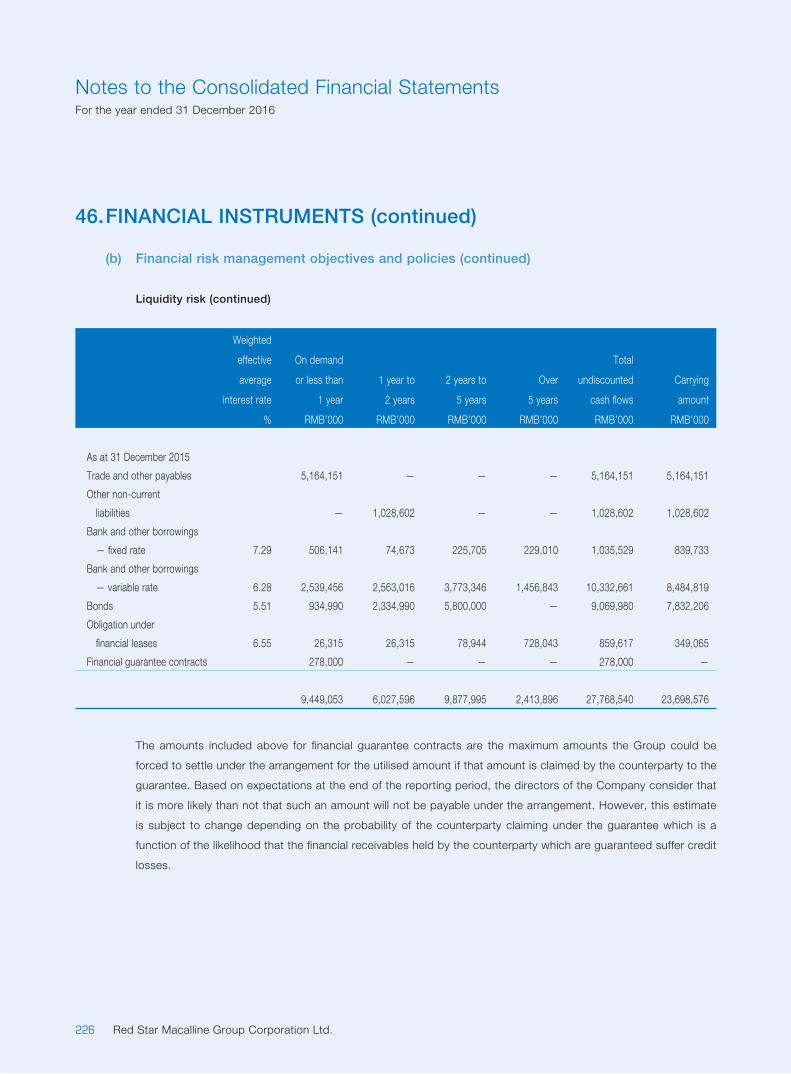
226 Red Star Macalline Group Corporation Ltd.
Notes to the Consolidated Financial StatementsFor the year ended 31 December 2016
46. FINANCIAL INSTRUMENTS (continued)
(b) Financial risk management objectives and policies (continued)
Liquidity risk (continued)
Weighted
effective
average
interest rate
On demand
or less than
1 year
1 year to
2 years
2 years to
5 years
Over
5 years
Total
undiscounted
cash fl ows
Carrying
amount
% RMB’000 RMB’000 RMB’000 RMB’000 RMB’000 RMB’000
As at 31 December 2015
Trade and other payables 5,164,151 — — — 5,164,151 5,164,151
Other non-current
liabilities — 1,028,602 — — 1,028,602 1,028,602
Bank and other borrowings
— fi xed rate 7.29 506,141 74,673 225,705 229,010 1,035,529 839,733
Bank and other borrowings
— variable rate 6.28 2,539,456 2,563,016 3,773,346 1,456,843 10,332,661 8,484,819
Bonds 5.51 934,990 2,334,990 5,800,000 — 9,069,980 7,832,206
Obligation under
fi nancial leases 6.55 26,315 26,315 78,944 728,043 859,617 349,065
Financial guarantee contracts 278,000 — — — 278,000 —
9,449,053 6,027,596 9,877,995 2,413,896 27,768,540 23,698,576
The amounts included above for fi nancial guarantee contracts are the maximum amounts the Group could be
forced to settle under the arrangement for the utilised amount if that amount is claimed by the counterparty to the
guarantee. Based on expectations at the end of the reporting period, the directors of the Company consider that
it is more likely than not that such an amount will not be payable under the arrangement. However, this estimate
is subject to change depending on the probability of the counterparty claiming under the guarantee which is a
function of the likelihood that the fi nancial receivables held by the counterparty which are guaranteed suffer credit
losses.
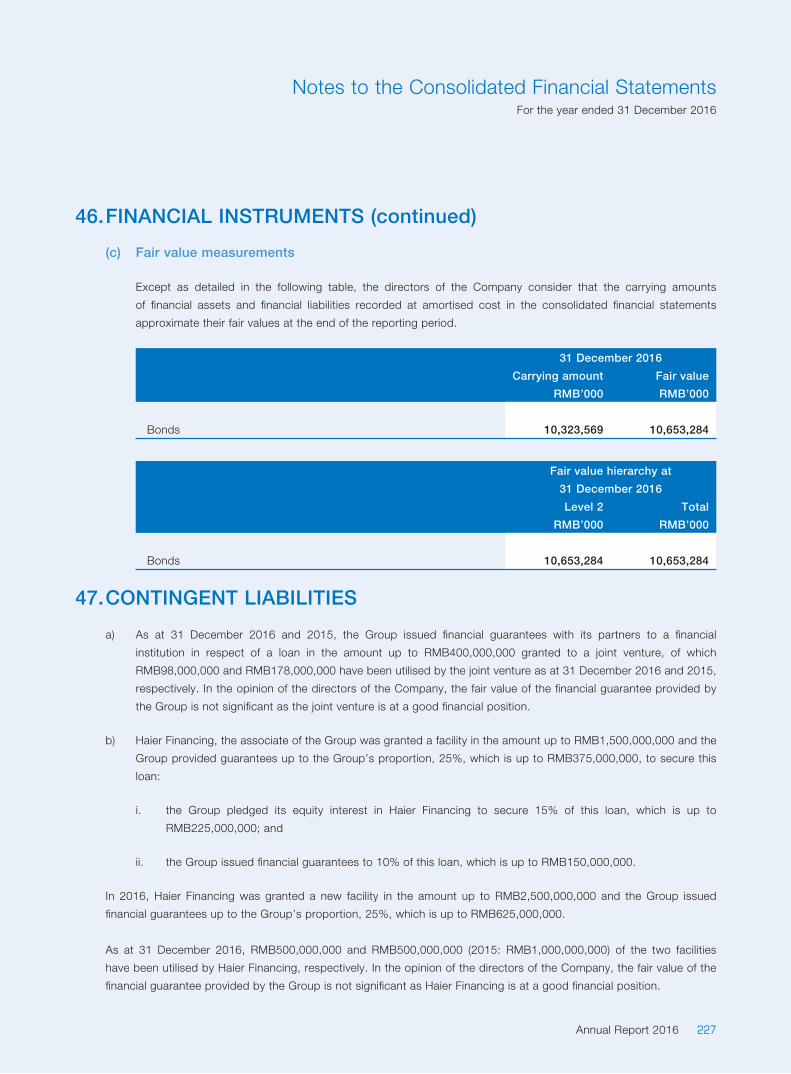
227Annual Report 2016
Notes to the Consolidated Financial StatementsFor the year ended 31 December 2016
46. FINANCIAL INSTRUMENTS (continued)
(c) Fair value measurements
Except as detailed in the following table, the directors of the Company consider that the carrying amounts
of fi nancial assets and fi nancial liabilities recorded at amortised cost in the consolidated fi nancial statements
approximate their fair values at the end of the reporting period.
31 December 2016
Carrying amount Fair value
RMB’000 RMB’000
Bonds 10,323,569 10,653,284
Fair value hierarchy at
31 December 2016
Level 2 Total
RMB’000 RMB’000
Bonds 10,653,284 10,653,284
47. CONTINGENT LIABILITIES
a) As at 31 December 2016 and 2015, the Group issued fi nancial guarantees with its partners to a fi nancial
institution in respect of a loan in the amount up to RMB400,000,000 granted to a joint venture, of which
RMB98,000,000 and RMB178,000,000 have been utilised by the joint venture as at 31 December 2016 and 2015,
respectively. In the opinion of the directors of the Company, the fair value of the fi nancial guarantee provided by
the Group is not signifi cant as the joint venture is at a good fi nancial position.
b) Haier Financing, the associate of the Group was granted a facility in the amount up to RMB1,500,000,000 and the
Group provided guarantees up to the Group’s proportion, 25%, which is up to RMB375,000,000, to secure this
loan:
i. the Group pledged its equity interest in Haier Financing to secure 15% of this loan, which is up to
RMB225,000,000; and
ii. the Group issued fi nancial guarantees to 10% of this loan, which is up to RMB150,000,000.
In 2016, Haier Financing was granted a new facility in the amount up to RMB2,500,000,000 and the Group issued
fi nancial guarantees up to the Group’s proportion, 25%, which is up to RMB625,000,000.
As at 31 December 2016, RMB500,000,000 and RMB500,000,000 (2015: RMB1,000,000,000) of the two facilities
have been utilised by Haier Financing, respectively. In the opinion of the directors of the Company, the fair value of the
fi nancial guarantee provided by the Group is not signifi cant as Haier Financing is at a good fi nancial position.
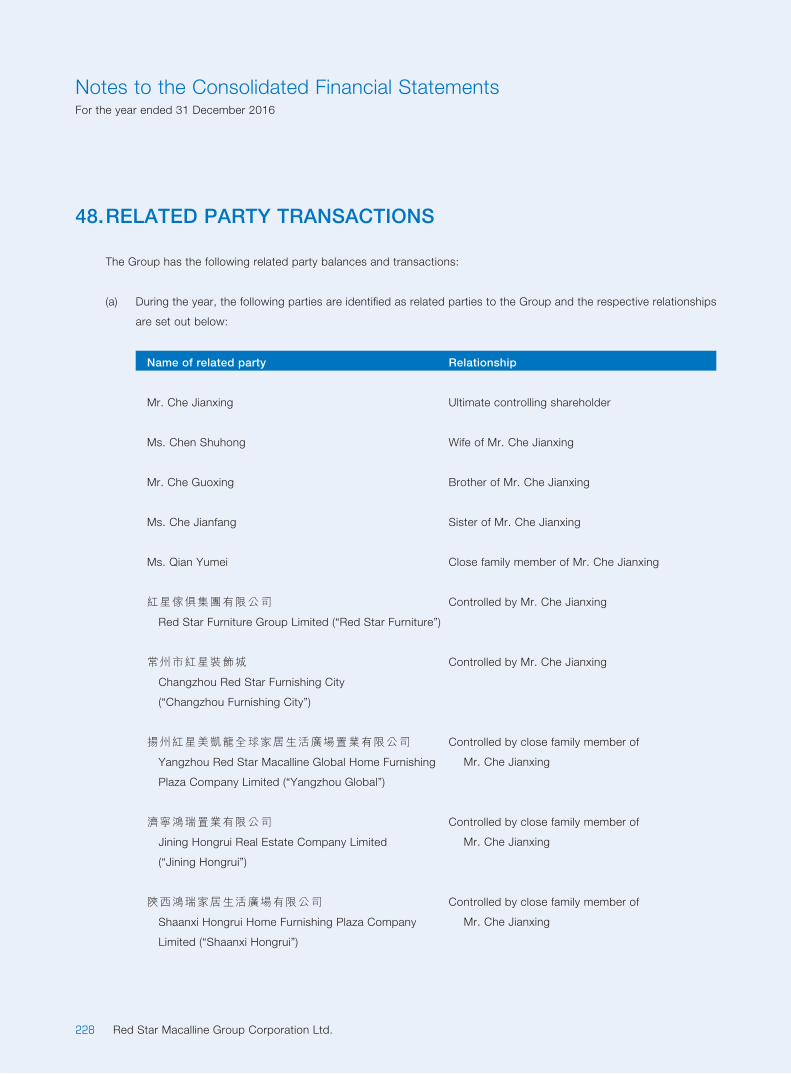
228 Red Star Macalline Group Corporation Ltd.
Notes to the Consolidated Financial StatementsFor the year ended 31 December 2016
48. RELATED PARTY TRANSACTIONS
The Group has the following related party balances and transactions:
(a) During the year, the following parties are identifi ed as related parties to the Group and the respective relationships
are set out below:
Name of related party Relationship
Mr. Che Jianxing Ultimate controlling shareholder
Ms. Chen Shuhong Wife of Mr. Che Jianxing
Mr. Che Guoxing Brother of Mr. Che Jianxing
Ms. Che Jianfang Sister of Mr. Che Jianxing
Ms. Qian Yumei Close family member of Mr. Che Jianxing
紅星傢俱集團有限公司
Red Star Furniture Group Limited (“Red Star Furniture”)
Controlled by Mr. Che Jianxing
常州市紅星裝飾城
Changzhou Red Star Furnishing City
(“Changzhou Furnishing City”)
Controlled by Mr. Che Jianxing
揚州紅星美凱龍全球家居生活廣場置業有限公司
Yangzhou Red Star Macalline Global Home Furnishing
Plaza Company Limited (“Yangzhou Global”)
Controlled by close family member of
Mr. Che Jianxing
濟寧鴻瑞置業有限公司
Jining Hongrui Real Estate Company Limited
(“Jining Hongrui”)
Controlled by close family member of
Mr. Che Jianxing
陝西鴻瑞家居生活廣場有限公司
Shaanxi Hongrui Home Furnishing Plaza Company
Limited (“Shaanxi Hongrui”)
Controlled by close family member of
Mr. Che Jianxing

229Annual Report 2016
Notes to the Consolidated Financial StatementsFor the year ended 31 December 2016
Name of related party Relationship
徐州紅星美凱龍國際傢俱裝飾城有限公司
Xuzhou Red Star Macalline International Home
Furnishing City Company Limited (“Xuzhou
International”)
Controlled by close family member of
Mr. Che Jianxing
徐州紅星美凱龍全球家居生活廣場有限公司
Xuzhou Red Star Macalline Global Home Furnishing
Plaza Company Limited (“Xuzhou Global”)
Controlled by close family member of
Mr. Che Jianxing
興化市星凱家居生活廣場有限公司
Xinghua Xingkai Home Furnishing Plaza
Company Limited (“Xinghua Xingkai”)
Signifi cantly infl uenced by close family member of
Mr. Che Jianxing
RSM Holding Ultimate holding company
RSM Enterprise Development Group Under common control of RSM Holding
金科地產集團股份有限公司
Jinke Property Group Company Limited
(“Jinke Property”)
Signifi cantly infl uenced by key management
personnel of the Company
上海名藝商業企業發展有限公司及其子公司
Shanghai Mingyi Enterprise Development
Company Limited and its subsidiary
(collectively “Shanghai Mingyi”)
A joint venture of the Group
Chengdu Dongtai A joint venture of the Group
西安紅星佳鑫家居有限責任公司
Xi’an Red Jiaxin Star Home Furnishing
Company Limited (“Xi’an Jiaxin”)
A joint venture of the Group
48. RELATED PARTY TRANSACTIONS (continued)
(a) During the year, the following parties are identifi ed as related parties to the Group and the respective relationships
are set out below: (continued)

230 Red Star Macalline Group Corporation Ltd.
Notes to the Consolidated Financial StatementsFor the year ended 31 December 2016
Name of related party Relationship
Xiamen Baoxiang A joint venture of the Group
Suzhou Zhongxiang An associate of the Group (note)
Wuhan Zhengda An associate of the Group (note)
Haier Financing An associate of the Group
Shenzhen Red Star An associate of the Group
Hangzhou Red Star An associate of the Group
寧波澳洋家居購物廣場有限公司
Ningbo Aoyang Home Shopping Plaza
Company Limited (“Ningbo Aoyang”)
Signifi cantly infl uenced by key management
personnel of the Company
寧波隆凱家居生活購物有限公司
Ningbo Longkai Home Living Shopping
Company Limited (“Ningbo Longkai “)
Signifi cantly infl uenced by key management
personnel of the Company
株洲紅星新安居實業有限公司
Zhuzhou Red Star Xin An Ju Industrial
Company Limited (“Zhuzhou Red Star”)
Signifi cantly infl uenced by key management
personnel of the Company
Note: Suzhou Zhongxiang ceased to be an associate and became a subsidiary in July 2015, details of which are set out in note 40. Wuhan
Zhengda ceased to be a subsidiary and became an associate in November 2015, details of which are set out in note 41.
48. RELATED PARTY TRANSACTIONS (continued)
(a) During the year, the following parties are identifi ed as related parties to the Group and the respective relationships
are set out below: (continued)

231Annual Report 2016
Notes to the Consolidated Financial StatementsFor the year ended 31 December 2016
48. RELATED PARTY TRANSACTIONS (continued)
(b) During the year, the Group has the transactions with following related parties and the details are set out below:
2016 2015
RMB’000 RMB’000
Initiation and entrance fees and annual management fee received and
receivable from following related parties:
— Yangzhou Global* 1,979 2,000
— Jining Hongrui* 3,831 4,000
— Shaanxi Hongrui* 2,887 3,000
— Xuzhou International* 1,443 1,520
— Xuzhou Global* 2,406 2,480
— Xinghua Xingkai 1,386 5,810
— RSM Enterprise Development Group 7,272 11,507
— Shanghai Mingyi 2,887 3,000
24,091 33,317
Rental income from:
— Ms. Qian Yumei 1,225 1,119
1,225 1,119
Commission income regarding pre-paid cards:
— Xuzhou Global 3 —
— Shaanxi Hongrui 2 —
— Chengdu Dongtai 26 —
— Shanghai Mingyi 27 —
58 —
Rental expenses paid and payable to:
— Changzhou Furnishing City* 15,951 15,500
— Mr. Che Guoxing 336 336
— RSM Enterprise Development Group* 4,667 —
— Jinke Property — 9,921
20,954 25,757
* These transactions are continuing connected transaction as defi ned in Chapter 14A of Listing Rules.
Acquisition/disposal of equity interests with related parties:
During the year ended 31 December 2015, the Group acquired Suzhou Kairun and RSM Industrial from RSM
Enterprise Development, details of which are set out in note 40.

232 Red Star Macalline Group Corporation Ltd.
Notes to the Consolidated Financial StatementsFor the year ended 31 December 2016
48. RELATED PARTY TRANSACTIONS (continued)
(c) At the end of the reporting period, the Group has provided guarantees or assets pledge to, or obtained
guarantees provided by the following related parties and the details are set out below:
(i) Guarantees provided to following related parties for banking facilities granted:
2016 2015
RMB’000 RMB’000
Chengdu Dongtai (note 47) 98,000 178,000
Haier Financing (note 47) 175,000 100,000
273,000 278,000
(ii) Assets pledged in respect of the mortgage loans provided by the banks to related parties:
Equity interest pledged
As at 31 December 2016 and 2015, the Group has pledged its equity interest in Haier Financing to secure
15% of the loan granted to Haier Financing in the amount up to RMB225,000,000, details of which are set
out in note 47.
(iii) Guarantees provided by related parties for banking facilities granted:
2016 2015
RMB’000 RMB’000
— Mr. Che Jianxing 695,000 350,000
— Mr. Che Jianxing,
— Red Star Furniture and RSM Holding 850,803 956,418
— Red Star Furniture 275,000 385,000
— RSM Holding — 110,000
1,820,803 1,801,418

233Annual Report 2016
Notes to the Consolidated Financial StatementsFor the year ended 31 December 2016
48. RELATED PARTY TRANSACTIONS (continued)
(d) At the end of the reporting period, the Group has the balances with following related parties and the details are
set out below:
2016 2015
RMB’000 RMB’000
Accounts receivable: trade nature
— Xuzhou International 30 20
— Xinghua Xingkai — 191
30 211
Other receivables: non-trade nature
— Wuhan Zhengda (note) 10 10
— RSM Enterprise Development Group (note) — 43,248
— Shanghai Mingyi (note) 97,600 88,400
— Xi’an Jiaxin (note) 50 50
— Shaanxi Hongrui (note) 8,396 12,134
— Ningbo Longkai 24,000 —
130,056 143,842
Note: The amounts are unsecured, interest free and repayable on demand.
2016 2015
RMB’000 RMB’000
Other non-current assets:
— RSM Enterprise Development Group (note 26(d)) 247,705 247,705
— Wuhan Zhengda (note) 117,092 42,092
— Hangzhou Red Star (note) 123,796 —
— Xiamen Baoxiang (note) 46,500 —
535,093 289,797
Note: The amounts are non-trade in nature, unsecured, interest free and repayable on demand after these entities become profi table. In the opinion
of the directors of the Company, the amounts are to be settled after twelve months from the end of the reporting period and are therefore
classifi ed as non-current assets.

234 Red Star Macalline Group Corporation Ltd.
Notes to the Consolidated Financial StatementsFor the year ended 31 December 2016
48. RELATED PARTY TRANSACTIONS (continued)
(d) At the end of the reporting period, the Group has the balances with following related parties and the details are
set out below: (continued)
2016 2015
RMB’000 RMB’000
Rental and service fee received in advance: trade nature
— Xuzhou Global 386 387
— Xinghua Xingkai 992 —
— RSM Enterprise Development Group 3,532 5,182
— Ms. Qian Yumei 46 22
— Shanghai Mingyi 684 684
— Ningbo Aoyang 1,039 —
6,679 6,275
2016 2015
RMB’000 RMB’000
Other payables:
— RSM Enterprise Development Group
— acquisition related (note i) 30,989 175,572
— RSM Enterprise Development Group
— other (note ii) 1,560 204,596
— Shenzhen Red Star (note ii) 11,545 24,246
— Ningbo Aoyang 970 —
— Ningbo Longkai 4,147 —
— Zhuzhou Red Star 1,739 —
50,950 404,414
Note i: The amounts represented consideration payable to RSM Enterprise Development for acquisition of Suzhou Kairun and RSM Industrial, details
of which are set out in note 40.
Note ii: The amounts are non-trade in nature, unsecured, interest free and repayable on demand.
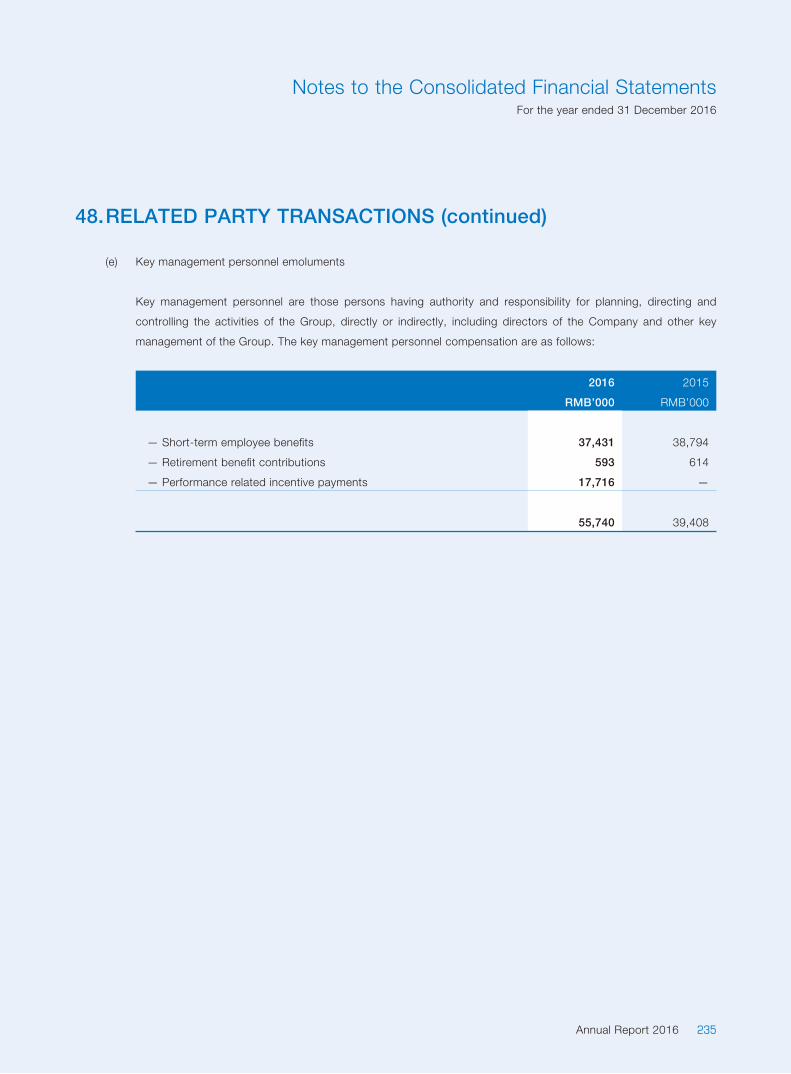
235Annual Report 2016
Notes to the Consolidated Financial StatementsFor the year ended 31 December 2016
48. RELATED PARTY TRANSACTIONS (continued)
(e) Key management personnel emoluments
Key management personnel are those persons having authority and responsibility for planning, directing and
controlling the activities of the Group, directly or indirectly, including directors of the Company and other key
management of the Group. The key management personnel compensation are as follows:
2016 2015
RMB’000 RMB’000
— Short-term employee benefi ts 37,431 38,794
— Retirement benefi t contributions 593 614
— Performance related incentive payments 17,716 —
55,740 39,408

236 Red Star Macalline Group Corporation Ltd.
Notes to the Consolidated Financial StatementsFor the year ended 31 December 2016
49. INFORMATION ABOUT THE STATEMENT OF FINANCIAL POSITION OF THE COMPANY
2016 2015
RMB’000 RMB’000
NON-CURRENT ASSETS
Property, plant and equipment 31,962 27,629
Intangible assets 425,166 536,774
Investments in subsidiaries 10,027,466 9,762,414
Investments in associates 67,517 21,850
Investment in joint ventures 276,877 261,877
Available-for-sale investments 189,051 22,400
Loan receivables 40,223 —
Loan receivables due from subsidiaries 215,644 215,644
Deferred tax assets 338,953 215,922
Other non-current assets 1,346,662 1,215,467
12,959,521 12,279,977
CURRENT ASSETS
Inventories 2,676 46
Loan receivables 72,500 30,100
Trade and other receivables 19,191,702 13,172,366
Tax recoverable 23,317 —
Restricted bank deposits 10 —
Bank balances and cash 1,605,378 2,477,919
20,895,583 15,680,431
CURRENT LIABILITIES
Trade and other payables 7,100,486 4,587,798
Rental and service fee received in advance 668,558 726,254
Tax liabilities 4,822 120,348
Bank and other borrowings 1,540,010 510,000
Bonds 1,889,468 497,195
11,203,344 6,441,595
NET CURRENT ASSETS 9,692,239 9,238,836
TOTAL ASSETS LESS CURRENT LIABILITIES 22,651,760 21,518,813

237Annual Report 2016
Notes to the Consolidated Financial StatementsFor the year ended 31 December 2016
49. INFORMATION ABOUT THE STATEMENT OF FINANCIAL POSITION OF THE COMPANY (continued)
2016 2015
RMB’000 RMB’000
NON-CURRENT LIABILITIES
Bank and other borrowings 1,460,000 1,200,000
Bonds 8,434,101 7,335,011
Deferred income — 54,016
Other non-current liabilities 376,084 682,410
10,270,185 9,271,437
NET ASSETS 12,381,575 12,247,376
CAPITAL AND RESERVES
Share capital 3,623,917 3,623,917
Share premium 5,617,001 5,617,001
Reserves 3,140,657 3,006,458
Total equity 12,381,575 12,247,376
Share premium and reserves
Share
premium
Statutory
surplus
reserve
Share
options
reserves
Retained
earnings Total
RMB’000 RMB’000 RMB’000 RMB’000 RMB’000
Balance at 1 January 2015 234,616 666,648 169,331 2,846,860 3,917,455
Profi t and total comprehensive income for the year — — — 1,813,619 1,813,619
Transfer — 184,251 — (184,251) —
Dividends (note 15) — — — (2,490,000) (2,490,000)
Issue of H shares (note 37) 5,029,741 — — — 5,029,741
Share issued (note 37) 352,644 — — — 352,644
Balance at 31 December 2015 5,617,001 850,899 169,331 1,986,228 8,623,459
Profi t and total comprehensive income for the year — — — 1,837,440 1,837,440
Transfer — 195,394 — (195,394) —
Dividends (note 15) — — — (1,703,241) (1,703,241)
Balance at 31 December 2016 5,617,001 1,046,293 169,331 1,925,033 8,757,658
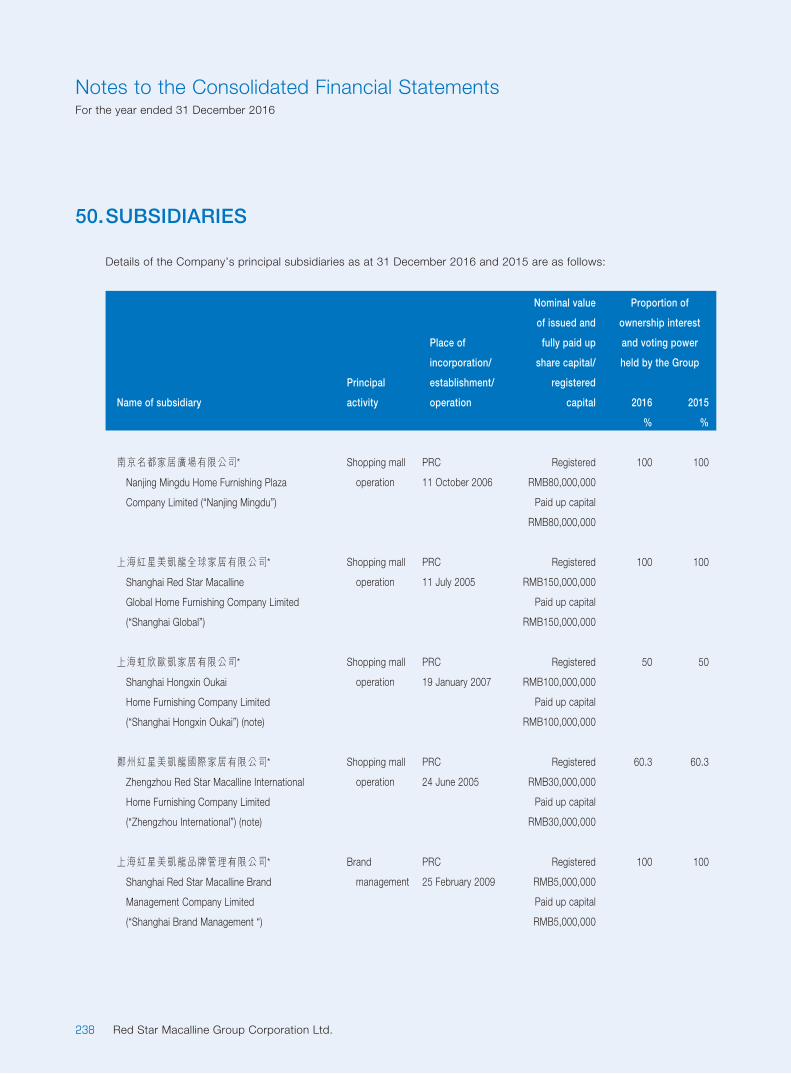
238 Red Star Macalline Group Corporation Ltd.
Notes to the Consolidated Financial StatementsFor the year ended 31 December 2016
50. SUBSIDIARIES
Details of the Company’s principal subsidiaries as at 31 December 2016 and 2015 are as follows:
Name of subsidiary
Principal
activity
Place of
incorporation/
establishment/
operation
Nominal value
of issued and
fully paid up
share capital/
registered
capital
Proportion of
ownership interest
and voting power
held by the Group
2016 2015
% %
南京名都家居廣場有限公司*
Nanjing Mingdu Home Furnishing Plaza
Company Limited (“Nanjing Mingdu”)
Shopping mall
operation
PRC
11 October 2006
Registered
RMB80,000,000
Paid up capital
RMB80,000,000
100 100
上海紅星美凱龍全球家居有限公司*
Shanghai Red Star Macalline
Global Home Furnishing Company Limited
(“Shanghai Global”)
Shopping mall
operation
PRC
11 July 2005
Registered
RMB150,000,000
Paid up capital
RMB150,000,000
100 100
上海虹欣歐凱家居有限公司*
Shanghai Hongxin Oukai
Home Furnishing Company Limited
(“Shanghai Hongxin Oukai”) (note)
Shopping mall
operation
PRC
19 January 2007
Registered
RMB100,000,000
Paid up capital
RMB100,000,000
50 50
鄭州紅星美凱龍國際家居有限公司*
Zhengzhou Red Star Macalline International
Home Furnishing Company Limited
(“Zhengzhou International”) (note)
Shopping mall
operation
PRC
24 June 2005
Registered
RMB30,000,000
Paid up capital
RMB30,000,000
60.3 60.3
上海紅星美凱龍品牌管理有限公司*
Shanghai Red Star Macalline Brand
Management Company Limited
(“Shanghai Brand Management “)
Brand
management
PRC
25 February 2009
Registered
RMB5,000,000
Paid up capital
RMB5,000,000
100 100
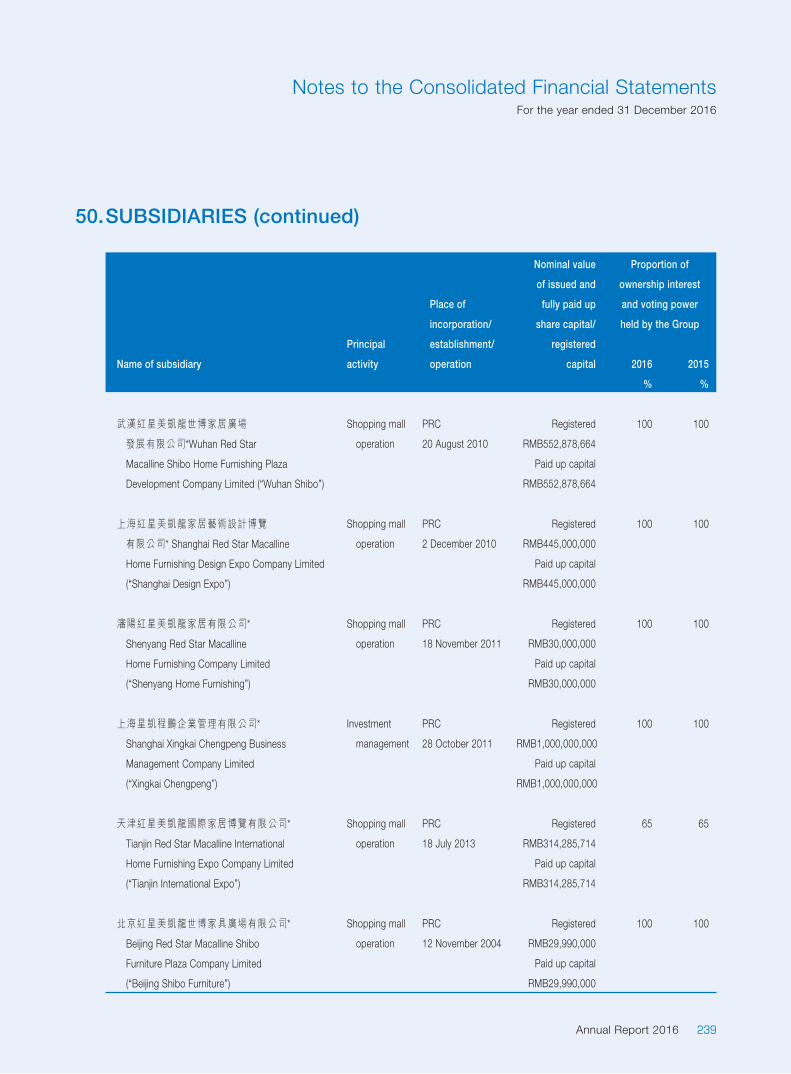
239Annual Report 2016
Notes to the Consolidated Financial StatementsFor the year ended 31 December 2016
Name of subsidiary
Principal
activity
Place of
incorporation/
establishment/
operation
Nominal value
of issued and
fully paid up
share capital/
registered
capital
Proportion of
ownership interest
and voting power
held by the Group
2016 2015
% %
武漢紅星美凱龍世博家居廣場
發展有限公司*Wuhan Red Star
Macalline Shibo Home Furnishing Plaza
Development Company Limited (“Wuhan Shibo”)
Shopping mall
operation
PRC
20 August 2010
Registered
RMB552,878,664
Paid up capital
RMB552,878,664
100 100
上海紅星美凱龍家居藝術設計博覽
有限公司* Shanghai Red Star Macalline
Home Furnishing Design Expo Company Limited
(“Shanghai Design Expo”)
Shopping mall
operation
PRC
2 December 2010
Registered
RMB445,000,000
Paid up capital
RMB445,000,000
100 100
瀋陽紅星美凱龍家居有限公司*
Shenyang Red Star Macalline
Home Furnishing Company Limited
(“Shenyang Home Furnishing”)
Shopping mall
operation
PRC
18 November 2011
Registered
RMB30,000,000
Paid up capital
RMB30,000,000
100 100
上海星凱程鵬企業管理有限公司*
Shanghai Xingkai Chengpeng Business
Management Company Limited
(“Xingkai Chengpeng”)
Investment
management
PRC
28 October 2011
Registered
RMB1,000,000,000
Paid up capital
RMB1,000,000,000
100 100
天津紅星美凱龍國際家居博覽有限公司*
Tianjin Red Star Macalline International
Home Furnishing Expo Company Limited
(“Tianjin International Expo”)
Shopping mall
operation
PRC
18 July 2013
Registered
RMB314,285,714
Paid up capital
RMB314,285,714
65 65
北京紅星美凱龍世博家具廣場有限公司*
Beijing Red Star Macalline Shibo
Furniture Plaza Company Limited
(“Beijing Shibo Furniture”)
Shopping mall
operation
PRC
12 November 2004
Registered
RMB29,990,000
Paid up capital
RMB29,990,000
100 100
50. SUBSIDIARIES (continued)
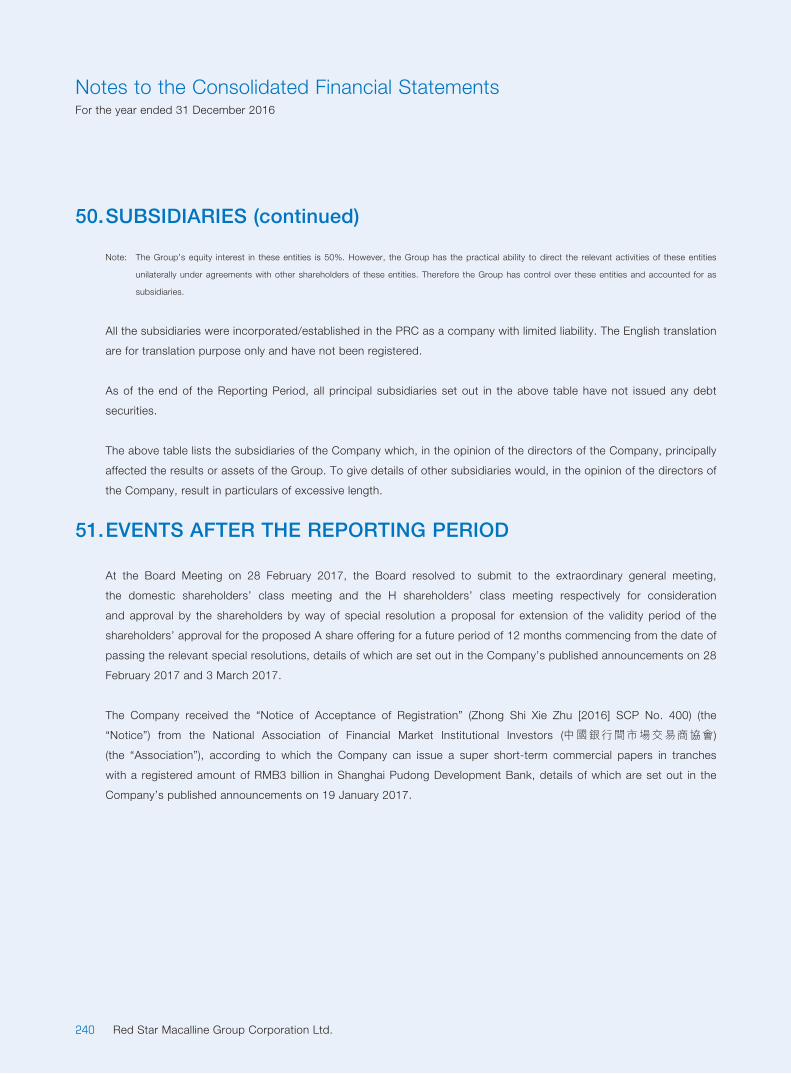
240 Red Star Macalline Group Corporation Ltd.
Notes to the Consolidated Financial StatementsFor the year ended 31 December 2016
50. SUBSIDIARIES (continued)
Note: The Group’s equity interest in these entities is 50%. However, the Group has the practical ability to direct the relevant activities of these entities
unilaterally under agreements with other shareholders of these entities. Therefore the Group has control over these entities and accounted for as
subsidiaries.
All the subsidiaries were incorporated/established in the PRC as a company with limited liability. The English translation
are for translation purpose only and have not been registered.
As of the end of the Reporting Period, all principal subsidiaries set out in the above table have not issued any debt
securities.
The above table lists the subsidiaries of the Company which, in the opinion of the directors of the Company, principally
affected the results or assets of the Group. To give details of other subsidiaries would, in the opinion of the directors of
the Company, result in particulars of excessive length.
51. EVENTS AFTER THE REPORTING PERIOD
At the Board Meeting on 28 February 2017, the Board resolved to submit to the extraordinary general meeting,
the domestic shareholders’ class meeting and the H shareholders’ class meeting respectively for consideration
and approval by the shareholders by way of special resolution a proposal for extension of the validity period of the
shareholders’ approval for the proposed A share offering for a future period of 12 months commencing from the date of
passing the relevant special resolutions, details of which are set out in the Company’s published announcements on 28
February 2017 and 3 March 2017.
The Company received the “Notice of Acceptance of Registration” (Zhong Shi Xie Zhu [2016] SCP No. 400) (the
“Notice”) from the National Association of Financial Market Institutional Investors (中國銀行間市場交易商協會)
(the “Association”), according to which the Company can issue a super short-term commercial papers in tranches
with a registered amount of RMB3 billion in Shanghai Pudong Development Bank, details of which are set out in the
Company’s published announcements on 19 January 2017.

241
Five-Year Financial Summary
Annual Report 2016
For the year ended 31 December
2016 2015 2014 2013 2012
RMB’000 RMB’000 RMB’000 RMB’000 RMB’000
Revenue 9,282,393 8,756,120 7,935,131 6,360,703 5,253,733
Profi t and total comprehensive income
for the year 4,368,410 4,369,755 3,922,004 3,269,327 2,256,597
— Owners of the Company 4,036,269 4,098,068 3,632,917 3,013,182 1,907,090
— Non-controlling interests 332,141 271,687 289,087 256,145 349,507
Earnings per share
— Basic (RMB) 1.11 1.22 1.21 1.00 0.64
— Diluted (RMB) N/A 1.22 N/A N/A N/A
As at 31 December
2016 2015 2014 2013 2012
RMB’000 RMB’000 RMB’000 RMB’000 RMB’000
— Non-current assets 83,042,606 75,328,818 66,792,413 61,901,164 55,270,616
— Current assets 8,794,876 7,860,755 5,125,479 4,959,251 5,788,227
Total Assets 91,837,482 83,189,573 71,917,892 66,860,415 61,058,843
— Current liabilities 13,547,348 10,622,807 10,419,993 9,288,047 6,887,250
— Non-current liabilities 30,602,459 27,298,562 24,084,806 23,093,779 20,987,424
Total liabilities 44,149,807 37,921,369 34,504,799 32,381,826 27,874,674
Net assets 47,687,675 45,268,204 37,413,093 34,478,589 33,184,169
Total Equity 47,687,675 45,268,204 37,413,093 34,478,589 33,184,169
— Equity attributable to owners
of the Company 43,470,625 41,144,559 33,444,992 30,635,646 29,192,659
— Non-controlling interests 4,217,050 4,123,645 3,968,101 3,842,943 3,991,510

242
Defi nitions
Red Star Macalline Group Corporation Ltd.
“AGM” the annual general meeting of the Company proposed to be convened on
Thursday, 8 June 2017
“A Share(s)” the ordinary shares(s) proposed to be issued by the Company pursuant to the A
Share Offering, with a nominal value of RMB1.00 each, which will be listed on the
Shanghai Stock Exchange and traded in RMB
“Articles of Association” articles of association of the Company (as amended from time to time)
“Associate(s)” has the meaning ascribed thereto under the Listing Rules
“Audit Committee” Audit Committee of the Board of Directors
“Board” or “Board of Directors” the board of directors of the Company
“Changzhou Macalline” Changzhou Macalline International Computer and Electronics Furnishing Plaza
Co., Ltd.* (常州美凱龍國際電腦家電裝飾城有限公司), a limited liability company
established in the PRC, which is a direct wholly-owned subsidiary of our
Company
“Changzhou RSHFC” Changzhou Red Star Home Furnishing City* (常州市紅星裝飾城), a limited liability
company established in the PRC on 13 November 1998, which is directly wholly
-owned by Mr. CHE
“Chengdu Property” Chengdu Red Star Macalline Real Estate Co., Ltd.* (成都紅星美凱龍置業有限公
司), a limited liability company established in the PRC on 27 October 2009, which
is indirectly wholly-owned by RSED
“China” or “PRC” the People’s Republic of China, except where the context requires, references
in this to the PRC or China do not apply to Hong Kong, Macau Special
Administrative Region and Taiwan
“Close Associate(s)” has the meaning ascribed thereto under the Listing Rules
“Company” or “Our Company” or
Red Star Macalline”
Red Star Macalline Group Corporation Ltd. (紅星美凱龍家居集團有限公司), a
sino-foreign joint stock limited company established in the PRC, the H Shares of
which are listed and traded on the Main Board
“Company Laws” the Company Laws of the People’s Republic of China 《中華人民共和國公司法》

243Annual Report 2016
Defi nitions
“Companies Ordinance” the Companies Ordinance, Chapter 622 of the Laws of Hong Kong
“Connected Person(s)” has the meaning ascribed thereto under the Listing Rules
“Consolidated Financial Statements” the audited consolidated fi nancial statements of the Group for the year ended 31
December 2016
“Controlling Shareholders” or
“our Controlling Shareholders”
has the meaning ascribed thereto under the Listing Rules, and unless the context
otherwise requires, refers to Mr. CHE and RSM Holding
“Corporate Bonds” Phase II corporate bonds with an aggregate principal amount of
RMB3,000,000,000 and coupon rate of 3.50% and 4.29% for Category I Bonds
and Category II Bonds, respectively, issued by the Company in the PRC on 14
July 2016
“Corporate Governance Code” the Corporate Governance Code set out in Appendix 14 to the Listing Rules
“Director(s)” director(s) of the Company
“Domestic Shares” ordinary shares issued by our Company, with a Renminbi-denominated nominal
value of RMB1.00 each, which are subscribed for and paid up in Renminbi
“GDP” gross domestic product; except as otherwise specifi ed, all references to GDP
growth rates are to real as opposed to nominal rates of GDP growth
“Greenland Jinniu” Greenland Group Chengdu Jinniu Real Estate Development Co., Ltd.* (綠地集
團成都金牛房地產開發有限公司), a limited liability company established in the
PRC, which is our Connected Person and indirectly held as to 50% by Greenland
Group Chengdu Property Co., Ltd. and 50% by Chengdu Property
“Global Offering” the initial public offering of the H Shares whereby the H Shares were listed on the
Main Board of Hong Kong Stock Exchange on 26 June 2015
“Group” the Company and its subsidiaries
“H Share(s)” overseas-listed foreign invested ordinary share(s) with a nominal value of
RMB1.00 each in the share capital of the Company, which is/are listed and
traded on the Hong Kong Stock Exchange
244 Red Star Macalline Group Corporation Ltd.
Defi nitions
“HK$” or “HK dollars” the lawful currency of Hong Kong
“Hong Kong” or “HK” the Hong Kong Special Administrative Region of the PRC
“Hong Kong Stock Exchange” The Stock Exchange of Hong Kong Limited
“IFRSs” International Financial Reporting Standards
“Jining Hongrui” Jining Hongrui Real Estate Co., Ltd.* (濟寧鴻瑞置業有限公司), a limited liability
company established in the PRC, which is our Connected Person and directly
held as to 40.2% by Ms. QIAN Yumei, 26.8% by Ms. ZHANG Jianfang and 33%
by Jiangsu Kerui Property Management Corporation* (江蘇可瑞資產管理有限公
司), an independent third party
“Listing” listing of the H Shares on the Main Board of the Hong Kong Stock Exchange
“Listing Rules” the Rules Governing the Listing of Securities on The Stock Exchange of Hong
Kong Limited
“Main Board” the stock exchange (excluding the option market) operated by the Hong Kong
Stock Exchange which is independent from and operated in parallel with the
Growth Enterprise Market of the Hong Kong Stock Exchange
“Managed Shopping Mall(s)” shopping mall(s) managed by us under contract management agreements
“Model Code” Model Code for Securities Transactions by Directors of Listed Issuers as set out
in Appendix 10 to the Listing Rules
“Mr. CHE” Mr. CHE Jianxing
“Nomination Committee” Nomination Committee of the Board of Directors
“Other Cities” for the purpose of this annual report only, cities at prefecture-level, excluding Tier
I Cities, Tier II Cities and Tier III Cities
245Annual Report 2016
Defi nitions
“Portfolio Shopping Mall(s)” all of the following shopping malls: (i) shopping malls in which all or a majority
of the operating areas are owned by us; (ii) the Transferred Shopping Malls
(other than Chengdu Jinniu Shopping Mall); (iii) shopping malls leased by us;
(iv) shopping malls for which we operate and consolidate their results of operation
and pay the relevant property owners a fi xed amount of annual fees (“fi xed-fee
Portfolio Shopping Malls”); and (v) shopping malls held by us and associates
or joint venture partners and operated by us (“JV/associate Portfolio Shopping
Malls”). For the year ended 31 December 2014 and the three months ended 31
March 2014 and 2015, our fi xed-fee Portfolio Shopping Malls included (a) Erdos
Dongsheng Mall, (b) Yichang Xiling Mall and (c) Quzhou Sanqu Mall. Such fi xed-
fee Portfolio Shopping Malls were operated by us under contract management
agreements for the years ended 31 December 2012 and 2013. We entered
into the abovementioned fi xed-fee arrangements with respect to such fi xed-
fee Portfolio Shopping Malls since 2014. Accordingly, such fi xed-fee Portfolio
Shopping Malls were categorized as our Managed Shopping Malls for the years
ended 31 December 2012 and 2013, and were categorized as our Portfolio
Shopping Malls for the year ended 31 December 2014 and the three months
ended 31 March 2014 and 2015. For the years ended 31 December 2012,
2013 and 2014 and the three months ended 31 March 2014 and 2015, our JV/
associate Shopping Malls included (a) Suzhou Park Mall and Shenzhen Xiangmi
Lake Mall, which are held by our associates and operated by us, and (b) Wuhu
Minghui Mall and Chengdu Shuangnan Mall, which are held by our joint ventures
and operated by us. We do not consolidate the results of operation of the
relevant companies holding the JV/associate Portfolio Shopping Malls into our
consolidated fi nancial information for the years ended 31 December 2012, 2013
and 2014 and the three months ended 31 March 2014 and 2015. The results of
operation of and our interests in the relevant companies were refl ected in share of
profi t of associates, share of results of joint ventures, interests in associates, and
interests in joint ventures in our consolidated fi nancial information. Accordingly,
with respect to the operating information in this annual report, we categorize
the abovementioned (i) and (ii) as “Self-owned Portfolio Shopping Malls” and the
abovementioned (iii) (iv) and (v) as “Non-self-owned Portfolio Shopping Malls”.
With respect to the fi nancial information in this annual report, we categorize the
abovementioned (i), (ii), (iii) and (iv) as our “Owned/Leased Portfolio Shopping
Malls”, among which (i) and (ii) are categorized as “Owned Portfolio Shopping
Malls”, and (iii) and (iv) are categorized as “Leased Portfolio Shopping Malls”

246 Red Star Macalline Group Corporation Ltd.
Defi nitions
“Project Company” 64 project companies holding certain managed shopping mall companies, and
each of them a “Project Company”
“Red Star Furniture Group” Red Star Furniture Group Co., Ltd.* (紅星傢俱集團有限公司), formerly known
as Changzhou Red Star Furniture Group Company* (常州紅星傢俱集團公司), a
company established in the PRC on 27 June 1994, which is held as to 45% by
Mr. CHE Jianxing, 45% by Changzhou RSHFC and 10% by Ms. CHE Jianfang
“Remuneration and
Evaluation Committee”
Remuneration and Evaluation Committee of the Board of Directors
“Reporting Period” the period from 1 January 2016 to 31 December 2016
“Repurchase Agreement” the repurchase agreement dated 23 October 2015 entered into between the
Company and Chengdu Property
“RMB” Renminbi, the lawful currency of the PRC
“RSED” Red Star Macalline Enterprise Development Co., Ltd.* (紅星美凱龍企業發展有限
公司) (formerly known as “Shanghai Red Star Macalline Enterprise Development
Co., Ltd.” (上海紅星美凱龍企業發展有限公司)), a limited liability company
established in the PRC on 11 June 2010, which is held as to 70.15% by RSM
Holding, 14% by Millbranch Investment SRL, an affi liate of Warburg Pincus LLC,
8.08% by Candlewood Investment SRL, 4.72% by Springwood Investment SRL,
0.81% by Lianyungang Fairbay Infrastructure Construction Company Limited,
0.37% by Shanghai Hongmei, 1.66% by Shanghai Meilong Assets Management
Company Limited* (上海美龍資產管理有限公司) and 0.22% by Shanghai Xingkai
Business Administration Company Limited* (上海興凱企業管理有限公司)
“RSM Holding” Red Star Macalline Holding Group Company Limited* (紅星美凱龍控股集團有
限公司) (formerly known as “Shanghai Red Star Macalline Investment Company
Limited” (上海紅星美凱龍投資有限公司)), a limited liability company established
in the PRC and is a Controlling Shareholder of our Company, which is held as to
92% by Mr. CHE and 8% by Ms. CHE Jianfang
“SFO” the Securities and Futures Ordinance, Chapter 571 of the Laws of Hong Kong

247Annual Report 2016
Defi nitions
“Shaanxi Hongrui” Shaanxi Hongrui Home Furnishings Plaza Co., Ltd.* (陝西鴻瑞家居生活廣場有限
公司), a limited liability company established in the PRC, which is our Connected
Person and held as to 39.6% by Ms. QIAN Yumei, 26.4% by Ms. ZHANG
Jianfang and 34% by Jiangsu Kerui Property Management Corporation* (江蘇可
瑞資產管理有限公司) and YAN Xiaojing, each an independent third party
“Share(s)” Share(s) of the Company, including both Domestic Share(s) and H Share(s)
“Shareholder(s)” the holder(s) of the shares of the Company
“Strategy and Investment Committee” Strategy and Investment Committee of the Board of Directors
“Supervisor(s)” member(s) of the supervisory committee of the Company
“Tier I Cities” for the purpose of this annual report, Shanghai, Beijing, Guangzhou and
Shenzhen
“Tier II Cities” for the purpose of this annual report, Chongqing, Tianjin, Suzhou, Hangzhou,
Zhengzhou, Changsha, Urumqi, Ningbo, Chengdu, Lanzhou, Nanjing, Nanning,
Nanchang, Xiamen, Hefei, Hohhot, Harbin, Dalian, Taiyuan, Kunming, Wuxi,
Qingdao, Xi’an, Changchun, Shijiazhuang, Wuhan, Shenyang, Jinan, Wenzhou,
Fuzhou, Guiyang, Foshan, Dongguan and Haikou
“Tier III Cities” for the purpose of this annual report, Daqing, Zhongshan, Yancheng, Baotou,
Taizhou, Pingdingshan, Jilin, Anyang, Jiangmen, Chifeng, Xingtai, Zhoukou,
Yichang, Yueyang, Songyuan, Jinhua, Handan, Xinyang, Baoding, Nantong,
Nanyang, Xianyang, Weihai, Liuzhou, Quanzhou, Luoyang, Maoming, Tangshan,
Xuzhou, Guilin, Zhuzhou, Tai’an, Taizhou, Zhuhai, Changzhou, Changde,
Huai’an, Zibo, Liaocheng, Tongliao, Chenzhou, Langfang, Huizhou, Zhanjiang,
Huzhou, Jiaozuo, Ordos, Heze, Xinxiang, Yulin, Jiaxing, Zhangzhou, Dezhou,
Anshan, Hengyang, Xiangyang, Dongying, Linyi, Yangzhou, Zaozhuang,
Cangzhou, Jining, Binzhou, Weifang, Yantai, Shaoxing, Wuhu, Xuchang,
Ganzhou, Lianyungang, Zhenjiang, Yinchuan, Lhasa, Xining and Shangqiu
“Xuzhou RSHFC” Xuzhou Red Star Macalline International Home Furnishings City Co., Ltd.* (徐州
紅星美凱龍國際傢俱裝飾城有限公司), a limited liability company established in
the PRC, which is our Connected Person and directly held as to 50% by Mr. CHE
Jianlin, 25% by Mr. CHE Jianguo and 25% by ZHOU Lichen and WANG Lili, each
an independent third party

248 Red Star Macalline Group Corporation Ltd.
Defi nitions
“Xuzhou RSHFP” Xuzhou Red Star Macalline Global Home Furnishings Plaza Co., Ltd.* (徐州紅星
美凱龍全球家居生活廣場有限公司),a limited liability company established in the
PRC, which is our Connected Person and held as to 75% by Mr. CHE Jianlin and
25% by Mr. CHE Jianguo
“Xingyi Tonghui” Shanghai Xingyi Tonghui Business Service Company Limited* (上海星易通匯商
務服務有限公司), a limited liability company established in the PRC and a direct
wholly-owned subsidiary of our Company
“Yangzhou RSHFP” Yangzhou Red Star Macalline Global Home Furnishings Plaza Property Co., Ltd.*
(揚州紅星美凱龍全球家居生活廣場置業有限公司), a limited liability company
established in the PRC, which is our Connected Person and directly held as to
95% by Mr. CHE Jianlin and 5% by YAN Xiaojing, an independent third party
“Jinshan Property” a building located at No. 1808 Hangzhou Bay Road, Shanghai, the PRC (property
ownership certifi cate Hu Fang Di Jin Zi (2013) No. 010389) with a total gross fl oor
area of approximately 74,917.88 square meters
“Shanghai Hongmei” Shanghai Hongmei Investment Management Center (Limited Partnership)* (上海
洪美投資管理中心(有限合夥)), a limited partnership established in the PRC on 27
February 2012, which is a Shareholder of our Company and holds approximately
0.35% of the issued Shares of our Company
“Prospectus” the prospectus of the Company dated 16 June 2015