31015 waeghe 1045 am systematic method development with novel inert solid-core
TRANSCRIPT
Systematic Method Development with Novel, Inert Solid-Core Bonded Phases
Thomas J. Waeghe, Ph.D., Geoffrey Faden, Carl L. Zimmerman, Alan P. McKeown*
MAC-MOD Analytical, Inc.103 Commons Court
Chadds Ford, PA 19317
*Advanced Chromatography Technologies1 Berry Street, Aberdeen, AB25 1HF, Scotland

Systematic Method Development with Novel, Inert Solid-Core Bonded Phases
Encapsulated bonding technology (EBT) is a new approach to stationary phase endcapping that provides exceptional inertness and excellent phase stability across a broad pH range from 1.5 to 11.0. This technology has previously been successfully applied to 2, 3 and 5 micron totally porous (non-core) packing materials, but has more recently been implemented for 2.5 and 5 micron solid-core packings.
The ability to use stationary phase chemistry (C18, phenyl-hexyl), organic modifier choice, and pH as variables in a systematic approach is a significant advantage for UHPLC and HPLC method development. The usefulness of such a method development strategy will be described and demonstrated with an appropriate example.
23/10/2015 Pittcon 2015 New Orleans

1.00 1.05 1.10 1.15 1.20 1.250.0
0.5
1.0
1.5
2.0
2.5
3.0
0 5000 10000 15000 20000 25000
0 5 10 15 20 25
N
k
Nk
Res
olut
ion
(Rs)
Zhao, J.H. and P.W. Carr. Analytical Chemistry, (1999) 71, 2623-2632
Selectivity: the most powerful variable for increasing resolution
EfficiencySelectivity
Retention
Rs = k1+k
4
√ N
3
0
0
tttk R
1
2
kk
)(16base
r
wtN
2
Selectivity has greatest impact on Rs
Rs changes most rapidly
with
3/10/2015 Pittcon 2015 New Orleans

4
Which LC Parameters Affect Selectivity Most? 1,2
Isocratic Separations
1. Mobile phase pH (for ionised analytes only)
2. Column Stationary Phase
3. Organic modifier
4. % Organic modifier
5. Column temperature
• Buffer choice
• Buffer concentration
• Additive concentration
Gradient Separations• All parameters for isocratic
separations and,• Gradient steepness• k* (that is tG, F, , VM, MW)• Delay volume• Column dimensions
1 Adapted from ‘Introduction to Modern Liquid Chromatography”, 3rd Edition, Snyder, Kirkland, and Dolan, 2010, p.29, Wiley & Sons
SVFtk
m
G
85*
MOSTInfluence
LEASTInfluence
Relative Impact of Different Changes in RPLC Parameters on Selectivity2
Parameter Change inParameter
Maximum| |
pH 5 pH units 0.70
Organic Modifier CH3CNCH3OH 0.20
Gradient Time (tG) 10-fold 0.20
Orthogonal Column Fs ≥ ~65 0.19
% Organic Modifier 10% (v/v) 0.08
Column Temperature 20 C 0.07
Buffer Concentration 2-fold 0.02
3/10/2015 Pittcon 2015 New Orleans
2 Journal of Chromatography A, 1101 (2006) 122–135, “Orthogonal” separations for reversed-phase liquid chromatography, L.R. Snyder et al.

ACE UltraCore Solid-Core Columns
ACE UltraCore 2.5 m:Total particle diameter = 2.5 µmShell thickness = 0.45 µm
ACE UltraCore 5 m:Total particle diameter = 5 µmShell thickness = 0.7 µm
3/10/2015 Pittcon 2015 New Orleans 5
UltraCore SuperC18 and SuperPhenylHexyl Columns
• Alternate selectivities: hydrophobic and - interactions
• stable to 1000 bar (14,500 psi)• 2 m frits for improved ruggedness
and uptime• 20,000 column volume lifetime
minimum (≤ 40 C, pH 811.0)
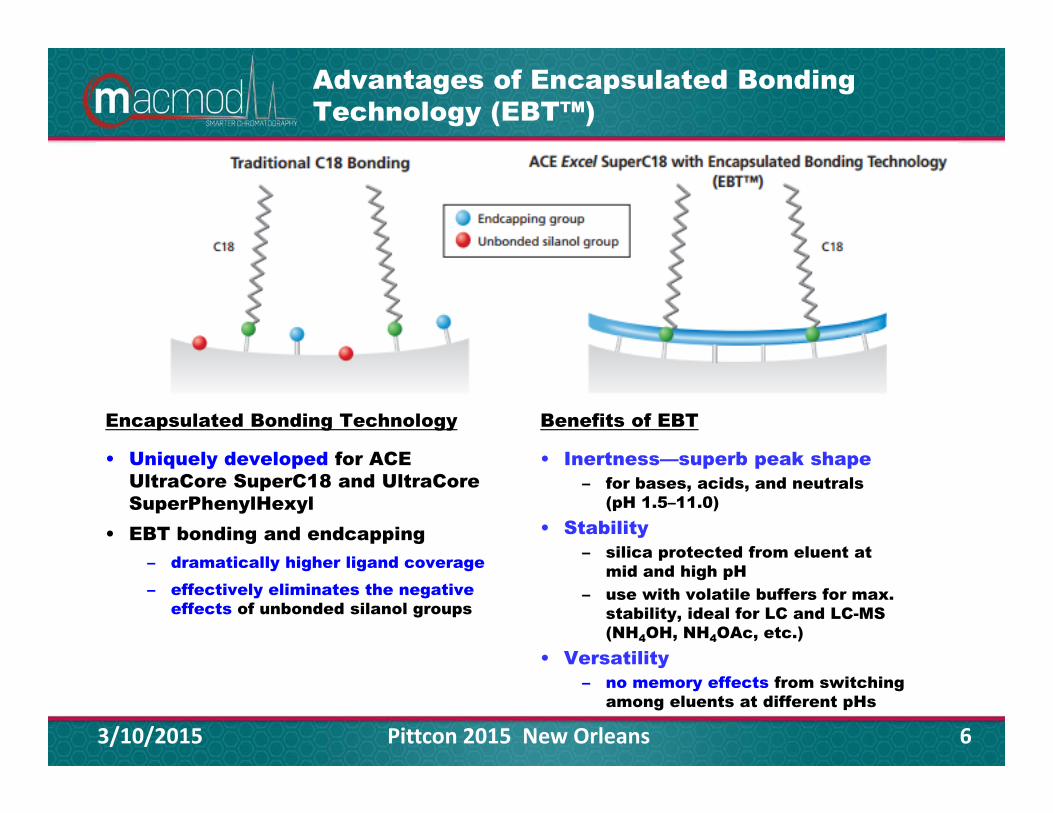
Advantages of Encapsulated Bonding Technology (EBT™)
Encapsulated Bonding Technology
• Uniquely developed for ACE UltraCore SuperC18 and UltraCore SuperPhenylHexyl
• EBT bonding and endcapping – dramatically higher ligand coverage– effectively eliminates the negative
effects of unbonded silanol groups
Benefits of EBT
• Inertness—superb peak shape – for bases, acids, and neutrals
(pH 1.5–11.0)• Stability
– silica protected from eluent at mid and high pH
– use with volatile buffers for max. stability, ideal for LC and LC-MS (NH4OH, NH4OAc, etc.)
• Versatility – no memory effects from switching
among eluents at different pHs
3/10/2015 Pittcon 2015 New Orleans 6
73/10/2015 Pittcon 2015 New Orleans
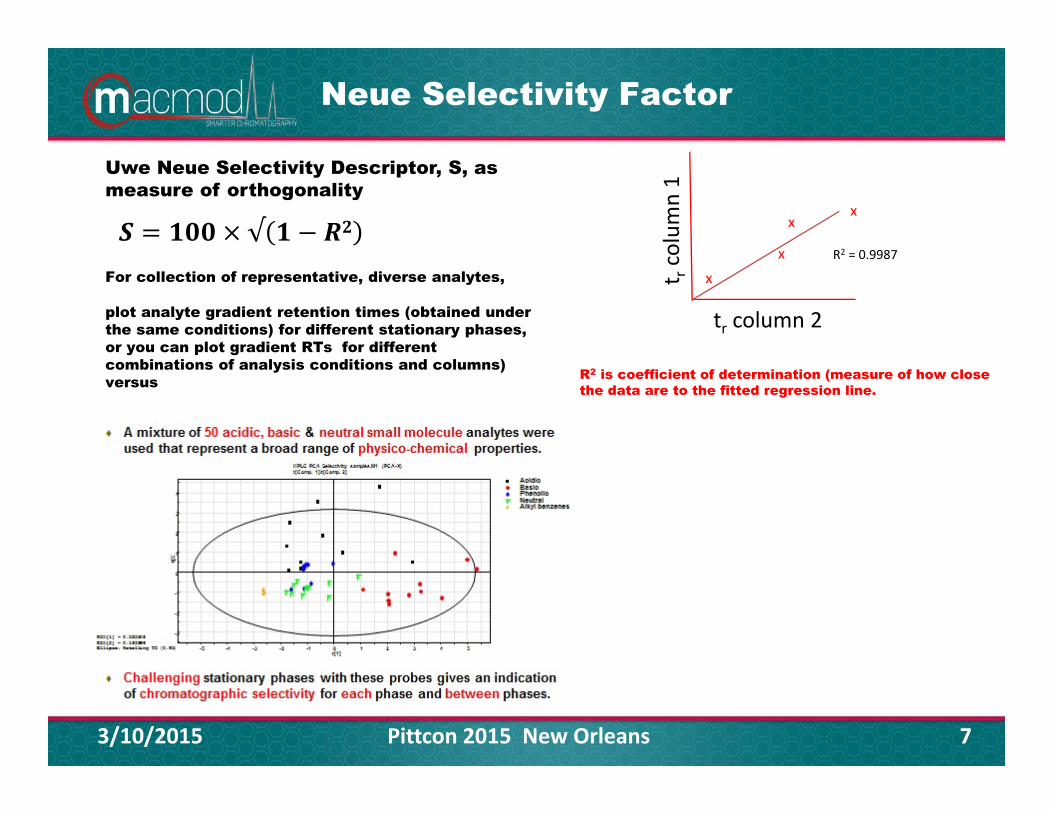
xx
xxt r
column 1
tr column 2
R2 = 0.9987
Uwe Neue Selectivity Descriptor, S, as measure of orthogonality
√For collection of representative, diverse analytes,
plot analyte gradient retention times (obtained under the same conditions) for different stationary phases, or you can plot gradient RTs for different combinations of analysis conditions and columns) versus R2 is coefficient of determination (measure of how close
the data are to the fitted regression line.
Neue Selectivity Factor
3/10/2015 Pittcon 2015 New Orleans 8
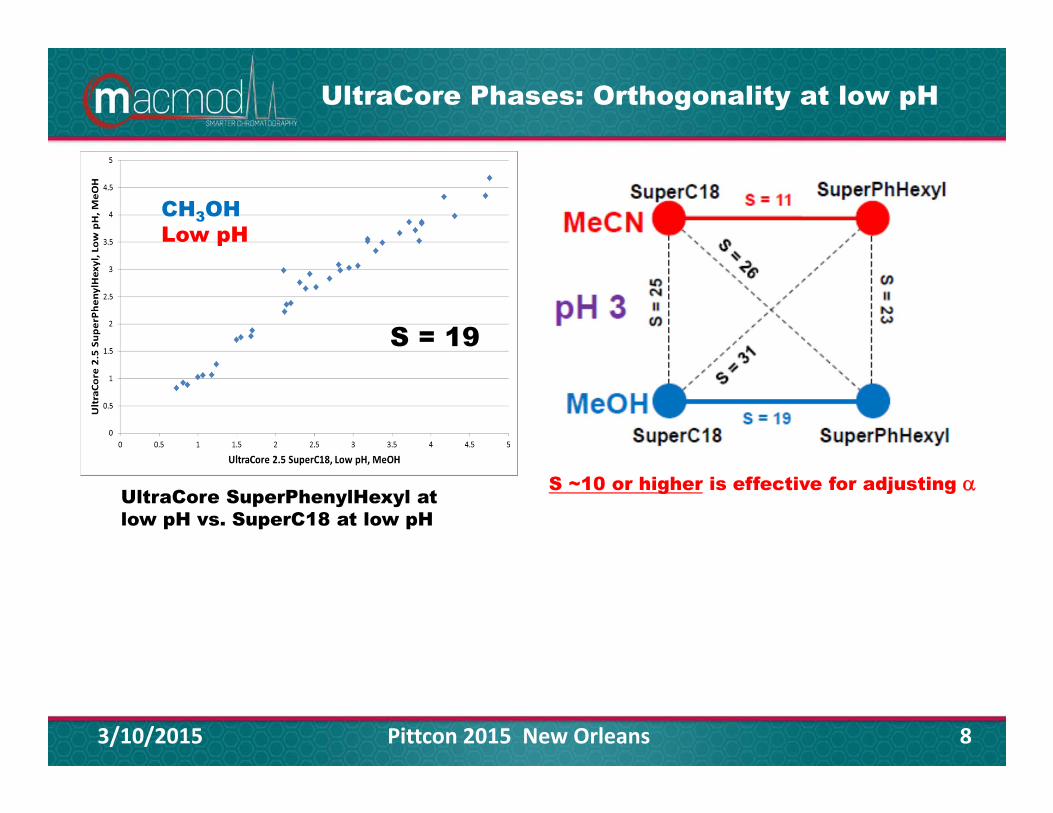
UltraCore Phases: Orthogonality at low pH
UltraCore SuperPhenylHexyl at low pH vs. SuperC18 at low pH
CH3OHLow pH
S = 19
S ~10 or higher is effective for adjusting

SuperPhenylHexyl Orthogonality: High pH vs. Low pH
3/10/2015 Pittcon 2015 New Orleans 9
UltraCore SuperPhenylHexyl (high pH) vs. SuperPhenylHexyl (low pH)
SuperC18
SuperC18
pH 10.7
SuperPhHexylS = 12
SuperPhHexylS = 11
S =
25
S = 22
MeOH
MeCNNice pattern...
CH3OHHigh pH
S = 83
S values between phases and organic modifiers
at high pH

Objective: Explore performance of ACE UltraCore columns for basic analytes
Parameters– Stationary phase
• ACE UltraCore SuperC18 and SuperPhenylHexyl
– Organic modifier• CH3CN, CH3OH
– pH • 2.8, 3.8, 8.2, 9.2, 10.2; 9.7 and 10.7
Samples– 9 Appetite Suppressants– 16 Drugs of Abuse
103/10/2015 Pittcon 2015 New Orleans
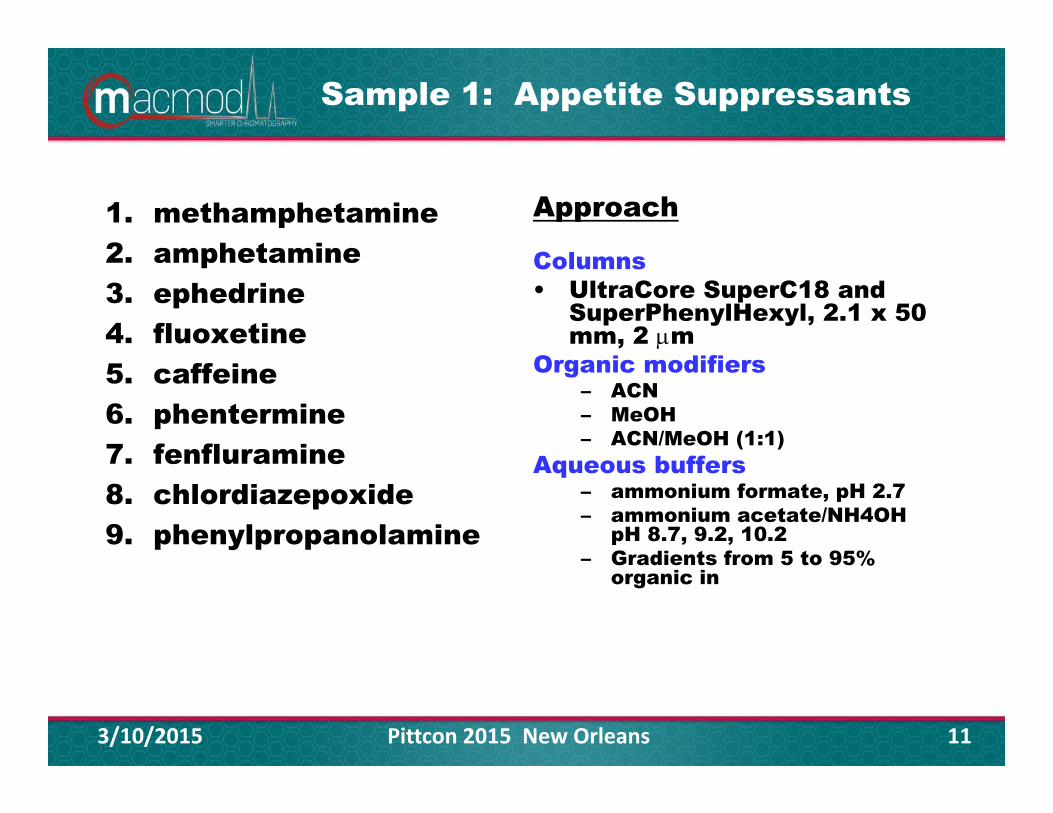
Sample 1: Appetite Suppressants
1. methamphetamine2. amphetamine3. ephedrine4. fluoxetine5. caffeine6. phentermine7. fenfluramine8. chlordiazepoxide9. phenylpropanolamine
11
Approach
Columns• UltraCore SuperC18 and
SuperPhenylHexyl, 2.1 x 50 mm, 2 m
Organic modifiers– ACN– MeOH– ACN/MeOH (1:1)
Aqueous buffers– ammonium formate, pH 2.7– ammonium acetate/NH4OH
pH 8.7, 9.2, 10.2– Gradients from 5 to 95%
organic in
3/10/2015 Pittcon 2015 New Orleans

More Complex Appetite Suppressant Mixture: optimum pH from DryLab®
0 10 20Time (min)
0.00
E+00
2.00
E+08
4.00
E+08
6.00
E+08
Inte
nsity
caf
ephed
phent unk
phenolphthalein
chlordiazepoxidelorcaserin
fenfluramine
fluoxetine
unk3
DEP
sertraline
DidesSib
Rimonabant
NDesSib
sibutramine
orlistat
unk4
12
predicted optimum pH based on DryLab using only pH not gradient time or temperature
2.1 x 100 mm, 2 m ACE Excel SuperC180.5 mL/min, 25C, 10–90% CH3CN/20 mM pH 9.3 buffer in 20 min.MS Detection Data courtesy of Phyllis Wilson, U.S. FDA
3/10/2015 Pittcon 2015 New Orleans
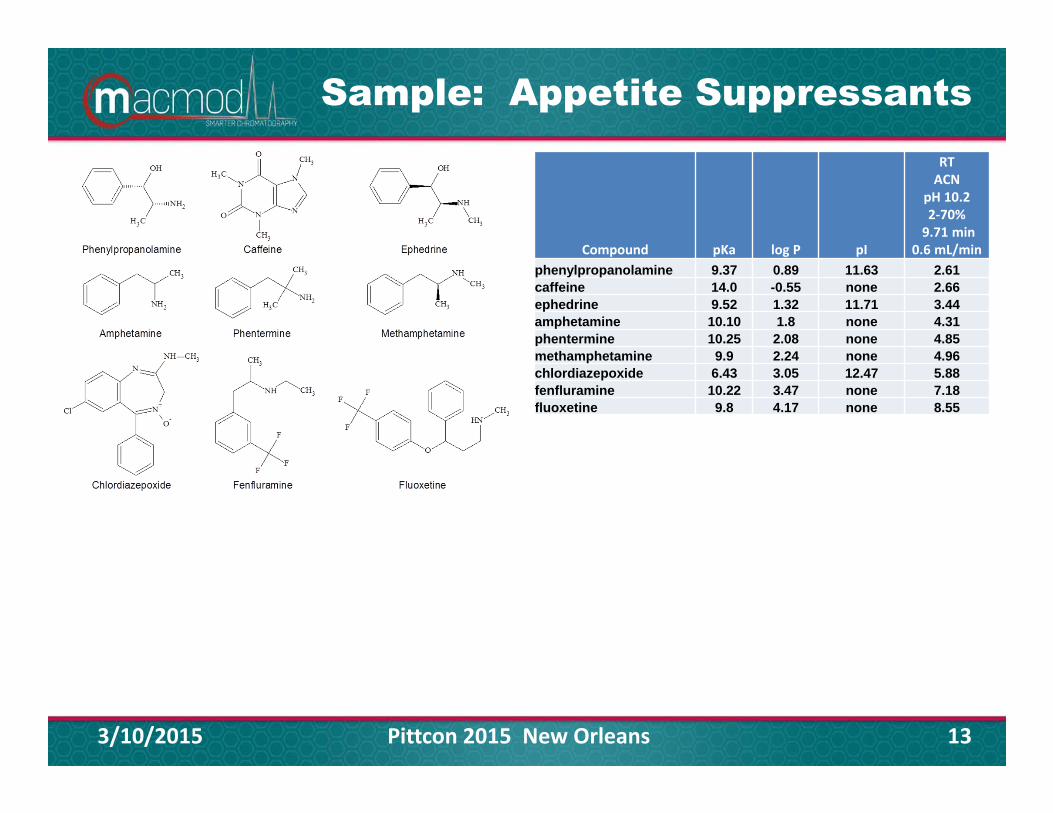
Sample: Appetite Suppressants
3/10/2015 Pittcon 2015 New Orleans 13
Compound pKa log P pI
RT ACN
pH 10.22‐70%9.71 min
0.6 mL/minphenylpropanolamine 9.37 0.89 11.63 2.61caffeine 14.0 -0.55 none 2.66ephedrine 9.52 1.32 11.71 3.44amphetamine 10.10 1.8 none 4.31phentermine 10.25 2.08 none 4.85methamphetamine 9.9 2.24 none 4.96chlordiazepoxide 6.43 3.05 12.47 5.88fenfluramine 10.22 3.47 none 7.18fluoxetine 9.8 4.17 none 8.55

UltraCore SuperC18: Examples with CH3CN and CH3OH at pH 3.8 and pH 10.2
3/10/2015 Pittcon 2015 New Orleans 14
0 2 4 6 8 10Time (min)
0.00
00.
002
0.00
40.
006
0.00
80.
010
Volts
1.1501.849
2.366
2.782
3.154
3.296
6.350
7.354
9.800
0 2 4 6 8 10Time (min)
0.00
0.02
Volts
1.981 2.053
3.047 4.029
4.6724.762
5.692
7.306
8.365
UltraCore SuperC18CH3CN/pH 3.82-50% in 13.7 min.k* = 14.30.6 mL/min, 30 C for all 4
UltraCore SuperC18CH3CN/pH 10.25-70% in 10 min.k* = 15.5
0 2 4 6 8 10 12 14 16Time (min)
0.00
00.
002
0.00
40.
006
0.00
8Vo
lts
1.283
2.1732.656
3.516
4.2155.008
9.145
14.456
15.258
2 4 6 8 10 12Time (min)
0.00
00.
010
0.02
0Vo
lts2.266
2.345
3.517 4.959
6.309
6.455
9.610
10.337
11.785
UltraCore SuperPhenHexCH3OH/pH 3.82-50% in 13.7 min.k* = 14.3
UltraCore SuperPhenHexCH3OH/pH 10.25-70% in 10 min.k* = 15.5
2.2 2.4Time (min)
Volts
2.266 2.345
1.8 2.0Time (min)
Volts
1.981
2.053
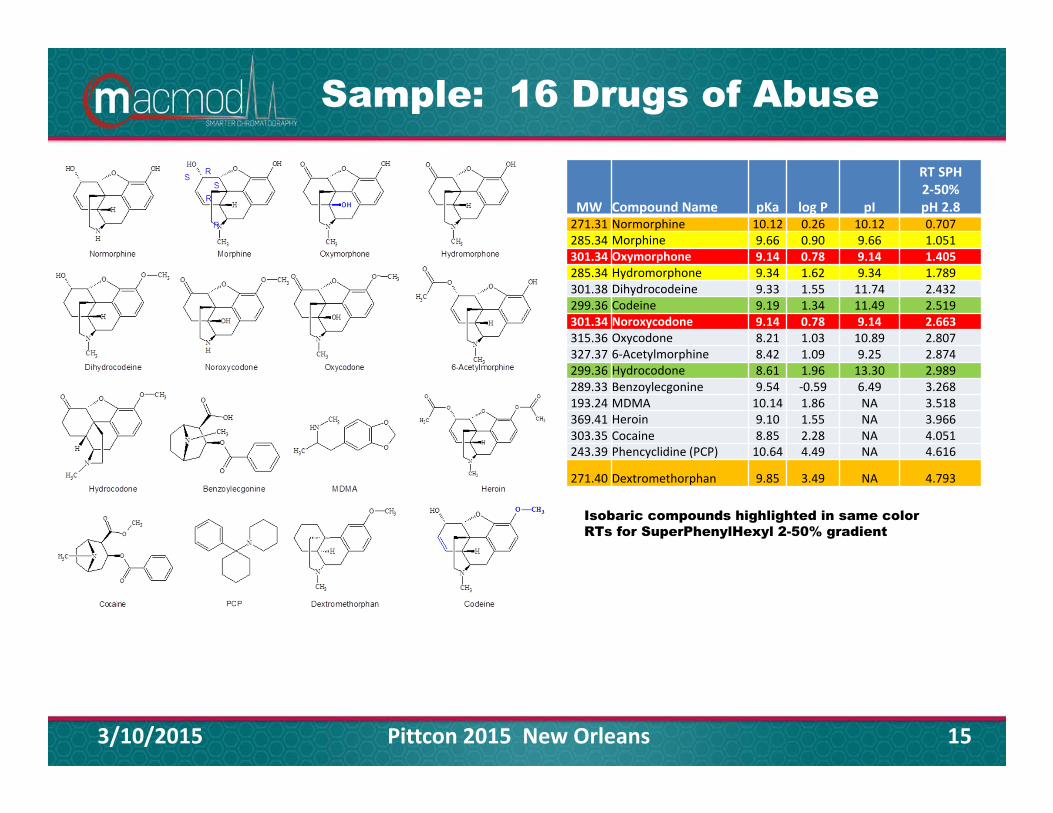
Sample: 16 Drugs of Abuse
3/10/2015 Pittcon 2015 New Orleans 15
MW Compound Name pKa log P pI
RT SPH2‐50%pH 2.8
271.31 Normorphine 10.12 0.26 10.12 0.707285.34 Morphine 9.66 0.90 9.66 1.051301.34 Oxymorphone 9.14 0.78 9.14 1.405285.34 Hydromorphone 9.34 1.62 9.34 1.789301.38 Dihydrocodeine 9.33 1.55 11.74 2.432299.36 Codeine 9.19 1.34 11.49 2.519301.34 Noroxycodone 9.14 0.78 9.14 2.663315.36 Oxycodone 8.21 1.03 10.89 2.807327.37 6‐Acetylmorphine 8.42 1.09 9.25 2.874299.36 Hydrocodone 8.61 1.96 13.30 2.989289.33 Benzoylecgonine 9.54 ‐0.59 6.49 3.268193.24 MDMA 10.14 1.86 NA 3.518369.41 Heroin 9.10 1.55 NA 3.966303.35 Cocaine 8.85 2.28 NA 4.051243.39 Phencyclidine (PCP) 10.64 4.49 NA 4.616
271.40 Dextromethorphan 9.85 3.49 NA 4.793
Isobaric compounds highlighted in same colorRTs for SuperPhenylHexyl 2-50% gradient

UltraCore SuperC18, 2.1 x 50 mm, 2.5 m4 pHs with CH3CN
0 2 4 6 8Time (min)
0.00
00.
002
0.00
4V
olts
0.649
0.881
1.187
1.697
2.613
2.7293.023
3.1183.227
3.402
4.021
6.547
6.9587.188
7.399
2 4 6 8Time (min)
0.00
00.
002
0.00
40.
006
0.00
80.
010
0.01
20.
014
Vol
ts
1.972
3.305
3.476
3.731
3.997
4.147
4.274
4.505
4.994
5.180 5.622
6.211
2 4 6 8 10Time (min)
0.00
00.
002
0.00
40.
006
0.00
80.
010
0.01
20.
014
Vol
ts
1.948
3.154
3.537
3.804 3.9104.012
4.215
4.581
4.732
5.102
5.635
6.350
6.6537.072
8.931
CH3CN/pH 3.8250% in 13.7 min.k* = 14.30.6 mL/min, 30 C for all 4
CH3CN/pH 8.2270% in 11.9 min.k* = 14.3
CH3CN/ pH 9.2270% in 11.9 min.k* = 14.3
3.0 4.0Time (min)
Vol
ts 3.154
3.537
3.8043.910 4.0124.215
4.581
4.732
2 4 6 8 10Time (min)
0.00
00.
002
0.00
40.
006
0.00
8V
olts
1.930
3.315
3.6383.926
4.155
4.719
4.7794.894
5.178
5.299
5.462
5.865
6.0586.1506.661
7.315 Gradient artifact
7.922
9.219
CH3CN/ pH 10.2270% in 11.9 min.k* = 14.3
4.0 5.0 6.0Time (min)
Volts 3.305
3.476
3.731
3.997 4.1474.274
4.505
4.9945.180 5.622
3/26/2015 16

0 2 4 6 8 10 12 14Time (min)
0.00
00.
002
0.00
40.
006
Vol
ts
3.824
5.303
5.764
6.564
6.941
7.454
8.226
8.849
9.230
9.545
9.887
10.370
11.273
12.040
0 2 4 6 8 10 12Time (min)
0.00
00.
002
Vol
ts
0.874
1.533
1.982
2.4964.132
4.354
4.536
4.938
5.225 6.727
10.829 12.065
0 2 4 6 8 10 12 14Time (min)
UltraCore SuperPhenylHexyl, 2.1 x 50 mm, 2.5 m: 4 pHs with CH3OH
3/10/2015 Pittcon 2015 New Orleans 17
CH3OH/pH 3.8250% in 13.7 min.k* = 14.30.6 mL/min, 30 C for all 4
CH3OH/pH 8.2270% in 11.9 min.k* = 14.3
CH3OH/pH 9.2270% in 11.9 min.k* = 14.3
0 2 4 6 8 10 12 14Time (min)
0.00
00.
002
0.00
4V
olts
CH3OH/pH 10.2270% in 11.9 min.k* = 14.3
0 10 20Time (min)
0.00
00.
002
0.00
40.
006
0.00
80.
010
0.01
2Vo
lts
2.7754.987
6.431
7.540
10.166
10.483
10.895
11.34011.527
11.705
13.944
18.774
19.514
20.190
0 2 4 6 8 10 12Time (min)
0.00
00.
002
0.00
40.
006
0.00
8Vo
lts
0.857
1.478
1.9602.466
4.091
4.287 4.455
4.878
5.194
6.018
6.712
10.67311.830
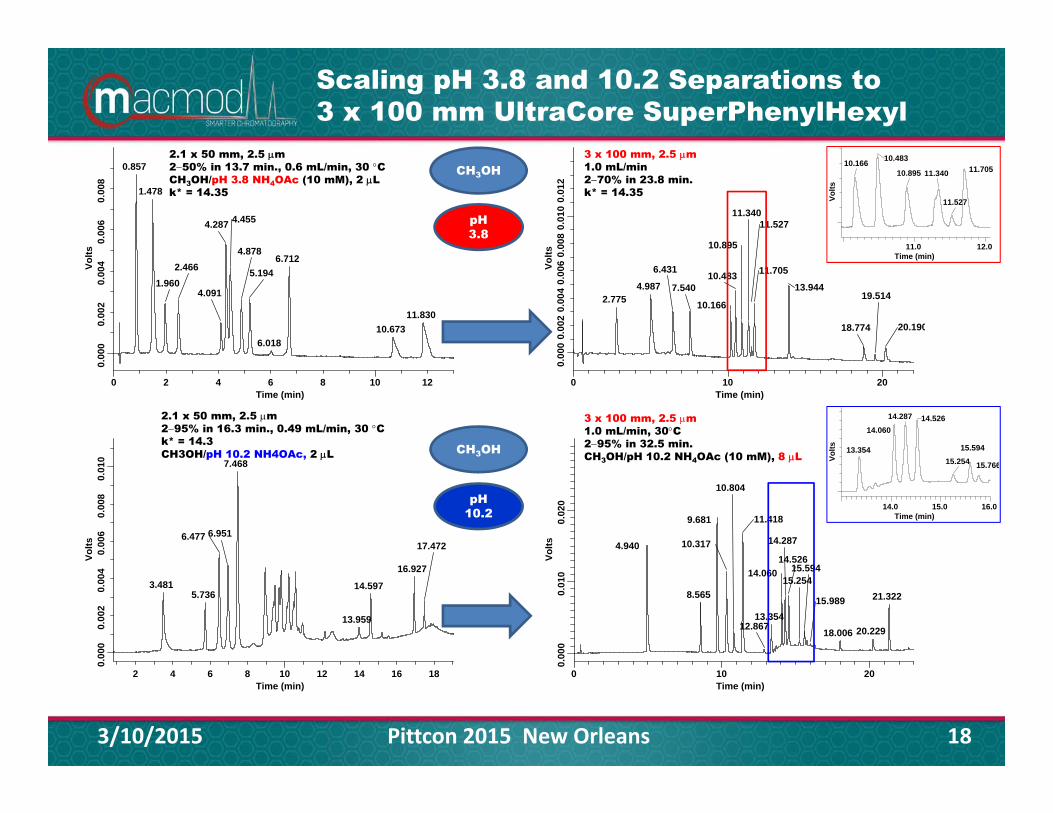
Scaling pH 3.8 and 10.2 Separations to 3 x 100 mm UltraCore SuperPhenylHexyl
18
2 4 6 8 10 12 14 16 18Time (min)
0.00
00.
002
0.00
40.
006
0.00
80.
010
Volts
3.4815.736
6.477 6.951
7.468
13.959
14.597
16.927
17.472
0 10 20Time (min)
0.00
00.
010
0.02
0Vo
lts 4.940
8.565
9.681
10.317
10.804
11.418
12.86713.354
14.060
14.287
14.526
15.25415.594
15.989
18.006 20.229
21.322
2.1 x 50 mm, 2.5 m250% in 13.7 min., 0.6 mL/min, 30 CCH3OH/pH 3.8 NH4OAc (10 mM), 2 Lk* = 14.35
3 x 100 mm, 2.5 m 1.0 mL/min270% in 23.8 min. k* = 14.35
2.1 x 50 mm, 2.5 m 295% in 16.3 min., 0.49 mL/min, 30 Ck* = 14.3CH3OH/pH 10.2 NH4OAc, 2 L
CH3OH
3 x 100 mm, 2.5 m1.0 mL/min, 30C295% in 32.5 min.CH3OH/pH 10.2 NH4OAc (10 mM), 8 L
pH 3.8
CH3OH
pH 10.2
3/10/2015 Pittcon 2015 New Orleans
14.0 15.0 16.0Time (min)
Volts 13.354
14.060
14.287 14.526
15.25415.594
15.766
11.0 12.0Time (min)
Volts
10.166 10.483
10.895 11.340
11.527
11.705
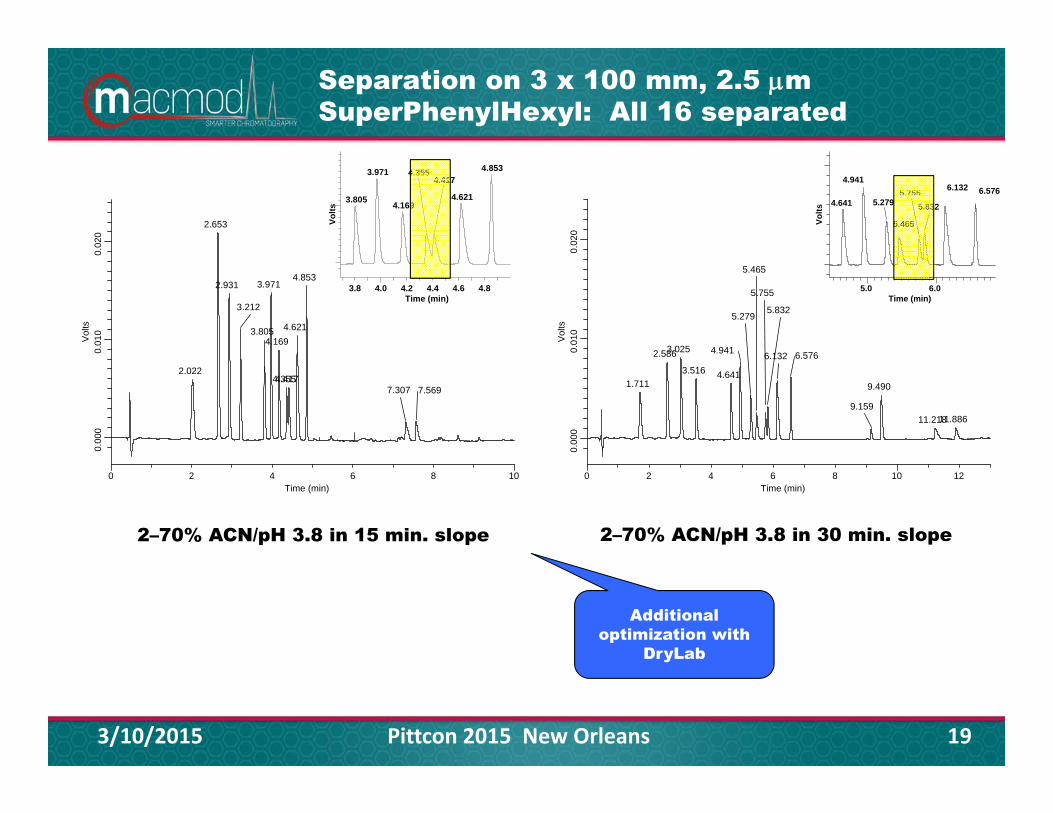
Separation on 3 x 100 mm, 2.5 m SuperPhenylHexyl: All 16 separated
0 2 4 6 8 10 12Time (min)
0.00
00.
010
0.02
0V
olts
1.711
2.5863.025
3.516 4.641
4.941
5.279
5.465
5.755
5.832
6.132 6.576
9.159
9.490
11.21811.886
5.0 6.0Time (min)
Volts
4.641
4.941
5.279
5.465
5.7555.832
6.132 6.576
0 2 4 6 8 10Time (min)
0.00
00.
010
0.02
0V
olts
2.022
2.653
2.931
3.212
3.805
3.971
4.169
4.3554.417
4.621
4.853
7.307 7.569
3.8 4.0 4.2 4.4 4.6 4.8Time (min)
Volts
3.805
3.971
4.169
4.3554.417
4.621
4.853
3/10/2015 Pittcon 2015 New Orleans 19
2–70% ACN/pH 3.8 in 30 min. slope2–70% ACN/pH 3.8 in 15 min. slope
Additional optimization with
DryLab

Summary
• ACE UltraCore SuperC18 and SuperPhenylHexyl columns were evaluated at several pHs for two mixtures of basic analytes.
• Peak shape and selectivity were best at pH 3.8 and pH 10.2 with ammonium formate and ammonium acetate/NH4OH mobile phases, respectively.
• Use of 2.1 x 50 mm, 2.5 m column geometries allows for rapid, yet thorough examination of various combinations of organic modifier, stationary phase and pH.
• Method transfer to larger column geometries went well, although inability to use injection delays did not permit completely accurate transfer.
• Useable conditions were found for both of the best conditions for each of the columns at low and high pH.
• For the drugs of abuse sample, pH 10.7 did not afford as good resolution as pH 10.2.
203/10/2015 Pittcon 2015 New Orleans