3.1 summary - publications.industry.gov.au
TRANSCRIPT
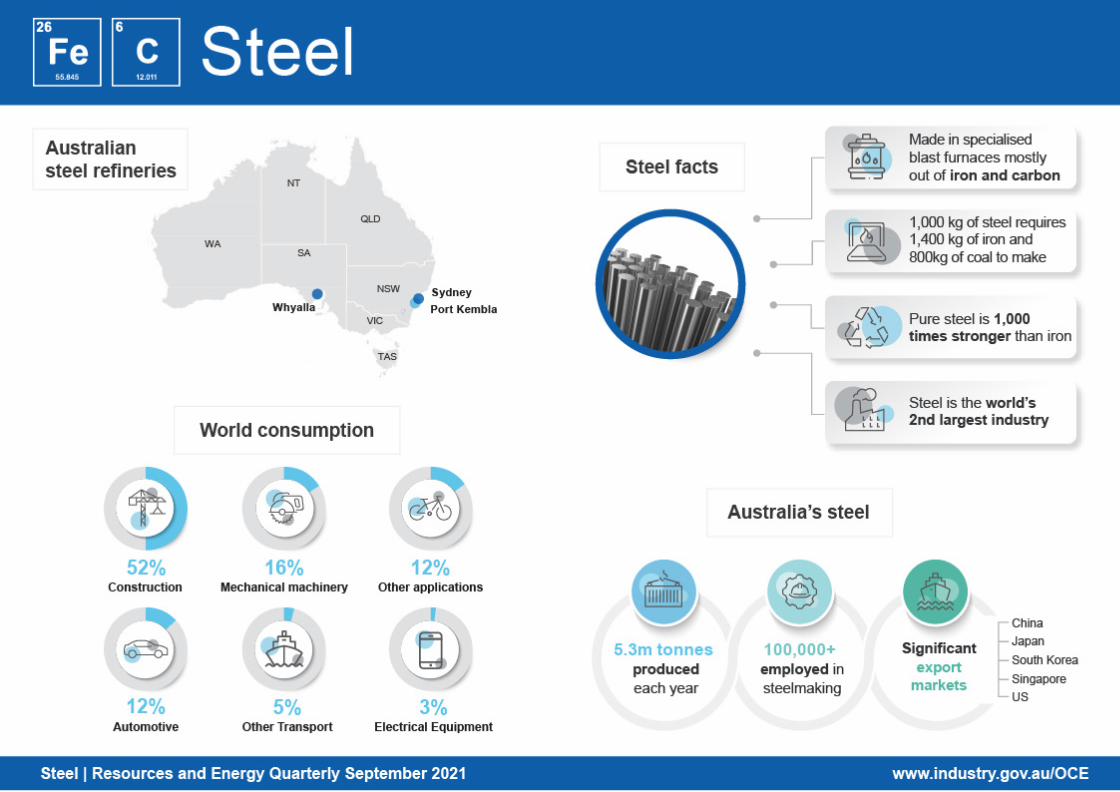
3.1 Summary World demand for steel is forecast to grow by 5.8% in 2021, reflecting
the ongoing recovery now underway in most major economies following COVID-19 lows. More moderate growth is likely in 2022 and 2023.
The slowdown in the recovery after 2021, and renewed outbreaks (andvariants) of the pandemic, present key risks to global economic growth and steel consumption in the second half of 2021 and beyond.
Strong demand for steel in the midst of still-recovering supply chainscontinues to see elevated prices for most steel products across the US,EU and Asia in the September quarter. Prices are still expected to easefrom the second half of 2021, as this demand impulse recedes andsupply chains normalise. However, the persistence of price pressuresacross global supply chains remains a key risk.
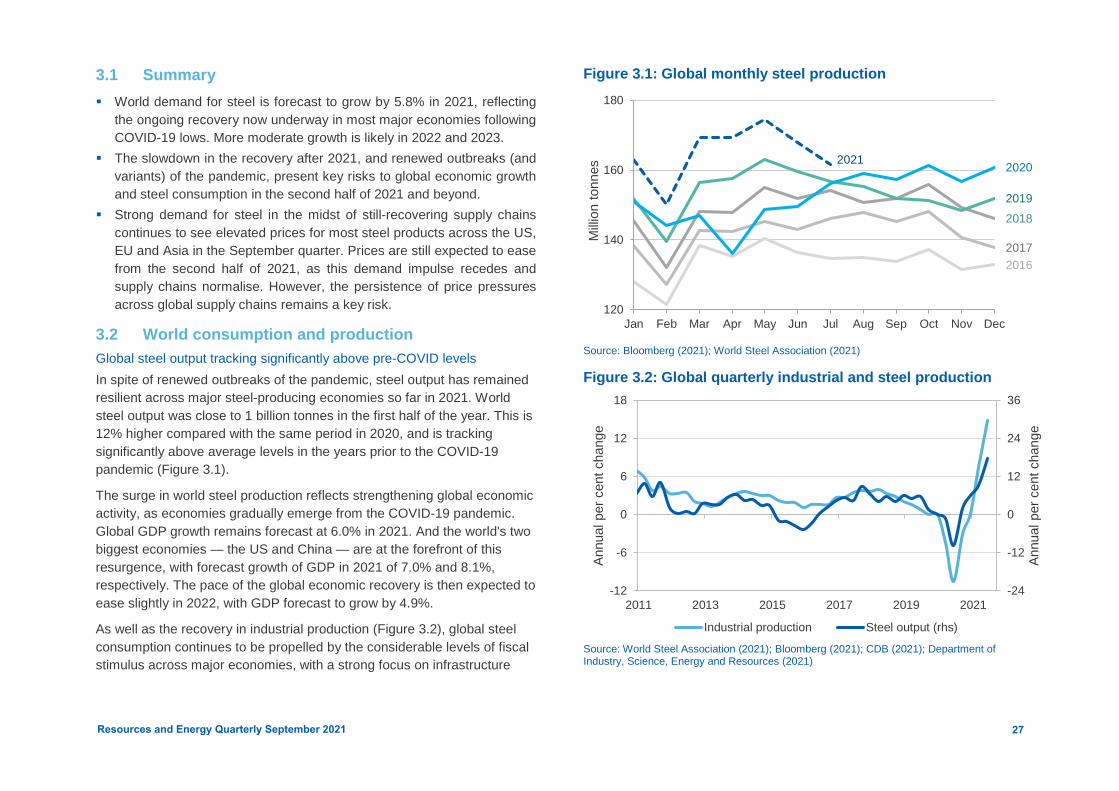
3.2 World consumption and production Global steel output tracking significantly above pre-COVID levels In spite of renewed outbreaks of the pandemic, steel output has remained resilient across major steel-producing economies so far in 2021. World steel output was close to 1 billion tonnes in the first half of the year. This is 12% higher compared with the same period in 2020, and is tracking significantly above average levels in the years prior to the COVID-19 pandemic (Figure 3.1).
The surge in world steel production reflects strengthening global economic activity, as economies gradually emerge from the COVID-19 pandemic. Global GDP growth remains forecast at 6.0% in 2021. And the world's two biggest economies — the US and China — are at the forefront of this resurgence, with forecast growth of GDP in 2021 of 7.0% and 8.1%, respectively. The pace of the global economic recovery is then expected to ease slightly in 2022, with GDP forecast to grow by 4.9%.
As well as the recovery in industrial production (Figure 3.2), global steel consumption continues to be propelled by the considerable levels of fiscal stimulus across major economies, with a strong focus on infrastructure
Figure 3.1: Global monthly steel production
20162017
20182019
20202021
120
140
160
180
Jan Feb Mar Apr May Jun Jul Aug Sep Oct Nov Dec
Milli
on to
nnes
Source: Bloomberg (2021); World Steel Association (2021)
Figure 3.2: Global quarterly industrial and steel production
-24
-12
0
12
24
36
-12
-6
0
6
12
18
2011 2013 2015 2017 2019 2021
Annu
al p
er c
ent c
hang
e
Annu
al p
er c
ent c
hang
e
Industrial production Steel output (rhs)
Source: World Steel Association (2021); Bloomberg (2021); CDB (2021); Department of Industry, Science, Energy and Resources (2021)
27Resources and Energy Quarterly September 2021
spending and government and business support for the transition to low emissions. This includes a fiscal package worth nearly US$1 trillion implemented in China, as well as similar packages in the EU, US and India.
However, initial signs are emerging of a slowdown in the impressive rates of growth seen for economic activity and industrial output in the first half of 2021. With renewed outbreaks (and variants) of the pandemic appearing in many major economies, downside risks to world industrial production in the short term are rising. The speed at which countries can bring these outbreaks under control will determine to what extent these risks impact global growth and steel demand for the rest of 2021.
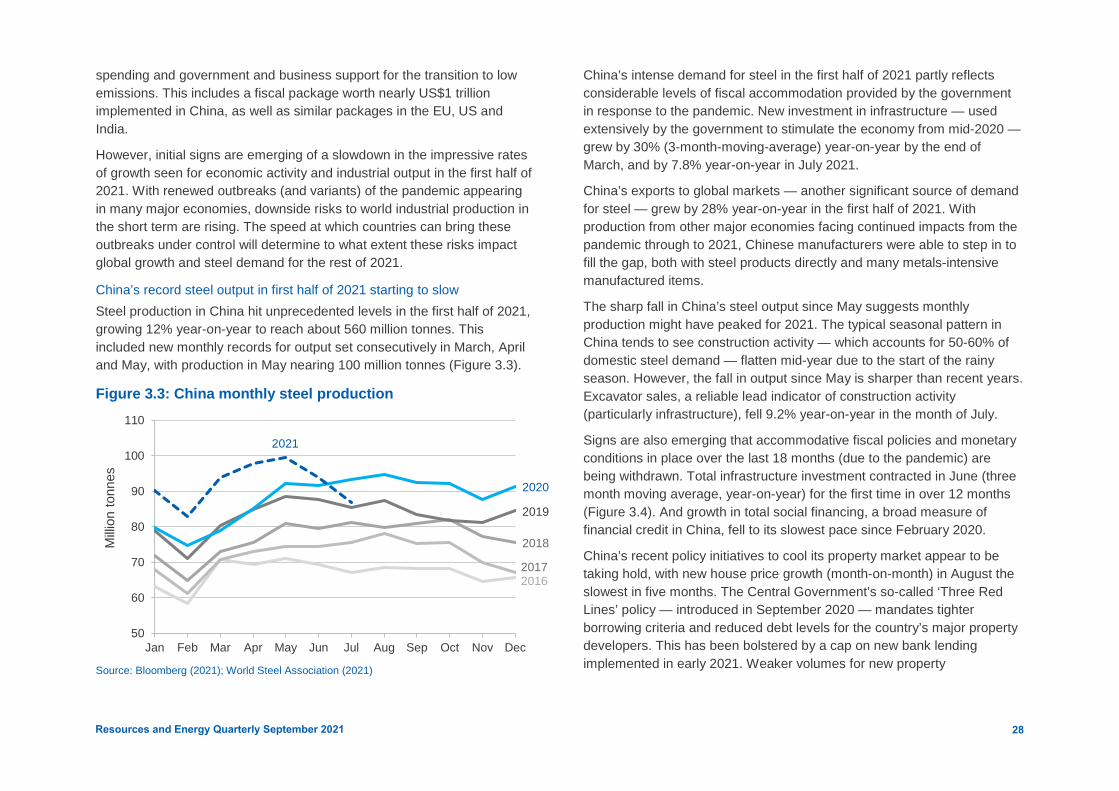
China’s record steel output in first half of 2021 starting to slow Steel production in China hit unprecedented levels in the first half of 2021, growing 12% year-on-year to reach about 560 million tonnes. This included new monthly records for output set consecutively in March, April and May, with production in May nearing 100 million tonnes (Figure 3.3).
Figure 3.3: China monthly steel production
20162017
2018
2019
2020
2021
50
60
70
80
90
100
110
Jan Feb Mar Apr May Jun Jul Aug Sep Oct Nov Dec
Milli
on to
nnes
Source: Bloomberg (2021); World Steel Association (2021)
China’s intense demand for steel in the first half of 2021 partly reflects considerable levels of fiscal accommodation provided by the government in response to the pandemic. New investment in infrastructure — used extensively by the government to stimulate the economy from mid-2020 — grew by 30% (3-month-moving-average) year-on-year by the end of March, and by 7.8% year-on-year in July 2021.
China’s exports to global markets — another significant source of demand for steel — grew by 28% year-on-year in the first half of 2021. With production from other major economies facing continued impacts from the pandemic through to 2021, Chinese manufacturers were able to step in to fill the gap, both with steel products directly and many metals-intensive manufactured items.
The sharp fall in China’s steel output since May suggests monthly production might have peaked for 2021. The typical seasonal pattern in China tends to see construction activity — which accounts for 50-60% of domestic steel demand — flatten mid-year due to the start of the rainy season. However, the fall in output since May is sharper than recent years. Excavator sales, a reliable lead indicator of construction activity (particularly infrastructure), fell 9.2% year-on-year in the month of July.
Signs are also emerging that accommodative fiscal policies and monetary conditions in place over the last 18 months (due to the pandemic) are being withdrawn. Total infrastructure investment contracted in June (three month moving average, year-on-year) for the first time in over 12 months (Figure 3.4). And growth in total social financing, a broad measure of financial credit in China, fell to its slowest pace since February 2020.
China’s recent policy initiatives to cool its property market appear to be taking hold, with new house price growth (month-on-month) in August the slowest in five months. The Central Government’s so-called ‘Three Red Lines’ policy — introduced in September 2020 — mandates tighter borrowing criteria and reduced debt levels for the country’s major property developers. This has been bolstered by a cap on new bank lending implemented in early 2021. Weaker volumes for new property
28Resources and Energy Quarterly September 2021
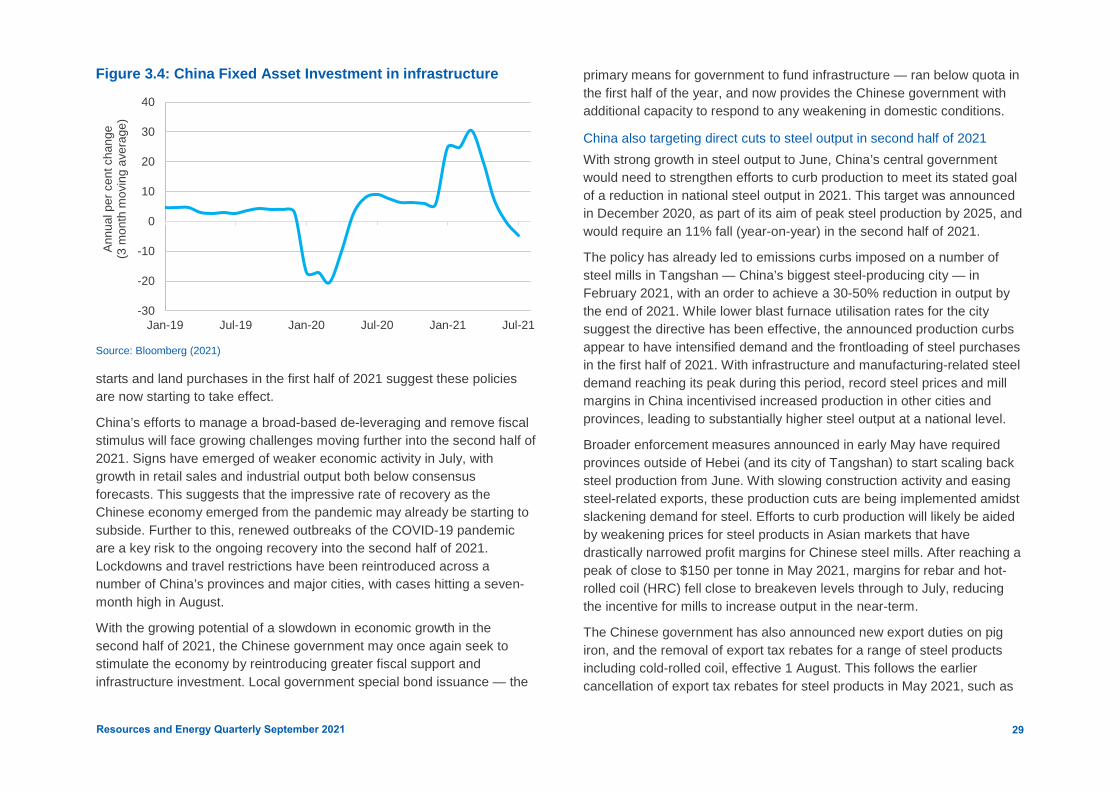
Figure 3.4: China Fixed Asset Investment in infrastructure
-30
-20
-10
0
10
20
30
40
Jan-19 Jul-19 Jan-20 Jul-20 Jan-21 Jul-21
Annu
al p
er c
ent c
hang
e (3
mon
th m
ovin
g av
erag
e)
Source: Bloomberg (2021)
starts and land purchases in the first half of 2021 suggest these policies are now starting to take effect.
China’s efforts to manage a broad-based de-leveraging and remove fiscal stimulus will face growing challenges moving further into the second half of 2021. Signs have emerged of weaker economic activity in July, with growth in retail sales and industrial output both below consensus forecasts. This suggests that the impressive rate of recovery as the Chinese economy emerged from the pandemic may already be starting to subside. Further to this, renewed outbreaks of the COVID-19 pandemic are a key risk to the ongoing recovery into the second half of 2021. Lockdowns and travel restrictions have been reintroduced across a number of China’s provinces and major cities, with cases hitting a seven-month high in August.
With the growing potential of a slowdown in economic growth in the second half of 2021, the Chinese government may once again seek to stimulate the economy by reintroducing greater fiscal support and infrastructure investment. Local government special bond issuance — the
primary means for government to fund infrastructure — ran below quota in the first half of the year, and now provides the Chinese government with additional capacity to respond to any weakening in domestic conditions.
China also targeting direct cuts to steel output in second half of 2021 With strong growth in steel output to June, China’s central government would need to strengthen efforts to curb production to meet its stated goal of a reduction in national steel output in 2021. This target was announced in December 2020, as part of its aim of peak steel production by 2025, and would require an 11% fall (year-on-year) in the second half of 2021.
The policy has already led to emissions curbs imposed on a number of steel mills in Tangshan — China’s biggest steel-producing city — in February 2021, with an order to achieve a 30-50% reduction in output by the end of 2021. While lower blast furnace utilisation rates for the city suggest the directive has been effective, the announced production curbs appear to have intensified demand and the frontloading of steel purchases in the first half of 2021. With infrastructure and manufacturing-related steel demand reaching its peak during this period, record steel prices and mill margins in China incentivised increased production in other cities and provinces, leading to substantially higher steel output at a national level.
Broader enforcement measures announced in early May have required provinces outside of Hebei (and its city of Tangshan) to start scaling back steel production from June. With slowing construction activity and easing steel-related exports, these production cuts are being implemented amidst slackening demand for steel. Efforts to curb production will likely be aided by weakening prices for steel products in Asian markets that have drastically narrowed profit margins for Chinese steel mills. After reaching a peak of close to $150 per tonne in May 2021, margins for rebar and hot-rolled coil (HRC) fell close to breakeven levels through to July, reducing the incentive for mills to increase output in the near-term.
The Chinese government has also announced new export duties on pig iron, and the removal of export tax rebates for a range of steel products including cold-rolled coil, effective 1 August. This follows the earlier cancellation of export tax rebates for steel products in May 2021, such as
29Resources and Energy Quarterly September 2021
HRC, cold-rolled sheet and rebar. While the changes were announced as part of the effort to reduce the industry’s total energy consumption, they are likely to also shore up domestic supplies of steel.
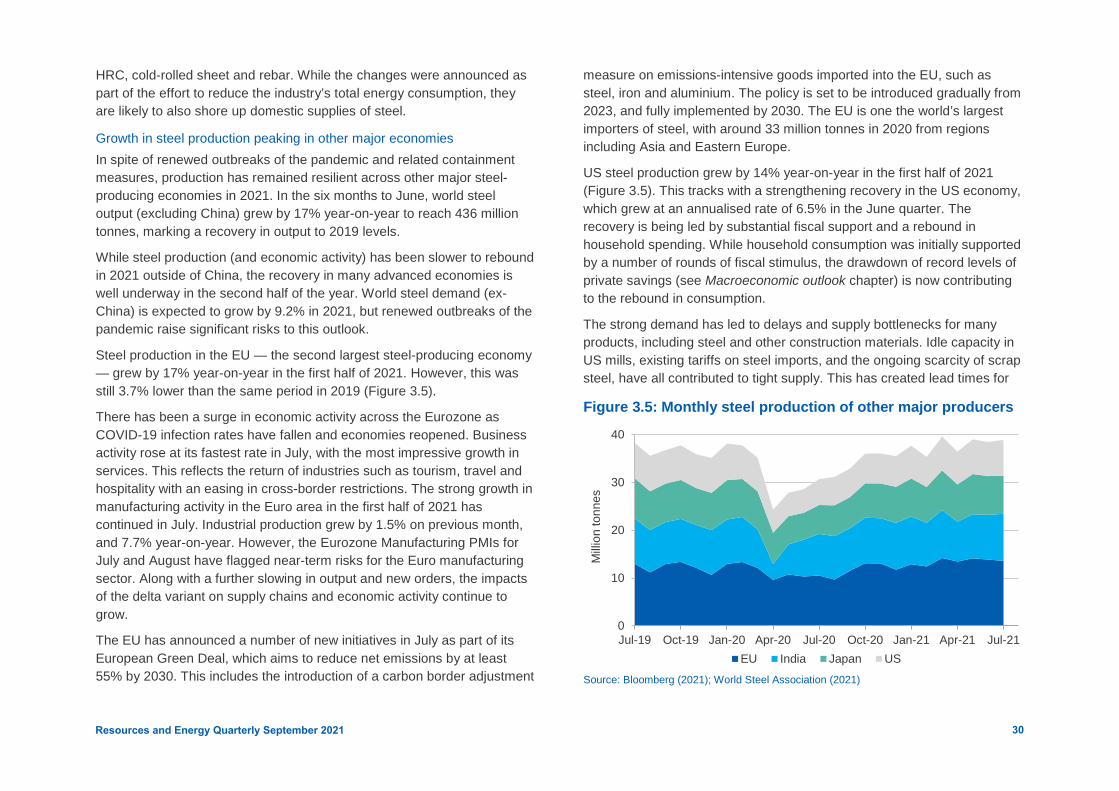
Growth in steel production peaking in other major economies In spite of renewed outbreaks of the pandemic and related containment measures, production has remained resilient across other major steel-producing economies in 2021. In the six months to June, world steel output (excluding China) grew by 17% year-on-year to reach 436 million tonnes, marking a recovery in output to 2019 levels.
While steel production (and economic activity) has been slower to rebound in 2021 outside of China, the recovery in many advanced economies is well underway in the second half of the year. World steel demand (ex-China) is expected to grow by 9.2% in 2021, but renewed outbreaks of the pandemic raise significant risks to this outlook.
Steel production in the EU — the second largest steel-producing economy — grew by 17% year-on-year in the first half of 2021. However, this was still 3.7% lower than the same period in 2019 (Figure 3.5).
There has been a surge in economic activity across the Eurozone as COVID-19 infection rates have fallen and economies reopened. Business activity rose at its fastest rate in July, with the most impressive growth in services. This reflects the return of industries such as tourism, travel and hospitality with an easing in cross-border restrictions. The strong growth in manufacturing activity in the Euro area in the first half of 2021 has continued in July. Industrial production grew by 1.5% on previous month, and 7.7% year-on-year. However, the Eurozone Manufacturing PMIs for July and August have flagged near-term risks for the Euro manufacturing sector. Along with a further slowing in output and new orders, the impacts of the delta variant on supply chains and economic activity continue to grow.
The EU has announced a number of new initiatives in July as part of its European Green Deal, which aims to reduce net emissions by at least 55% by 2030. This includes the introduction of a carbon border adjustment
measure on emissions-intensive goods imported into the EU, such as steel, iron and aluminium. The policy is set to be introduced gradually from 2023, and fully implemented by 2030. The EU is one the world’s largest importers of steel, with around 33 million tonnes in 2020 from regions including Asia and Eastern Europe.
US steel production grew by 14% year-on-year in the first half of 2021 (Figure 3.5). This tracks with a strengthening recovery in the US economy, which grew at an annualised rate of 6.5% in the June quarter. The recovery is being led by substantial fiscal support and a rebound in household spending. While household consumption was initially supported by a number of rounds of fiscal stimulus, the drawdown of record levels of private savings (see Macroeconomic outlook chapter) is now contributing to the rebound in consumption.
The strong demand has led to delays and supply bottlenecks for many products, including steel and other construction materials. Idle capacity in US mills, existing tariffs on steel imports, and the ongoing scarcity of scrap steel, have all contributed to tight supply. This has created lead times for
Figure 3.5: Monthly steel production of other major producers
Source: Bloomberg (2021); World Steel Association (2021)
0
10
20
30
40
Jul-19 Oct-19 Jan-20 Apr-20 Jul-20 Oct-20 Jan-21 Apr-21 Jul-21
Milli
on to
nnes
EU India Japan US
30Resources and Energy Quarterly September 2021
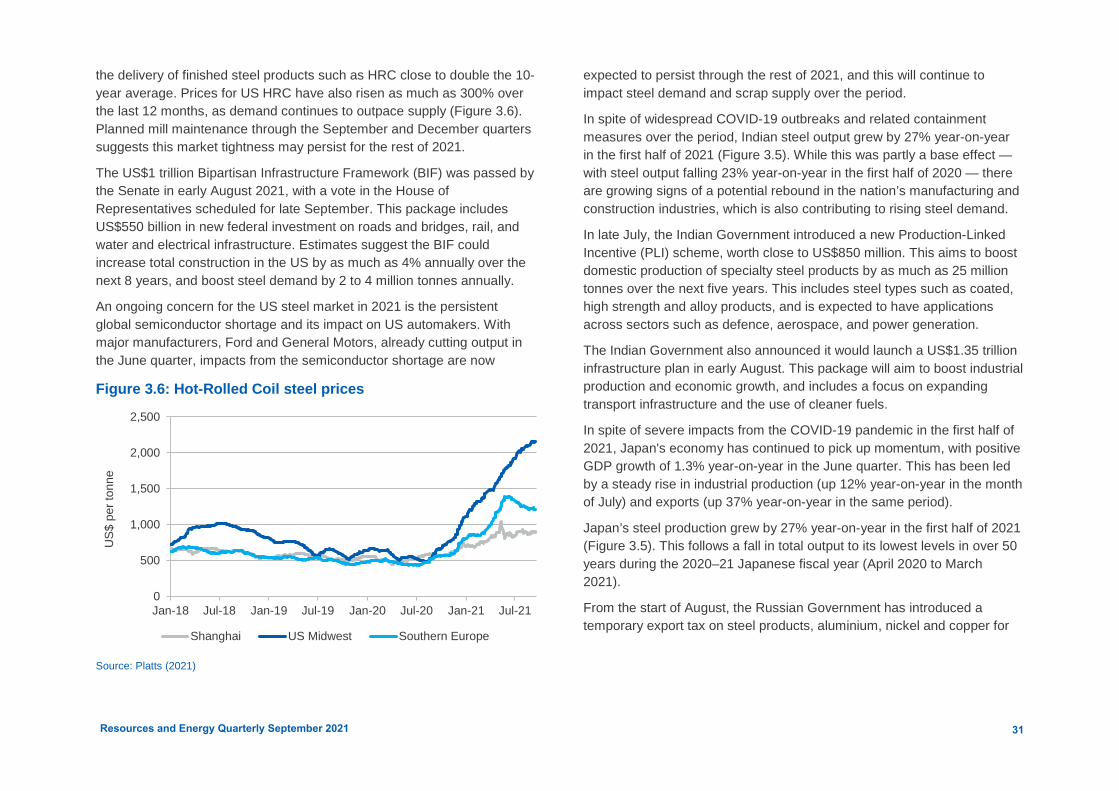
the delivery of finished steel products such as HRC close to double the 10-year average. Prices for US HRC have also risen as much as 300% over the last 12 months, as demand continues to outpace supply (Figure 3.6). Planned mill maintenance through the September and December quarters suggests this market tightness may persist for the rest of 2021.
The US$1 trillion Bipartisan Infrastructure Framework (BIF) was passed by the Senate in early August 2021, with a vote in the House of Representatives scheduled for late September. This package includes US$550 billion in new federal investment on roads and bridges, rail, and water and electrical infrastructure. Estimates suggest the BIF could increase total construction in the US by as much as 4% annually over the next 8 years, and boost steel demand by 2 to 4 million tonnes annually.
An ongoing concern for the US steel market in 2021 is the persistent global semiconductor shortage and its impact on US automakers. With major manufacturers, Ford and General Motors, already cutting output in the June quarter, impacts from the semiconductor shortage are now
Figure 3.6: Hot-Rolled Coil steel prices
0
500
1,000
1,500
2,000
2,500
Jan-18 Jul-18 Jan-19 Jul-19 Jan-20 Jul-20 Jan-21 Jul-21
US$
per
tonn
e
Shanghai US Midwest Southern Europe
Source: Platts (2021)
expected to persist through the rest of 2021, and this will continue to impact steel demand and scrap supply over the period.
In spite of widespread COVID-19 outbreaks and related containment measures over the period, Indian steel output grew by 27% year-on-year in the first half of 2021 (Figure 3.5). While this was partly a base effect — with steel output falling 23% year-on-year in the first half of 2020 — there are growing signs of a potential rebound in the nation’s manufacturing and construction industries, which is also contributing to rising steel demand.
In late July, the Indian Government introduced a new Production-Linked Incentive (PLI) scheme, worth close to US$850 million. This aims to boost domestic production of specialty steel products by as much as 25 million tonnes over the next five years. This includes steel types such as coated, high strength and alloy products, and is expected to have applications across sectors such as defence, aerospace, and power generation.
The Indian Government also announced it would launch a US$1.35 trillion infrastructure plan in early August. This package will aim to boost industrial production and economic growth, and includes a focus on expanding transport infrastructure and the use of cleaner fuels.
In spite of severe impacts from the COVID-19 pandemic in the first half of 2021, Japan's economy has continued to pick up momentum, with positive GDP growth of 1.3% year-on-year in the June quarter. This has been led by a steady rise in industrial production (up 12% year-on-year in the month of July) and exports (up 37% year-on-year in the same period).
Japan’s steel production grew by 27% year-on-year in the first half of 2021 (Figure 3.5). This follows a fall in total output to its lowest levels in over 50 years during the 2020–21 Japanese fiscal year (April 2020 to March 2021).
From the start of August, the Russian Government has introduced a temporary export tax on steel products, aluminium, nickel and copper for
31Resources and Energy Quarterly September 2021

the remainder of 2021. A 15% (or US$ per tonne) tax rate will apply to products such as stainless steel, cold and hot rolled steel, and rebar. This tax was intended to bolster domestic supplies in the midst of a general tightness in global markets for these products. The policy may be taken up in other countries over the remainder of 2021, with China and Vietnam already flagging similar proposals as under consideration.
Figure 3.7: Global steel production by country
0
500
1,000
1,500
2,000
2,500
2019 2020 2021 2022 2023
Milli
on to
nnes
China European Union India Japan United States ROW
Source: World Steel Association (2021); Department of Industry, Science, Energy and Resources (2021)
Box 3.1: Decarbonisation of the steel industry and green steel With the global energy transition gathering momentum, the steel industry is exploring opportunities to play its part in the decarbonisation plan. In the first half of 2021, a number of new initiatives have been announced or implemented by major steel producers. This includes the introduction of Carbon Capture, Utilisation and Storage (CCUS) in existing steelmaking processes, as well as the use of renewable energy and new technologies to drive the steelmaking process.
In July, the world's second biggest steel producer, ArcelorMittal, announced a global carbon-emissions reduction target of 25% by 2030. To achieve this, the company is looking at building a number of new Direct Reduced Iron – Electric Arc Furnace (DRI-EAF) facilities across Europe and North America. DRI allows for inputs other than coking coal to be used in preparing iron ore for its conversion to steel. While this process has largely utilised natural gas until now, ArcelorMittal is aiming to establish the world’s first full-scale zero carbon-emissions steel plant in Sestao Spain by 2025. This will utilise green hydrogen-powered DRI, and an EAF using renewable energy power.
South Korean steelmaker POSCO — another of the world’s largest steel producers — has announced new research and development into opportunities such as green hydrogen manufacturing technology, hydrogen-based production of hot briquetted iron (HBI), and carbon capture, utilization and storage (CCUS). This includes a number of partnerships with Australian iron ore producers to explore technologies to reduce carbon emissions across the steel supply chain.
And in August, Swedish steel producer SSAB delivered the world’s first shipment of steel made without the use of fossil fuels. The Hydrogen Breakthrough Ironmaking Technology (HYBRIT) — a joint venture between SSAB, state-owned utility Vattenfall, and the government-owned mining company LKAB — produced the world’s first hydrogen-reduced (in place of coking coal) sponge iron in June, then used to produce steel. They aim to produce fossil-free steel at industrial scale by 2026. Source: Companies’ reports and presentations
32Resources and Energy Quarterly September 2021

Table 3.1: World steel consumption and production Million tonnes Annual percentage change
Crude steel consumption 2020 2021f 2022f 2023f 2021f 2022f 2023f
China 974 1,034 1,056 1,066 6.2 2.1 1.0
European Union 155 164 165 167 5.8 0.9 1.3
United States 108 115 119 121 6.7 2.7 1.9
India 106 109 115 125 3.0 5.5 9.5
Japan 64 65 66 68 2.7 1.2 2.5
South Korea 52 53 55 56 2.0 2.7 2.5
Russia 45 47 48 48 4.7 1.6 1.5
Brazil 22 24 26 29 5.8 11.2 10.1
World steel consumption 1,883 1,992 2,046 2,097 5.8 2.7 2.5
Crude steel production 2020 2021f 2022f 2023f 2021f 2022f 2023f
China 1,065 1,093 1,107 1,114 2.6 1.3 0.6
European Union 131 137 137 137 4.5 -0.1 -0.3
India 100 113 124 135 12.5 9.9 9.1
Japan 83 93 97 100 11.7 3.9 3.6
United States 73 83 84 85 14.1 1.6 1.4
Russia 72 77 79 82 7.3 2.8 3.2
South Korea 67 71 73 75 6.0 2.8 2.6
Brazil 31 35 39 43 14.2 11.3 10.2
World steel production 1,878 1,962 2,017 2,069 4.5 2.8 2.6
Notes: f Forecast.
Source: World Steel Association (2021); Department of Industry, Science, Energy and Resources (2021)
33Resources and Energy Quarterly September 2021