3 w --/ - w) w 3 w )& , w &&-...
TRANSCRIPT

9HSTFMG*aegbaf+


Aalto University publication series DOCTORAL DISSERTATIONS 53/2012
Stability Issues of Dye Solar Cells
Muhammad Imran Asghar
Doctoral dissertation for the degree of Doctor of Science in Technology to be presented with due permission of the School of Science for public examination and debate in Auditorium K216 at the Aalto University School of Science (Espoo, Finland) on the 18th of May 2012 at 12 noon.
Aalto University School of Science Department of Applied Physics New Energy Technologies
Supervisor Prof. Peter Lund Instructor D.Sc. Kati Miettunen Preliminary examiners Prof. Ronald Österbacka, Åbo Akademi, Finland D.Sc. Kimmo Solehmainen, VTT Technical Research Centre of Finland Opponent Prof. Hironori Arakawa, Tokyo University of Science, Japan
Aalto University publication series DOCTORAL DISSERTATIONS 53/2012 © Muhammad Imran Asghar ISBN 978-952-60-4610-5 (printed) ISBN 978-952-60-4611-2 (pdf) ISSN-L 1799-4934 ISSN 1799-4934 (printed) ISSN 1799-4942 (pdf) Unigrafia Oy Helsinki 2012 Finland The dissertation can be read at http://lib.tkk.fi/Diss/ Publication orders (printed book): [email protected]

Abstract Aalto University, P.O. Box 11000, FI-00076 Aalto www.aalto.fi
Author Muhammad Imran Asghar Name of the doctoral dissertation Stability Issues of Dye Solar Cells Publisher School of Science Unit Department of Applied Physics
Series Aalto University publication series DOCTORAL DISSERTATIONS 53/2012
Field of research New Energy Technologies
Manuscript submitted 13 December 2011 Manuscript revised 1 February 2012
Date of the defence 18 May 2012 Language English
Monograph Article dissertation (summary + original articles)
Abstract The thesis discusses dye solar cells (DSCs) which are emerging as a potential candidate for many applications. The goal of the work was to find more stable and higher performing materials for flexible DSCs, improve understanding of the effects on the DSC stability, and to develop experimental methods that give improved resolution of the degradation mechanisms.
First an intensive critical literature review was done to highlight the important degradation mechanisms in DSCs. It was concluded that techniques giving chemical information are needed to understand the degradation reactions and their effect on electrical performance. It would be advantageous to have methods that enable monitoring chemical changes in operating DSCs, or periodically over their lifetime during accelerated ageing tests. Here the focus was on new and advanced in-situ methods that allow continuous study of the aging of the cells. In this regard, optical techniques such as Raman spectroscopy, newly introduced image processing method and recently introduced segmented cell method were employed to bridge the link between the chemical changes in the DSCs and the standard PV measurement methods. Here for instance the image processing was demonstrated to study the bleaching of electrolyte under ultraviolet and visible light at 85°C. The results obtained with the image processing method and the standard electrical measurements were in agreement and showed that the bleaching of electrolyte was initiated by TiO2 and slowed down by the presence of the dye.
For the roll-to-roll production of DSCs cheap, flexible and stable substrates are required. In this work, a series of metals i.e. StS 304, StS 321, StS 316, StS 316L and Ti were successfully stabilized at the CE of a DSC by using a sputtered Pt catalyst layer that doubled also as a corrosion blocking layer. This work was an important step forward towards stable flexible DSCs.
Finally, the degradation due to the manufacturing step related to the electrolyte filling in the DSC was studied. With the help of recently introduced segmented cell method, it was found the nanoporous film of TiO2 was acting as filter for some of the commonly used electrolyte additives i.e. tBP and NMBI. This resulted in spatial performance variation in the DSC which lead to significant losses in the overall performance (here up to 35 % losses in the up-scaling) and thus it has important implications for large area DSCs.
Keywords degradation, dye solar cell, image processing, Raman, stability
ISBN (printed) 978-952-60-4610-5 ISBN (pdf) 978-952-60-4611-2
ISSN-L 1799-4934 ISSN (printed) 1799-4934 ISSN (pdf) 1799-4942
Location of publisher Espoo Location of printing Helsinki Year 2012
Pages 162 The dissertation can be read at http://lib.tkk.fi/Diss/


1
Preface
This research work was carried out during 2008-2011 at the New Energy
Technologies group (NEW), Department of Applied Physics at School of
Science, Aalto University in Finland. The research activities were funded by
the Academy of Finland and CNB-E project of the Aalto University research
program Multidisciplinary Institute of Digitalization and Energy (MIDE).
During the work, I attended various conferences being supported by the
Graduate School of Energy Technology and Emil Aaltosen Säätiö.
I thank my supervisor Prof. Peter Lund for providing me the opportunity
to conduct research work on dye solar cells in a resilient atmosphere, and
for his kind support throughout the work. I also thank my instructor Dr.
Kati Miettunen for her kind support and guidance. Then I like to pay special
thanks to senior researcher Dr. Janne Halme, whom I admire a lot, for his
kind guidance and immense scientific knowledge that helped me in better
understanding of my research work. I am grateful to all my other past and
present colleagues Prof. Torben Lund, Prof. Reko Leino, Prof. Jouko
Korppi-Tommola, Prof. Juha Sinkkonen, Adjunct Prof. Hele Savin, Dr.
Antti Haarahiltunen, Dr. Mikko Mikkola, Dr. Minna Toivola, Kerttu Aitola,
Paula Vahermaa, Ghufran Hashmi, Henri Vahlman, Janne Patakangas,
Simone Mastroianni, Anders Rand Andersen, Nguyen Tuyet Phuong, Anna-
Stiina Jaaskelainen, Liisa Antila and Erno Kemppainen for the friendly and
cooperative attitude towards me. I also thank the summer and part time
working students Armi Tiihonen, Nadia Davouloury, Arnaud Hamon,
Sampo Kaukonen, Antti Ruuskanen and Mariko Landstrom for their
cooperation and making our time unforgettable.
In my personal life, first of all I thank Almighty Allah who gave me
enough strength to do this work and help me in all aspects of my life. Then I
thank last Prophet Muhammad (Peace Be Upon Him) for conveying His
message from Allah. I also like to thank Pakistan as a country whom I love

2
from depth of my heart. In my family, first I want to thank my grandparents
Syed Abdul Waheed, Sarwari Begum, Muhammad Ashraf and Maqbool
Khatoon for their prayers and priceless love. Then I like to thank my
parents Dr. Muhammad Asghar and Najma Asghar, who have done so
much that life becomes so easy and pleasant for me. All my life, I need your
love and prayers without which this life means nothing to me. Then I like to
thank my brothers Muhammad Nadeem Asghar, Muhammad Yasir Asghar
and Muhammad Zeeshan Asghar for their special kind treatment to their
younger brother. I also thank my sisters in law Sobia Nadeem, Sumreen
Yasir and Khaula Zeeshan. I also like to thank my cousins Sadia and Bushra
for their care and affection which never allowed me to miss a sister in my
family. I also like to thank Ayesha for her prayers and understanding. I am
also grateful to my uncles and aunts Muhammad Zafar, Muhammad Akhtar
and Alam Khatoon. I like to pay special thanks to my nieces and nephews
Ali, Haris, Maryam, Fajr, Uzma and Abdullah for their love. Finally, I like to
thank Zaina for her prayers and understanding.
I would like to express my special gratitude towards Finland as a country,
where I arrived 5 years ago and learnt a lot. I like to thank Finnish people in
general for their nice and polite attitude. I like to thank all my friends that I
made during my life.
Thank you.
Espoo, December 13th 2011
Muhammad Imran Asghar

3
Table of contents
Preface ........................................................................................ 1
List of Publications ..................................................................... 5
Author’s contribution ................................................................. 9
Abbreviations and symbols ........................................................ 11
1. Introduction ........................................................................ 14
1.1. Overview ........................................................................................... 14
1.2. Background and scope ...................................................................... 16
1.3. Outline of the thesis .......................................................................... 17
2. The dye solar cell ................................................................. 19
2.1. Dye solar cell structure ..................................................................... 19
2.2. Working principle of dye solar cells .................................................. 21
2.3. Degradation of dye solar cells .......................................................... 22
3. Measurement techniques and methods .............................. 24
3.1. I-V under 1 Sun ................................................................................ 25
3.2. Electrochemical impedance spectroscopy ....................................... 27
3.3. Raman spectroscopy ........................................................................ 30
3.4. Segmented cell method .................................................................... 33
3.5. Image processing method ................................................................ 35
4
3.5.1. Measurement setup and procedure ............................................. 36
3.5.2. Analysis ........................................................................................ 38
3.5.3. Correlation between electrolyte concentration and color ........... 39
4. Results and Discussion ....................................................... 41
4.1. Degradation mechanisms in the DSCs (Publication I & II) ............. 41
4.1.1. Stability tests for DSCs ................................................................ 42
4.1.2. Degradation at the photoelectrode .............................................. 43
4.1.3. Degradation at the counter electrode .......................................... 46
4.1.4. Degradation of the electrolyte ..................................................... 47
4.1.5. Sealing issues ............................................................................... 48
4.1.6. Cross-line between performance and stability limiting factors .. 49
4.1.7. Current state of the art of stability of DSC .................................. 50
4.2. Visual analysis of DSC (Publication III & IV) .................................. 52
4.2.1. Bleaching of electrolyte................................................................ 52
4.2.2. Effect of dye sensitization time on performance ......................... 57
4.3. Stabilization of flexible metal based DSCs (Publication V & VI) ..... 60
4.3.1. Stability of metal photoelectrodes ............................................... 60
4.3.2. Stability of metal counter electrodes ........................................... 61
4.4. Segmented cell method to study DSCs (Publication VII) ................ 68
5. Summary and Conclusions ................................................. 77
References ................................................................................ 82

5
List of Publications
This thesis is an introduction to the following original publications:
I Asghar, M.I., Miettunen, K., Halme, J., Vahermaa, P., Toivola, M.,
Aitola, K., and Lund, P., Review of stability for advanced dye
solar cells, Energy & Environmental Science 3, 418-426 (2010).
http://dx.doi.org/10.1039/b922801b
II Andersen, A.R., Halme, J., Lund, T., Asghar, M.I., Nguyen, P. T.,
Miettunen, K., Kemppainen, E., and Albrektsen, O., Charge
Transport and Photocurrent Generation Characteristics in
Dye Solar Cells Containing Thermally Degraded N719 Dye
Molecules, The Journal of Physical Chemistry C 115, 15598-15606
(2011). http://dx.doi.org/10.1021/jp201658j
III Asghar, M.I., Miettunen, K., Mastroianni, S., Halme, J., Vahlman,
H., and Lund, P., In-situ image processing method to
investigate performance and stability of dye solar cells,
Solar Energy 86, 331-338 (2012).
http://dx.doi.org/10.1016/j.solener.2011.10.006
IV Asghar, I., Miettunen, K., Mastroianni, S., Halme, J., and Lund, P.,
Demonstration of image processing method to investigate
performance and stability, 26th European Photovoltaic Solar
Energy Conference, Hamburg, Germany, September 5-9, 2011,
Proceedings of 26th European Photovoltaic Solar Energy
Conference, 563-566 (2011).
http://dx.doi.org/10.4229/26thEUPVSEC2011-1DV.3.27

6
V Miettunen, K., Asghar, I., Ruan, X., Halme, J., Saukkonen, T., and
Lund, P., Stabilization of metal counter electrodes for dye
solar cells, Journal of Electroanalytical Chemistry 653, 93-99
(2011). http://dx.doi.org/10.1016/j.jelechem.2010.12.022
VI Miettunen, K., Asghar, I., Halme, J., and Lund, P., Improved
performance and stability of flexible dye solar cells, 26th
European Photovoltaic Solar Energy Conference, Hamburg,
Germany, September 5-9, 2011, Proceedings of 26th European
Photovoltaic Solar Energy Conference, 587-590 (2011).
http://dx.doi.org/10.4229/26thEUPVSEC2011-1DV.3.36
VII Miettunen, K., Asghar, I., Mastroianni, S., Halme, J., Piers, R.F.
Barnes, Rikkinen, E., O’Regan, B., and Lund, P., Effect of
molecular filtering and electrolyte composition on the
spatial variation in performance of dye solar cells, Journal
of Electroanalytical Chemistry 664, 63-72 (2012).
http://dx.doi.org/10.1016/j.jelechem.2011.10.012
7
Other publications by the author not included in the thesis:
1. Asghar, M.I., Miettunen, K., Halme, J., Toivola, M., Aitola, K.,
Vahermaa, P., and Lund, P., Stability issues of improved dye
sensitized solar cells, 24th European Photovoltaic Solar Energy
Conference, Proceedings of 24th European Photovoltaic Solar
Energy Conference, 93-96 (2009). http://dx.doi.org/
10.4229/24thEUPVSEC2009-1AO.6.5
2. Miettunen, K., Toivola, M., Hashmi, G., Salpakari, J., Asghar, I., and
Lund, P., A carbon gel catalyst layer for the roll-to-roll
production of dye solar cells, Carbon 49, 528-532 (2010).
http://dx.doi.org/10.1016/j.carbon.2010.09.052
3. Hashmi, G., Miettunen, K., Peltola, T., Halme, J., Asghar, I., Aitola,
K., Toivola, M., and Lund, P., Review of materials and
manufacturing options for large area flexible dye solar
cells, Renewable and Sustainable Energy Reviews 15, 3717-3732
(2011). http://dx.doi.org/10.1016/j.rser.2011.06.004
4. M.I. Asghar, I. Hakala, J. Jantunen, H. Kettunen, J. Qi, A. Varpula,
K. Güven, I.V. Semchenko, S.A. Khakhomov, R. Gonzalo, E Özbay,
V. Podlozny, A. Sihvola, S. Tretyakov, and H. Wallén
Electromagnetic Cloaking with a Mixture of Spiral
Inclusions. Metamaterials 2007, Rome, Italy, 22-26 October 2007,
957-980 (2007).
5. V. Vähänissi, A. Haarahiltunen, M. Yli-Koski, H. Talvitie, M. I.
Asghar, and H. Savin, Effect of oxygen in low temperature
boron and phosphorus diffusion gettering of iron in
Czochralski-grown silicon, Solid State Phenomena Vols. 156-
158 395-400 (2010).
http://dx.doi.org/10.4028/www.scientific.net/SSP.156-158.395
6. H. Savin, M. Yli-Koski, A. Haarahiltunen, V. Virkkala, H. Talvitie,
M. I. Asghar, and J. Sinkkonen, Gettering in silicon-on-
insulator wafers with polysilicon layer, Material Science and
Engineering B, Volumes 159-160, 259-263 (2009).
http:/dx.doi.org/10.1016/j.mseb.2008.12.024
7. H. Talvitie, A. Haarahiltunen, H. Savin, M. Yli-Koski, M. I. Asghar
and J. Sinkkonen, Effect of internal gettering of iron on
electrical characteristics of devices, Material Science and

8
Engineering B, Volumes 159-160, 269-273 (2009).
http:/dx.doi.org/10.1016/j.mseb.2008.10.048
8. M.I. Asghar, M. Yli-Koski, H. Savin, A. Haarahiltunen, H. Talvitie,
and J.Sinkkonen, Competitive iron gettering between
internal gettering sites and boron implantation in CZ-
silicon, Material Science and Engineering B, Volumes 159-160,
224-227 (2009). http://dx.doi.org/10.1016/j.mseb.2008.12.028
9. A. Haarahiltunen, H. Savin, M. Yli-Koski, H. Talvitie, M. I. Asghar,
and J. Sinkkonen, As-grown iron precipitates and gettering
in multicrystalline silicon, Material Science and Engineering B,
Volumes 159-160, 248-252 (2009).
http://dx.doi.org/10.1016/j.mseb.2008.10.053
10. A. Haarahiltunen, H. Talvitie, H. Savin, M. Yli-Koski, M. I. Asghar,
and J. Sinkkonen, Modeling boron diffusion gettering of iron
in silicon solar cells , Applied Physics Letters 92, 021902
(2008). http://dx.doi.org/10.1063/1.2833698
11. A. Haarahiltunen, H. Talvitie, H. Savin, O. Anttila, M. Yli-Koski, M.
I. Asghar, and J. Sinkkonen, Gettering of iron in silicon by
boron implantation, Journal of Materials Science: Materials in
Electronics 19, 41 (2008). http://dx.doi.org/10.1007/s10854-008-
9640-2
12. H. Savin, M. Yli-Koski, A. Haarahiltunen, H. Talvitie, M.I. Asghar
and J. Sinkkonen, Copper induced lifetime degradation is
silicon solar cell material, Proceedings of the 23rd European
Photovoltaic Solar Energy Conference, 66-68 (2008).
http://dx.doi.org/10.4229/23rdEUPVSEC2008-1AO.5.5
13. A. Haarahiltunen, H. Savin, M. Yli-Koski, H. Talvitie, M.I. Asghar
and J., Sinkkonen, Heterogeneous Iron Precipitation and
Gettering in Multicrystalline Silicon, Proceedings of the 23rd
European Photovoltaic Solar Energy Conference, 488-490 (2008).
http://dx.doi.org/10.4229/23rdEUPVSEC2008-1CV.2.13
14. A. Haarahiltunen, H. Talvitie, H. Savin, M. Yli-Koski, M. I. Asghar,
and J. Sinkkonen, Modeling boron diffusion gettering of iron
in silicon solar cells , Applied Physics Letters 92, 021902
(2008). http://dx.doi.org/10.1063/1.2833698
9
Author’s contribution
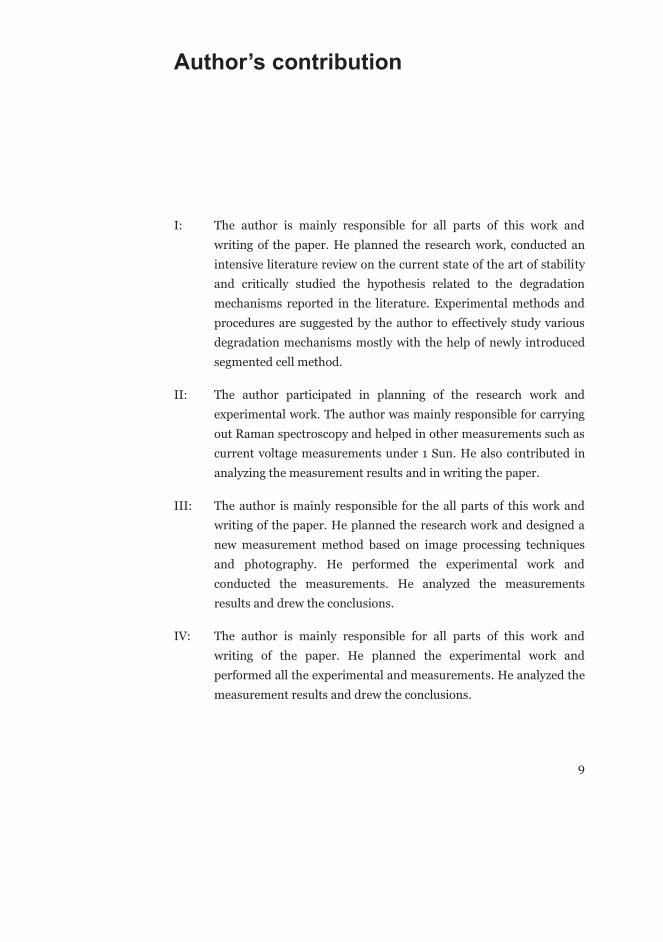
I: The author is mainly responsible for all parts of this work and
writing of the paper. He planned the research work, conducted an
intensive literature review on the current state of the art of stability
and critically studied the hypothesis related to the degradation
mechanisms reported in the literature. Experimental methods and
procedures are suggested by the author to effectively study various
degradation mechanisms mostly with the help of newly introduced
segmented cell method.
II: The author participated in planning of the research work and
experimental work. The author was mainly responsible for carrying
out Raman spectroscopy and helped in other measurements such as
current voltage measurements under 1 Sun. He also contributed in
analyzing the measurement results and in writing the paper.
III: The author is mainly responsible for the all parts of this work and
writing of the paper. He planned the research work and designed a
new measurement method based on image processing techniques
and photography. He performed the experimental work and
conducted the measurements. He analyzed the measurements
results and drew the conclusions.
IV: The author is mainly responsible for all parts of this work and
writing of the paper. He planned the experimental work and
performed all the experimental and measurements. He analyzed the
measurement results and drew the conclusions.

10
V: The author participated in planning of the work and in conducting
the experimental work. He helped in analyzing the measurement
results and also contributed in the writing process.
VI: The author participated in planning of the work. He helped in
analyzing the measurement results.
VII: The author contributed mainly in the experimental work and the
measurements specially the Raman spectroscopy. He also helped in
planning the research work and analyzing the measurement results.
The author also contributed in writing the paper.

11
Abbreviations and symbols
Abbreviations
AC alternating current
ACN acetonitrile
AM1.5G air mass 1.5 global
ASTM American Society for Testing and Materials
BIPV building integrated photovoltaics
CB conduction band
CdTe cadmium telluride
CE counter electrode
CNT carbon nanotube
CO contact
COL (electron) collection
CPE constant phase element
CT charge transfer
CuInGa(Se)2 copper indium gallium selenide
DC direct current
dcbpy dicarboxybipyridine
DSC dye solar cell
EDX energy dispersive X-ray spectroscopy
EIS electrochemical impedance spectroscopy
EU European Union
FTIR Fourier transform infrared
FTO fluorine doped tin oxide
Gu guanidium
HOMO highest occupied molecular orbital
HSE high stability electrolyte

12
HTM hole transparent material
I- iodide ion
I3- tri-iodide ion
IEC international electrotechnical commission
IEA international energy agency
IPCC intergovernmental panel on climate change
IPCE incident-photon-to-collected-electron efficiency
ITO indium-tin-oxide
I-V current-voltage
LUMO lowest unoccupied molecular orbital
MOS metal oxide semiconductor
MPN methoxypropionitrile
MPP maximum power point
MS mass spectroscopy
NIR near infrared
NMBI N-methylbenzimidazole
OC open circuit
PE photoelectrode
PEN polyethylenenaphthalate
PET polyethlyeneterephtalate
PMII 1-propyl-3-methylimidazolium iodide
PV photovoltaic; photovoltaics
R resistor
redox reduction-oxidation
RGB red, green, blue
RT room temperature
S series
SC short circuit
SCN thiocyanate
SEM scanning electron microscopy
SRC standard reporting conditions
StS stainless steel
SU substrate
TCO transparent conductive oxide
UV ultraviolet
VN valeronitrile
4-tBP 4-tert-butylpyridine

13
Symbols
c speed of light (m/sec)
C concentration (mol/dm3)
D diffusion coefficient (of electrons), (m2/s)
d thickness; photoelectrode film thickness, (m)
e- electron
E energy, (J)
f frequency, (Hz)
F Faraday’s constant
FF fill factor, (no units)
h Plank constant
i current density, (A/m)
I0 intensity of the incident laser beam
k index of resistance component
K(ν) frequency dependent terms
P power density, (W/m2)
qe elementary charge, (C)
R reflectance (%); resistance (per unit area) ( m-2) S sensitizer
S* excited sensitizer
S+ oxidized sensitizer
t time, (s)
T transmittance, (%)
ν Raman shift (cm-1)
V voltage, (V)
Z impedance (per unit area), ( m2)
photon flux (m-2s-1)
efficiency, (%)
light wavelength, (m)
time constant, (s)

14
1. Introduction
1.1. Overview
Life is all about energy handling as all living creatures use energy to
maintain their life. Humans like other living creatures consume energy.
With increasing human population and change in human lifestyle the
consumption of energy increases every year. By the year 2011, the global
energy demand is about 13TW [1] which is expected to be 16 TW by the year
2030. Currently, 85% of the needs are fulfilled by fossils fuels [1] which
results in carbon emission into the atmosphere. It results in global warming
which is big challenge to the society now. According to Intergovernmental
panel on climate change (IPCC), 60-80% reduction in the carbon emission
is needed by year 2020 in order to limit the climate change [2]. It stresses
towards acquiring clean energy and its efficient use. European Union (EU)
sets some objectives for energy technology [3] which includes lowering the
price of clean energy and putting EU industry at forefront of low carbon
emission technology.
German physicist Hermann Von Helmholtz calculated the time for which
Sun can provide energy to the Earth and found it to be order of 20 million
years approximately [4], hence it can be regarded as an unlimited source of
energy. This renewable energy source can provide more than the required
energy to fulfill the world's energy needs. Statistics show that in just a
couple of hours enough sunlight falls on the Earth's surface to meet the
whole world's energy needs for one year [5]. International Energy Agency
(IEA) predicted that by the year 2060, the solar energy would meet half of
the world’s energy demand and most of the world’s electricity demand [6].
Approximately two billion people in the world are living without electricity
[5]. There are no grid connections to most of such places; hence
conventional electricity sources are not useful. However, the Sun shines to
most of such places. It shows the potential and bright future of solar energy.

Introduction
15
There are two ways to utilize the solar energy i.e. by converting it to
thermal energy or to electric energy. A device or tool that converts the light
energy directly into electric energy is known as photovoltaic cell. If the
source of the light is sun, then it is usually called a solar cell. Photovoltaics
generate electricity in a clean and silent way with no moving parts. They
have aesthetic value as well. They are widely seen as reliable, sustainable,
natural and environmentally friendly energy technology. The photovoltaic
market is exponentially growing every year. In year 2010, the annual
production of photovoltaic cells reached 23.5 GW [7].
Several types of solar cells exist today. The so called first generation
conventional crystalline silicon solar cells are still dominating the PV
market by over 85% [7]. The mono-crystalline silicon solar cells have
achieved around 27.6% [7] efficiency which is very close to the theoretical
limit for silicon solar cells. However, these types of cells require very high
quality of crystalline silicon which usually requires expensive processing in
the clean rooms which adversely affect the price of the end product. This led
the researchers to think of using multi-crystalline silicon solar cells which is
much cheaper than mono-crystalline silicon but with reduced efficiencies
i.e. 20.4% [7]. However, these cells are still very expensive due to the
amount of material used i.e. the thickness of wafers (200 micrometer). This
led to the thin film solar cells which are often regarded as second
generation of solar cells. It includes cadmium telluride (CdTe), copper
indium gallium selenide (CuInGa(Se)2) and amorphous silicon. The cost of
these types of cells is much lower than first generation cells, however,
stability and lower performance are the main issues to these type of solar
cells. The third generation of solar cells includes multi-junction solar cells,
organic solar cells and dye solar cells. Multi-junction solar cells, which use
multiple junctions to increase the absorption of the sunlight, have achieved
the record efficiencies of 43.5% [7]. They are, however, the most expensive
solar cells among all types. Both the dye solar cells and the organic solar
cells are aiming for low cost with additional features such as flexibility of
the cells and feasibility large scale roll to roll production. The highest
efficiency for the organic cells is 8.6% [7] whereas dye solar cells have
achieved around 12.3% efficiency [9]. Dye solar cells (DSCs) offer a lot of
features such as variety of colors, usage of easy available non-toxic

Introduction
16
materials, flexibility of substrates, feasibility for large scale roll-to-roll
production, and efficient working under low light intensities.
The fate of a certain type of solar cell depends primarily on its
performance, life time and cost. Other fundamental factors include
availability and non-toxicity of materials, and compatibility with the
technological facilities needed to manufacture them. Most importantly, it
depends on the final application to which the solar cell is installed.
1.2. Background and scope
The main advantage of the DSCs is that they can provide cheaper electricity
as compared to the conventional crystalline silicon solar cells due to usage
of cheap materials, simple and easy manufacturing methods, and feasibility
for large scale roll-to-roll mass production on flexible substrates [10].
Specially, the possibility of being flexible, acquiring a variety of colors,
usage of non-toxic materials and possibility of low weight makes them ideal
choice for the building integrated photovoltaics (BIPV). However,
commercialization of this technology requires long term stability which is
still a challenge for this technology. To overcome this hindrance, a
systematic study to understand the degradation mechanisms of DSCs is
needed.
Traditionally, DSCs are made on glass based substrates which are on one
side coated with a transparent conducting oxide (TCO). Although in most
electronics industry indium doped tin oxide (ITO) is used as TCO, due to
the high temperature thermal treatments fluorine doped tin oxide (FTO) is
commonly used in the traditional DSCs. According to an estimate about
60% of the total material cost of DSCs consists of these TCO glasses [11].
One way to decrease the cost of DSCs is to use cheap metal substrates [10];
however, there are some chemical stability issues involved. The other
possibility to decrease the price by using TCO coated plastic substrates
coated with the advantage that they can be mass produced using roll-to-roll
production. However, the ideal solution would be the complete removal of
the TCO from the substrates. Similarly, other expensive components of a
DSC such as platinum catalyst and dye can be replaced with cheaper

Introduction
17
options. One big challenge in all these efforts to bring the costs of DSCs
down is their effect on the stability of the DSC.
The goal of this research work is to improve the stability of the DSCs. For
this purpose, the first step is to develop better understanding of the
degradation modes in DSCs and to use easy and fast methods to thoroughly
study the degradation mechanisms in-situ. For the up-scaling of the DSCs,
it is essential to resolve degradation issues related to the cheap flexible
metal substrates in DSCs and other degradation issues originated from the
manufacturing processes. In order to realize commercialization, a DSC
needs to demonstrate high performance at low cost for long term operation.
Hence, the materials used in the DSC should be cheap and feasible for roll-
to-roll manufacturing at the same time, and the DSCs should be stable for
long term operation.
In this research work, a thorough literature review is done to find out the
current state of the art of stability of DSCs. It was found that there are no
defined standards to test the stability of DSCs. However, there are some
commonly used tests which come from thin film solar cells such as light
soaking and thermal tests. In addition, it was found that there are several
degradation mechanisms reported in the literature regarding the
degradation of DSCs which need further investigation. Therefore, during
this research work several important degradation processes were
investigated such as dye degradation, electrolyte bleaching, stability of
catalyst layers, and ageing of metal based DSCs. In addition, a novel in situ
method based on visual analysis was introduced to study the performance
and stability of DSCs. Furthermore, the performance degradation due to the
spatial distribution of the additives in the electrolyte during the electrolyte
filling step in the cell preparation is studied in this work.
1.3. Outline of the thesis
The thesis is organized in five chapters followed by the appendix and the
original publications. The content of these chapters are as follows:

Introduction
18
The Chapter 1 introduces the motivation and the scope of this thesis and
also gives a brief background of the studies.
The Chapter 2 covers the basic structure and functioning of dye solar cells.
It also includes the performance parameters of the cells and their
preparation in the laboratory.
The Chapter 3 deals with the measurements methods and techniques that
have been used in the research. A brief introduction to the measurement
techniques is given and their application on the dye solar cells is discussed.
The Chapter 4 is comprised of main results of the research work done in
this thesis, reported originally in the Publications I-VII. The results are
summarized and thoroughly discussed.
The Chapter 5 is about the key findings in the research work and important
conclusions made on the basis of those findings. The contributions and
implications of this thesis to the field of dye solar cells are discussed.
The original Publications I-VII are reproduced at the end of the thesis with
the kind permission from the copyright holders.

19
2. The dye solar cell
2.1. Dye solar cell structure
Dye solar cell (DSC) comprises of a photo-electrochemical device consisting
of a photoelectrode (PE), hole transparent material (HTM) i.e electrolyte
and a counter electrode (CE) sandwiched together. The schematic of the
structure of a DSC is shown in the Figure 1.
Figure 1. The schematics of structure of a DSC [12]
The photoelectrode consists of a nanoporous film of a semiconductor
oxide usually TiO2 (5-20 μm thick) sensitized with a monolayer of a photo
sensitive dye, deposited on a TCO coated substrate. The most common dye
used in DSC is hydrophilic red dye (cis-bis (isothiocyanato) bis(2,2'-
bipyridyl-4,4'-dicarboxylato)-ruthenium(II)bis-tetrabutylammonium)
which is usually referred as N719. In conventional glass based DSCs, the
TCO is composed of FTO and substrate is rigid glass. In flexible DSCs based
on plastic substrates such as polyethyleneterephalate (PET) and
-
e-
-- -
+
Dye 1.5 nmTiO2 10 – 30 nm
3I-I3-
e-
e-
PtTCO
TCO 0.5 – 1 mGlass 2 – 3 mm
Glass
Electrolyte
5 – 20 m
5 – 20 m
Photo-electrode
Counter electrode

The dye solar cell
20
polyethylenenaphthalate (PEN), ITO is used as TCO [13,14,15,16]. To
achieve a good conduction of the electrons through the nanoporous film of
TiO2, the film is sintered at 450-500 °C for approximately 30 minutes. This
treatment improves the contact between the nano particles and also burns
out the solvents of the TiO2 paste as well as organic impurities. However, in
the case of plastic based DSCs, the temperature treatments are limited to
150 °C. Therefore, other techniques such as pressing [13,14] and laser or
ultra violet treatments [15,16] have been also applied to improve the contact
between the TiO2 particles. Generally, the quality of nanoporous films is
better in glass based DSCs than plastic based DSCs. Fortunately, many
flexible metal based photoelectrodes can be sintered at the same high
temperatures as in the case of glass based photoelectrodes [17,18,19].
Hence, high quality nanoporous TiO2 films can be achieved in metal based
DSCs.
The HTM can be a solid or liquid state electrolyte. Liquid electrolytes
having iodide/tri-iodide redox couple as a redox mediator are mostly being
used as HTM in the DSC. The common solvents in the electrolytes includes
3-methoxypropionitrile (MPN) and a mixture of acetonitrile:valeronitrile
(ACN:VN). However, MPN is preferred over ACN:VN due to its non-toxicity
and higher boiling point to reach better stability [20]. The boiling point of
MPN is 164-165 °C whereas that of ACN is only 81-82 °C. Two important
factors that need to be considered in the case of liquid electrolyte are the
sufficient vapor pressure (volatility) to reach good stability and low
viscosity of a liquid electrolyte to get good performance. Another type of
electrolytes based on ionic liquid has been used in DSCs due to its non-
volatility and excellent stability [21,22,23]. However, the limiting factor for
such electrolytes may be their high viscosity causing sluggish charge
transfer [20].
The counter electrode is composed on a substrate coated with a TCO layer
and a catalyst layer. The commonly used substrate is FTO-glass. In plastic
based DSCs, mostly it is PET or PEN with ITO coating. Typically the
catalyst film is composed of a few nanometers of Pt particles. There are
several ways to deposit Pt on glass or plastic substrate such as thermal
platinization [24,25], sputtering [26,27], chemical deposition [28,29], and
electrochemical deposition [19,24,30,31]. Another catalyst material that has
been used is carbon. As the catalytic properties of carbon are not as good as

The dye solar cell
21
those of Pt, a thicker layer of few micrometers is required to achieve the
same catalytic properties [32,33]. Thermal platinization has been the most
stable option so far [21-25], however, it requires a high temperature
treatment step at 385 °C for 20 minutes. Therefore, that method cannot be
applied on plastics and alternative low temperature treatments such as
sputtering are required. Some metal substrates could endure the high
temperature treatment but typically better performance is gained with low
temperature treatments e.g. sputtering as shown e.g. in Publication V.
2.2. Working principle of dye solar cells
In this section the working principle of a DSC is thoroughly explained with
the help of the Figure 2.
Figure 2. The schematic is showing the working principle of a DSC including all
the steps and reactions involved during a complete working cycle and the
energy levels in the process [12].
When the light falls on a DSC, the photosensitive dye absorbs the light
and gets into an excited state by the electrons jumping from the highest
occupied molecular orbital (HOMO) to the lower unoccupied molecular
orbital (LUMO) as shown in the step 1 in the Figure 2. The dye immediately
DyeTiO2 Pt TCOTCOGlass GlassElectrolyteEnergy
CBLUMO
HOMO
Load
2e-
2e-Eredox
3I--
I3-
-
- -
Photoelectrode Counter electrode
(1)
(3)
(4)
(6) (5)
(2)
(a)(b)
(c)
2e-

The dye solar cell
22
injects the electrons into the conduction band of the TiO2 and attains
oxidized state as shown in step 2. The oxidized state is reduced by the
iodide in the electrolyte which in turn gets oxidized to tri-iodide as shown in
the step 3. The tri-iodide is transported to the CE through the electrolyte
layer. On the other side, the injected electrons are diffused through the TiO2
film to the TCO layer from where they move through the external load and
reach the other side of the DSC i.e. CE as marked as step 4 in the Figure 2.
At the CE, the tri-iodide is reduced to iodide as shown as step 5. The dye is
ready to absorb new photons and the iodide generated at the CE is ready to
regenerate the oxidized dye as shown in the step 6 as shown in the Figure 2.
Those electrons in the LUMO which fail to transfer to the conduction band
of TiO2, may drop to the HOMO as shown in process (a) in the Figure 2.
Similarly, the electrons in the conduction band may be recombined with the
dye or the electrolyte as shown in the process (b) and (c) respectively in the
Figure 2.
2.3. Degradation of dye solar cells
Degradation can be defined as loss of performance with the passage of time.
The degradation may be permanent (irreversible) or temporary (reversible).
During the last two decades, several degradation mechanisms have been
reported in the literature (Publication I & II) under different conditions
leading to the partial or complete loss of the performance of DSCs.
Sometimes degradation occurred due to chemical instability of the
materials (Publication V & VI), sometimes it occurred due to the stress
factors such as temperature, humidity, ultraviolet and visible light intensity
(Publication III & IV). Both stable and unstable results have been reported
in the literature using different materials prepared with different
manufacturing methods (Publication I). Lots of materials have been used in
a DSC at different locations i.e. at PE, at CE or in the electrolyte. The
stability data suggests that it is the right combination of materials at the
right place that leads to the long term stability for DSCs [21,22,23,46].
The stability of DSCs can be further divided into extrinsic and intrinsic
stability. The extrinsic stability includes the sealing issues. Good extrinsic
stability is essential to study the intrinsic stability. The intrinsic stability

The dye solar cell
23
deals with the degradation mechanisms inside a DSC and their effect on the
stability of the device i.e. DSC.
The manufacturing methods also play an important role on the stability of
DSCs, as the same material prepared with different manufacturing methods
have been shown different stability (Publication V). For instance, thermally
platinized has shown better stability as compared to sputtered Pt at the CE
on the glass based DSC at 80°C [54], whereas sputtered Pt showed better
stability results as compared to thermally platinized at the CE on a metal
based DSC (Publication V&VI).
The state of the art of stability of DSC is that rigid glass based DSC have
been demonstrated as stable under light soaking tests at 60°C and thermal
tests at 80°C for 1000 hours (Table 4). However, the flexible DSCs based on
plastic and metals have been stable under light soaking at RT (Publication
V) and stability at 80°C for 1000h has not been achieved yet. No DSC has
yet passed light soaking test at 80°C for 1000 hours.

24
3. Measurement techniques and methods
The aim of this chapter is to familiarize the measurement techniques and
methods that were used in this work. Some of the measurement techniques
are fundamental and are routinely used in the evaluation of the
performance of a solar cell such as I-V measurements under 1 Sun,
electrochemical impedance spectroscopy (EIS) and incident-photon-to-
collected-electron efficiency (IPCE). There are also other methods which
are specifically applied to study a particular phenomenon in the device such
as Raman spectroscopy, segmented cell method and image processing
method. To effectively study the degradation mechanisms in DSCs,
techniques giving chemical information are needed. Unfortunately most of
the chemical techniques such as mass spectroscopy (MS) require
disassemble of the DSC which is hampering their use as a standard PV
technique. However, chemical information can be obtained by using the
standard PV methods and some other methods such as Raman
spectroscopy and image processing method after finding a relationship of
the chemical changes in DSCs with these techniques. This way the
degradation reactions may be studied using the in-situ measurement
methods. The Figure 3 shows the measurement techniques used in this
work and are categorized as destructive and non-destructive. Some of these
techniques are discussed in later sections.

Measurement techniques and methods
25
Figure 3. The measurements techniques used in this work categorized as
destructive and non-destructive. The arrows are pointing to show that in
respective publications these measurements are used together with standard
PV measurement techniques.
3.1. I-V under 1 Sun
The performance of a solar cell is usually expressed in terms of its efficiency
of converting light energy into electricity. The standard way to measure the
efficiency of solar cells is by measuring its current-voltage (I-V). Generally,
I-V measurements are performed in a solar simulator in standard reporting
conditions (SRC) e.g. 1000 W/m2 of light intensity with spectrum of air
mass 1.5 global (AM1.5G) at 25°C. This standard condition is also referred
as 1 Sun. An example of I-V curve of a solar cell is shown in the Figure 4.

Measurement techniques and methods
26
Figure 4. Typical I-V curve of a solar cell and its characteristic parameters
The important characteristic parameters include short circuit current
density (iSC), open circuit voltage (VOC), and fill factor (FF). The FF is
defined as
SCOC
MPPMPP
iViVFF V
(1)
where iMPP and VMPP are the current density and voltage at the maximum
power point (MPP) respectively. The maximum power per unit area
delivered by the solar cell is given by
MPPMPPMAX iVP V (2)
Therefore, in terms of basic characteristic parameters, the maximum power
for unit area can be expressed as
FFiVP SCOCMAX V (3)
The efficiency of a solar cell is defined as the ratio of the maximum power
produced by the cell (W/m2) to the power of the incident light PlN (W/m2).
IN
MAX
PPP
(4)

Measurement techniques and methods
27
Finally in terms of characteristic parameters, the efficiency of a solar cell is
given as
IN
OC
PFFiV SCV
(5)
3.2. Electrochemical impedance spectroscopy
Electrochemical impedance spectroscopy (EIS) is used to study the
impedances occurring at different components and their interfaces in a
device, here DSC, during its operation. The different components of DSCs
have different time constants and thus their impedance response appears at
different frequencies which can be studied by scanning a range of
frequencies. Before an EIS measurement, DSC is set to steady state
operating condition on the I-V curve. During the measurement, the DSC is
perturbed with an AC voltage superimposing the DC voltage (operating
condition) and the resulting AC current is measured for a certain frequency
range. This gives the impedance response of the DSC. The impedance
response of the DSC can be understood by fitting the equivalent circuit
model for DSC which is shown in the Figure 5 to the measured EIS
spectrum.
Figure 5. Equivalent circuit model of a DSC [17,34,35,36]. Figure from
Publication V.
Substrate TiO2 Electrolyte Substrate
PtRs
RSU
RCO
CPECO
CPESU
rCTrCTrCT
rtrtrt
cpeCTcpeCTcpeCT
Zd
RCE
CPECE

Measurement techniques and methods
28
The equivalent circuit model parameters are as follow:
- RS is the ohmic series resistance. It is the sum of the contributions
from sheet resistance of the substrates (dominant factor), resistivity
of the electrolyte, electrical contacts and external wiring.
- Rt (= rtd) is the total electron transport resistance in the TiO2 film.
rt is the resistivity of the electron transport in the TiO2 film and d is
the thickness of the TiO2 film.
- Zd is the mass transport impedance at the counter electrode caused
by ionic diffusion in the electrolyte.
- There are also several constant phase element (CPE) / resistor (R)
pairs which are related to different interfaces denoted in the
subscript: SU the PE substrate / electrolyte, CO the PE substrate /
the porous TiO2, CT the TiO2 / electrolyte interface, and CE the
counter electrode/electrolyte. CPE represents a realistic electrode
with an uneven and porous surface instead of a pure idealistic
capacitor. R is the charge transfer resistance at the interface.
The impedance spectroscopy data are presented in Nyquist and Bode
plots. In Nyquist plot, the real and imaginary parts of the impedance at
each frequency are plotted in complex planes. In Bode plot, the real and
imaginary parts are plotted separately as a function of frequency. A Nyquist
plot of a typical impedance response of a DSC gives at high negative
voltages two arcs as shown in the Figure 6a. In Bode plot it gives two peaks
at high negative voltage as shown in the Figure 6b. Generally at high
negative voltages, one arc in the Nyquist plot and one peak in the Bode plot
is a result of the RCE and CPECE pair (in Figure 6 at about 1 kHz). Similarly,
at high negative voltages, other arc in Nyquist plot and other peak in Bode
plot is a result of RCT and CPECT pair (in Figure 6 at about 10 Hz).
Sometimes at high negative voltages Zd giving a Warburg element appears
(in Figure 6 at about 10 Hz) and it is mostly overlapped with the RCT and
CPECT pair (in Figure 6a&b). The value of RS can be obtained from the
Nyquist plot by the real axis value at the point where the left most arc
begins.

Measurement techniques and methods
29
0 2 4 6 8 10 12 14 16 1801234
b)Im
agin
ary
(Ohm
.cm
-2)
Frequency (Hz)
Imag
inar
y(O
hm.c
m-2
)
RDRCTRS
RCE
Real (Ohm.cm-2)
a)
10-2 100 102 10401234
E CEPE
Figure 6. EIS response of a DSC a) a Nyquist plot: real and imaginary part vs
frequency (100 mHz – 100 kHz) b) Bode plot: imaginary impedance vs.
frequency.
Usually EIS is measured in dark as a function of external voltage to get a
broader view of the performance of the individual components in a DSC. In
stability studies usually the aged cells show lower RCT and higher CPECT at a
certain voltage compared to their initial state as shown in the Figure 7a&b.
In order to study the performance of light independent series connected
components of a DSC such as RS and RCE, measurements done at the same
current conditions can be quantitatively compared [12,17]. The easiest way
to do this is to carry out the measurements at the open circuit conditions
under illumination as done in Publication V.

Measurement techniques and methods
30
Figure 7. a) Resistance RPE and b) capacitance CPE caused by the parallel
connected TiO2 / electrolyte and PE substrate / electrolyte interfaces in a DSC
with Pt sputtered StS 316 as a counter electrode before and after the light
soaking test measured by EIS in the dark. Note that RCT = RPE and CPECT = CPE.
Figure is from Publication V.
3.3. Raman spectroscopy
Raman spectroscopy is a spectroscopic technique that relies on inelastic
scattering (the frequency of photons changes after interaction with the
sample), also known as Raman scattering, of a monochromatic light usually
from a laser source. Upon interaction with the sample, the photons of the
laser get absorbed by the sample and then reemitted by it. If the frequency
of the reemitted photons is the same as the original frequency of the
incident photons, it is Rayleigh scattering. If the frequency of these
-0.7-0.6-0.5-0.4-0.3-0.2-0.10
V / V
RP
E /
Ωcm
2
BeforeAfter
106
105
104
103
102
101
100
a)
-0.7-0.6-0.5-0.4-0.3-0.2-0.10
V / V
CP
E /
Fcm-2
BeforeAfter
10-2
10-3
10-4
10-5
b)

Measurement techniques and methods
31
reemitted photons either shifted up (anti-stokes) or shifted down (stokes)
from the initial frequency value, it is called Raman scattering. In confocal
microscopy, it is possible to focus on a small area undisturbed from the
signals originating from unintended area with the help of confocal optics.
Thus Raman allows the analysis volume to be as small as a few cubic
micrometers. Mostly, Raman spectroscopy is used for qualitative purposes,
e.g. determination of molecular structures, but also quantitative analysis
has been reported [38,39]. The intensity of a Raman peak I(ν) is given by
[38]:
I(ν) = I0 K(ν) C (6)
where I0 is the intensity of the incident laser beam, K(ν) includes the
frequency dependent terms, ν is the Raman shift in cm-1, and C is the
concentration of the measured specie. By assuming that the intensity of the
laser power and the frequency dependent factors remain constant, the
intensity of species peak at a particular Raman shift becomes directly
proportional to its concentration. Therefore, the height of the Raman peak
can be used to estimate the concentration of different species [38].
In this work, the Raman spectroscopy was performed by using a HORIBA
Jobin Yvon LabRam 300 micro-Raman spectrometer. It was equipped with
a 514 nm argon laser. The power of the laser beam was 1.24 mW which was
further reduced to 0.0124 mW by using a filter in the measurement setup.
In the measurements, the laser spot size was approximately 5000 μm2 and
the measurement time was 5 seconds for a single measurements.
The main advantages of the Raman spectroscopy are that it is a fast and
non-destructive technique (i.e. does not require cell disassembly) giving
chemical information which may help to understand the degradation
mechanisms occurring in DSCs. However, there is a limitation to this
technique with regards to the application in DSCs that too intense beams of
laser with longer exposure time may destroy the DSC components, in
particular the dye. Another important issue is that the very high intensity of
the laser beam focused on a small area on PE may corrupt the data by
temporarily or permanently changing the dye structure. In this work, the
aim was to avoid any damage to the cell components without compromising
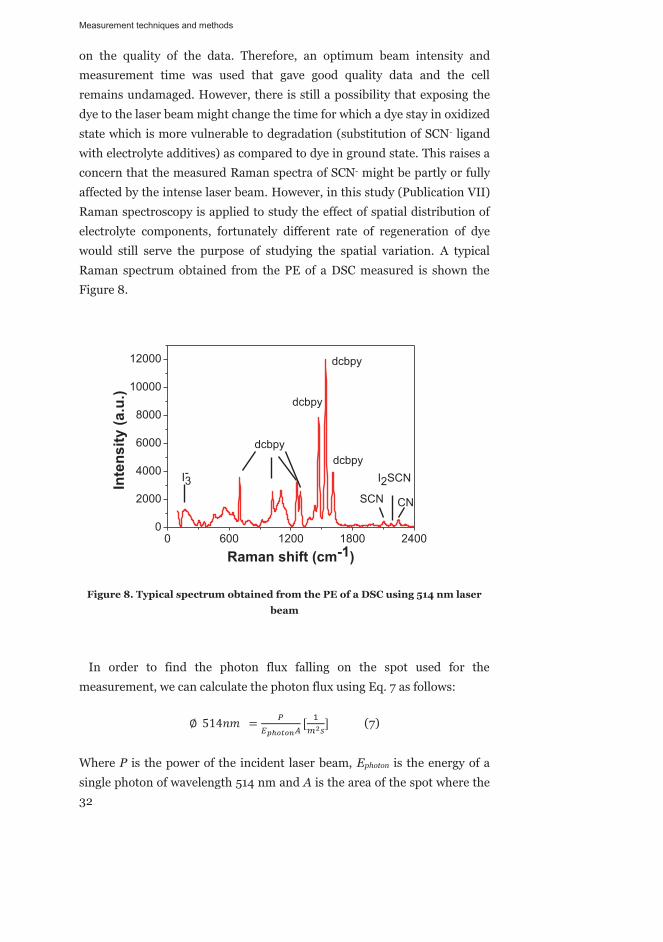
Measurement techniques and methods
32
on the quality of the data. Therefore, an optimum beam intensity and
measurement time was used that gave good quality data and the cell
remains undamaged. However, there is still a possibility that exposing the
dye to the laser beam might change the time for which a dye stay in oxidized
state which is more vulnerable to degradation (substitution of SCN- ligand
with electrolyte additives) as compared to dye in ground state. This raises a
concern that the measured Raman spectra of SCN- might be partly or fully
affected by the intense laser beam. However, in this study (Publication VII)
Raman spectroscopy is applied to study the effect of spatial distribution of
electrolyte components, fortunately different rate of regeneration of dye
would still serve the purpose of studying the spatial variation. A typical
Raman spectrum obtained from the PE of a DSC measured is shown the
Figure 8.
0 600 1200 1800 24000
2000
4000
6000
8000
10000
12000 dcbpy
dcbpy
dcbpy
Inte
nsity
(a.u
.)
Raman shift (cm-1)
I-3
dcbpy
CN
I2SCN
SCN
Figure 8. Typical spectrum obtained from the PE of a DSC using 514 nm laser
beam
In order to find the photon flux falling on the spot used for the
measurement, we can calculate the photon flux using Eq. 7 as follows:
(7)
Where P is the power of the incident laser beam, Ephoton is the energy of a
single photon of wavelength 514 nm and A is the area of the spot where the

Measurement techniques and methods
33
laser beam was focused on the sample. The energy of a single photon can be
calculated using Eq. 8.
(8)
The short circuit current density generated by the laser beam is given by
Eq. 9.
(9)
Where qe is the elementary charge and ηIPCE is the quantum efficiency of
DSC at 514 nm wavelength (here approximately 55%). The ratio of the short
circuit current density generated by the laser beam to the one generated
under 1 Sun light intensity gives the light intensity of the laser beam used in
the measurement in terms of unit Sun. The laser beam intensity used in this
work is calculated to be approximately 4 Sun.
3.4. Segmented cell method
The understanding of the degradation mechanisms is vital to improve the
overall stability of the cells. In this regard a method called ‘segmented cell
method’ is useful as it may be used to isolate or separate different kind
degradation processes. A segmented cell consists of two or more segments
electrically isolated from each other. In a segmented cell two or more cells
share the same electrolyte. The idea is that any degradation in one segment
related to the electrolyte may be seen in other cells as shown in Publication
I and elsewhere in the literature [40]. The segmented cell method can also
be used to investigate variation in performance due to spatial distribution of
electrolyte as in Publication VII. A schematic of the different possible
configurations that may be applied in a segmented cell is shown in Figure 9.
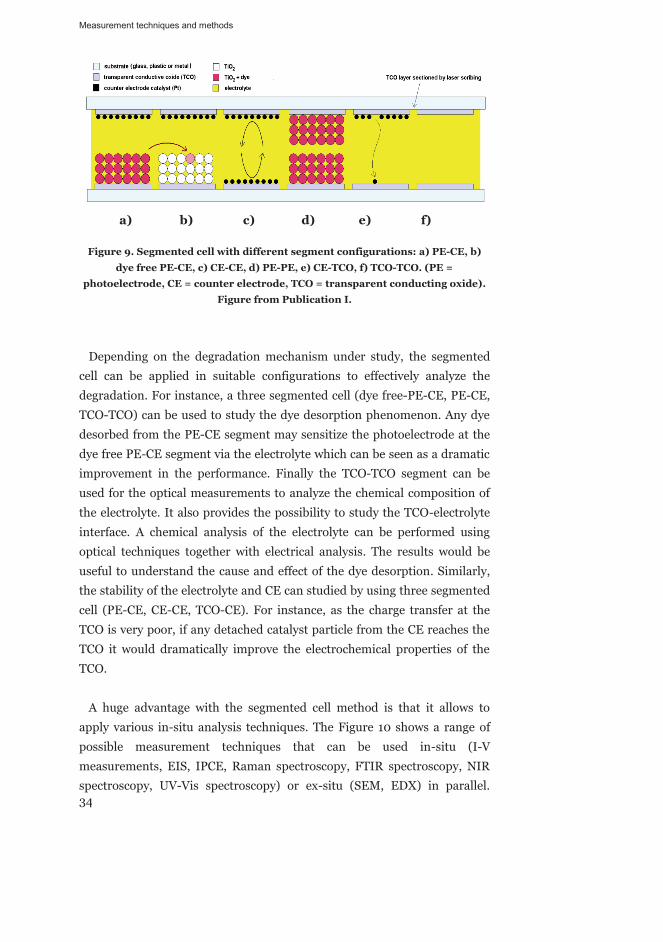
Measurement techniques and methods
34
a) b) c) d) e) f)
Figure 9. Segmented cell with different segment configurations: a) PE-CE, b)
dye free PE-CE, c) CE-CE, d) PE-PE, e) CE-TCO, f) TCO-TCO. (PE =
photoelectrode, CE = counter electrode, TCO = transparent conducting oxide).
Figure from Publication I.
Depending on the degradation mechanism under study, the segmented
cell can be applied in suitable configurations to effectively analyze the
degradation. For instance, a three segmented cell (dye free-PE-CE, PE-CE,
TCO-TCO) can be used to study the dye desorption phenomenon. Any dye
desorbed from the PE-CE segment may sensitize the photoelectrode at the
dye free PE-CE segment via the electrolyte which can be seen as a dramatic
improvement in the performance. Finally the TCO-TCO segment can be
used for the optical measurements to analyze the chemical composition of
the electrolyte. It also provides the possibility to study the TCO-electrolyte
interface. A chemical analysis of the electrolyte can be performed using
optical techniques together with electrical analysis. The results would be
useful to understand the cause and effect of the dye desorption. Similarly,
the stability of the electrolyte and CE can studied by using three segmented
cell (PE-CE, CE-CE, TCO-CE). For instance, as the charge transfer at the
TCO is very poor, if any detached catalyst particle from the CE reaches the
TCO it would dramatically improve the electrochemical properties of the
TCO.
A huge advantage with the segmented cell method is that it allows to
apply various in-situ analysis techniques. The Figure 10 shows a range of
possible measurement techniques that can be used in-situ (I-V
measurements, EIS, IPCE, Raman spectroscopy, FTIR spectroscopy, NIR
spectroscopy, UV-Vis spectroscopy) or ex-situ (SEM, EDX) in parallel.
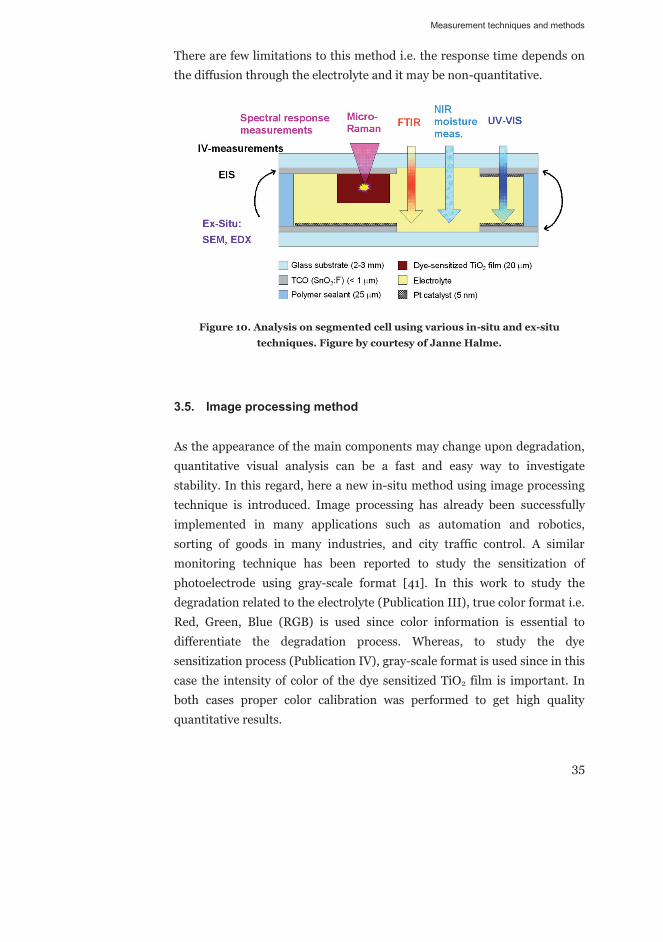
Measurement techniques and methods
35
There are few limitations to this method i.e. the response time depends on
the diffusion through the electrolyte and it may be non-quantitative.
Figure 10. Analysis on segmented cell using various in-situ and ex-situ
techniques. Figure by courtesy of Janne Halme.
3.5. Image processing method
As the appearance of the main components may change upon degradation,
quantitative visual analysis can be a fast and easy way to investigate
stability. In this regard, here a new in-situ method using image processing
technique is introduced. Image processing has already been successfully
implemented in many applications such as automation and robotics,
sorting of goods in many industries, and city traffic control. A similar
monitoring technique has been reported to study the sensitization of
photoelectrode using gray-scale format [41]. In this work to study the
degradation related to the electrolyte (Publication III), true color format i.e.
Red, Green, Blue (RGB) is used since color information is essential to
differentiate the degradation process. Whereas, to study the dye
sensitization process (Publication IV), gray-scale format is used since in this
case the intensity of color of the dye sensitized TiO2 film is important. In
both cases proper color calibration was performed to get high quality
quantitative results.

Measurement techniques and methods
36
3.5.1. Measurement setup and procedure
The measurement setup used in the image processing method consists of a
color sensitive camera, a set of LEDs mounted on a movable tray and a
platform on which cells can be placed with white background as shown in
the Figure 11. The camera (Olympus E-620) selected for this system
features an image resolution of 12.3 Megapixels and a high speed live MOS
sensor of size 17.3 mm (Horizontal) x 13.0 mm (Vertical). The setup is
isolated from the external light by covering it from all sides with a black out
canvas. The cells are mounted on a portable platform with the help of the
current collectors which makes it possible to measure them electrically as
well. In order to take photographs from the same distance and position with
respect to the samples, the portable platform is placed to a fixed position
under the movable tray. The movable tray can be then moved so that it is
possible to take photographs of all the cells from the top separately. This
way the lighting conditions and position of the camera with respect to each
cell remain the same allowing the comparison of the photographs possible
with least noise. The photographs are taken in RAW format, which is also
referred as digital negative, to extract maximum information from the
images.
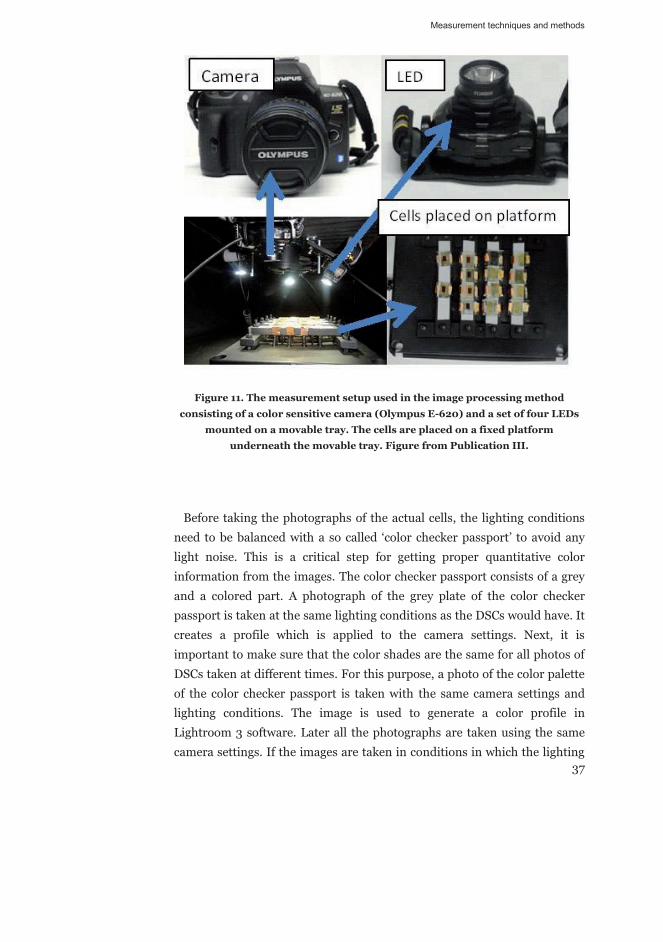
Measurement techniques and methods
37
Figure 11. The measurement setup used in the image processing method
consisting of a color sensitive camera (Olympus E-620) and a set of four LEDs
mounted on a movable tray. The cells are placed on a fixed platform
underneath the movable tray. Figure from Publication III.
Before taking the photographs of the actual cells, the lighting conditions
need to be balanced with a so called ‘color checker passport’ to avoid any
light noise. This is a critical step for getting proper quantitative color
information from the images. The color checker passport consists of a grey
and a colored part. A photograph of the grey plate of the color checker
passport is taken at the same lighting conditions as the DSCs would have. It
creates a profile which is applied to the camera settings. Next, it is
important to make sure that the color shades are the same for all photos of
DSCs taken at different times. For this purpose, a photo of the color palette
of the color checker passport is taken with the same camera settings and
lighting conditions. The image is used to generate a color profile in
Lightroom 3 software. Later all the photographs are taken using the same
camera settings. If the images are taken in conditions in which the lighting

Measurement techniques and methods
38
cannot be easily controlled such as outdoors, every image should have its
own color calibration. This could be done by doing separate white balancing
using the grey part of the color checker passport before each photograph
and placing the color part of the checker passport next to the studied cell for
each image. In such case it is important to make sure that the lighting is
homogenous across the cell and the color checker. For this reason for
instance the use of flash is not advisable in particular in close up images as
it tends to result in very uneven illumination across the image.
3.5.2. Analysis
In the analysis, the first step is to generate a color profile that takes into
account of any variation of the back ground lighting conditions and to make
the comparison of the color possible. For this purpose, the photograph of
the color checker passport in RAW format is used. The Lightroom 3
software reads the RAW format photograph of the color checker passport
and generates a color profile which is then applied on all the photographs of
DSCs in RAW format. After the application of the generated color profile,
the modified photographs in RAW format are converted to JPEG format
using the same Lightroom 3 software. Once the conversion to JPEG format
is done, the images are ready for further processing. Finally, Matlab
software is used to import and process the JPEG images to evaluate the
RGB (red, green, blue) values for each of the image. In a 24-bit data format
of the JPEG image, the data is presented in the form of RGB (red, green and
blue) model which is also known as a true color model. In this model, each
pixel in the image is composed of three separate 8-bit values corresponding
to red, green and blue (RGB) component respectively. In an 8-bit format,
each red, green and blue values span from 0 (binary 00000000) to 255
(binary 11111111). Typical RGB values of different colors in 8-bit data format
are given in the Table 1.

Measurement techniques and methods
39
Table 1. RGB values for 8-bit data format (0 and 255 corresponds to binary
00000000 and 11111111 respectively). Table from Publication III.
Color Red Green Blue
Red 255 0 0
Green 0 255 0
Blue 0 0 255
Yellow 255 255 0
White 255 255 255
Black 0 0 0
3.5.3. Correlation between electrolyte concentration and color
In order to study the degradation of electrolyte which is often due to
decrease in the tri-iodide concentration in electrolyte (i.e. bleaching of the
electrolyte), a relationship between the tri-iodide concentration in the
electrolyte and the corresponding RGB pixel values obtained from their
appearance needs to be established. For this purpose, DSCs prepared from
a series of electrolytes with different concentrations of iodine were
processed using image process method as explained in Sections 3.5.1 and
3.5.2. Iodine is the main source of tri-iodide in the electrolyte. The RGB
data of cells with varying concentration of iodine are shown in Figure 12. It
shows that with increasing the concentration of iodine, which is the source
of tri-iodide in the electrolyte, the blue pixel values are decreasing while the
red and green pixel values stay practically constant. Within the range from
0.025 to 0.1 mol/dm3 of iodine in the electrolyte, the resolution of image
processing method is calculated to be 7.35×10⁻⁴ mol/dm3 per one blue pixel
value. This means that one unit change in blue pixel value corresponds to

Measurement techniques and methods
40
1.47% changes in the tri-iodide concentration of a standard electrolyte
(0.05M I2) for DSC.
0.025 0.050 0.075 0.100 0.125 0.1500
50
100
150
200
250R
GB
pix
el v
alue
s
Iodine Concentration (mol/dm3)
Figure 12. Image processing in terms of RGB pixel values for a series of
electrolyte containing varying concentration of iodine. (Red = R, Green = G,
Blue = B). Figure from Publication III.

41
4. Results and Discussion
This chapter is divided into four sections. The first section presents the
state of the art of the DSC’s stability and covers the general degradation
mechanisms in the DSCs. In the second section, a new method based on
image processing is demonstrated to study the performance and stability of
the DSCs. In third section, stability of the flexible metal substrates is
discussed. Finally in the fourth section, segmented cell method is used to
study the performance degradation in the DSCs due to spatial distribution
of electrolyte components.
4.1. Degradation mechanisms in the DSCs (Publication I & II)
This research work was started with a literature review (Publication I) to
find out the current knowledge regarding the stability of DSCs. The idea
was to critically investigate the literature to find out the key issues affecting
the lifetime of a DSC.
As a DSC consists of several different materials, their internal chemistry
and their interaction with other materials play a key role in the stability of
the DSC. In addition, the stress factors such as temperature, light and
humidity can affect the stability of the DSC by accelerating the existing
degradation mechanisms or by generating new degradation processes. For
many of these mechanisms various explanations have been presented.
It was found that although there were several studies done on the stability
of the DSC, there was a lack of systematic studies which separates the
hypothesis and mere speculations from solid experimental evidence
regarding the cause and the mechanisms of degradation. With this
motivation, in Publication I several hypotheses were studied critically
covering the degradation processes at the photoelectrode, at the counter

Results and Discussion
42
electrode and in the electrolyte under different conditions (temperature,
light intensity and moisture).
4.1.1. Stability tests for DSCs
The basic aim of an accelerated ageing test is to estimate the lifetime of a
solar cell in a relatively short period of time. The solar cells are stressed
under certain conditions where the degradation mechanisms get
accelerated. A thorough experimental data makes it possible to establish a
standard test for a specific solar cell type. So far no standards have been
established for the stability testing of DSCs. Accelerated ageing tests that
are used for thin films defined in standards referred as ASTM E, IEC 61646,
IEC 61215 and JIS C-8938 are currently being used for DSC. However, it is
important to note that the degradation mechanisms in DSC are different
from thin film solar cells and thus these tests may not be fully applicable.
Therefore, it is important to establish standard tests for DSCs to estimate
their lifetime. It is also important to keep the final application in mind
while defining the standard tests. For instance, indoor applications such as
toys are usually exposed to only mild and quite constant temperatures while
solar panels placed outdoors are subject to weathering.
It is also important to define how much decrease or increase in
performance of a DSC can be considered stable for certain duration of time.
In DSC literature, generally when the variation in performance is within
10% [21,22,23], the DSC is considered to be stable. However, in standards
for thin films solar cells, only 2% change in performance is allowed to be
declared stable. At the same time, it is important to set the criteria to
evaluate the performance of a DSC i.e. whether η alone should be
monitored or all performance parameters including iSC, VOC and FF should
be examined. As discussed in the Publication I, at the moment, light
soaking test at room temperature (RT), 60°C and 80°C, and thermal test at
RT, 60°C and 80°C are the most commonly used tests to investigate the
stability of a DSC [21-23].

Results and Discussion
43
4.1.2. Degradation at the photoelectrode
The instability of the photoelectrode can be regarded as a major reason for
the instability of a DSC. Any degradation in the photoelectrode can greatly
affect the performance of a DSC specially the iSC. Generally, the degradation
at the photoelectrode can be categorized into dye desorption, dye
degradation and degradation in the electron collection.
The dye desorption has been presented in several articles as a reason for
the degradation in iSC of a DSC when stressed at 85°C in dark conditions
[42,43]. It has also been regarded as the main reason for the failure to pass
80°C thermal test. There are several speculations given in the literature to
explain the degradation due to dye desorption. One speculation explained
the dye desorption as a reason of shift in the equilibrium between the dye
desorped onto the TiO2 and the dye dissolved in the electrolyte due to
change in temperature [43]. At high temperature i.e. 80°C, the equilibrium
shifts in the favor of dye desorption into the electrolyte resulting in a lower
performance of the DSC. On the other hand, at lower temperature i.e. 45°C
under illumination the equilibrium shifts in the favor of dye re-adsorption
onto the TiO2 film leading to the recovery of the DSC performance.
However, this hypothesis is lacking direct solid evidence other than that
deducted from the changes in the photovoltaic parameters. Another
speculation about dye desorption states that the decomposition products in
the electrolyte co-adsorb onto the TiO2 surface favoring desorption of dye at
high temperature [44]. It has also been suggested that as TiO2 is
hydrophilic in nature and even a small quantity of water in the DSC may
lead to desorption of dye [45]. This speculation is supported by the fact that
only hydrophobic dyes such as Z907, K77 and K19 have been reported to
pass 80°C thermal test for 1000 hours [22,46,47,48].
Both N719 and Z907 dyes have been suggested to get degraded at elevated
temperatures i.e. higher than 80°C as a result of thiocyanate ligand (SCN)
exchange with the electrolyte solvent MPN or the additives in the electrolyte
such as 4-tert butyl pyridine (TBP) [49,50]. The SCN ligand substitution
reaction with TBP is shown in the Figure 13. The worst case scenario would
be that in all the dye molecules one of the SCN ligands gets exchanged with
TBP in the electrolyte (i.e. 100% degraded dye). In order to examine this, in
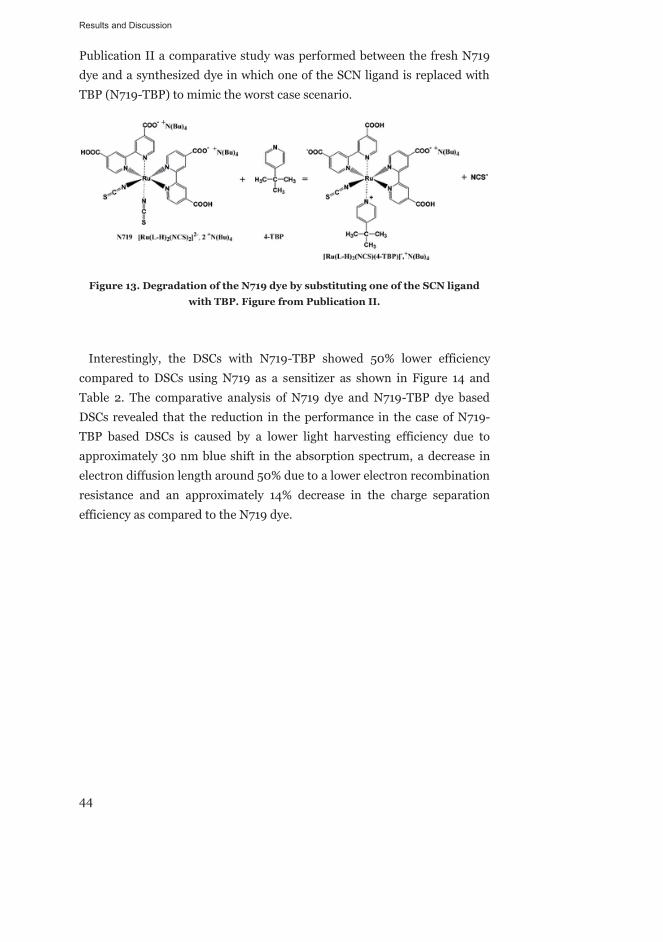
Results and Discussion
44
Publication II a comparative study was performed between the fresh N719
dye and a synthesized dye in which one of the SCN ligand is replaced with
TBP (N719-TBP) to mimic the worst case scenario.
Figure 13. Degradation of the N719 dye by substituting one of the SCN ligand
with TBP. Figure from Publication II.
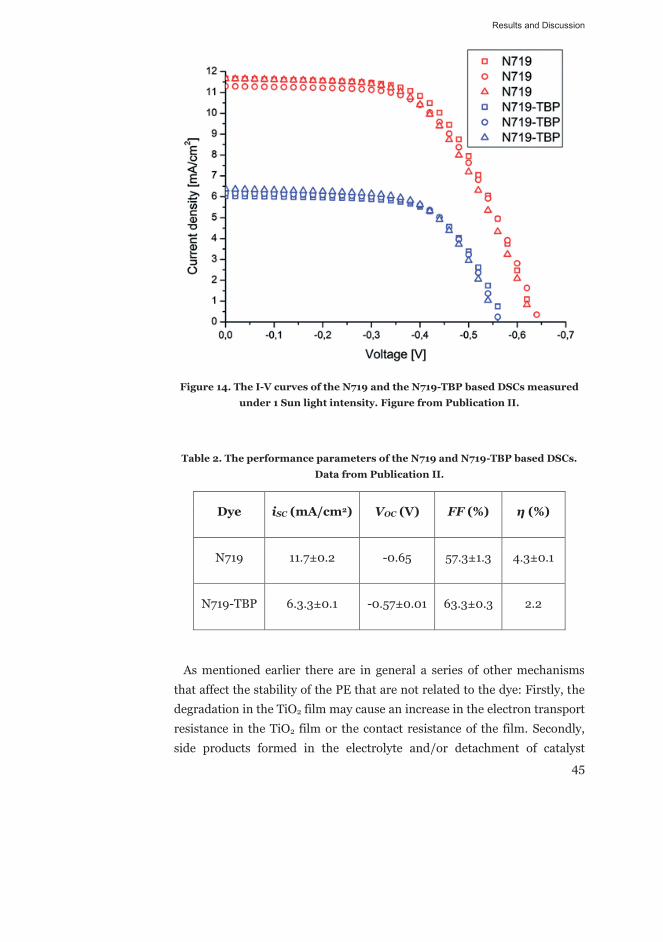
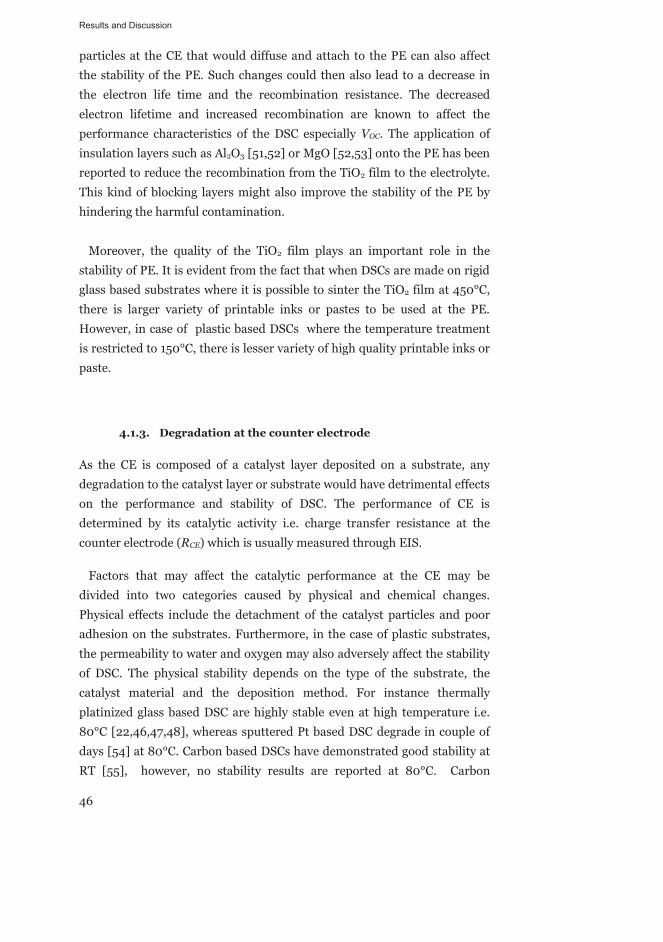
Interestingly, the DSCs with N719-TBP showed 50% lower efficiency
compared to DSCs using N719 as a sensitizer as shown in Figure 14 and
Table 2. The comparative analysis of N719 dye and N719-TBP dye based
DSCs revealed that the reduction in the performance in the case of N719-
TBP based DSCs is caused by a lower light harvesting efficiency due to
approximately 30 nm blue shift in the absorption spectrum, a decrease in
electron diffusion length around 50% due to a lower electron recombination
resistance and an approximately 14% decrease in the charge separation
efficiency as compared to the N719 dye.
Results and Discussion
45
Figure 14. The I-V curves of the N719 and the N719-TBP based DSCs measured
under 1 Sun light intensity. Figure from Publication II.
Table 2. The performance parameters of the N719 and N719-TBP based DSCs.
Data from Publication II.
Dye iSC (mA/cm2) VOC (V) FF (%) η (%)
N719 11.7±0.2 -0.65 57.3±1.3 4.3±0.1
N719-TBP 6.3.3±0.1 -0.57±0.01 63.3±0.3 2.2
As mentioned earlier there are in general a series of other mechanisms
that affect the stability of the PE that are not related to the dye: Firstly, the
degradation in the TiO2 film may cause an increase in the electron transport
resistance in the TiO2 film or the contact resistance of the film. Secondly,
side products formed in the electrolyte and/or detachment of catalyst
Results and Discussion
46
particles at the CE that would diffuse and attach to the PE can also affect
the stability of the PE. Such changes could then also lead to a decrease in
the electron life time and the recombination resistance. The decreased
electron lifetime and increased recombination are known to affect the
performance characteristics of the DSC especially VOC. The application of
insulation layers such as Al2O3 [51,52] or MgO [52,53] onto the PE has been
reported to reduce the recombination from the TiO2 film to the electrolyte.
This kind of blocking layers might also improve the stability of the PE by
hindering the harmful contamination.
Moreover, the quality of the TiO2 film plays an important role in the
stability of PE. It is evident from the fact that when DSCs are made on rigid
glass based substrates where it is possible to sinter the TiO2 film at 450°C,
there is larger variety of printable inks or pastes to be used at the PE.
However, in case of plastic based DSCs where the temperature treatment
is restricted to 150°C, there is lesser variety of high quality printable inks or
paste.
4.1.3. Degradation at the counter electrode
As the CE is composed of a catalyst layer deposited on a substrate, any
degradation to the catalyst layer or substrate would have detrimental effects
on the performance and stability of DSC. The performance of CE is
determined by its catalytic activity i.e. charge transfer resistance at the
counter electrode (RCE) which is usually measured through EIS.
Factors that may affect the catalytic performance at the CE may be
divided into two categories caused by physical and chemical changes.
Physical effects include the detachment of the catalyst particles and poor
adhesion on the substrates. Furthermore, in the case of plastic substrates,
the permeability to water and oxygen may also adversely affect the stability
of DSC. The physical stability depends on the type of the substrate, the
catalyst material and the deposition method. For instance thermally
platinized glass based DSC are highly stable even at high temperature i.e.
80°C [22,46,47,48], whereas sputtered Pt based DSC degrade in couple of
days [54] at 80°C. Carbon based DSCs have demonstrated good stability at
RT [55], however, no stability results are reported at 80°C. Carbon

Results and Discussion
47
nanotubes (CNT) films deposited on ITO-PET showed lower stability even
at RT [56,57]. In addition, deposition of by-products in the electrolyte onto
the CE may also affect the catalytic performance of the CE. Conventional
tape tests such as ASTM 3359 and bending tests have been used to test the
adherence of the catalyst particle film on the substrate [58].
Chemical effects include detrimental chemical reactions between the
catalyst particles or substrate with the electrolyte. The chemical stability
depends also on the type of the substrate, catalyst material, the deposition
method as well as the corrosiveness of the electrolyte. Techniques giving
chemical information such as optical infrared spectroscopy may be useful to
examine the by-products in the case of any degradation at the counter
electrode. Any decrease in the catalytic activity can be studied using EIS.
Furthermore, in the case of corrosion to the substrate or catalyst film, SEM
together with EDS or EELS give information about the degrading chemical
reaction as shown in Publication V.
4.1.4. Degradation of the electrolyte
Most of the electrolytes for DSCs are based on iodide/tri-iodide redox
couple. These kinds of electrolytes have a yellow color due to the presence
of tri-iodide. The tri-iodide plays a critical role in the cell by transferring the
charge from the PE to the CE by means of diffusion. Any degradation to the
electrolyte causing decrease in the tri-iodide concentration might thus lead
to the degradation of the DSC. The stability of electrolyte in a DSC depends
on several factors such as the type of the CE, the coverage of the dye onto
the TiO2 and the influence of external factors such as humidity, UV and
visible light, and temperature.
The electrolyte in the DSC was shown to be very stable at light soaking at
RT when using thermally platinized or sputtered FTO glass as CE in
Publication V. It shows that light soaking alone is not harmful for the
electrolyte. In another study no bleaching of electrolyte was observed at
85°C when using thermally platinized CE. The same study revealed that
bleaching of the electrolyte occurred when DSCs were exposed to light
soaking at 85°C. Interestingly, the degraded DSCs at 85°C recovered their

Results and Discussion
48
performance when brought to RT [59]. It seems that some reversible
reactions occur under that conditions and as the temperature went down,
the equilibrium was shifted to the other side. It shows that light soaking at
high temperatures is very challenging for the stability of the DSC.
The degradation in the concentration of tri-iodide can be easily studied by
measuring changes in the limiting current density (ilim) as done in
Publication III. In the extreme case, loss of triiodide can even limit the iSC
by the decrease in the limiting current density. The changes in the triiodide
concentration can alternatively be studied with EIS as an increase in the
Nernst diffusion impedance of tri-iodide. Indeed, the degradation in the
electrolyte which causes increase in the diffusion impedance results also in
decreasing the FF. The chemical analysis of electrolyte using optical
(Publication VII) and spectroscopic techniques such as Raman
spectroscopy and IR spectroscopy may be very useful to find the cause of
the degradation and the by-products formed. As the degradation involves
the change in the color of the electrolyte, image processing method can be
utilized to study the bleaching of the electrolyte as in Publication III.
4.1.5. Sealing issues
One of the most challenging factors that can affect the stability of a DSC is
the sealing of the device. The failure of the sealing may result in either a
gradual loss in the performance or sudden death of the cell. Firstly, the
liquid electrolyte can leak out of the cell. Secondly, a poor sealing may not
withstand the high vapor pressure of the solvent and other additives at high
temperature i.e. 80°C and result in a failure. Thirdly, impurities such as
oxygen and water may also penetrate into the DSC and harm the device.
Especially in the case of the plastic substrates, which are permeable to
oxygen and water, sealing becomes an even more challenging issue. In
addition, the sealing should also protect the current collectors from the
corrosive electrolyte.
The sealing should be mechanically, chemically and thermally stable for
the working conditions to which the DSC is expected to be exposed. From a
mechanical point of view, it should withstand external factors such as rain
and even hail storms and internal factors such as gas bubbles and high

Results and Discussion
49
vapor pressure of the solvent inside the DSC. From a chemical point of
view, it should be stable with electrolyte and with the other components of
the DSC. From a thermal point of view, it should be flexible enough to
withstand any thermal expansion of the electrolyte but it should also
remain stable as sealant.
A polymer based hot melt foil Surlyn 1702 is the most common sealant
used in DSCs and also chemically stable with electrolyte. However, this
sealant has low softening temperature i.e. below 80°C which results in poor
stability at high temperatures i.e. 80°C. Another polymer based hot melt
foil Bynel has been shown to be an excellent sealant for DSCs which work
properly even at high temperature as the softening temperature is above
80°C [48]. Another sealing method based on glass frit which is commonly
used in plasma display panel has also been applied to DSC. It also shows
excellent stability at high temperatures e.g. 80°C [60]. However, there are a
few limitations due to the fact that glass frit sealing requires a high
processing temperature i.e. around 600°C [42,60,61] in particular the
electrolyte and the dye need to be introduced in the cell after the high
temperature sealing step.
4.1.6. Cross-line between performance and stability limiting
factors
The performance parameters, i.e. iSC, VOC and FF, are limited and affected
by different processes in the DSCs. For instance iSC is usually limited by the
absorption and injection by the dye. That is why any decrease in iSC is
usually ascribed to the degradation of the dye. However, it is not always
true as mentioned earlier for instance decrease in the iodine concentration
might limit iSC.
There are often several degradation mechanisms occurring in the DSC
simultaneously. It may happen that a particular degradation becomes
dominant and limit the performance parameters of the cell. For instance,
under severe conditions when the iSC is limited by the ilim instead of the dye
due to the decrease in the tri-iodide concentration in the electrolyte, iSC is
no more sensitive to the degradation of the dye. Therefore, before making
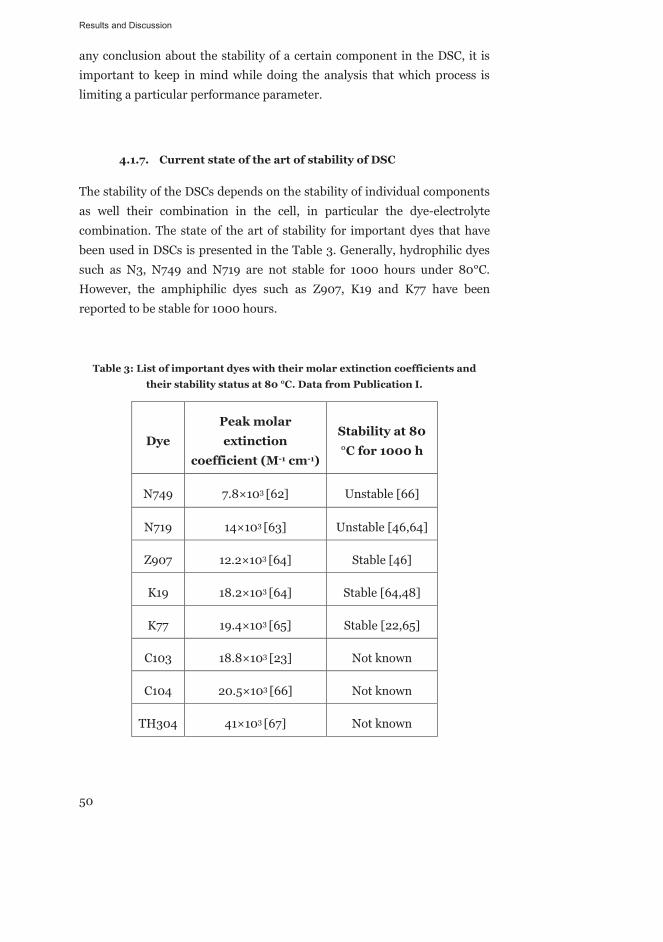
Results and Discussion
50
any conclusion about the stability of a certain component in the DSC, it is
important to keep in mind while doing the analysis that which process is
limiting a particular performance parameter.
4.1.7. Current state of the art of stability of DSC
The stability of the DSCs depends on the stability of individual components
as well their combination in the cell, in particular the dye-electrolyte
combination. The state of the art of stability for important dyes that have
been used in DSCs is presented in the Table 3. Generally, hydrophilic dyes
such as N3, N749 and N719 are not stable for 1000 hours under 80°C.
However, the amphiphilic dyes such as Z907, K19 and K77 have been
reported to be stable for 1000 hours.
Table 3: List of important dyes with their molar extinction coefficients and
their stability status at 80 °C. Data from Publication I.
Dye
Peak molar
extinction
coefficient (M-1 cm-1)
Stability at 80
°C for 1000 h
N749 7.8×10³ [62] Unstable [66]
N719 14×103 [63] Unstable [46,64]
Z907 12.2×10³ [64] Stable [46]
K19 18.2×10³ [64] Stable [64,48]
K77 19.4×10³ [65] Stable [22,65]
C103 18.8×10³ [23] Not known
C104 20.5×10³ [66] Not known
TH304 41×103 [67] Not known
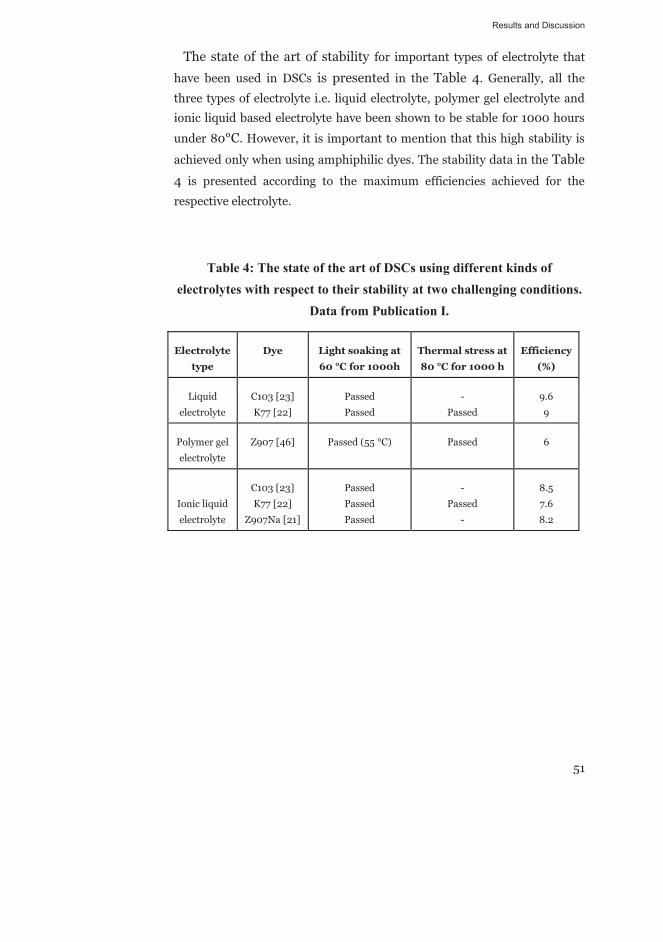
Results and Discussion
51
The state of the art of stability for important types of electrolyte that
have been used in DSCs is presented in the Table 4. Generally, all the
three types of electrolyte i.e. liquid electrolyte, polymer gel electrolyte and
ionic liquid based electrolyte have been shown to be stable for 1000 hours
under 80°C. However, it is important to mention that this high stability is
achieved only when using amphiphilic dyes. The stability data in the Table
4 is presented according to the maximum efficiencies achieved for the
respective electrolyte.
Table 4: The state of the art of DSCs using different kinds of electrolytes with respect to their stability at two challenging conditions.
Data from Publication I.
Electrolyte
type
Dye Light soaking at
60 °C for 1000h
Thermal stress at
80 °C for 1000 h
Efficiency
(%)
Liquid
electrolyte
C103 [23]
K77 [22]
Passed
Passed
-
Passed
9.6
9
Polymer gel
electrolyte
Z907 [46] Passed (55 °C) Passed 6
Ionic liquid
electrolyte
C103 [23]
K77 [22]
Z907Na [21]
Passed
Passed
Passed
-
Passed
-
8.5
7.6
8.2

Results and Discussion
52
4.2. Visual analysis of DSC (Publication III & IV)
The most important components of a DSC i.e. dye, electrolyte and catalyst
material have specific colors. For instance, the N719 dye which is the most
commonly used dye in DSC has a red color, the electrolyte has usually a
yellowish color due to the presence of tri-iodide in the electrolyte whereas
Pt catalyst particles have a grayish color. The degradation of these
components may cause visual change in the appearance of the cell. For
instance, the desorption of the dye into the electrolyte that has been
proposed to occur in literature [42,43] at elevated temperature i.e. 80°C
would change the color of the electrolyte towards reddish color. Similarly, a
decrease in the tri-iodide concentration in the electrolyte could cause a
bleaching of the electrolyte [68,69]. Any degradation reaction involving the
tri-iodide and the catalyst material would lead to the bleaching of the
electrolyte and consumption of the catalyst particles [70,71]. In the case of a
leakage of the electrolyte through the sealant, the marks of the leaked
electrolyte can be seen visually. In the worst case, the leaked electrolyte may
corrode the silver grids which can also be seen visually [72]. It shows that
there is some relationship between the performance of DSC and its
appearance. In this work, visual analysis is done using image processing
method described in section 3.5 to demonstrate the applicability of the
method to study the bleaching of electrolyte and the effect of sensitization
time on DSC performance.
4.2.1. Bleaching of electrolyte
The bleaching of the electrolyte has been reported in the literature and it has been to some extent been already covered in Section 4.1.4. In Publication III, three different configurations of cells were made i.e. PE-CE, CE-CE and TiO2-CE as shown in the Figure 15 to isolate the degradation processes. As the purpose of this work is to demonstrate the image processing method to investigate the stability and performance of a DSC, all the cells were exposed to extreme conditions i.e. UV+Vis illumination at 85°C to accelerate the bleaching process. In addition to the image processing method, I-V measurements in dark and under 1 Sun at room temperature were also performed on day 0, 1, 5 and 10 respectively. The purpose was to correlate the visual changes with the changes in the electrical performance. After the ageing period of 10 days, the cells were exposed to multiple cyclic

Results and Discussion
53
voltammetry scans between -1.5V to 1.5V in order to see whether the bleached electrolyte recovers its color as observed by Hauch et al. [26] or not.
Figure 15. Three different cell configurations (a) PE-CE, (b) CE-CE, and (c)
TiO2-CE employed to isolate the degradation mechanisms (PE =
photoelectrode, CE = counterelectrode, TCO = transparent conducting oxide).
Figure from Publication III.
As discussed in Section 3.5, the bleaching of the electrolyte would result in
increasing blue pixel value. Interestingly, the bleaching trend was different
in different configurations as shown in the
Figure 16. The normal DSC, referred here as a PE-CE cell, showed a
gradual increase in the blue pixel value representing a gradual loss of yellow
color of the electrolyte. The CE-CE cell did not show much change in the
blue pixel value representing no change in the electrolyte color. Hence, it
can be concluded that the CE (thermally platinized on FTO glass) and
electrolyte themselves are very stable under the ageing conditions and
bleaching involves the PE. The TiO2-CE cell showed sharper rise in the blue
pixel value as compared to the PE-CE cell indicating a more rapid bleaching
in the case of the TiO2–CE cell. As the PE is comprised of TiO2 porous film
sensitized with photosensitive dye, the different bleaching rate of the PE-CE
cells and the TiO2-CE cells shows that in fact the TiO2 film is responsible for
the bleaching of the electrolyte. Moreover, it can be deducted that the dye
on the TiO2 film is actually protecting against the bleaching reaction.
Interestingly, in all the three cases electrolyte recovered its color to some
extent as shown by the decrease in the blue pixel value when the cells were

Results and Discussion
54
exposed to multiple cyclic voltammetry scans between 1.5V and 1.5V after
the ageing period.
Figure 16. The RGB pixel values of images in 8-bit format as a function of time
for different cell configurations: a) PE-CE, b) CE-CE, c) TiO2-CE aged under
UV+Visible light at 85°C for 10 days followed by cyclic I-V measurements to
recover the electrolyte color after 10 days . (Binary 00000000 and 11111111
corresponds to decimal 0 and 255 respectively). Figure from Publication III.
0 1 5 10 After recovery0
50
100
150
200
250
RG
B p
ixel
val
ues
Days
CE-CEb)
0 1 5 10 After recovery0
50
100
150
200
250
RG
B p
ixel
val
ues
Days
PE-CEa)
0 1 5 10 After recovery0
50
100
150
200
250
RG
B p
ixel
val
ues
Days
TiO2-CEc)

Results and Discussion
55
I-V measurements were performed in dark to see the effect of decreased
tri-iodide concentration on ilim. ilim is directly proportional to the
equilibrium concentration of tri-iodide in the case where tri-iodide is
the only current limiting ion [26]:
, (10)
where, F is the Faraday’s constant, is the diffusion coefficient of tri-
iodide, and d is the thickness of the electrolyte layer. ilim can be seen as the
saturation current density of a reverse biased cell.
-1.5 -1.0 -0.5 0.0 0.5 1.0 1.5
-50
-25
0
25
50
75(a) PE-CE
FORWARD BIAS
I (m
A/c
m2 )
V (V)
REVERSE BIAS
day 0 day 1 day 5 day 10
-1.5 -1.0 -0.5 0.0 0.5 1.0 1.5
-30
-20
-10
0
10
20
30
REVERSE BIAS
(b) CE-CE
V (V)
day 0 day 1 day 5 day 10
I (m
A/c
m2 )
FORWARD BIAS

Results and Discussion
56
-1.5 -1.0 -0.5 0.0 0.5 1.0 1.5
-60
-40
-20
0
20
40(c) TiO2-CE
V (V)
day 0 day 1 day 5 day 10
I (m
A/c
m2 )
FORWARD BIAS REVERSE BIAS
Figure 17. I-V curves of cells with different configurations in the dark: a) PE-CE,
b) CE-CE, c) TiO2-CE. Figure from Publication III.
Figure 17 shows I-V curves of the PE-CE, CE-CE and TiO2-CE cells over a
voltage range of -1.5V to 1.5V measured in dark. ilim of the PE-CE cells
decreased gradually as shown in Figure 17a as expected from the gradual
increase in the blue pixel value (representing gradual decrease in the tri-
iodide concentration leading to gradual bleaching of the electrolyte) shown
in
Figure 16a. ilim was indeed so low on day 10 that it was limiting the iSC.
However, prior to day 10 ilim was much higher (above 25 mA/cm2)
compared to iSC (max 11 mA/cm2) which means that iSC was not limited by
decreased ilim. In the TiO2-CE cell, the ilim decreased sharply from a value of
more than 29 mA/cm2 to 0.02 mA/cm2 during the ageing period in
accordance with the faster rate of increase in the blue pixel value shown in
Figure 16c. This represents a faster decrease in the tri-iodide
concentration in the TiO2-CE cell leading to the faster bleaching of the
electrolyte as compared to the PE-CE cell. Interestingly in the CE-CE cell
the ilim stayed roughly the same as expected based on the image processing
results shown in
Figure 16b where the blue pixel values remained practically constant. This
represents no significant change in the tri-iodide concentration leading to
no significant bleaching of the electrolyte. Hence, the results obtained using
I-V curves measured in dark are in agreement with results obtained using
image processing method.

Results and Discussion
57
4.2.2. Effect of dye sensitization time on performance
The sensitization of the dye on the TiO2 plays the most important role in the
operation of a DSC. The performance of a DSC is greatly affected by the dye
sensitization time. For instance, if the dye sensitization time is too short
than the amount of dye chemisorbed onto the TiO2 is too low. Similarly if
the sensitization time is too long then the dye starts getting physiosorbed
onto the monolayer of dye already absorbed on the TiO2 particles. In both
cases, the performance of the DSC is adversely affected. Hence, there is a
need to optimize the dye loading time and conditions i.e. optimum
temperature. In Publication IV image processing method was used to study
the effect of dye sensitization time onto the TiO2 film. The main aim of this
study is to demonstrate the applicability of image processing method to
monitor the dye loading process and its effect on the final DSC.
In this work, PEs were prepared for DSCs with varying dye loading time
i.e. 0, 10, 100 and 1000 minutes. It is commonly known that if the TiO2 film
is not fully dye loaded, the dye concentration is expected to be larger in the
outer surface of the TiO2 film than in the inner parts of the TiO2 film. When
analyzing the results, it is important to keep in mind this uneven
distribution of the dye. The electrical performance of the DSCs prepared
with PEs with varying dye loading time is shown in the Table 5. The results
show that the dye loading is improving the DSC performance till 1000
minutes (approximately 16 hours), however, from this data it is not possible
to determine the optimized dye loading time.

Results and Discussion
58
Table 5: Performance parameters of the DSCs having sensitization time of 0, 10,
100 and 1000 min respectively, obtained through current voltage curves
measured under 1 Sun. Table from Publication IV.
Time (min) iSC (mA/cm2) VOC (V) FF (%) η (%)
0 0.02 0.21 38.5 0.0
10 1.16 0.59 65.9 0.4
100 4.22 0.65 67.9 1.9
1000 10.14 0.72 70.3 5.2
0 10 100 10000
50
100
150
200
250
RG
B p
ixel
val
ue
Time (min)
Figure 18. RGB pixel values of the active area of DSCs having different dye
loading times. Figure from Publication IV.
For the visual analysis photographs of all the DSCs prepared with varying
loading times were taken after the cell assembly. With an increasing dye
loading time, the TiO2 film got darker and darker, and correspondingly the
photographs show that the RGB pixel values are also decreasing as shown
in the Figure 18. As simultaneous decrease in R, G and B values are
occurring; visual analysis can be performed in a better way by monitoring
the intensities of the dye color. Therefore, the image processing in gray
scale format is more convenient here. For this purpose, the RGB pixel
values are transformed to gray scale for all the images using the Eq. 11 [73]:

Results and Discussion
59
Gray = (0.299×R + 0.587×G + 0.114×B) (11)
The decreasing gray scale values as shown in Figure 19 and increasing
performance as shown in the Table 5 with increasing dye loading time is in
a relationship as expected. Therefore, image processing method can be used
to monitor the dye loading process as also done in previous studies [41].
More experiments and thorough calibration work is needed to estimate the
performance of the DSC using the color of the PE.
Figure 19. Gray scale value for the corresponding RGB values given in Figure 5
using Eq. 11. Figure from Publication IV.
0 10 100 10000
50
100
150
200
250
Gra
y sc
ale
valu
e
Time(min)
Gray scale valueGray = (0.299*R + 0.587*G + 0.114*B)

Results and Discussion
60
4.3. Stabilization of flexible metal based DSCs (Publication V & VI)
There is a significant interest for using metal substrates in DSCs due to the
feasibility for the roll-to-roll manufacturing. Usage of cheap flexible metal
substrate would significantly drop the cost of the DSC as majority of the
material cost is due to the TCO coated substrate [10]. One compromise is
that the cell is no more bifacial and light harvesting can be done only from
one transparent side of DSC. Additionally, attaining long term stability with
metal substrates in a DSC is required for their usage in this technology.
4.3.1. Stability of metal photoelectrodes
In order to be used at the PE of DSC, firstly flexible metals need to be
chemically stable against the corrosive electrolyte. Secondly, they must
withstand the high temperature i.e. approximately 500°C required for the
TiO2 film sintering. Many metals corrode in the iodine electrolyte [24,25].
Basically the lowest cost metal that remained stable after so called
electrolyte soaking test is stainless steel (StS) [24,25]. In an earlier study,
the stability of wide range of metal substrates as a DSC PE was investigated
[74]. In that work, metal substrates such as StS 314 and StS 321, acid proof
StS such as StS 316 and StS 316L, Inconel alloy 600 and Titanium foils (Ti)
were used as a substrate for PE. Commercially available high stability
electrolyte (HSE) by Dyesol and thermally platinized FTO glass as CE were
used. The DSCs prepared with above mentioned metals together with a
glass reference cell were exposed to light soaking test at 40˚C with a light
intensity of 1 Sun.
It was found that all the metal cells degraded completely in a couple of
days except the ones prepared with Inconel 600 and Ti. One of the
hypotheses was that the degradation was due to corrosion. However, the
SEM images did not reveal any corrosion marks [74]. There were also two
other hypothesis, increased current leakage and so-called iron
contamination, but those were not either supported by the tests. Further
research is needed to find out the degradation mechanism leading to this
quick failure. On the positive side Inconel 600 and Ti passed the light
soaking test and are thus suitable metal substrate materials for the PE of a
DSC. The stability results of that study are presented in the Table 6 for the
sake of comparison with the metal CE studies (Publication VI).
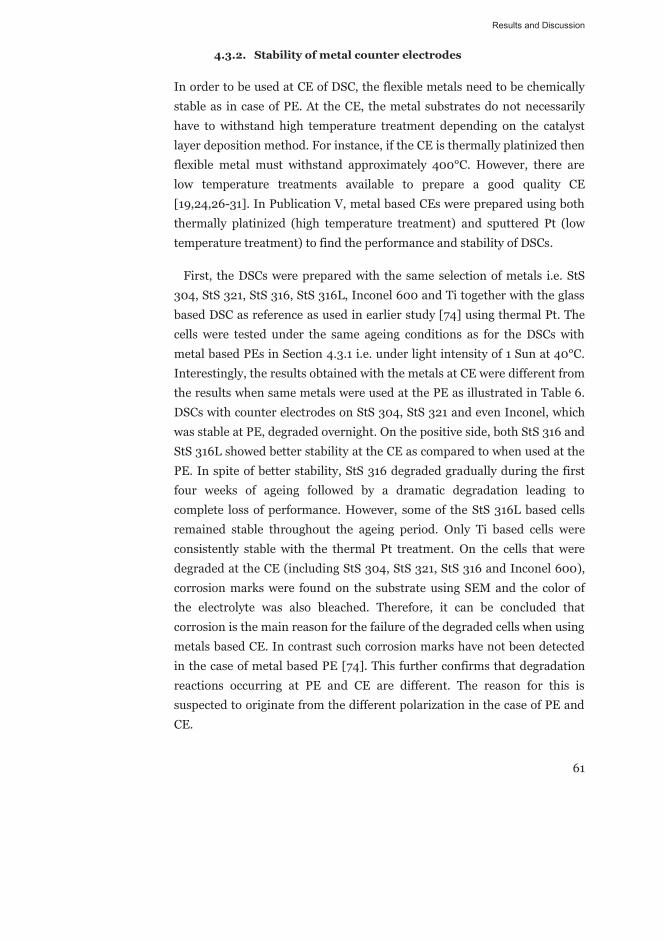
Results and Discussion
61
4.3.2. Stability of metal counter electrodes
In order to be used at CE of DSC, the flexible metals need to be chemically
stable as in case of PE. At the CE, the metal substrates do not necessarily
have to withstand high temperature treatment depending on the catalyst
layer deposition method. For instance, if the CE is thermally platinized then
flexible metal must withstand approximately 400°C. However, there are
low temperature treatments available to prepare a good quality CE
[19,24,26-31]. In Publication V, metal based CEs were prepared using both
thermally platinized (high temperature treatment) and sputtered Pt (low
temperature treatment) to find the performance and stability of DSCs.
First, the DSCs were prepared with the same selection of metals i.e. StS
304, StS 321, StS 316, StS 316L, Inconel 600 and Ti together with the glass
based DSC as reference as used in earlier study [74] using thermal Pt. The
cells were tested under the same ageing conditions as for the DSCs with
metal based PEs in Section 4.3.1 i.e. under light intensity of 1 Sun at 40°C.
Interestingly, the results obtained with the metals at CE were different from
the results when same metals were used at the PE as illustrated in Table 6.
DSCs with counter electrodes on StS 304, StS 321 and even Inconel, which
was stable at PE, degraded overnight. On the positive side, both StS 316 and
StS 316L showed better stability at the CE as compared to when used at the
PE. In spite of better stability, StS 316 degraded gradually during the first
four weeks of ageing followed by a dramatic degradation leading to
complete loss of performance. However, some of the StS 316L based cells
remained stable throughout the ageing period. Only Ti based cells were
consistently stable with the thermal Pt treatment. On the cells that were
degraded at the CE (including StS 304, StS 321, StS 316 and Inconel 600),
corrosion marks were found on the substrate using SEM and the color of
the electrolyte was also bleached. Therefore, it can be concluded that
corrosion is the main reason for the failure of the degraded cells when using
metals based CE. In contrast such corrosion marks have not been detected
in the case of metal based PE [74]. This further confirms that degradation
reactions occurring at PE and CE are different. The reason for this is
suspected to originate from the different polarization in the case of PE and
CE.

Results and Discussion
62
To improve the stability of metal based DSCs, a protective coating of
sputtered Pt was applied on the metal substrates. The sputtered Pt acted as
both the protective layer as well as the catalyst layer. The DSCs were
prepared with the same above mentioned metals and subjected to similar
testing. Figure 20 shows that the sputtered Pt was successful in preventing
corrosion; in all but one case (Inconel), the cells were stable during the
1000 h test. It is evident from the improved stability results that the higher
coverage provided by the sputtered Pt to the metal substrates as compared
to thermal Pt increased the resistance against the corrosive action of the
electrolyte. The degradation of the Inconel 600 even using sputtered Pt
showed the tendency of Inconel 600 for the corrosion at the CE. It might be
related to the high nickel content (72%) in Inconel 600, as StS were
remained stable which have 10% nickel.

Results and Discussion
63
Figure 20. Typical performance parameters of cells with different metals as
counter electrode substrate and sputtered Pt catalyst layer a) short circuit
current density iSC, b) open circuit voltage VOC, c) fill factor FF and d) efficiency
η as a function of time. Figure from Publication V.
The degraded Inconel 600 substrate was further investigated using SEM
imaging. The image of the Inconel substrate before the ageing test is shown
in the Figure 21c. After the ageing test, a number of corrosion pit holes
02468
101214
0 1 2 3 4 5 6time (w eeks)
i SC (m
A/cm
2 )
StS 304StS 321StS 316StS 316LInconelTiGlass
a)
-0.8
-0.6
-0.4
-0.2
00 1 2 3 4 5 6
time (w eeks)
VO
C (V
)
b)
0
20
40
60
80
0 1 2 3 4 5 6time (w eeks)
FF (%
)
c)
0
2
4
6
0 1 2 3 4 5 6time (w eeks)
η (%
)
d)

Results and Discussion
64
appeared on its surface as shown in Figure 21a. The Figure 21b showed the
magnified image of the pit hole marked with a rectangle in Figure 21a.
Figure 21. a) A SEM image of a sputtered Inconel 600 substrate after the ageing
test. b) A magnified SEM image from the area which is marked with rectangle in
figure a showing a corrosion pit hole. c) A SEM image of Inconel substrate
before the ageing test. Figure from Publication V.
The EIS was performed on the cells at the open circuit conditions under
illumination as the performance of the light independent series connected
components such as series resistance RS and charge transfer resistance RCE
at the CE can be quantitatively compared. In the EIS analysis, all the Pt
sputtered metal CEs, except Inconel 600, as well as reference glass DSC
showed similar trend in ageing. As an example Pt sputtered StS 316 is
presented here as shown in Figure 22. The Pt sputtered Inconel 600 based DSC degraded before the
initial measurement due to corrosion.

Results and Discussion
65
Figure 22. EIS response of a DSC having Pt sputtered StS 316 as counter
electrode before and after the light soaking test measured under illumination at
open circuit conditions. The data is shown as a) a Nyquist plot b) imaginary
impedance Z’’ vs. frequency f and c) real impedance Z’ vs. f. Figure from
Publication V.
Figure 22a shows the Nyquist plot of the Pt sputtered StS 316 based DSC
measured under illumination at open circuit conditions. The RS which is
mainly caused by the sheet resistance of the substrate and given in the
Nyquist plot by the real axis value before the left most semicircle starts. It is
clear from
Figure 22a that RS did not change during the ageing. The smaller circle at
the left in

Results and Discussion
66
Figure 22a, corresponds to the high frequency features in
Figure 22b&c and represents the RCE at the CE/electrolyte interface. It
was found that RCE decreased from 10 Ωcm2 to 1.5 Ωcm2 which relates to a
significant improvement in the catalytic activity at the CE. This increase in
the catalytic activity should give rise to improvement in FF. However, such
increase in FF was not detected as Figure 20 indicates. At the same time, a
slope (45°) attached to the semicircle appeared in the case of aged DSC as
shown in
Figure 22a. This slope represents the transport resistance in the TiO2
film. It is not possible to conclude whether the transport resistance
increased in the aged cell or not, because the slope was visible in the EIS
spectrum before the ageing.
Table 6. A comparison of stability of metal based DSCs when different metals
substrates were used at PE and CE under ageing conditions of 1 sun equivalent
light intensity at 40 °C for 1000 h test. Stable = passing of 1000 h with only
minor loss of performance; unstable = significant loss of performance during
1000 h test; very unstable = significant loss of performance in first 24 h of
testing. Table from Publication VI.
Metal PE
Metal CE with
a thermal Pt
layer
Metal CE with a
sputtered Pt layer
StS 304 very unstable very unstable stable
StS 321 very unstable very unstable stable
Acid proof steel 316 very unstable unstable stable
Acid proof steel 316L very unstable stable stable
Inconel 600 stable very unstable unstable
Titanium stable stable stable

Results and Discussion
67
Table 6 gives a general overview of the stability of different metal
substrates including StS 304, StS 321, StS 316, StS 316L, Inconel 600 and
Ti. The stability results are given for metal substrates used at the PE and the
CE with thermal Pt or with sputtered Pt. The stability status is defined into
three categories i.e. very unstable, unstable and stable. The DSCs which
remained stable or lost minor performance over the entire ageing period
are declared as stable. Those DSCs which lost their performance
significantly during the ageing period are marked as unstable. On the
extreme side those cells which degraded completely within 24 hours are
marked as very unstable. It is clear from Table 6 that only Inconel 600 and
Ti are found stable while the rest of the metals were very unstable when
used at the PE. Different results were obtained only for StS 316, StS 316L
and Inconel 600 while rest of the results remained the same when the
metals were used at the CE using thermal Pt as the catalyst. Inconel 600
was found to be very unstable at the CE. StS 316 was found to be unstable
and StS 316L was found to be stable. Dramatic improvement was seen
among all the cells when sputtered Pt was used at the metal CE. All the
metal based DSCs remained stable in the test with an exception of Inconel
600 which was found unstable but not very unstable. It shows that Inconel
is highly prone to corrosion and even the protective sputtered Pt coating did
not manage to save it.
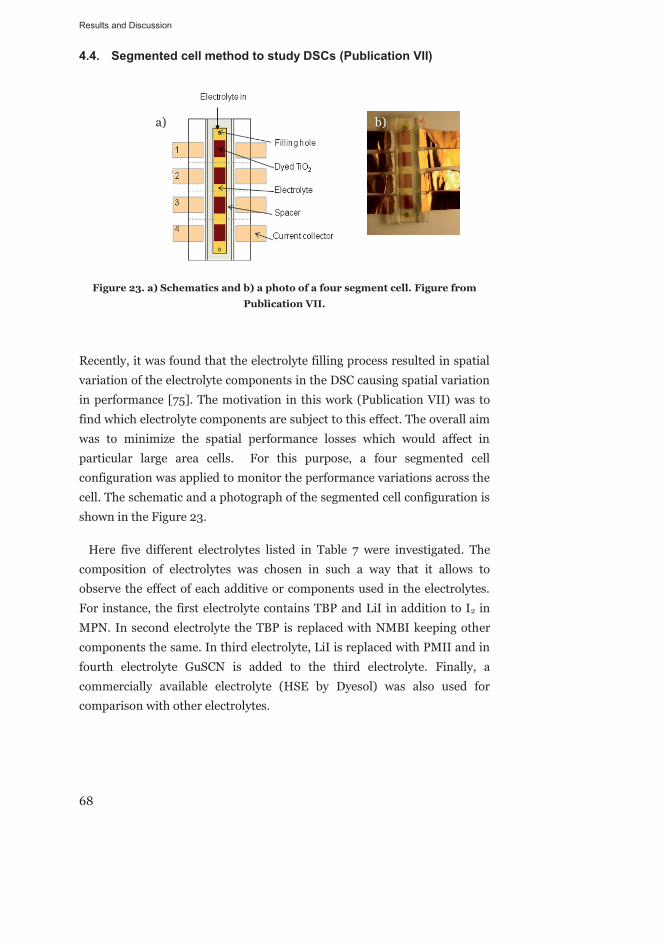
Results and Discussion
68
4.4. Segmented cell method to study DSCs (Publication VII)
Figure 23. a) Schematics and b) a photo of a four segment cell. Figure from
Publication VII.
Recently, it was found that the electrolyte filling process resulted in spatial
variation of the electrolyte components in the DSC causing spatial variation
in performance [75]. The motivation in this work (Publication VII) was to
find which electrolyte components are subject to this effect. The overall aim
was to minimize the spatial performance losses which would affect in
particular large area cells. For this purpose, a four segmented cell
configuration was applied to monitor the performance variations across the
cell. The schematic and a photograph of the segmented cell configuration is
shown in the Figure 23.
Here five different electrolytes listed in Table 7 were investigated. The
composition of electrolytes was chosen in such a way that it allows to
observe the effect of each additive or components used in the electrolytes.
For instance, the first electrolyte contains TBP and LiI in addition to I2 in
MPN. In second electrolyte the TBP is replaced with NMBI keeping other
components the same. In third electrolyte, LiI is replaced with PMII and in
fourth electrolyte GuSCN is added to the third electrolyte. Finally, a
commercially available electrolyte (HSE by Dyesol) was also used for
comparison with other electrolytes.
a) b)

Results and Discussion
69
Table 7. Composition of electrolytes in molar concentrations. Table from
Publication VII.
Electrolyte name I2 TBP NMBI LiI PMII GuSCN Solvent
TBP-LiI 0.05 0.5 0.5 MPN
NMBI-LiI 0.05 0.5 0.5 MPN
NMBI-PMII 0.05 0.5 0.5 MPN
NMBI-PMII-GuSCN 0.05 0.5 0.5 0.1 MPN
The I-V curves of all the cells in the segmented cells were measured under
1 Sun at RT. The performance parameters of all the segments in the
segmented cells are given in Table 8. It was found that VOC was
systematically decreasing from segment 1 to segment 4 in the case of all the
studied electrolytes. The variation of VOC was the largest with 4-tBP-LiI and
NMBI-LiI electrolyte in which case there was also systematic increase of iSC
from segment 1 to segment 4. Usually, 4-tBP and NMBI are added in the
electrolyte to increase the VOC. Thus, decrease in VOC in all the cells results
due to decreasing concentration of 4-tBP and NMBI from segment 1 to
segment 4. In an early study, electrolyte solution containing only LiI and I2
gave uniform performance in the 4-segmented cells [75], which means LiI
alone does not cause spatial variation problem. However, here LiI is used
together with 4-tBP or NMBI. In literature formation of Li+ and 4-TBP
complexes have been reported [76,77]. It appears that in segments having
higher concentration of 4-tBP or NMBI, Li+ concentration decreases due to
the complex formation. Decrease in Li+ concentrations leads to the higher
shift in the conduction band of TiO2 which would result in decrease in
injection efficiency and finally result in decreasing iSC.

Results and Discussion
70
Table 8. The performance parameters of the individual segments and their
parallel connection in comparison to the small reference cell for different
electrolytes. Table from Publication VII.

Results and Discussion
71
As the hypothesis for the phenomenon is that the electrolyte components
are not distributed evenly, the next step was to perform a chemical analysis
of the electrolyte in each segment. The Raman spectroscopy for being a
non-destructive method was suitable for analyzing different segments in all
the segmented cells. However, the FTO-glass plates used in the actual
segmented cells were in fact so thick (2.5 mm) that they interfered with the
quality of the Raman response. Thus for the Raman cells a series of
segmented cells were made in which the counter electrode was replaced
with a thin microscope glass (1 mm).
The Raman spectra at the PEs of the reference cells of all the five different
electrolytes are shown in the Figure 24. The Raman spectra for all the cells
were apparently quite same except at some frequencies the intensities of the
peaks are varied. This already implies that there were no separate peaks
seen for different electrolyte additives such as TBP and NMBI. In literature,
Raman peak for 4-tBP and NMBI should appear at 996 cm-1 and around
1360 cm-1 respectively [78,79]. However, there were no peaks in those
regions showing weak Raman signals for the 4-tBP and NMBI. This might
be due to the fact that the sample referred in the literature [78,79] were
only based on a mixture of MBI and LiI in MPN or 4-tBP liquid, whereas
here the Raman spectroscopy was performed on complete DSCs which also
included the dyed TiO2 films. Other studies using Raman spectroscopy on
complete DSC also did not show these peaks either [79,80].

Results and Discussion
72
Figure 24. Comparison of Raman spectra at the photoelectrodes of reference
cells with the different electrolytes in the range 0-2400 cm-1. Figure from
Publication VII.
There were significant differences in the peak heights around 2106 cm-1.
The peak around 2106 cm-1 is associated with the thiocyanate (SCN-) in the
literature [79,80]. The SCN- ligand which is attached to the Ru atom of the
dye plays a major role in regenerating the oxidized dye. In order to see the
effect of the spatial distribution of electrolyte on the SCN- ligand attached
to the dye in a better way, the Raman spectra of all the segments of the
segmented cells and corresponding reference cells are presented in the
range of 2000 to 2300 cm-1 as shown in the Figure 25.
Results and Discussion
73
Figure 25. Comparison of Raman spectra at the photoelectrodes of segmented
cells and corresponding reference cell using electrolyte a) 4-tBP-LiI, b) NMBI-
LiI, c) NMBI-PMII, d) NMBI-PMII-GuSCN and e) HSE in the range of 2000 –
2300 cm-1. f) The SCN- peak heights of all the segmented and reference cells vs.
JSC. The solid line is a phenomenological model fitted to the data: JSC = JMAX (I-
I0)/[(I-I0)-R] where JMAX is maximum photocurrent expected from the device I0
is a background SCN- peak intensity and R is a recombination (or decay) term
inhibiting regeneration (or injection). The fit parameters are JMAX = 10.5
mA/cm2, I0 = 294 and R = 30.7. Figure from Publication VII.

Results and Discussion
74
In the segmented cells with 4-tBP-LiI and NMBI-LiI electrolytes, the
height of the SCN- peaks at 2106 cm-1 showed an increasing trend from
segment 1 to 4 as shown in Figure 25a and b. Interestingly in these
segmented cells, iSC showed a similar increasing trend as given in Table 8.
This indicates that there may be a relation with the intensity of the SCN- in
the Raman spectra and iSC. In the literature [79-81], it has been suggested
that the differences in the electrolyte composition can cause SCN- ligand
substitution processes and both 4-tBP and NMBI have been reported
substituting the SCN- ligand. In the segments with low iSC and higher VOC, a
higher concentration of 4-tBP and NMBI is expected as filtering of those
additives in the TiO2 would have such effects on the photovoltaic
performance. Hence, it seems highly probable the SCN- was exchanged with
4-tBP and/or NMBI. Interestingly, Li+ has been reported to protect the
SCN- ligand exchange with MBI by forming a complex between Li+ and MBI
[79]. Therefore in the segments containing high concentration of NMBI or
4-tBP with low concentration of Li+, there would have occurred more SCN-
ligand exchange reactions. When bulky PMI+ was used instead of small Li+
in the case of NMBI-PMII electrolyte, there was no significant difference
neither in the peak height of SCN- as shown in Figure 25b&c nor in the iSC
values. This implies that the PMI+ ions protected the SCN- ligand from the
exchange reactions. This result is in accordance with the literature that the
bulky ion protects SCN- ligand better as compared to small Li+ [79]. The
intensity of the SCN- peak increased significantly in the case of NMBI-
PMII-GuSCN (Figure 25d) as compared to the case of NMBI-PMII (Figure
25c) suggesting that GuSCN may act as a source of SCN- ligand. Similarly in
the case of HSE, the intensity of the SCN- peak was high (Figure 25e) and
close to the case of NMBI-PMII-GuSCN (Figure 25d), suggesting that HSE
may have contained GuSCN. Interestingly, the iSC values were higher for
NMBI-PMII-GuSCN and HSE, and did not change much as compared to
the cells without having GuSCN. Therefore, the variation in the intensities
of the SCN- in the Raman spectra (Figure 25) is indeed related to the
variations in iSC (Table 8).
Figure 25f iSC of the segmented cells and corresponding reference cells
was plotted as a function of Raman peak intensity of the SCN-. A simple
phenomenological model (see Figure 25 caption) is used to fit the iSC data in
Figure 25f. In the model the SCN- peak intensity is assumed to be
proportional to the rate of charge separation in the dye molecules which

Results and Discussion
75
may be due to dye regeneration and/or electron injection into the TiO2
conduction band. In addition, this process competes with an approximately
constant rate of electron-dye recombination or excited state decay. Indeed,
the IPCE data suggested that most likely regeneration and injection
efficiency are influenced by the spatial variation of electrolyte components.
Therefore, the mechanism affecting the photocurrent is more complex than
the simple model presented in the Figure 25 caption. Hence, in order to
build a quantitative understanding more detailed measurements of
regeneration would be required [81]. Here the purpose of the model is
mainly to illustrate trend that the loss of SCN- ligands would have on iSC
and that the data agrees with it. Figure 25f shows clearly that below the
intensity value of approximately 500 a.u., there is a relation between the iSC
and peak height of the SCN-. It may be concluded that the low iSC in some of
the cells may be limited by the low concentration of SCN- ligand.
Furthermore, Figure 25f suggests that at intensities above 500 a.u. iSC is not
limited by the concentration of SCN-.
Figure 26. Comparison between the normalized (1-T) for segment 1 to 4 for
segmented cell with electrolyte 4-tBP-LiI. The arrows show the blue shift from
segment 4 to 1. Figure from Publication VII.
In the transmission (T) measurements, it was found that the spatial
distribution of electrolyte components also affects the absorption (1-T) by
the cells. As an example absorption data (1-T) of segmented cell with 4-tBP-

Results and Discussion
76
LiI electrolyte is presented in Figure 26. The trend in Figure 26 is that the
spectra are shifted to the red side from segment 1 to 4. In literature, SCN-
ligands are reported to tune the spectral response of a DSC towards red
[62,82]. Therefore, any exchange of SCN- ligands with the electrolyte
additives would cause a blue shift in the cell absorption spectrum. The
Figure 26 shows a blue shift in the absorption spectra of the dye which
corresponds well with the variation in the peak intensity of the SCN- shown
in Figure 25a. The substitution of the one of the two SCN- in each N719 dye
with 4-tBP would give approximately 30 nm IPCE shift towards blue side
(Publication VII). When the transmission and IPCE spectra of all the
segments in segmented cell having 4-tBP-LiI were compared, a 15 nm blue
in the transmission and a 20 nm blue shift in the IPCE were obtained from
segment 4 to segment 1 (Publication VII). Therefore, it can be estimated
that approximately about 25% of the SCN- ligands attached to the Ru atoms
in the dye, were substituted in the first segment.

77
5. Summary and Conclusions
Performance, cost and stability are the fundamental factors affecting the
commercialization of DSCs. In addition, the materials and manufacturing
methods used for DSCs should be compatible for roll-to-roll production.
Degradation of DSCs due to the instability of the materials or due to the
manufacturing technique adversely effects their commercialization.
Achieving long term stability with cheap materials and easy manufacturing
methods using flexible substrates is the prerequisite for success of this
technology. This research work investigated the degradation of DSCs,
highlighting the key challenges the technology is facing today. The goal of
the work was to find more stable materials, improve understanding of their
effects on the DSC stability, and develop experimental methods that give
improved resolution of the degradation mechanisms.
There are several degradation issues originating from the usage of cheap
and flexible materials. Some of the degradation is inherited from the
manufacturing processes. New, inexpensive, easy to use and fast methods
such as image processing method are useful to study the degradation
processes causing a visual change on the appearance of DSC such as
bleaching or leakage of the electrolyte. Although many degradation
mechanism are occurring at the same time, with the help of the segmented
cell method it is possible to separate several degradation mechanism. In
addition, it also allows to study the performance degradation due to the
spatial variation of the DSC electrolyte. Optical techniques such as Raman
spectroscopy and IR spectroscopy were used to detect the chemical changes
in the DSCs.
As the purpose of the work was to systematically study the degradation in
DSCs, the first step was to perform critical review of the state of the art of
stability of DSCs. This resulted in publication I where among other things
hypotheses for several degradation mechanisms were collected and

Summary and Conclusions
78
discussed. It was concluded in the review that techniques giving chemical
information are very useful to understand the degradation mechanisms.
However, mostly the chemical techniques are destructive in nature and
cannot be used for in-situ measurements. Information about the chemical
changes in the DSCs during the degradation is essential to understand the
chemistry inside the DSCs.
One way to detect the chemical changes in DSCs is to link the results
obtained from chemical techniques with ones obtained through the
standard PV measurements techniques such as I-V measurements under 1
Sun, EIS, IPCE, optical reflectance and transmission measurements. This
was the goal of the research reported in publication II. In this publication
effects of SCN- ligand substitution reaction, which had been reported in the
literature to cause of degradation of DSC at 80°C, was studied in a
continued experiment. Using mass spectroscopy analysis it had been shown
previously in the literature that SCN ligand of N719 dye can become
substituted with tBP at elevated temperatures i.e. 80°C. Here, this
substituted compound N719-tBP was synthesized in purpose and used as
the sensitizer in DSC, and compared with the cells using pristine N719, to
find out the maximum effect of this particular degradation mechanism. The
comparative analysis revealed that DSCs based on substituted dye gave 50%
less efficiency as compared to the pristine N719 dye based DSCs. IPCE and
EIS measurements revealed that the substituted dyes were suffering from
lower light harvesting efficiency (30nm blue shift in the absorption spectra
as compared to pristine N719), 14% lower charge separation efficiency and
50% shorter electron diffusion length due to lower electron recombination
resistance. These results can be used as a finger print of the SCN- ligand
substitution reaction occurring in DSCs.
In publication III & IV, the motivation was to correlate the information of
chemical changes in DSCs with the visual appearance i.e. color of the DSC
which then can further be related to the standard PV measurements. A new
in-situ method was introduced in publication III based on the already
known image processing techniques. The method was demonstrated to
study an important degradation reaction leading to the bleaching of the
electrolyte. The yellow color of the electrolyte was first correlated with the
RGB values obtained through the image processing method which can be
used to estimate the concentration of tri-iodide in the electrolyte. With the

Summary and Conclusions
79
help of this method, it was concluded that the TiO2 is involved in the
electrolyte bleaching reaction under UV+visible illumination at 85°C. It
was further checked with standard I-V measurement and the results were in
agreement with each other. Later, the image processing method was also
demonstrated in publication IV to monitor the dye sensitization process.
This method can also be applied to examine the dye degradation since this
degradation type changes the color of the dye.
In publication VII, the motivation was to investigate the effect of a
manufacturing step used to fill the electrolyte in the DSCs and to find a
relationship between the Raman spectroscopy and the other standard PV
measurement methods. It was earlier reported that electrolyte filling step
causes non-uniform spatial distribution of the electrolyte components
leading to the spatial variation in the DSC performance. Recently
introduced segmented cell method was used to factor out the electrolyte
components vulnerable to spatial variation. Raman spectroscopy was
applied together with standard PV techniques to observe the performance
degradation in 4-segmented cell. It was found that the nanoporous layer of
TiO2 acts as filter for some additives in the electrolyte resulting in a
performance variation. Further, the change in concentration of electrolyte
additives 4-tBP, NMBI and LiI affected the substitution of SCN- ligand.
When LiI was replaced with PMII, the SCN- ligand was found to be better
protected against the substitution reactions. The Raman spectroscopy
measurements showed a good relationship between the SCN- peak intensity
and the iSC of the DSCs. In worst case, the performance variation was about
35% with conventional electrolyte containing 4-tBp and LiI when the size of
the cell was increased from 0.4 cm2 to 1.6 cm2. On the other hand, in the
best cases the performance variation was about 10% with the electrolyte
containing NMBI-PMII-GuSCN when the cell size was increased from 0.4
cm2 to 1.6cm2. These findings have important implications on the
industrialization of DSCs as there the cell is mostly designed for larger areas
where the spatial variation effect due to the molecular filter would be even
larger.
In publication V & VI, the motivation was to find a stable TCO free flexible
substrate suitable for the roll-to-roll production. In earlier studies a series
of cheap metals were tested as a DSC PE. Most of those metals degraded

Summary and Conclusions
80
due to some unknown reason except the Ti and Inconel 600 alloy. Here the
same series of metals was tested as the DSC CE using two different methods
for the catalyst deposition i.e. thermally platinized and sputter Pt. Most of
the thermally platinized cells degraded overnight due to corrosion except Ti
and StS 316L. However, all the metal based DSCs i.e. StS 304, StS 321, StS
316, StS 316L and Ti using sputtered Pt remained stable except alloy
Inconel 600 which contains 72% of the Ni content. The main conclusion
from this study is that there are stable metal alternatives available for both
PE and CE applications.
In conclusion, DSCs are facing a lot of challenges on their way for
commercialization. There is a need to find stable flexible plastic PE for the
DSCs having stable flexible metal CE for achieving completely flexible DSC
which is essential for large scale mass production of this technology. In this
regard, preparation methods are very important for plastic PE. On the other
hand there are also viable metals to be used at PE, however in this case the
CE needs to be plastic based. Conventional TCO should be avoided to
reduce the costs, therefore alternative transparent conductive materials are
needed for plastic substrates. Using plastic substrates brings new severe
challenges with respect to sealing due to permeability of impurities like
water and oxygen and porosity of substrate. In electrolytes, alternative
redox couples should be tested in an effort to improve the stability of DSCs
especially in relation to metal substrates. Understanding of degradation
mechanisms is essential to improve the stability, hence intensive work is
needed to link the chemical changes in the DSCs with the standard PV
measurements. Raman spectroscopy, image processing method and
segmented cell method can play a significant role in this regard. There is
also need to find a viable solution to avoid the spatial distribution of
electrolyte in large area DSCs in the future.

81

82
References
1. International Energy Agency (IEA), World Energy Outlook (WEO),
London 9 November 2010.
2. T. Barker, I. Bashmakov, L. Bernstein, J. E. Bogner, P. R. Bosch, R.
Dave, O. R. Davidson, B. S. Fisher, S. Gupta, K. Halsnæs, G.J. Heij,
S. Kahn Ribeiro, S. Obayashi, M. D. Levine, D. L. Martino, O.
Masera, B. Metz, L. A. Meyer, G.-J. Nabuurs, A. Najam, N.
Nakicenovic, H. -H. Rogner, J. Roy, J. Sathaye, R. Schock, P. Shukla,
R. E. H. Sims, P. Smith, D. A. Tirpak, D. Urge-Vorsatz, D. Zhou,
Technical Summary. In: Climate Change 2007: Mitigation.
Contribution of Working Group III to the Fourth Assessment Report
of the Intergovernmental Panel on Climate Change [B. Metz, O. R.
Davidson, P. R. Bosch, R. Dave, L. A. Meyer (eds)], Cambridge
University Press, Cambridge, United Kingdom and New York, NY,
USA.
3. European Union Objectives for Energy Technology, SET plan,
November 2007.
4. The Energy of Sun, educational website on Astronomy available
online at http://www-istp.gsfc.nasa.gov/stargaze/Sun7enrg.htm,
quoted 28.09.2011.
5. Discover the True Facts about Solar Energy, available online at
http://www.facts-about-solar-energy.com/facts-about-solar-
energy.html, quoted 28.09.2011.
6. Solar Energy Could Produce Majority of World’s Energy by 2060,
available online at http://www.businessinsider.com, quoted
28.09.2011
7. PV status report, JRC European Commission, 2011.
8. Best Research-Cells Efficiencies, National Renewable Energy
Laboratory (NREL) website available online at
83
http://www.nrel.gov/ncpv/images/efficiency_chart.jpg, quoted
05.11.2011.
9. A. Yella, H. Lee, H.N. Tsao, C. Yi, A.K. Chandiran, M. Nazeeruddin,
E.W. Diau, C. Yeh, S.M. Zakeeruddin and M. Grätzel, Science, 334,
629-633, 2011.
10. G. Hashmi, K. Miettunen, T. Peltola, J. Halme, M.I. Asghar, K.
Aitola, M. Toivola and P. Lund, Renewable Sustainable Energy Rev.,
15, 3717-3732, 2011.
11. J. Kalowekamo and E. Baker. Sol. Energy, 83, 1224-1231, 2009.
12. J. Halme, P. Vahermaa, K. Miettunen and P. Lund, Adv. Mater., 22,
E210–E234, 2010.
13. T. Yamaguchi, N. Tobe, D. Matsumoto, T. Nagai and H. Arakawa,
Sol. Energy Mater. Sol. Cells, 94, 812–816, 2010.
14. H. Lindstrom, A. Holmberg, E. Magnusson, L. Malmqvist and A.
Hagfeldt, J. Photochem. Photobiol. A, 145, 107–112, 2001.
15. T.N. Murakami, Y. Kijitori, N. Kawashima and T. Miyasaka, Chem.
Lett., 32, 1076–1077, 2003.
16. H. Pan, S.H. Ko, N. Misra and C.P. Grigoropoulos, Appl. Phys.
Lett., 94, 071117, 2009.
17. K. Miettunen, J. Halme, M. Toivola and P. Lund, J. Phys. Chem. C,
112, 4011–4017, 2008.
18. J.H. Park, Y. Jun, H. Yun, S. Lee and M.G. Kang, J. Electrochem.
Soc., 155, F145–F149, 2008.
19. S. Ito, et. al., Chem. Commun., 38, 4004–4006, 2006.
20. K. Kalyanasundaram, Dye-Sensitized Solar Cells, EPFL press, 2010.
21. Y. Bai, Y. M. Cao, J. Zhang, M. Wang, R. Z. Li, P. Wang, S. M.
Zakeeruddin and M. Grätzel, Nat. Mater., 7, 626–630, 2008.
22. D. Kuang, C. Klein, Z. Zhang, S. Ito, J. Moser, S. M. Zakeeruddin
and M. Grätzel, Small, 3, 2094–2102, 2007.
23. D. Shi, N. Pootrakulchote, R. Li, J. Guo, Y. Wang, S. M.
Zakeeruddin, M. Grätzel and P. Wang, J. Phys. Chem. C, 112,
17046–17050, 2008.
24. T. Ma, X. Fang, M. Akiyama, K. Inoue, H. Noma and E. Abe, J.
Electroanal. Chem., 574, 77–83, 2004.
25. X. Fang, T. Ma, M. Akiyama, G. Guan, S. Tsunematsu and E. Abe,
Thin Solid Films, 472, 242–245, 2005.
84
26. A. Hauch and A. Georg, Electrochim. Acta 46, 3457-3466, 2001.
27. X. Fang, T. Ma, G. Guan, M. Akiyama, T. Kida and E. Abe, J.
Electroanal. Chem., 570, 257–263, 2004.
28. M.G. Kang, N. Park, K.S. Ryu, S.H. Chang and K. Kim, Sol. Energy
Mater. Sol. Cells, 903, 574–581, 2006.
29. Y. Jun, J. Kim and M.G. Kang, Sol. Energy Mater. Sol. Cells, 91,
779–784, 2007.
30. S. Kim, Y. Nah, Y. Noh, J. Jo and D. Kim, Electrochim. Acta, 51,
3814–3819, 2006.
31. J. Nemoto, M. Sakata, T. Hoshi, H. Ueno and M. Kaneko, J.
Electroanal. Chem., 599, 23–30, 2007.
32. J. Chen, K. Li, Y. Luo, X. Guo, D. Li and M. Deng, S. Huang and Q.
Meng, Carbon, 47, 2704–2708, 2009.
33. H.S. Wroblowa and A. Saunders, J. Electroanal. Chem., 42, 329–
346, 1973.
34. F. Fabregat-Santiago, J. Bisquert, G. Garcia-Belmonte, G. Boschloo
and A. Hagfeldt, Sol. Energy Mater. Sol. Cells, 87, 117–131, 2005.
35. J. Bisquert, G. Garcia-Belmonte, F. Fabregat-Santiago, N. S.
Ferriols, P. Bogdanoff and E.C. Pereira, J. Phys. Chem. B, 104,
2287–2298, 2000.
36. F. Fabregat-Santiago, J. Bisquert, E. Palomares, L. Otero, D. Kuang,
S.M. Zakeeruddin and M. Grätzel, J. Phys. Chem. C, 111, 6550–
6560, 2007.
37. R. Kern, R. Sastrawan, J. Ferber, R. Stangl and J. Luther,
Electrochem. Acta 47 (26), 4213–4225, 2002.
38. C. Kontoyannis, M. Orkoula and P. Koutsoukos, Analyst, 122, 33–
38, 1997.
39. M.J. Pelletier, Appl. Spectrosc., 57, Number 1, 2003.
40. K. Miettunen, J. Halme and P. Lund, J. Phys. Chem. C, 113, 10297–
10302, 2009.
41. T. Watson, P. Holliman and D. Worsley, J. Mater. Chem., 21, 4321–
4325, 2011.
42. M. Spath, P.M. Sommeling, J.A.M. van Roosmalen, H.J.P. Smit,
N.P.G. van der Burg, D.R. Mahieu, N.J. Bakker and J.M. Kroon,
Prog. Photovoltaics Res. Appl., 11, 207–220, 2003.
43. P.M. Sommeling, M. Späth, H.J.P. Smith, N.J. Bakker and J.M.
Kroon, J. Photochem. Photobiol. A, 164, 137–144, 2004.
85
44. E. Figgemeier and A. Hagfeldt, Int. J. Photoenergy, 6, 127–140,
2004.
45. M. Ikegami, J. Suzuki, K. Teshima, M. Kawaraya and T. Miyasaka,
Sol. Energy Mater. Sol. Cells, 93, 836–839, 2009.
46. P. Wang, S. M. Zakeeruddin, J. E. Moser, M. K. Nazeeruddin, T.
Sekiguchi and M. Grätzel, Nat. Mater., 2, 402–407, 2003.
47. P. Wang, C. Klein, R. Humphry-Baker, S. M. Zakeeruddin and M.
Grätzel, J. Am. Chem. Soc., 127, 808–809, 2005.
48. P. Wang, C. Klein, R. Humphry-Baker, S. M. Zakeeruddin and M.
Grätzel, Appl. Phys. Lett., 86, 123508, 2005.
49. H.T. Nguyen, H.M. Ta and T. Lund, Sol. Energy Mater. Sol. Cells,
91, 1934–1942, 2007.
50. P.T. Nguyen, R. Degn, H.T. Nguyen and T. Lund, Sol. Energy Mater.
Sol. Cells, 93, 1939–1945, 2009.
51. E. Palomares, J. N. Clifford, S. A. Haque, T. Lutz and J. R. Durrant,
J. Am. Chem. Soc., 125, 475–482, 2003.
52. A. Kay and M. Grätzel, Chem. Mater., 14, 2930–2935, 2002.
53. S. Wu, Q. Tai, J. Zhang, S. Xu, C. Zhou, Y. Yang, H. Hu, B. Chen, B.
Sebo and X. Zhoa, Nanotechnology, 19, 215704, 2008.
54. T. Kitamura, K. Okada, H. Matsui and N. Tanebe, J. Sol. Energy
Eng., 132, 2010.
55. W. J. Lee, E. Ramasamy, D. Y. Lee and J. S. Song, Sol. Energy
Mater. Sol. Cells, 92, 814–818, 2008.
56. W. J. Lee, E. Ramasamy, D. Y. Lee and J. S. Song, ACS Appl. Mater.
Interfaces, 1, 1145–1149, 2009.
57. H. Zhu, H. Zeng, V. Subramanian, C. Masarapu, K. H. Hung and B.
Wei, Nanotechnology, 19, 465204, 2008.
58. M.G. Kang, N. Park, K.S. Ryu, S.H. Chang and K. Kim, Sol. Energy
Mater. Sol. Cells, 90, 574–581, 2006.
59. P. M. Sommeling, M. Spath, H. J. P. Smith, N. J. Bakker and J. M.
Kroon, J. Photochem. Photobiol. A, 164, 137–144, 2004.
60. R. Sastrawan, J. Beier, U. Belledin, S. Hemming, A. Hinch, R. Kern,
C. Vetter, F.M. Petrat, A. Prodi-Schwab, P. Lechner and W.
Hoffmann, Sol. Energy Mater. Sol. Cells, 90, 1680–1691, 2006.
61. S. Dai, et al., Sol. Energy Mater. Sol. Cells, 85, 447–455, 2005.

86
62. M. K. Nazeeruddin, P. Pechy, T. Renouard, S. M. Zakeeruddin, R.
Humphry-Baker, P. Comte, P. Liska, L. Cevey, E. Costa, V. Shklover,
L. Spiccia, G. B. Deacon, C. A. Bignozzi and M. Grätzel, J. Am.
Chem. Soc., 123, 1613–1624, 2001.
63. S. M. Zakeeruddin, M. K. Nazeeruddin, R. Humphry-Baker, P.
Pechy, P. Quagliotto, C. Barolo, G. Viscardi and M. Grätzel,
Langmuir, 18, 952–954, 2002.
64. P. Wang, C. Klein, R. Humphry-Baker, S. M. Zakeeruddin and M.
Grätzel, J. Am. Chem. Soc., 127, 808–809, 2005.
65. D. Kuang, C. Klein, S. Ito, J. Moser, R. Humphry Baker, N. Evans, F.
Duriaux, C. Grätzel, S. M. Zakeeruddin and M. Grätzel, Adv. Mater.,
19, 1133–1137, 2007.
66. F. Gao, Y. Wang, J. Zhang, D. Shi, M. Wang, R. Humphry-Baker, P.
Wang, S. M. Zakeeruddin and M. Grätzel, Chem. Commun., 23,
2635–2637, 2008.
67. H. Tian, X. Yang, R. Chen, A. Hagfeldt and L. Sun, Energy Environ.
Sci., 2, 674–677, 2009.
68. B. Macht, M. Turrion, A. Barkschat, P. Salvador, K. Ellmer and H.
Tributsch, Sol. Energy Mater. Sol. Cells, 73, 163–173, 2002.
69. P.M. Sommeling, M. Späth, H.J.P. Smith, N.J. Bakker and J.M.
Kroon, J. Photochem. Photobiol. A, 164, 137–144, 2004.
70. E. Olsen, G. Hagen and S. E. Lindquist, Sol. Energy Mater. Sol. Cells,
63, 267–273, 2000.
71. N. Papageorgiou, W.F. Maier and M. Grätzel, J. Electrochem. Soc.,
144, 876–884, 1997.
72. H. Nusbaumer, S.M. Zakeeruddin, J.E. Moser and M. Grätzel,
Chem. Eur. J., 9, 3756–3763, 2003.
73. R.C. Gonzalez and R.E. Woods, Digital Image Processing 2nd
Edition, 282, 2002.
74. K. Miettunen, X. Ruan, T. Saukkonen, J. Halme, M. Toivola, H.
Guangsheng and P. Lund, J. Electrochem. Soc., 157, B814-B819,
2010.
75. K. Miettunen, J. Halme and P. Lund, Electrochem. Commun., 11,
25–27, 2009.
76. K. Hara, Y. Dan-oh, C. Kasada, Y. Ohga, A. Shinpo, S. Sadaharu, K.
Sayama and H. Arakawa, Langmuir, 20, 4205–4210, 2005.
77. S. Nakade, T. Kanzaki, W. Kubo, T. Kitamura, Y. Wada and S.
Yanagida, J. Phys. Chem. B, 109, 3480–3487, 2005.

87
78. C. Shi, S. Dai, K. Wang, X. Pan, F. Kong and L. Hu, Vib. Spectrosc.,
39, 99–105, 2005.
79. H. Greijer Agrell, J. Lindgren and A. Hagfeldt, J. Photochem.
Photobiol. A, 164, 23–27, 2004.
80. H. Greijer, J. Lindgren and A. Hagfeldt, J. Phys. Chem. B, 105,
6314–6320, 2001.
81. F. Nour-Mohammadi, H. T. Nguyen, G. Boschloo and T. Lund, J.
Photochem. Photobiol. A, 187, 348–355, 2007.
82. Md. K. Nazeeruddin, P. Péchy and M. Grätzel, Chem. Commun., 18,
1705–1706, 1997.


9HSTFMG*aegbaf+