3. results 3.1 introduction and totals 3.2 argonne ... · the best estimate for the total...
TRANSCRIPT
3. RESULTS
3.1 Introduction and Totals
The results of compiling the contaminant inventory information for 1994 through 1999 are discussed in this section.
3.2 Argonne National Laboratory-West
Summary results of both nonradiological and radiological contaminants from ANL-W are discussed in the following paragraphs and presented in the associated tables.
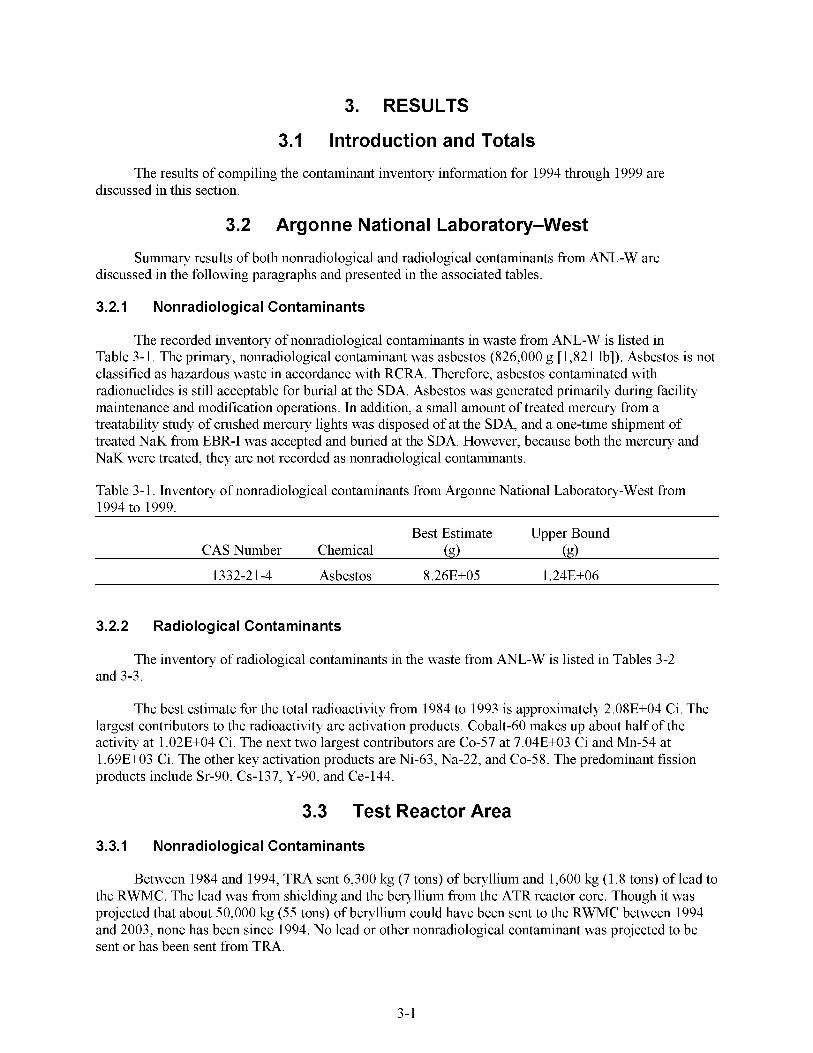
3.2.1 Nonradiological Contaminants
The recorded inventory of nonradiological contaminants in waste from ANL-W is listed in Table 3-1. The primary, nonradiological contaminant was asbestos (826,000 g [1,821 lb]). Asbestos is not classified as hazardous waste in accordance with RCRA. Therefore, asbestos contaminated with radionuclides is still acceptable for burial at the SDA. Asbestos was generated primarily during facility maintenance and modification operations. In addition, a small amount of treated mercury from a treatability study of crushed mercury lights was disposed of at the SDA, and a one-time shipment of treated NaK from EBR-I was accepted and buried at the SDA. However, because both the mercury and NaK were treated, they are not recorded as nonradiological contaminants.
Table 3 - 1. Inventory of nonradiological contaminants from Argonne National Laboratory-West from 1994 to 1999.
Best Estimate Upper Bound CAS Number Chemical (g) (g)
1332-2 1-4 Asbestos 8.26E+05 1.24E+06
Best Estimate Upper Bound CAS Number Chemical (g) (g)
1332-2 1-4 Asbestos 8.26E+05 1.24E+06
3.2.2 Rad iolog ical Contaminants
The inventory of radiological contaminants in the waste from ANL-W is listed in Tables 3-2 and 3-3.
The best estimate for the total radioactivity from 1984 to 1993 is approximately 2.08E+04 Ci. The largest contributors to the radioactivity are activation products. Cobalt-60 makes up about half of the activity at 1.02E+04 Ci. The next two largest contributors are Co-57 at 7.04E+03 Ci and Mn-54 at 1.69E+03 Ci. The other key activation products are Ni-63, Na-22, and Co-58. The predominant fission products include Sr-90, Cs-137, Y-90, and Ce-144.
3.3 Test Reactor Area
3.3.1 Nonradiological Contaminants
Between 1984 and 1994, TRA sent 6,300 kg (7 tons) of beryllium and 1,600 kg (1.8 tons) of lead to the RWMC. The lead was from shielding and the beryllium from the ATR reactor core. Though it was projected that about 50,000 kg (55 tons) of beryllium could have been sent to the RWMC between 1994 and 2003, none has been since 1994. No lead or other nonradiological contaminant was projected to be sent or has been sent from TRA.
3-1

Table 3 -2. Inventory of radiological contaminants (listed by quantity) from Argonne National Laboratory- West from 1994 to 1999 (activity at time of disposal).
Best Estimate Percent of Total Radionuclide (Ci) ("/.I Upper Bound
CO-60
CO-57
Mn-54
Ni-63
CO-5 8
Na-22
Ni-59
CS-137
Sr-90
Y-90
Ce-144
Sr-89
C-14
RU- 106
Zr-95
Fe-59
Nb-95
~ r - ~ '
PU-24 1
Sb-125
H-3
EU-155
CS-134
Nb-94
EU-154
Ta- 182
PU-239
Sn-113
PU-240
PU-23 8
Am-24 1
1.02E+04
7.04E+03
1.69E+03
1 .O 1E+03
4.6 1E+02
3.67E+02
2.07E+O 1
1.89E+O 1
1,80E+O 1
1.79E+O 1
l.l8E+O 1
8.68E+00
7.11E+00
3.45E+00
3.34E+00
1.80E+O0
1.6 1E+00
1.56E+00
1.45E+00
7.74E-0 1
7.74E-0 1
6.46E-01
6.10E-01
2.68E-0 1
1.10E-0 1
9.24E-02
3.60E-02
2.86E-02
2.75E-02
2.04E-02
1.60E-02
48.7
33.8
8.1
4.8
2.2
1.8
0.10
0.09
0.09
0.09
0.06
<0.05
<0.05
<0.05
<0.05
<0.05
<0.05
<0.05
<0.05
<0.05
<0.05
<0.05
<0.05
<0.05
<0.05
<0.05
<0.05
<0.05
<0.05
<0.05
<0.05
3 -2
2.29E+04
7.04E+03
3.7 1 E+03
5.98E+03
7.66E+02
5.64E+03
8.02E+01
2.90E+O 1
1.03E+02
1.06E+02
4.86E+O 1
5.14E+01
1.97E+O 1
1.62E+O 1
1.67E+O 1
2.23E+00
3.65E+00
3.06E+00
4.16E+03
3.18E+00
1.95E+02
2.5 7E+00
2.5 OE+OO
6.39E-0 1
4.25E+00
2.03E-0 1
1.78E-01
1.4 1E-0 1
l.llE+OO
1 .OOE-0 1
1.23E+03

Table 3 -2. (continued).
Best Estimate Percent of Total Radionuclide (Ci) ("/.I Upper Bound
Np-237
Ba-140
U-235
TC-99
U-234
U-23 8
1-129
Ag- 1 1 Om
EU-152
Sb-124
La-140
U-233
Cm-244
U-232
1-131
Th-228
Th-230
Pa-23 1
Sn- 1 17m
PU-242
AC-227
Th-229
Am-243
Ra-226
Pb-2 10
C1-36
Th-232
Ra-228
Te-132
U-236
7.5 9E-03
4.9 1 E-03
3.18E-03
2.64E-03
1.69E-03
1.66E-03
1.56E-03
1.3 1E-03
1.23E-03
1.21E-03
8.25E-04
5.69E-04
8.73E-05
4.70E-06
4.5 OE-06
1.66E-06
2.02E-07
1.60E-08
1.70E-09
1.03E-09
1 .O 1E-09
3.46E-10
2.15E-10
1.29E- 10
3.76E- 12
2.76E- 12
2.02E- 14
1.47E- 15
6.7 1E- 17
O.OOE+OO
<0.05
<0.05
<0.05
<0.05
<0.05
<0.05
<0.05
<0.05
<0.05
<0.05
<0.05
<0.05
<0.05
<0.05
<0.05
<0.05
<0.05
<0.05
<0.05
<0.05
<0.05
<0.05
<0.05
<0.05
<0.05
<0.05
<0.05
<0.05
<0.05
<0.05
Total 2.08E+04 100.0
3.75E-02
2.95E-02
1.57E-02
4.15E-03
8.34E-03
8.2 1E-03
1.32E+01
7.86E-03
1.88E-03
6.04E-03
4.20E-03
2.8 1E-03
4.15E-04
2.3 OE-05
2.29E-05
8.18E-06
9.98E-07
7.89E-08
8.49E-09
5.06E-09
4.98E-09
1.7 1E-09
1.06E-09
1.97E- 10
5.72E- 12
2.76E- 12
9.99E- 14
2.25E-15
1.03E- 16
O.OOE+OO
-
3 -3

Table 3-3. Inventory of radiological contaminants (listed alphabetically) from Argonne National Laboratory-West from 1994 to 1999 (activity at time of disposal).
Best Estimate Percent of Total Radionuclide (Ci) ("/.I Upper Bound
AC-227
Ag- 1 1 Om
Am-24 1
Am-243
Ba-140
C-14
Ce-144
C1-36
Cm-244
CO-57
CO-5 8
CO-60
Cr-5 1
CS-134
CS-137
EU-152
EU-154
EU-155
Fe-59
H-3
1-129
1-131
La-140
Mn-54
Na-22
Nb-94
Nb-95
Ni-59
Ni-63
Np-237
Pa-23 1
1 .O 1E-09
1.3 1E-03
1.60E-02
2.15E-10
4.9 1 E-03
7.11E+00
l.l8E+O 1
2.76E- 12
8.73E-05
7.04E+03
4.6 1E+02
1.02E+04
1.56E+00
6.10E-01
1.89E+O 1
1.23E-03
1.10E-0 1
6.46E-01
1.80E+O0
7.74E-0 1
1.56E-03
4.5 OE-06
8.25E-04
1.69E+03
3.67E+02
2.68E-0 1
1.6 1E+00
2.07E+O 1
1 .O 1E+03
7.5 9E-03
1.60E-08
<0.05
<0.05
<0.05
<0.05
<0.05
<0.05
0.06
<0.05
<0.05
33.8
2.2
48.7
<0.05
<0.05
0.09
<0.05
<0.05
<0.05
<0.05
<0.05
<0.05
<0.05
<0.05
8.1
1.8
<0.05
<0.05
0.10
4.8
<0.05
<0.05
3 -4
4.98E-09
7.86E-03
1.23E+03
1.06E-09
2.95E-02
1.97E+O 1
4.86E+O 1
2.76E- 12
4.15E-04
7.04E+03
7.66E+02
2.29E+04
3.06E+00
2.5 OE+OO
2.90E+O 1
1.88E-03
4.25E+00
2.5 7E+00
2.23E+00
1.95E+02
1.32E+01
2.29E-05
4.20E-03
3.7 1 E+03
5.64E+03
6.39E-0 1
3.65E+00
8.02E+01
5.98E+03
3.75E-02
7.89E-08

Table 3-3. (continued).
Best Estimate Percent of Total Radionuclide (Ci) ("/.I Upper Bound
Pb-2 10
PU-23 8
PU-239
PU-240
PU-24 1
PU-242
Ra-226
Ra-228
RU- 106
Sb-124
Sb-125
Sn-113
Sn- 1 17m
Sr-89
Sr-90
Ta- 182
TC-99
Te-132
Th-228
Th-229
Th-230
Th-232
U-232
U-233
U-234
U-235
U-236
U-23 8
Y-90
Zr-95
Total
3.76E- 12
2.04E-02
3.60E-02
2.75E-02
1.45E+00
1.03E-09
1.29E- 10
1.47E- 15
3.45E+00
1.21E-03
7.74E-0 1
2.86E-02
1.70E-09
8.68E+00
1,80E+O 1
9.24E-02
2.64E-03
6.7 1E- 17
1.66E-06
3.46E-10
2.02E-07
2.02E- 14
4.70E-06
5.69E-04
1.69E-03
3.18E-03
O.OOE+OO
1.66E-03
1.79E+O 1
3.34E+00
2.08E+04
<0.05
<0.05
<0.05
<0.05
<0.05
<0.05
<0.05
<0.05
<0.05
<0.05
<0.05
<0.05
<0.05
<0.05
0.09
<0.05
<0.05
<0.05
<0.05
<0.05
<0.05
<0.05
<0.05
<0.05
<0.05
<0.05
<0.05
<0.05
0.09
<0.05
100.0
5.72E- 12
1 .OOE-0 1
1.78E-01
l.llE+OO
4.16E+03
5.06E-09
1.97E- 10
2.25E-15
1.62E+O 1
6.04E-03
3.18E+00
1.4 1E-0 1
8.49E-09
5.14E+01
1.03E+02
2.03E-0 1
4.15E-03
1.03E- 16
8.18E-06
1.7 1E-09
9.98E-07
9.99E- 14
2.3 OE-05
2.8 1E-03
8.34E-03
1.57E-02
O.OOE+OO
8.2 1E-03
1.06E+02
1.67E+O 1
-
3 -5

3.3.2 Rad iolog ical Contaminants
The overall results for the revised IWTS database using the scaling factors are listed by category in Table 3-4. The total-radioactivity best estimate for the period from 1994 to 1999 is approximately 13,000 Ci. The ATR reactor core parts compose the bulk of the activity with Fe-55 and Co-60 being the major contributors. The source of the radioactivity of the NPR targets, which are made of lithium, is almost entirely tritium.
Table 3-4. Summary of data by waste stream from the Integrated Waste Tracking System database.
Gross Best-Estimate Upper-Bound Gross Weight Volume IWTS Activity Activity Activity”
Waste Stream (g) (m’) (Ci) (Ci) (Ci)
Resins 188,45 1,000 181.3 692.8 823.3 1,345.6
Noncompactible waste 95,526,000 326.9 5.0 5.4 6.3
ATR reactor core parts 1,263,000 5.3 8,097.6 8,108.4 27,596. I
Hot cell waste 6,150,000 20.1 147.9 147.9 147.9
NPR targets 249,000 0.9 4,173.0 4,173.0 8,346.0
Sludge 3,552,000 5.4 0.00062 0.00062 0.00062
Portland cemented waste 279,000 0.5 0.0059 0.0059 0.0059
Totals 295,470,000 540.4 13,116.3 13,258.0 37,44 1.9 ATR = Advanced Test Reactor IWTS = Integrated Waste Tracking System NPR = New Production Reactor a. The values shown include totals of miscellaneous radionuclides
The total nuclide activities sent to RWMC by year from 1994 to 1999 are listed in Table 3-5. The large amount of activity in 1995 is caused by ATR reactor core parts from the 1994 core changeout. The high activity level in 1997 is from the NPR-irradiated target material (TRISO targets).
Revised estimates of radioactivity were calculated for the resins and the noncompactible waste, using Tables 2-7 and 2-8. Cobalt-60 data were available in all cases. In the rare instances when Cs-137 data were missing, Cs-137 was calculated from the Cs-137/C0-60 scaling factor. The Pu-239 values had to be calculated from the Pu-239/C0-60 scaling factor nearly all the time. However, the contribution of the TRU waste to the overall radioactivity of a waste stream was relatively insignificant in all cases. The core-parts activities were reassessed, as described above, to include long-lived radionuclides that were not in the original activity assessments.
Upper-bound activity was calculated, in accordance with the RPDT (LMITCO 1995a, Section 5). Upper bounds were calculated using the scaling data in Tables 2-7 and 2-8 for the radionuclides listed for the resins and noncompactible waste. When a data value was missing, the upper-bound scaling factor was used to calculate one. When a data value was listed, multiplying the data value by one and adding the relative standard deviation, increased the data value.
3 -6

Table 3-5. Summary of data by year from the Integrated Waste Tracking System database.
Best-Estimate Upper-Bound Gross Weight Gross Volume IWTS Activity Activity Activity”
1994 104,273,000 196.1 3 17.0 434.8 599.2
1995 67,695,000 139.8 8,225.7 8,238.3 27,940.4
1996 18,471,000 24.4 105.2 105.4 154.2
1997 45,956,000 35.0 4,232.0 4,235.8 8,442.2
1998 42,175,000 100.6 103.3 104.5 136.9
1999 16,900,000 44.5 133.1 139.2 169.0
Totals 295,470,000 540.4 13,116.3 13,258.0 37,44 1.9
Year (g) (m’) (Ci) (Ci) (Ci)
IWTS = Integrated Waste Tracking System a. The values shown include totals of miscellaneous radionuclides.
An upper-bound value for the core parts was determined by using the methods in the RPDT (LMITCO 1995a, Section 5.4.5). An upper-bound value was calculated for radionuclides with associated entries for each of the seven shipments by using Equation (5-15) in the RPDT (LMITCO 1995a, Section 5.4.5). This equation calculates a two-sigma value for the upper-bound activity, which can be seen in Table 3-5, and is substantially larger than the best-estimate value. However, nearly 90% of the curie activity is from Fe-55 (half-life = 3 years) and Zn-65 (half-life = 244 days) so that consequences of long-term storage are minimal.
The NPR targets also show a large upper-bound estimate consisting almost entirely of tritium. The estimate is based on the same upper-bound estimate for tritium in the beryllium reflectors in the ATR reactor core (Einerson 1995, p. 22). The bounds are given as +loo% and -50%. Therefore, the upper-bound estimate is double the best-estimate value.
Because of the unknown nature of the hot cell waste, and the insignificant amount of activity in the sludge and Portland cemented waste, upper-bound estimates were not calculated, except as described below.
A relative standard deviation of five was assumed and applied to the totals for all years for all miscellaneous radionuclides not listed in Tables 2-7 and 2-8, or otherwise updated as suggested in the RPDT (LMITCO 1995a, Section 5.4.3). The upper-bound totals in Tables 3-3 and 3-4 do not include these additions.
The revised radionuclide inventory is listed for waste shipped to the RWMC from TRA from 1994 to 1999 in Tables 3-5 and 3-6. Nearly all of the Fe-55 and Zn-55 activity is attributable to reactor parts shipped in 1994 and 1995, and the H-3 activity comes from the NPR irradiated target material @e., lithium), as it is described in the IWTS database. Other contributors such as the activation products Co-58, Co-60, Ni-63, Cr-5 1, and Mn-54, and the fission product Cs-137 are what generally would be expected based on the nature of the reactor operations that generated the waste. The unusually high Ir-192 and europium activities are the result of operations in the hot cells. The inventory is listed in alphabetical order in Table 3-7.
3 -7
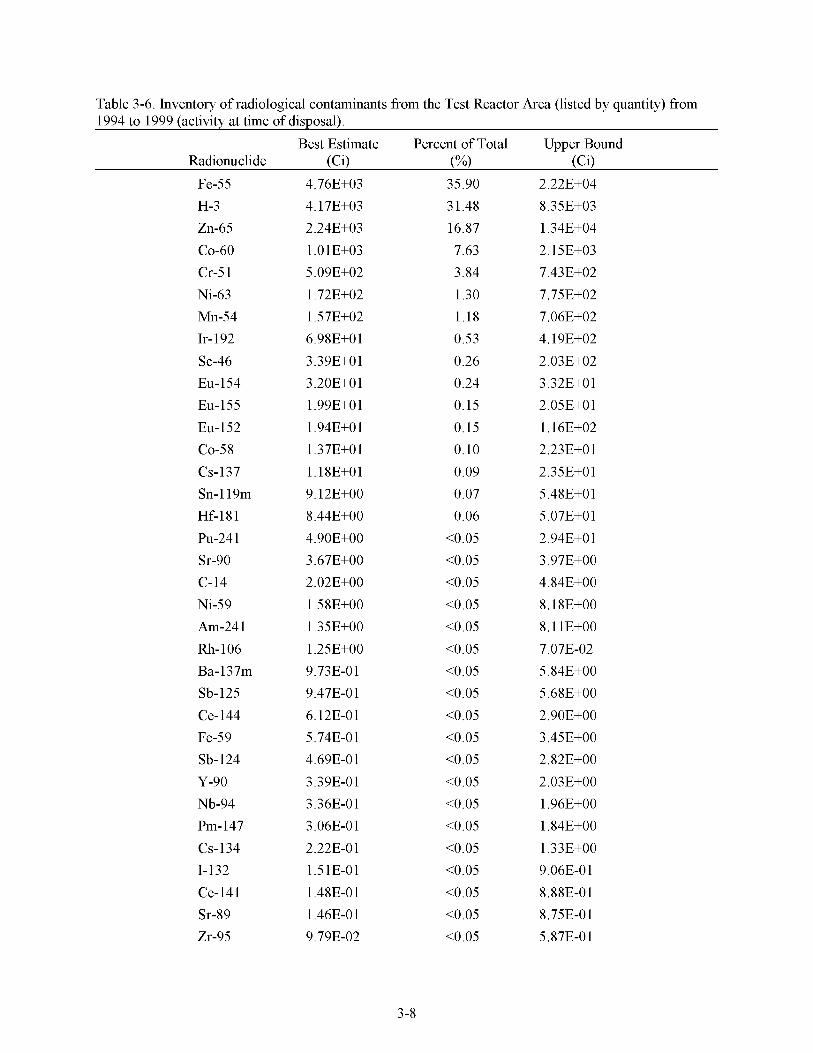
Table 3-6. Inventory of radiological contaminants from the Test Reactor Area (listed by quantity) from 1994 to 1999 (activity at time of disposal).
Best Estimate Percent of Total Upper Bound Radionuclide (Ci) ("/.I (Ci)
Fe-55 H-3 Zn-65 CO-60 Cr-5 1 Ni-63 Mn-54 Ir- 192 SC-46 EU-154 EU-155 EU-152 CO-5 8 CS-137 Sn- 1 19m Hf-181 PU-24 1 Sr-90 C-14 Ni-59 Am-24 1 Rh- 106 Ba-137m Sb-125 Ce-144 Fe-59 Sb-124 Y-90 Nb-94 Pm-147 CS-134 1-132 Ce-141 Sr-89 Zr-95
4.76E+03 4.17E+03 2.24E+03 1 .O 1E+03 5.09E+02 1.72E+02 1.57E+02 6.98E+O 1 3.3 9E+O 1 3.20E+O 1 1.99E+O 1 1.94E+O 1 1.37E+O 1 l.l8E+O 1 9.12E+00 8.44E+00 4.90E+00 3.67E+00 2.02E+00 1.58E+00 1.35E+00 1.25E+00 9.73E-0 1 9.47E-01 6.12E-01 5.74E-0 1 4.69E-0 1 3.3 9E-0 1 3.3 6E-0 1 3.06E-0 1 2.22E-01 1.5 1E-0 1 1.48E-0 1 1.46E-0 1 9.79E-02
35.90 3 1.48 16.87 7.63 3.84 1.30 1.18 0.53 0.26 0.24 0.15 0.15 0.10 0.09 0.07 0.06
<0.05 <0.05 <0.05 <0.05 <0.05 <0.05 <0.05 <0.05 <0.05 <0.05 <0.05 <0.05 <0.05 <0.05 <0.05 <0.05 <0.05 <0.05 <0.05
2.22E+04 8.35E+03 1.34E+04 2.15E+03 7.43E+02 7,75E+02 7.06E+02 4.19E+02 2,03E+02 3.32E+O1 2.05E+O 1 1,16E+02 2.23E+01 2.3 5E+O 1 5.48E+O 1 5.07E+O 1 2.94E+O1 3.97E+00 4.84E+00 8.18E+00 8.11E+00 7.07E-02 5.84E+00 5.68E+00 2.90E+00 3.45E+00 2.82E+00 2.03E+00 1.96E+00 1.84E+00 1.33E+00 9.06E-0 1 8.88E-0 1 8.75E-0 1 5.87E-0 1
3-8

Table 3 -6. (continued).
Best Estimate Percent of Total Upper Bound Radionuclide (Ci) ("/.I (Ci)
Cm-242 Gd-153 Nb-95 1-131 PU-23 8 La-140 Ba-140 Cm-244 Hf- 175 Rh- 105 Se-75 Sb-122 MO-99 Ag-108m Na-24 PU-239 Rh-103m CO-57 RU- 103 Th-232 PU-240 W-187 Ag-110 Ta- 182 MO-93 TC-99 U-234 Np-237 Kr-85 1-129 U-236 Pa-234m Sn-121m Sn-113 U-23 8 Th-234
9.06E-02 8.74E-02 7.3 1E-02 5.96E-02 5.89E-02 5.75E-02 4.54E-02 4.25E-02 4.13E-02 4.04E-02 2.9 1E-02 2.80E-02 2.16E-02 1.79E-02 1.64E-02 1.50E-02 1.30E-02 1.00E-02 9.7 1 E-03 8.17E-03 8.16E-03 6.06E-03 5.27E-03 3.63E-03 3.42E-03 3.3 6E-03 1.40E-03 8.49E-04 8.90E-04 6.85E-04 5.24E-04 4.86E-04 3.16E-04 7.14E-05 7.07E-05 3.76E-05
<0.05 <0.05 <0.05 <0.05 <0.05 <0.05 <0.05 <0.05 <0.05 <0.05 <0.05 <0.05 <0.05 <0.05 <0.05 <0.05 <0.05 <0.05 <0.05 <0.05 <0.05 <0.05 <0.05 <0.05 <0.05 <0.05 <0.05 <0.05 <0.05 <0.05 <0.05 <0.05 <0.05 <0.05 <0.05 <0.05
5.43E-0 1 5.24E-0 1 4.3 8E-0 1 3.58E-0 1 3.54E-01 3.45E-0 1 2.72E-0 1 2.54E-0 1 2.48E-01 7.74E+00 1.74E-0 1 1.68E-01 1.30E-0 1 1.08E-01 9.86E-02 7.84E-02 7.78E-02 6.02E-02 O.OOE+OO 8.17E-03 4.86E-02 3.64E-02 3.16E-02 2.18E-02 2.05E-02 2.0 1E-02 1.40E-03 7.3 1E-03 5.34E-03 4.11E-03 5.24E-04 2.92E-03 1.90E-03 4.28E-04 7.07E-05 3.76E-05
3 -9

Table 3 -6. (continued).
Best Estimate Percent of Total Upper Bound Radionuclide (Ci) ("/.I (Ci)
U-235 3.15E-05 <0.05 3.15E-05 In-l13m 2.17E-05 <0.05 1.30E-04 RU- 106 5.72E-06 <0.05 3.43E-05 Th-230 5.20E-06 <0.05 5.20E-06 C1-36 2.95E-06 <0.05 1.77E-05 Zr-93 2.63E-06 <0.05 1.58E-05 Nb-93m 2.34E-06 <0.05 1.40E-05 OS- 194 1.55E-06 <0.05 9.3 OE-06 U-233 1.24E-07 <0.05 1.24E-07 Th-228 1.13E-07 <0.05 1.13E-07 1-124 3.1 OE-08 <0.05 1.86E-07 Ba-133 7.08E-09 <0.05 4.25E-08 K-40 5.00E-09 <0.05 3.00E-08 Po-2 10 1.14E-11 <0.05 6.82E-11 Totals 13258.4186 100.00 49359.56402
3-10

Table 3-7. Inventory of radiological contaminants from the Test Reactor Area (listed alphabetically) for the years 1994 to 1999 (activity at time of disposal).
Best Estimate Percent of Total Upper Bound Radionuclide (Ci) ("/.I (Ci)
Ag-108m
Ag-110
Am-24 1
Ba-133
Ba-137m
Ba-140
C-14
Ce-141
Ce-144
C1-36
Cm-242
Cm-244
CO-57
CO-5 8
CO-60
Cr-5 1
CS-134
CS-137
EU-152
EU-154
EU-155
Fe-55
Fe-59
Gd-153
H-3
Hf- 175
Hf-181
1-124
1-129
1-131
1-132
1.79E-02
5.27E-03
1.35E+00
7.08E-09
9.73E-0 1
4.54E-02
2.02E+00
1.48E-0 1
6.12E-01
2.95E-06
9.06E-02
4.25E-02
1.00E-02
1.37E+O 1
1 .O 1E+03
5.09E+02
2.22E-01
l.l8E+O 1
1.94E+O 1
3.20E+O 1
1.99E+O 1
4.76E+03
5.74E-0 1
8.74E-02
4.17E+03
4.13E-02
8.44E+00
3.1 OE-08
6.85E-04
5.96E-02
1.5 1E-0 1
<0.05
<0.05
<0.05
<0.05
<0.05
<0.05
<0.05
<0.05
<0.05
<0.05
<0.05
<0.05
<0.05
0.10
7.63
3.84
<0.05
0.09
0.15
0.24
0.15
35.90
<0.05
<0.05
3 1.48
<0.05
0.06
<0.05
<0.05
<0.05
<0.05
1.08E-01
3.16E-02
8.11E+00
4.25E-08
5.84E+00
2.72E-0 1
4.84E+00
8.88E-0 1
2.90E+00
1.77E-05
5.43E-0 1
2.54E-0 1
6.02E-02
2.23E+01
2.15E+03
7.43E+02
1.33E+00
2.3 5E+O 1
1,16E+02
3.32E+O1
2.05E+O 1
2.22E+04
3.45E+00
5.24E-0 1
8.35E+03
2.48E-01
5.07E+O 1
1.86E-07
4.11E-03
3.58E-0 1
9.06E-0 1
3-1 1

Table 3 -7. (continued).
Best Estimate Percent of Total Upper Bound Radionuclide (Ci) ("/.I (Ci)
In-l13m
Ir- 192
K-40
Kr-85
La-140
Mn-54
MO-93
MO-99
Na-24
Nb-93m
Nb-94
Nb-95
Ni-59
Ni-63
Np-237
OS- 194
Pa-234m
Pm-147
Po-2 10
PU-23 8
PU-239
PU-240
PU-24 1
Rh-103m
Rh- 105
Rh- 106
RU- 103
RU- 106
Sb-122
Sb-124
Sb-125
SC-46
2.17E-05
6.98E+O 1
5.00E-09
8.90E-04
5.75E-02
1.57E+02
3.42E-03
2.16E-02
1.64E-02
2.34E-06
3.3 6E-0 1
7.3 1E-02
1.58E+00
1.72E+02
8.98E-04
1.55E-06
4.86E-04
3.06E-0 1
1.14E-11
5.89E-02
1.50E-02
8.16E-03
4.90E+00
1.30E-02
4.04E-02
1.25E+00
9.7 1 E-03
5.72E-06
2.80E-02
4.69E-0 1
9.47E-01
3.3 9E+O 1
<0.05
0.53
<0.05
<0.05
<0.05
1.18
<0.05
<0.05
<0.05
<0.05
<0.05
<0.05
<0.05
1.30
<0.05
<0.05
<0.05
<0.05
<0.05
<0.05
<0.05
<0.05
<0.05
<0.05
<0.05
<0.05
<0.05
<0.05
<0.05
<0.05
<0.05
0.26
1.30E-04
4.19E+02
3.00E-08
5.34E-03
3.45E-0 1
7.06E+02
2.05E-02
1.30E-0 1
9.86E-02
1.40E-05
1.96E+00
4.3 8E-0 1
8.18E+00
7,75E+02
7.3 1E-03
9.3 OE-06
2.92E-03
1.84E+00
6.82E-11
3.54E-01
7.84E-02
4.86E-02
2.94E+O1
7.78E-02
7.74E+00
7.07E-02
O.OOE+OO
3.43E-05
1.68E-01
2.82E+00
5.68E+00
2,03E+02
3-12

Table 3 -7. (continued).
Best Estimate Percent of Total Upper Bound Radionuclide (Ci) ("/.I (Ci)
Se-75 2.9 1E-02 <0.05 1.74E-0 1
Sn-113 7.14E-05 <0.05 4.28E-04
Sn- 1 19m 9.12E+00 0.07 5.48E+O 1
Sn-121m 3.16E-04 <0.05 1.90E-03
Sr-89 1.46E-0 1 <0.05 8.75E-0 1
Sr-90 3.67E+00 <0.05 3.97E+00
Ta- 182 3.63E-03 <0.05 2.18E-02
TC-99 3.3 6E-03 <0.05 2.0 1E-02
Th-228 1.13E-07 <0.05 1.13E-07
Th-230 5.20E-06 <0.05 5.20E-06
Th-232 8.17E-03 <0.05 8.17E-03
Th-234 3.76E-05 <0.05 3.76E-05
U-233 1.24E-07 <0.05 1.24E-07
U-234 1.40E-03 <0.05 1.40E-03
U-235 3.15E-05 <0.05 3.15E-05
U-236 5.24E-04 <0.05 5.24E-04
U-23 8 7.07E-05 <0.05 7.07E-05
W-187 6.06E-03 <0.05 3.64E-02
Y-90 3.3 9E-0 1 <0.05 2.03E+00
Zn-65 2.24E+03 16.87 1.34E+04
Zr-93 2.63E-06 <0.05 1.58E-05
Zr-95 9.79E-02 <0.05 5.87E-0 1
Total 13258.4194 100.00 49359.56402
3-13

3.4 Test Area North
3.4.1 Nonradiological Contaminants
As anticipated, no nonradiological contaminants were shipped from TAN to the RWMC during the 1994 to 1999 timeframe.
3.4.2 Rad iolog ical Contaminants
The inventory of radiological contaminants in waste from TAN are listed in Tables 3-8 and 3-9
The best estimate for the total quantity of radioactive material shipped from TAN to the SDA from 1994 through 1999 is approximately Ci-558. The majority of the activity listed is Fe-55, followed by Co-60 and H-3.
Table 3-8. Inventory of radionuclide contaminants from Test Area North (listed by quantity) for the years 1994 to 1999 (activity at time of disposal).
Best Estimate Percent of Total Upper Bound Radionuclide (Ci) (%) (Ci)
Fe-55
CO-60
H-3
CO-5 8
Ni-63
Sr-90
Cr-5 1
Cs137
U-234
U-23 8
Mn-54
Ba-137m
Ni-59
Am-24 1
Ce-144
Ag- 1 1 Om
Sb-125
PU-24 1
U-235
PU-240
EU-154
2.20E+02
1.59E+02
8.72E+O1
2.47E+01
2.43E+01
2.OOE+O 1
1.16E+O 1
6.23E+00
1.89E+00
7.87E-0 1
4.08E-0 1
3 .O 1E-0 1
2.71E-01
2.30E-0 1
2.24E-01
1.68E-01
1.52E-01
5.54E-02
4.85E-02
3.99E-02
3.83E-02
39.48
28.46
15.63
4.43
4.35
3.58
2.08
1.12
0.34
0.14
0.07
0.05
0.05
<0.05
<0.05
<0.05
<0.05
<0.05
<0.05
<0.05
<0.05
4.4 1 E+02
3.18E+02
5.23E+02
1.48E+02
4.86E+O 1
1.20E+02
6.97E+O 1
1.25E+O 1
1.89E+00
7.87E-0 1
2.45E+00
1.80E+O0
1.62E+00
1.38E+00
1.35E+00
1 .O 1E+00
9.12E-01
3.32E-01
4.85E-02
2.39E-0 1
2.30E-0 1
3-14

Table 3-8. (continued).
Best Estimate Percent of Total Upper Bound Radionuclide (Ci) ("/.I (Ci) PU-23 8 3.82E-02 <0.05 2.29E-01
Y-90 3.25E-02 <0.05 1.95E-01
Cm-242 3.02E-02 <0.05 1.8 1E-0 1
PU-239 2.89E-02 <0.05 1.73E-01
CS-134 1.94E-02 <0.05 1.16E-0 1
Th-232 1.60E-02 <0.05 1.60E-02
Nb-94 1.3 1E-02 <0.05 7.89E-02
EU-152 1.23E-02 <0.05 7.3 8E-02
Th-228 7.5 5E-03 <0.05 7.5 5E-03
Ra-226 5.05E-03 <0.05 5.05E-03
RU- 106 3.6 1 E-03 <0.05 2.17E-02
Cm-244 3.29E-03 <0.05 1.97E-02
TC-99 2.66E-03 <0.05 1.60E-02
Th-230 2.3 6E-03 <0.05 2.3 6E-03
EU-155 1.62E-03 <0.05 9.70E-03
Th-234 1.52E-03 <0.05 1.52E-03
C-14 1.40E-03 <0.05 8.4 1E-03
Hf-181 3.79E-04 <0.05 2.27E-03
Ag-108m 2.59E-04 <0.05 1.55E-03
Zr-95 1.43E-04 <0.05 8.58E-04
K-40 4.2 1E-05 <0.05 2.53E-04
1-129 3.77E-05 <0.05 2.26E-04
Zn-65 3.17E-05 <0.05 1.90E-04
U-236 3.12E-06 <0.05 3.12E-06
Pm-147 4.60E- 14 <0.05 2.76E-13
Totals 5.58E+02 100.00 1.70E+03
3-15

Table 3-9. Radionuclide inventory (listed alphabetically) from Test Area North for the years 1994 to 1999 (activity at time of disposal).
Best Estimate Percent of Total Upper Bound Radionuclide (Ci) ("/.I (Ci) Ag-108m
Ag- 1 1 Om
Am-24 1
Ba-137m
C-14
Ce-144
Cm-242
Cm-244
CO-5 8
CO-60
Cr-5 1
CS-134
CS-137
EU-152
EU-154
EU-155
Fe-55
H-3
Hf-181
1-129
K-40
Mn-54
Nb-94
Ni-59
Ni-63
Pm-147
PU-23 8
PU-239
PU-240
PU-24 1
Ra-226
2.59E-04
1.68E-01
2.30E-0 1
3 .O 1E-0 1
1.40E-03
2.24E-01
3.02E-02
3.29E-03
2.47E+01
1.59E+02
1.16E+O 1
1.94E-02
6.23E+00
1.23E-02
3.83E-02
1.62E-03
2.20E+02
8.72E+O1
3.79E-04
3.77E-05
4.2 1E-05
4.08E-0 1
1.3 1E-02
2.71E-01
2.43E+01
4.60E- 14
3.82E-02
2.89E-02
3.99E-02
5.54E-02
5.05E-03
<0.05
<0.05
<0.05
0.05
<0.05
<0.05
<0.05
<0.05
4.43
28.46
2.08
<0.05
1.12
<0.05
<0.05
<0.05
39.48
15.63
<0.05
<0.05
<0.05
0.07
<0.05
0.05
4.35
<0.05
<0.05
<0.05
<0.05
<0.05
<0.05
3-16
1.55E-03
1 .O 1E+00
1.38E+00
1.80E+O0
8.4 1E-03
1.35E+00
1.8 1E-0 1
1.97E-02
1.48E+02
3.18E+02
6.97E+O 1
1.16E-0 1
1.25E+O 1
7.3 8E-02
2.30E-0 1
9.70E-03
4.4 1 E+02
5.23E+02
2.27E-03
2.26E-04
2.53E-04
2.45E+00
7.89E-02
1.62E+00
4.86E+O 1
2.76E-13
2.29E-01
1.73E-01
2.39E-0 1
3.32E-01
5.05E-03

Table 3 -9. (continued).
Best Estimate Percent of Total Upper Bound Radionuclide (Ci) ("/.I (Ci) RU- 106 3.6 1 E-03 <0.05 2.17E-02
Sb-125 1.52E-01 <0.05 9.12E-01
Sr-90 2.OOE+O 1 3.58 1.20E+02
TC-99 2.66E-03 <0.05 1.60E-02
Th-228 7.5 5E-03 <0.05 7.5 5E-03
Th-230 2.3 6E-03 <0.05 2.3 6E-03
Th-232 1.60E-02 <0.05 1.60E-02
Th-234 1.52E-03 <0.05 1.52E-03
U-234 1.89E+00 0.34 1.89E+00
U-235 4.85E-02 <0.05 4.85E-02
U-236 3.12E-06 <0.05 3.12E-06
U-23 8 7.87E-0 1 0.14 7.87E-0 1
Y-90 3.25E-02 <0.05 1.95E-01
Zn-65 3.17E-05 <0.05 1.90E-04
Zr-95 1.43E-04 <0.05 8.58E-04
Totals 5.58E+02 100.00 1.70E+03
3.5 Specific Manufacturing Capability
3.5.1 Nonradiological Contaminants
No nonradiological contaminants were shipped by SMC to the RWMC from 1994 to 1999. This was anticipated in the RPDT (LMITCO 1995a) for the 1994 to 2003 timeframe.
3.5.2 Rad iolog ical Contaminants
The activity totals are listed in Tables 3-10 and 3-1 1 for the various SMC waste streams and for each year waste was shipped. The greatest contributor to radionuclide activity is the unsolidified slag shipped in 1994 and 1995. The majority of the waste, by weight and volume, is the depleted uranium-contaminated waste made up of metals and general debris. The best-estimate activities for 1994 and 1995 are greatly increased over the activities listed in the IWTS database (see Table 3-1 1). This increase can be explained by the fact that, for those years, the only radionuclide listed was U-238. The activity was, therefore, increased substantially when the scaling factors were applied. In contrast, the IWTS database listed most of the concerned radionuclides for 1998 and 1999; therefore, little change resulted from applying scaling factors.
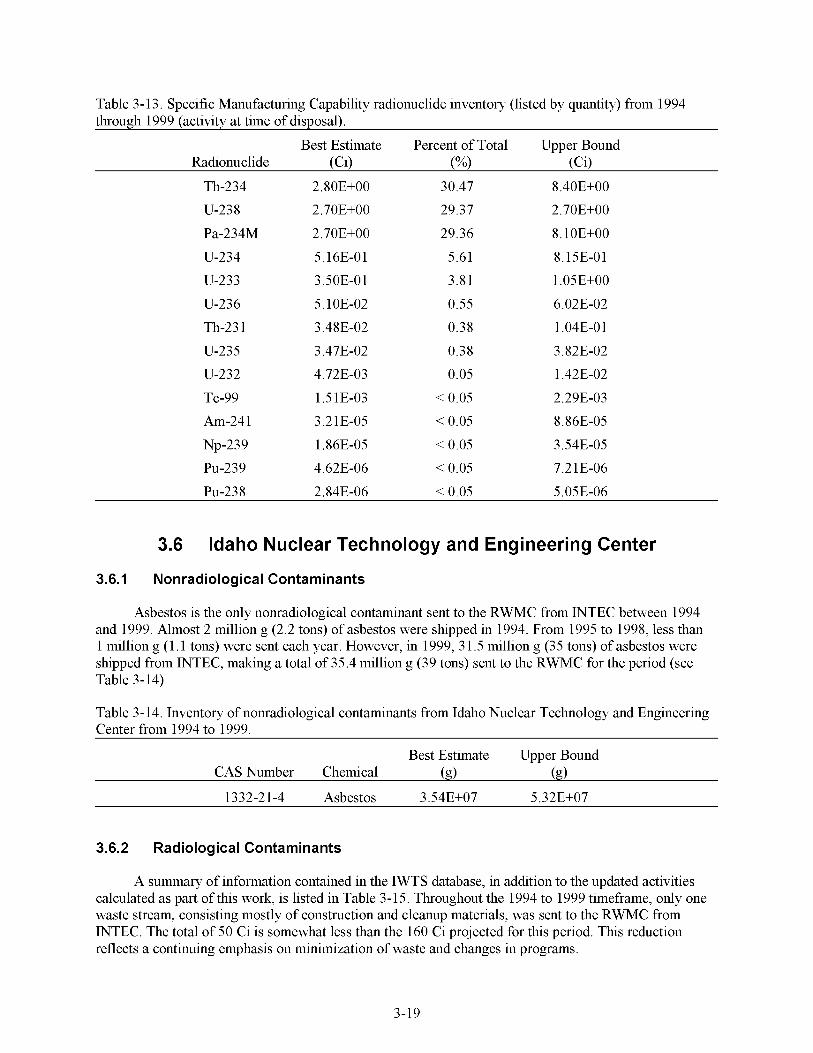
The total radionuclide inventory alphabetically and by quantity is listed in Tables 3-12 and 3-13. Ninety percent of the activity comes from U-238, Th-234, and Pa-234m, with the rest of the uranium and thorium nuclides making up the remaining bulk. The listed TRU waste contributes a negligible amount of activity.
3-17

Table 3-10. Summary of Specific Manufacturing Capability data by waste category.
Gross Weight
Waste Stream (g) Nonacidic evaporator sludge 1 1,464,000 Unsolidified slag 21,454,000 Depleted uranium 393,612,639 contaminated material Sand blast grit 4,784,038 Totals 43 1.3 14.677
Gross Volume
14.5 12.0
762.7
(m')
2.9 792.2
IWTS Activity
(Ci) 0.17 2.3 1 0.72
0.01 3.21
Upper- Best-Estimate Bound
Activity Activity
0.57 1.33 7.80 17.99 0.82 1.96
(Ci) (Ci)
0.01 0.02 9.19 21.29
Table 3-1 1. Summary of Specific Manufacturing Capability waste shipments by year.
Upper-Bound Gross Weight Gross Volume IWTS Activity Best-Estimate Activity Activity
Year (g) (m') (Ci) (Ci) (Ci) 1994 33,770,000 34.1 1.99 6.71 15.47 1995 4,843,000 5.1 0.52 1.77 4.07 1998 249,712,125 494.8 0.53 0.55 1.33 1999 142,989,552 258.1 0.17 0.18 0.41 Totals 43 1.3 14.677 792.2 3.21 9.19 21.29
Table 3- 12. Specific Manufacturing Capability radionuclide inventory (listed alphabetically) from 1994 through 1999 (activity at time of disposal).
Best Estimate Percent of Total Upper Bound Radionuclide (Ci) ("/.I (Ci) Am-24 1 3.21E-05 < 0.05 8.86E-05 Np-239 1.86E-05 < 0.05 3.54E-05 Pa-234m 2.70E+00 29.36 8.1 OE+OO PU-23 8 2.84E-06 < 0.05 5.05E-06 PU-239 4.62E-06 < 0.05 7.2 1E-06 TC-99 1.5 1E-03 < 0.05 2.29E-03 Th-23 1 3.48E-02 0.38 1.04E-0 1 Th-234 2.80E+00 30.47 8.40E+00 U-232 4.72E-03 0.05 1.42E-02 U-233 3.5 OE-0 1 3.81 1.05E+00 U-234 5.16E-0 1 5.61 8.15E-0 I U-235 3.47E-02 0.38 3.82E-02 Am-24 1 5.1 OE-02 0.55 6.02E-02 Np-239 2.70E+00 29.37 2.70E+00
3-18
Th-234
U-23 8
Pa-234M
U-234
U-233
U-236
Th-23 1
U-235
U-232
TC-99
Am-24 1
Np-239
PU-239
PU-23 8
2.80E+00
2.70E+00
2.70E+00
5.16E-0 1
3.5 OE-0 1
5.1 OE-02
3.48E-02
3.47E-02
4.72E-03
1.5 1E-03
3.21E-05
1.86E-05
4.62E-06
2.84E-06
30.47
29.37
29.36
5.61
3.81
0.55
0.38
0.38
0.05
< 0.05
< 0.05
< 0.05
< 0.05
< 0.05
Table 3- 13. Specific Manufacturing Capability radionuclide inventory (listed by quantity) from 1994 through 1999 (activity at time of disposal).
Best Estimate Percent of Total Upper Bound Radionuclide (Ci) ("/.I (Ci)
8.40E+00
2.70E+00
8.1 OE+OO
8.15E-0 1
1.05E+00
6.02E-02
1.04E-0 1
3.82E-02
1.42E-02
2.29E-03
8.86E-05
3.54E-05
7.2 1E-06
5.05E-06
3.6 Idaho Nuclear Technology and Eng
3.6.1 Nonradiological Contaminants
neering Center
Asbestos is the only nonradiological contaminant sent to the RWMC from INTEC between 1994 and 1999. Almost 2 million g (2.2 tons) of asbestos were shipped in 1994. From 1995 to 1998, less than 1 million g (1.1 tons) were sent each year. However, in 1999, 3 1.5 million g (35 tons) of asbestos were shipped from INTEC, making a total of 35.4 million g (39 tons) sent to the RWMC for the period (see Table 3-14).
Table 3 - 14. Inventory of nonradiological contaminants from Idaho Nuclear Technology and Engineering Center from 1994 to 1999.
Best Estimate Upper Bound CAS Number Chemical (g) (g)
1332-2 1-4 Asbestos 3.54E+07 5.32E+07
3.6.2 Rad iolog ical Contaminants
A summary of information contained in the IWTS database, in addition to the updated activities calculated as part of this work, is listed in Table 3-15. Throughout the 1994 to 1999 timeframe, only one waste stream, consisting mostly of construction and cleanup materials, was sent to the RWMC from INTEC. The total of 50 Ci is somewhat less than the 160 Ci projected for this period. This reduction reflects a continuing emphasis on minimization of waste and changes in programs.
3-19

Table 3-15. Year-by-year summary of waste shipments from the Idaho Nuclear Technology and Engineering Center to the Radioactive Waste Management Complex.
Integrated Waste Tracking System Upper-Bound
Gross Weight Gross Volume Activity Best-Estimate Activity Activity Year (g) (m') (Ci) (Ci) (Ci) 1994 77,483,800 127.2 2.5 2.6 9.5 1995 103,835,400 156.7 24.5 28.1 114.8 1996 74,521,500 145.0 4.8 5.0 18.4 1997 70,245,459 150.5 1.37 1.41 5.7 1998 153,439,413 726.7 8.6 8 .8 36.2 1999 414,578,437 975.7 4.0 4.1 21.6 Totals 894,104,009 228 1.7 45.7 50.0 206.2
The radiological inventory of waste from INTEC that was sent to RWMC during the period 1994 to 1999 is listed in Tables 3-16 and 3-17. The revised or best estimates of radioactivity were calculated using the data contained in Table 2-18. In several cases, Co-60 data were not listed; therefore, radionuclide curie values based on the Co-60 scaling factors could not be calculated. All shipments listed Cs-137 data. In most cases, Pu-239 data were not listed. In such cases, Pu-239 values were generated using the Pu-239/C0-60 scaling factor, when necessary.
Upper bounds were calculated in accordance with the RPDT (LMITCO 1995a, Section 5). The upper bounds for radionuclides not listed in Table 2- 18 were calculated assuming a relative standard deviation of 5, in accordance with the RPDT (LMITCO 1995a, Table 5-2).
Table 3- 16. Inventory of radiological contaminants from the Idaho Nuclear Technology and Engineering Center (listed by quantity) for the years 1994 to 1999 (activity at time of disposal).
Best Estimate Percent of Total Upper Bound Radionuclide (Ci) ("/.I (Ci)
Zr-95 Y-90 Ba-137m Ce-144 Fe-55 CO-60 Pm-147 Sb-125 Ni-63 CO-5 8 Am-24 1 U-234 PU-239
2.26E+01 1.05E+01 4.89E+00 2.87E+00 2.83E+00 1.35E+00 9.77E-0 1 8.50E-0 1 6.47E-01 5.5 OE-0 1 5.2 1E-0 1 4.90E-0 1 1.73E-01
45.28 21.00
9.79 5.74 5.66 2.71 1.96 1.70 1.30 1.10 1.04 0.98 0.35
4.52E+O 1 6.29E+01 2.93E+O 1 1.72E+O 1 1.70E+O 1 8.11E+00 5.86E+00 5.1 OE+OO 3.88E+00 3.3 OE+OO 3,12E+00 9.79E-0 1 3.46E-0 1
3-20
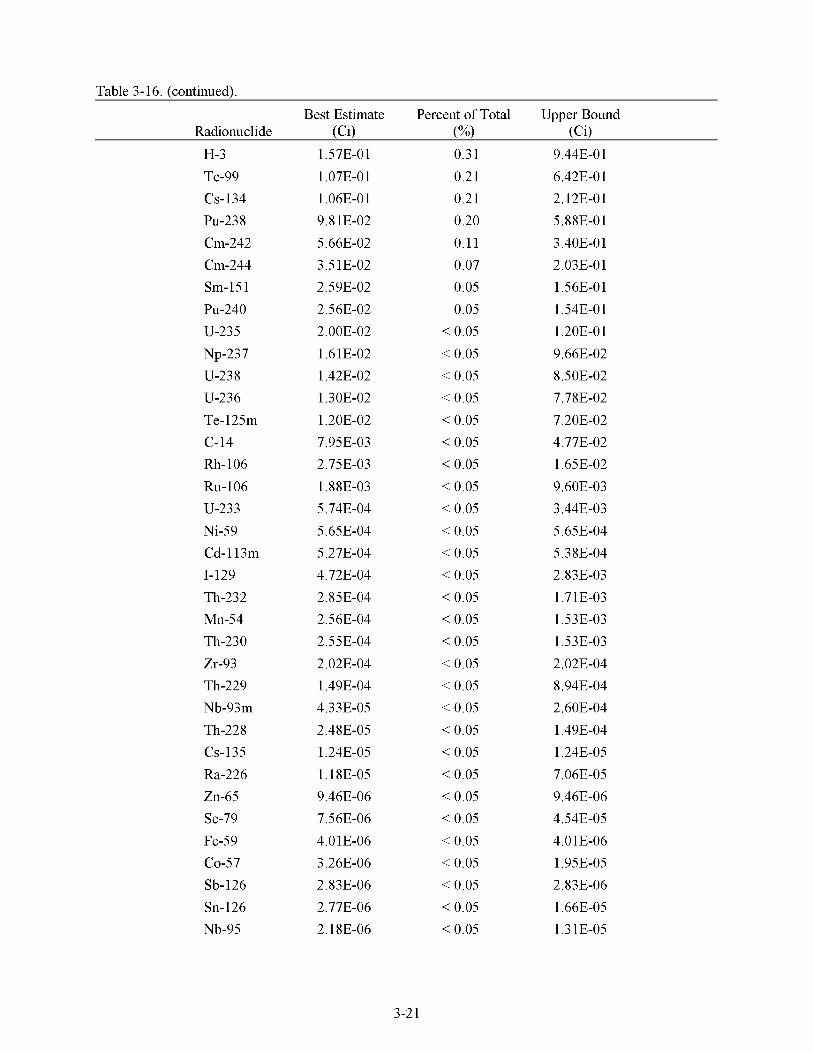
Table 3 - 16. (continued).
Best Estimate Percent of Total Upper Bound Radionuclide (Ci) ("/.I (Ci)
H-3 TC-99 CS-134 PU-23 8 Cm-242 Cm-244 Sm-151 PU-240 U-235 Np-237 U-23 8 U-236 Te-125m C-14 Rh- 106 RU- 106 U-233 Ni-59 Cd-l13m 1-129 Th-232 Mn-54 Th-230 Zr-93 Th-229 Nb-93m Th-228 CS-135 Ra-226 Zn-65 Se-79 Fe-59 CO-57 Sb-126 Sn-126 Nb-95
1.57E-0 1 1.07E-0 1 1.06E-0 1 9.8 1E-02 5.66E-02 3.5 1E-02 2.59E-02 2.56E-02 2.00E-02 1.6 1E-02 1.42E-02 1.30E-02 1.20E-02 7.95E-03 2.75E-03 1.88E-03 5.74E-04 5.65E-04 5.27E-04 4.72E-04 2.85E-04 2.56E-04 2.55E-04 2.02E-04 1.49E-04 4.3 3E-05 2.48E-05 1.24E-05 1.18E-05 9.46E-06 7.5 6E-06 4.0 1 E-06 3.26E-06 2.83E-06 2.77E-06 2.18E-06
0.3 1 0.21 0.21 0.20 0.11 0.07 0.05 0.05
< 0.05 < 0.05 < 0.05 < 0.05 < 0.05 < 0.05 < 0.05 < 0.05 < 0.05 < 0.05 < 0.05 < 0.05 < 0.05 < 0.05 < 0.05 < 0.05 < 0.05 < 0.05 < 0.05 < 0.05 < 0.05 < 0.05 < 0.05 < 0.05 < 0.05 < 0.05 < 0.05 < 0.05
9.44E-01 6.42E-01 2.12E-01 5.88E-0 1 3.40E-0 1 2.03E-0 1 1.56E-0 1 1.54E-01 1.20E-0 1 9.66E-02 8.50E-02 7.78E-02 7.20E-02 4.77E-02 1.65E-02 9.60E-03 3.44E-03 5.65E-04 5.38E-04 2.83E-03 1.7 1E-03 1.53E-03 1.53E-03 2.02E-04 8.94E-04 2.60E-04 1.49E-04 1.24E-05 7.06E-05 9.46E-06 4.54E-05 4.0 1 E-06 1.95E-05 2.83E-06 1.66E-05 1.3 1E-05
3-21

Table 3 - 16. (continued).
Best Estimate Percent of Total Upper Bound Radionuclide (Ci) ("/.I (Ci)
Cm-243 1.86E-06 < 0.05 1.11E-05
Ag- 1 1 Om 1.26E-06 < 0.05 7.5 5E-06 Sn-121m 1.1 OE-06 < 0.05 6.63E-06 Sm-147 1.09E-06 < 0.05 6.5 6E-06 Zr-95 1.02E-06 < 0.05 6.11E-06 Y-90 1.02E-06 < 0.05 6.11E-06 Ba-137m 3.54E-07 < 0.05 2.12E-06 Ce-144 3.47E-07 < 0.05 2.08E-06 Fe-55 3.3 7E-07 < 0.05 2.02E-06 CO-60 9.55E-08 < 0.05 5.73E-07 Pm-147 6.72E-13 < 0.05 4.03E- 12
Table 3-17. Inventory of radiological contaminants from INTEC (listed alphabetically) for the years 1994 to 1999 (activitv at time of disposal).
Best Estimate Percent of Total Upper Bound Radionuclide (Ci) ("/.I (Ci) Ag- 1 1 Om 3.3 7E-07 < 0.05 2.02E-06
Am-24 1 5.66E-02 0.11 3.40E-0 I
Ba-137m 5.5 OE-0 1 1.10 3.3 OE+OO
C-14 2.85E-04 < 0.05 1.7 1E-03
Cd-l13m 4.3 3E-05 < 0.05 2.60E-04
Ce-144 5.2 1E-0 1 1.04 3,12E+00
Cm-242 1.30E-02 < 0.05 7.78E-02
Cm-243 3.47E-07 < 0.05 2.08E-06
Cm-244 1.20E-02 < 0.05 7.20E-02
CO-57 1.09E-06 < 0.05 6.5 6E-06
CO-5 8 9.8 1E-02 0.20 5.88E-0 I
CO-60 1.73E-01 0.35 3.46E-0 I
CS-134 1.6 1E-02 < 0.05 9.66E-02
CS-135 2.77E-06 < 0.05 1.66E-05
CS-137 2.26E+01 45.28 4.52E+O 1
EU-152 4.89E+00 9.79 2.93E+O 1
EU-154 2.87E+00 5.74 1.72E+O 1
EU-155 9.77E-0 1 1.96 5.86E+00
3 -22

Table 3-17. (continued). Best Estimate Percent of Total Upper Bound
Radionuclide (Ci> (“w (Ci> Fe-55
Fe-59
H-3
1-129
Mn-54
Nb-93m
Nb-95
Ni-59
Ni-63
Np-237
Pm-147
Pr-144
PU-23 8
PU-239
PU-240
PU-24 1
Ra-226
Rh- 106
RU- 106
Sb-125
Sb-126
Se-79
Sm-147
Sm-151
Sn-121m
Sn-126
Sr-90
TC-99
Te-125m
Th-228
Th-229
Th-230
4.90E-0 1
1.1 OE-06
2.56E-02
2.48E-05
1.18E-05
3.26E-06
3.54E-07
1.49E-04
1.06E-0 1
5.74E-04
1.57E-0 1
1.35E+00
1.42E-02
2.59E-02
2.75E-03
2.83E+00
2.18E-06
2.56E-04
2.55E-04
1.07E-0 1
1.02E-06
1.26E-06
6.72E-13
7.95E-03
9.55E-08
1.02E-06
1.05E+01
2.00E-02
4.72E-04
2.83E-06
4.0 1 E-06
9.46E-06
0.98
< 0.05
0.05
< 0.05
< 0.05
< 0.05
< 0.05
< 0.05
0.21
< 0.05
0.3 1
2.71
< 0.05
0.05
< 0.05
5.66
< 0.05
< 0.05
< 0.05
0.21
< 0.05
< 0.05
< 0.05
< 0.05
< 0.05
< 0.05
21.00
< 0.05
< 0.05
< 0.05
< 0.05
< 0.05
3-23
9.79E-0 1
6.63E-06
1.54E-01
1.49E-04
7.06E-05
1.95E-05
2.12E-06
8.94E-04
2.12E-01
3.44E-03
9.44E-01
8.11E+00
8.50E-02
1.56E-0 1
1.65E-02
1,70E+O1
1.3 1E-05
1.53E-03
1.53E-03
6.42E-01
6.11E-06
7.5 5E-06
4.03E- 12
4.77E-02
5.73E-07
6.11E-06
6.29E+01
1.20E-0 1
2.83E-03
2.83E-06
4.0 1 E-06
9.46E-06

Table 3 - 17. (continued).
Best Estimate Percent of Total Upper Bound Radionuclide (Ci) ("/.I (Ci) Th-232 1.24E-05 < 0.05 1.24E-05
U-233 2.02E-04 < 0.05 2.02E-04
U-234 3.5 1E-02 0.07 2.03E-0 I
U-235 1.88E-03 < 0.05 9.60E-03
U-236 5.27E-04 < 0.05 5.38E-04
U-23 8 5.65E-04 < 0.05 5.65E-04
Y-90 6.47E-01 1.30 3.88E+00
Zn-65 1.86E-06 < 0.05 1.11E-05
Zr-93 7.5 6E-06 < 0.05 4.54E-05
Zr-95 8.50E-0 1 1.70 5.1 OE+OO
3.7 Naval Reactors Facility
Summary results of both nonradiological and radiological contaminants are discussed in the following paragraphs and presented in associated tables.
3.7.1 Nonradiological Contaminants
The inventory of nonradiological contaminants in the waste from NRF is listed in Table 3- 18. Asbestos was identified as the only nonradiological contaminant. An estimated total of 2.65 million g (3 tons) of asbestos was contained in the waste shipped from NRF. Asbestos is not classified as hazardous waste in accordance with RCRA; therefore, asbestos contaminated with radionuclides is still acceptable for burial at the SDA. The waste was generated primarily during facility maintenance and modification operations.
Table 3 - 1 8 . Inventory of nonradiological contaminants from Argonne National Laboratory-West (listed by quantity) for the years 1994 to 1999.
Best Estimate CAS Number Chemical (g) Upper Bound
1332-2 1-4 Asbestos 2.65E+06 5.3 OE+06
3.7.2 Rad iolog ical Contaminants
The inventory of radiological contaminants in the waste from NRF is listed in Tables 3-19 and 3-20.
The best estimate for the total quantity of radioactive material shipped from NRF to the SDA from 1994 through 1999 is approximately 88,900 Ci. The majority of the activity listed is Ni-63, followed by Co-60 and Fe-55.
3 -24
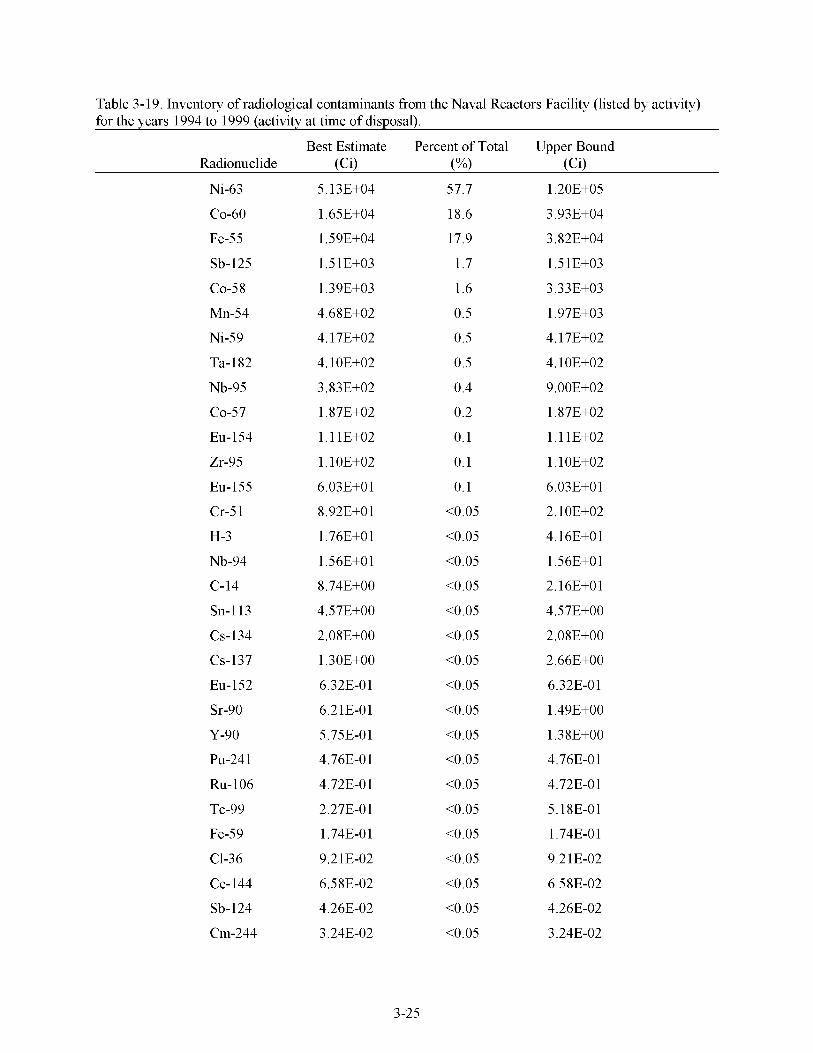
Table 3-19. Inventory of radiological contaminants from the Naval Reactors Facility (listed by activity) for the years 1994 to 1999 (activity at time of disposal).
Best Estimate Percent of Total Upper Bound Radionuclide (Ci) ("/.I (Ci)
Ni-63
CO-60
Fe-55
Sb-125
CO-5 8
Mn-54
Ni-59
Ta- 182
Nb-95
CO-57
EU-154
Zr-95
EU-155
Cr-5 1
H-3
Nb-94
C-14
Sn-113
CS-134
CS-137
EU-152
Sr-90
Y-90
PU-24 1
RU- 106
TC-99
Fe-59
C1-36
Ce-144
Sb-124
Cm-244
5.13E+04
1.65E+04
1.59E+04
1.5 1E+03
1.39E+03
4.68E+02
4.17E+02
4.10E+02
3.83E+02
1.87E+02
1,11E+02
1.1 OE+02
6.03E+O 1
8.92E+Ol
1.76E+O 1
1.56E+O 1
8.74E+00
4.5 7E+00
2.08E+00
1.30E+00
6.32E-0 1
6.2 1 E-0 1
5.75E-01
4.76E-0 1
4.72E-0 1
2.27E-01
1.74E-0 1
9.2 1 E-02
6.5 8E-02
4.26E-02
3.24E-02
57.7
18.6
17.9
1.7
1.6
0.5
0.5
0.5
0.4
0.2
0.1
0.1
0.1
<0.05
<0.05
<0.05
<0.05
<0.05
<0.05
<0.05
<0.05
<0.05
<0.05
<0.05
<0.05
<0.05
<0.05
<0.05
<0.05
<0.05
<0.05
1.20E+05
3.93E+04
3.82E+04
1.5 1E+03
3.3 3E+03
1.97E+03
4.17E+02
4.10E+02
9.00E+02
1.87E+02
1,11E+02
1.1 OE+02
6.03E+O 1
2.10E+02
4.16E+O1
1.56E+O 1
2.16E+O1
4.5 7E+00
2.08E+00
2.66E+00
6.32E-0 1
1.49E+00
1.38E+00
4.76E-0 1
4.72E-0 1
5.18E-01
1.74E-0 1
9.2 1 E-02
6.5 8E-02
4.26E-02
3.24E-02
3-25

Table 3 - 19. (continued).
Best Estimate Percent of Total Upper Bound Radionuclide (Ci) ("/.I (Ci)
Am-24 1
PU-23 8
Sr-89
PU-239
PU-240
1-129
Ag-110
Ba-140
U-235
U-23 8
U-234
Am-243
U-232
AC-227
1-131
La-140
Na-22
Np-237
Pa-23 1
Pb-2 10
PU-242
Ra-226
Ra-228
Te-132
Th-228
Th-229
Th-230
2.90E-02
2.80E-02
1.41E-02
8.62E-03
3.85E-03
9.05E-04
6.43E-04
2.70E-05
2.98E-06
1.82E-06
1.77E-06
1.44E-06
7.12E-07
O.OOE+OO
O.OOE+OO
O.OOE+OO
O.OOE+OO
O.OOE+OO
O.OOE+OO
O.OOE+OO
O.OOE+OO
O.OOE+OO
O.OOE+OO
O.OOE+OO
O.OOE+OO
O.OOE+OO
O.OOE+OO
<0.05
<0.05
<0.05
<0.05
<0.05
<0.05
<0.05
<0.05
<0.05
<0.05
<0.05
<0.05
<0.05
0.00
0.00
0.00
0.00
0.00
0.00
0.00
0.00
0.00
0.00
0.00
0.00
0.00
0.00
2.90E-02
2.80E-02
1.41E-02
8.62E-03
3.85E-03
3.29E-03
6.43E-04
2.70E-05
2.98E-06
1.19E-05
1.77E-06
1.44E-06
7.12E-07
O.OOE+OO
O.OOE+OO
O.OOE+OO
O.OOE+OO
O.OOE+OO
O.OOE+OO
O.OOE+OO
O.OOE+OO
O.OOE+OO
O.OOE+OO
O.OOE+OO
O.OOE+OO
O.OOE+OO
O.OOE+OO
Th-232 O.OOE+OO 0.00 O.OOE+OO
U-233 O.OOE+OO 0.00 O.OOE+OO
U-236 O.OOE+OO 0.00 O.OOE+OO
Sn- 1 17m O.OOE+OO 0.00 O.OOE+OO
Total 8.89E+04 99.8 -
3-26

Table 3-20. Inventory of radiological contaminants from the Naval Reactors Facility (listed alphabetically) for the years 1994 to 1999 (activity at time of disposal).
Best Estimate Percent of Total Radionuclide (Ci) ("/.I Upper Bound
AC-227
Ag-110
Am-24 1
Am-243
Ba-140
C-14
Ce-144
C1-36
Cm-244
CO-57
CO-5 8
CO-60
Cr-5 1
CS-134
CS-137
EU-152
EU-154
EU-155
Fe-55
Fe-59
H-3
1-129
1-131
La-140
Mn-54
Na-22
Nb-94
Nb-95
Ni-59
Ni-63
Np-237
O.OOE+OO
6.43E-04
2.90E-02
1.44E-06
2.70E-05
8.74E+00
6.5 8E-02
9.2 1 E-02
3.24E-02
1.87E+02
1.39E+03
1.65E+04
8.92E+Ol
2.08E+00
1.30E+00
6.32E-0 1
1,11E+02
6.03E+O 1
1.59E+04
1.74E-0 1
1.76E+O 1
9.05E-04
O.OOE+OO
O.OOE+OO
4.68E+02
O.OOE+OO
1.56E+O 1
3.83E+02
4.17E+02
5.13E+04
O.OOE+OO
0.00
< 0.05
< 0.05
< 0.05
< 0.05
< 0.05
< 0.05
< 0.05
< 0.05
0.2
1.6
18.6
< 0.05
< 0.05
< 0.05
< 0.05
0.1
0.1
17.9
< 0.05
< 0.05
< 0.05
0.00
0.00
0.5
0.00
< 0.05
0.4
0.5
57.7
0.00
O.OOE+OO
6.43E-04
2.90E-02
1.44E-06
2.70E-05
2.16E+O1
6.5 8E-02
9.2 1 E-02
3.24E-02
1.87E+02
3.3 3E+03
3.93E+04
2.10E+02
2.08E+00
2.66E+00
6.32E-0 1
1,11E+02
6.03E+O 1
3.82E+04
1.74E-0 1
4.16E+O1
3.29E-03
O.OOE+OO
O.OOE+OO
1.97E+03
O.OOE+OO
1.56E+O 1
9.00E+02
4.17E+02
1.20E+05
O.OOE+OO
3-27
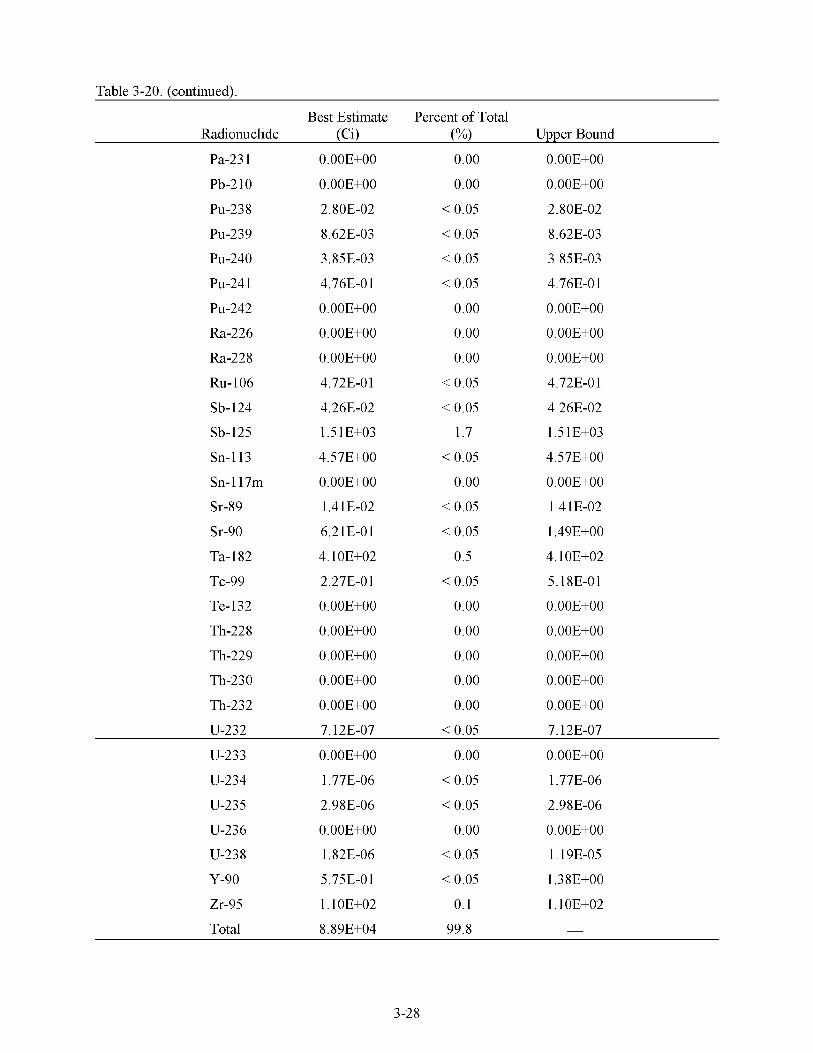
Table 3-20. (continued).
Best Estimate Percent of Total Radionuclide (Ci) ("/.I Upper Bound
Pa-23 1 O.OOE+OO 0.00 O.OOE+OO
Pb-2 10 O.OOE+OO 0.00 O.OOE+OO
PU-23 8 2.80E-02 < 0.05 2.80E-02
PU-239 8.62E-03 < 0.05 8.62E-03
PU-240 3.85E-03 < 0.05 3.85E-03
PU-24 1 4.76E-0 1 < 0.05 4.76E-0 1
PU-242 O.OOE+OO 0.00 O.OOE+OO
Ra-226 O.OOE+OO 0.00 O.OOE+OO
Ra-228 O.OOE+OO 0.00 O.OOE+OO
RU- 106 4.72E-0 1 < 0.05 4.72E-0 1
Sb-124 4.26E-02 < 0.05 4.26E-02
Sb-125 1.5 1E+03 1.7 1.5 1E+03
Sn-113 4.5 7E+00 < 0.05 4.5 7E+00
Sn- 1 17m
Sr-89
Sr-90
Ta- 182
TC-99
Te-132
Th-228
Th-229
Th-230
Th-232
U-232
O.OOE+OO
1.41E-02
6.2 1 E-0 1
4.10E+02
2.27E-01
O.OOE+OO
O.OOE+OO
O.OOE+OO
O.OOE+OO
O.OOE+OO
7.12E-07
0.00
< 0.05
< 0.05
0.5
< 0.05
0.00
0.00
0.00
0.00
0.00
< 0.05
O.OOE+OO
1.41E-02
1.49E+00
4.10E+02
5.18E-01
O.OOE+OO
O.OOE+OO
O.OOE+OO
O.OOE+OO
O.OOE+OO
7.12E-07
U-233
U-234
U-235
U-236
U-23 8
Y-90
Zr-95
Total
O.OOE+OO
1.77E-06
2.98E-06
O.OOE+OO
1.82E-06
5.75E-01
1.1 OE+02
8.89E+04
0.00
< 0.05
< 0.05
0.00
< 0.05
< 0.05
0.1
99.8
O.OOE+OO
1.77E-06
2.98E-06
O.OOE+OO
1.19E-05
1.38E+00
1.1 OE+02 -
3-28

3.8 Other Waste Generators
Other waste generators include the Auxiliary Reactor Area; the Central Facilities Area; Deactivation, Decontamination and Decommissioning; the Power Burst Facility; WAG 1 ; WAG 3; WAG 7; WERF; and the Waste Management Facility (WMF). Other waste generators are INEEL waste generators that contribute relatively insignificant quantities of waste for burial at the SDA.
3.8.1 Nonradiological Contaminants
Asbestos was the only nonradiological contaminant shipped to the SDA from the other waste generators. The total amount of asbestos generated from WERF and from D&D&D activities is 3,732,746 g (4 tons).
3.8.2 Rad iolog ical Contaminants
The inventory of radiological contaminants, by quantity, from the other waste generators for the years 1994 to 1999 is listed in Table 3-21. The inventory of radiological contaminants, alphabetically, from the other waste generators for the years 1994 to 1999 is listed in Table 3-22.
The best estimate for the total quantity of radioactive material shipped from the other waste generators from 1994 through 1999 is approximately 192.46 Ci.
3.8.3 Scaling Factors
Curie inventories were so small in the case of facilities listed as other waste generators that attempts to update them with scaling factors were not considered. Upper bounds were calculated using the generic relative standard deviations found in the RPDT (LMITCO 1995a, Section 5.4.3). These generic numbers are derived from EPRI data (EPRI 1987).
Table 3-2 1. Inventory of radiological contaminants from other waste generatorsa (listed by quantity) for the years 1994 to 1999 (activity at the time of disposal).
Best Estimate Percent of Total Radionuclide (Ci) ("/.I Upper Bound
Y-90 82.1830487 42.70096603 13.0982922 1 Mn-54 25.9543154 13.485437 18 168.4769059 Ni-63 24.3 146014 12.63346864 48.63206761 Ce-144 11.50705096 5.978875207 23.01550411 Pr-144 10.72 107237 5.570493604 24.62600009 Zr-95 9.22073 1095 4.79094085 1 69.52483 3 64 TC-99 6.673637069 3.4675 125 14 58.0570 199
RU- 106 4.425874294 2.29961 1792 25.02322257 Rh- 106 4.342574248 2.256330453 26.05544549 Nb-95 3.189978438 1.657460548 6.479957 132 CO-5 8 0.88275108 0.458663003 5.296506478 U-23 8 0.881236338 0.457875968 5.287418028
3-29

Table 3-2 1. (continued).
Best Estimate Percent of Total Radionuclide (Ci) ("/.I Upper Bound
PU-24 1 EU-155 Th-234
Pa-234m C-14 Cr-5 1
CS-134 Sb-125 EU-152 Fe-59
Ag- 1 1 Om Ra-226 Zn-65 EU-154 PU-239
Ag-108m U-234 SC-46 Ni-59
Am-24 1 Sm-151 PU-240 Ba-140 PU-23 8 CO-57 Na-22
Nb-93m s-35
Th-230 Te-125m La-140
Pr-144m Hf-181 Th-23 1 U-235 U-233
0.8629 18599 0.642868796 0.607233308 0.561378118 0.543537389 0.409780803 0.404902105 0.387513959 0.379366764 0.365490824 0.3 6447 1482 0.356522 148 0.2709282 0.2322 1058 0.164468857 0.15742927 0.133787535 0.114549041 0.074079077 0.067108159 0.06504453 1 0.06 1589474 0.05290 19 12 0.0557261 17 0.04882625 0.032640748 0.025 176 18 1 0.0203 6225 9 0.018557163 0.017353078 0.01435878 0.0 13737746 0.013016881 0.01283655 1 0.01224 0.01 1048072
0.448358371 0.334024097 0.315508481 0.291682875 0.282413125 0.212915393 0.210380502 0.20 1345906 0.1971 12757 0.189903046 0.189373413 0.185243069 0.140769855 0.120652814 0.085455324 0.08179767 0.069513812 0.0595 17806 0.038490275 0.0348683 0.033796073 0.032000882 0.027486967 0.028954378 0.02536932 0.0 16959598 0.013081 131 0.0 10579896 0.00964 1998 0.0090 16375 0.007460587 0.007 137908 0.006763358 0.006669662 0.006359704 0.005740397
5.1775 1 1596 3.857460762 3.643399849 3.368268706 3.26 1224334 2.458684818 0.522832207 2.389893099 2.286912131 0.365490824 2.186828894 2.139132888 1.625569198 1.393263478 1.070075 147 0.944 12 16 18 0.8027252 1 0.687294248 0.074079077 0.402648952 0.39 190992 0.375 11765 0.3 174 1 147 1 0.12295477 0.292957499 0,195844487 0.217207626 0.122173554 0.11692378 0.104 1 18468 0.1 1607 1625 0.082426475 0.078101288 0.0770 19308 0.07344 0.01 1159001
3-30

Table 3-2 1. (continued).
Best Estimate Percent of Total Radionuclide (Ci) ("/.I Upper Bound
U-236 Pa-234 Ce-141 Ta- 182 Nb-94 1-129
Ba-137 Th-232 Cm-244 Pa-233 Sn-113 RU- 103 Kr-85 MO-93 Pa-23 1 Sb-124 1-125 Sr-85
Hf- 175 Po-2 12
In-l13m Th-227 Cd- 109 Ir- 192 1-131
AC-228 U-232
Np-237 Ba-133
Cd-l13m Pb-214 CS-144 Ag-108 Th-228 Sn-123 Pb-212
0.0 104239 16 0.00803272 0.007453161 0.006945775 0.00542 1472 0.186046517 0.004872 183 0.003668677 0.0029 1476 0.0029 13674 0.002552847 0.002 180878 0.002 129872 0.00 199697 0.00 1647505 0.00 1605 10 1 0.00 1536226 0.00 1396827 0.001 178363 0.000969837 0.0008900 15 0.000858145 0.000843828 0.000818 0.000776242 0.00073836 1 0.0007 17734 0.0006 1978 0.000572 0.0005 18 0.000446466 0.0004374 0.000388797 0.000350562 0.00034 1808 0.000336057
0.0054 16096 0.004 17367 0.00387254 0.00360891 1 0.002816908 0.096666723 0.00253 1506 0.00 1906 184 0.001514462 0.001513897 0.00 13264 18 0.001 133 149 0.001 106646 0.00 1037593 0.0008560 16 0.000833984 0.000798198 0.000725769 0.0006 12258 0.00050391 1 0.000462437 0.000445878 0.000438439 0.0004250 19 0.000403323 0.00038364 0.000372923 0.000322028 0.000297202 0.000269144 0.00023 1977 0.000227266 0.0002020 13 0.000 182 146 0.000 177598 0.000 1746 1
0.062543497 0.048196322 0.044718964 0.04 1674652 0.00542 1472 0.187149547 0.004872 183 0.003668677 0.0 1748856 1 0.0 1748204 1 0.015317085 0.013085268 0.0 1277923 0.01198182 0.00 1757783 0.009630607 0.0092 17355 0.008380965 0.007070175 0.0058 19023 0.00534009 0.005 148868 0.005062969 0.004908 0.004657453 0.004430 168 0.004306401 0.0037 18682 0.000572 0.003 108 0.002678798 0.0026244 0.002332784 0.000350562 0.023 113882 0.0020 16342
3-3 1

Table 3-2 1. (continued).
Best Estimate Percent of Total Radionuclide (Ci) ("/.I Upper Bound
MO-99 Bi-212 Bi-214 K-40
Te-127m Ce-137 Gd-153 Y-88
Sn- 1 19m T1-208 Zr-93
Ag-110 Rn-220 Ra-224 Ra-228 PO-2 16 Y-9 1
CS-135 Ce-134 Np-239 Am-243 U-237
Cm-242 Ce-139 Th-229 Ra-225 AC-225 At-2 17 Bi-2 13 Fr-22 1 PO-2 13 Sn-126
Am-242m AC-227 Po-2 18 Rn-222
0.000307335 0.000262582 0.0002525 0.000207221 0.000180766 0.000 172667 0.000 170432 0.000 16755 0.000 165464 0.000162582 0.3 19877432 0.000 109536 0.000999541 9.97325E-05 0.0000708 4.0802E-05 3.01205E-05 2.10694E-05 0,0000 156 1.14671E-05 1.137 12E-05 1.0708 1E-05 1.05 72 1 E-05 8.55315E-06 8.05759E-06 6.48962E-06 5.91 186E-06 5.31133E-06 4.30548E-06 3.3 5 023E-06 0.0000028 2.5 3 348E-06 2.52546E-06 2.5 1546E-06 2.5 1546E-06 2.5 1546E-06
0.000 159686 0.000 136434 0.000131195 0.000107669 9.3 9229E-05 8.97 148E-05 8.85535E-05 8.70562E-05 8.59726E-05 8.44752E-05 0.166203075 5.69 13E-05 0.0005 19345 5.18 194E-05 3.67865E-05 2.12E-05 1.56501E-05 1.09473E-05 8.1055E-06 5.95 8 12E-06 5.9083E-06 5.56376E-06 5.493 1E-06 4.44408E-06 4.18659E-06 3.37 19E-06 3.0717E-06 2.75968E-06 2.23706E-06 1.74073E-06 1.45483E-06 1.31635E-06 1.3 12 19E-06 1.30699E-06 1.30699E-06 1.30699E-06
0.00 18440 12 0.00 1575495 0.001515 0.00 1243326 0.000333805 0.001036 0.00 102259 0.00 1005299 0.000992787 0.000975495 1.9 19264594 0.0006572 14
40.35 170442 0.000598395 0.0004248 0.000244812 0.000180723 0.000 1264 17 0.0000936 6.88026E-05 1.137 12E-05 1.0708 1E-05 6.34328E-05 5.13 189E-05 4.83455E-05 3.89377E-05 3.54712E-05 3.1868E-05 4.30548E-06 1.49659E-05 0,0000 168 2.5 3 348E-06 2.52546E-06 1.50928E-05 1.50928E-05 1.50928E-05
3-32

Table 3-2 1. (continued).
Best Estimate Percent of Total Radionuclide (Ci) ("/.I Upper Bound
PO-2 14 Bi-2 10 Pb-2 10 Po-2 10 Pd- 107 Cm-243 Pb-209 T1-209 PU-242 U-228
Cm-246 Cm-245 Cd-113 C1-36 Be- 10 PU-236 P-32
Gd-152 Sn- 1 17m
Sr-89 Te-132 Y-90
Mn-54 Ni-63 Ce-144 Pr-144 Zr-95 TC-99
RU- 106
2.5 1546E-06 2.46534E-06 2.30085E-06 2.0925 5E-06 9.59854E-07 5.82498E-07 5.82498E-07 5.75828E-07 5.27308E-07 5.09308E-07 5.06944E-07 2.5 08 87E-07 8.66 18E-08 5.43 18E-08 5.43 18E-08 4.10137E-08 0.000000024 1.6 17E-09 1.6 149E-09 1.635E- 10 1.345E-10 1.043E- 10 8.1E-11 1.352E-11 1.54334E-18 0 0 0
192.46 1802
1.30699E-06 1.28095E-06 1.19548E-06 1.08725E-06 4.98724E-07 3.02656E-07 3.02656E-07 2.99 19 1E-07 2.7398E-07 2.64628E-07 2.634E-07 1.30357E-07 4.5 005 3E-08 2.82227E-08 2.82227E-08 2.13 1E-08 1.247E-08 8.40 167E-10 8.39076E-10 8.49519E-11 6.9884E-11 5.41926E-11 4.20863E-11 7.02477E- 12 8.01893E-19 0 0 0
LOO
1.50928E-05 1.4792E-05 1.38051E-05 1.25553E-05 5.75 9 12E-06 3.49499E-06 3.49499E-06 3.45497E-06 3.16385E-06 3.05585E-06 3.04166E-06 1.50532E-06 5.19708E-07 3.25908E-07 3.25908E-07 2.46082E-07 0.000000024 9.702E-09 9.6894E-09 9.8 1E- 10 8.07E-10 6.25 8E- 10 4.86E- 10 8.112E-11 9.26002E-18 0 0 0
a. These waste generators are minor contributors.
3-33

Table 3-22. Inventory of radiological contaminants (listed alphabetically) from other waste generatorsa for the years 1994 to 1999 (activity at time of disposal).
Best Estimate Percent of Total Radionuclide (Ci) ("/.I Upper Bound
AC-225
AC-227
AC-228
Ag-108
Ag-108m
Ag-110
Ag- 1 1 Om
Am-24 1
Am-242m
Am-243
At-2 17
Ba-133
Ba-137
Ba-137m
Ba-140
Be- 10
Bi-2 10
Bi-212
Bi-2 13
Bi-214
C-14
Cd- 109
Cd-113
Cd-l13m
Ce-134
Ce-137
Ce-139
Ce-141
Ce-144
C1-36
Cm-242
2.5 1546E-06
9.59854E-07
0.000388797
0.000207221
0.05290 19 12
0,0000 156
0.114549041
0.025 176 18 1
2.0925 5E-06
5.31133E-06
2.5 1546E-06
0.000336057
0.00 199697
6.673637069
0.017353078
1.043E- 10
5.27308E-07
0.000 165464
2.5 1546E-06
0.000162582
0.356522 148
0.0005 18
1.635E- 10
0.000307335
6.48962E-06
0.000999541
0.0000028
0.0029 13674
0.88275108
1.345E-10
3.3 5 023E-06
1.30699E-06
4.98724E-07
0.0002020 13
0.000107669
0.027486967
8.1055E-06
0.0595 17806
0.013081 131
1.08725E-06
2.75968E-06
1.30699E-06
0.000 1746 1
0.00 1037593
3.4675 125 14
0.0090 16375
5.41926E-11
2.7398E-07
8.59726E-05
1.30699E-06
8.44752E-05
0.185243069
0.000269144
8.49519E-11
0.000 159686
3.37 19E-06
0.0005 19345
1.45483E-06
0.001513897
0.458663003
6.9884E-11
1.74073E-06
1.50928E-05
5.75 9 12E-06
0.002332784
0.00 1243326
0.3 174 1 147 1
0.0000936
0.687294248
0.217207626
1.25553E-05
3.1868E-05
1.50928E-05
0.0020 16342
0.01198182
58.0570 199
0.104 1 18468
6.25 8E- 10
3.16385E-06
0.000992787
1.50928E-05
0.000975495
2.139132888
0.003 108
9.8 1E- 10
0.00 18440 12
3.89377E-05
40.35 170442
0,0000 168
0.0 1748204 1
5.296506478
8.07E-10
1.49659E-05
3-34

Table 3 -22. (continued).
Best Estimate Percent of Total Radionuclide (Ci) ("/.I Upper Bound
Cm-243
Cm-244
Cm-245
Cm-246
CO-57
CO-5 8
CO-60
Cr-5 1
CS-134
CS-135
CS-137
CS-144
EU-152
EU-154
EU-155
Fe-55
Fe-59
Fr-22 1
Gd-152
Gd-153
H-3
Hf- 175
Hf-181
1-125
1-129
1-131
In-l13m
Ir- 192
K-40
Kr-85
La-140
Mn-54
8.66 18E-08
0.00 1605 10 1
1.6 149E-09
1.6 17E-09
0.0 13737746
0.409780803
11.50705096
0.2709282
0.2322 1058
8.05759E-06
10.72 107237
0.0002525
0.15742927
0.06504453 1
0.379366764
24.3 146014
0.133787535
2.5 1546E-06
1.54334E-18
9.97325E-05
82.1830487
0.00073836 1
0.006945775
0.000818
0.002 129872
0.0004374
0.0006 1978
0.000446466
0.3 19877432
0.000969837
0.00803272
4.342574248
4.5 005 3E-08
0.000833984
8.39076E-10
8.40 167E-10
0.007 137908
0.212915393
5.978875207
0.140769855
0.120652814
4.18659E-06
5.570493604
0.000131195
0.08179767
0.033796073
0.1971 12757
12.63346864
0.069513812
1.30699E-06
8.01893E-19
5.18 194E-05
42.70096603
0.00038364
0.00360891 1
0.0004250 19
0.001 106646
0.000227266
0.000322028
0.00023 1977
0.166203075
0.00050391 1
0.004 17367
2.256330453
5.19708E-07
0.009630607
9.6894E-09
9.702E-09
0.082426475
2.458684818
23.01550411
1.625569198
1.393263478
4.83455E-05
24.62600009
0.001515
0.944 12 16 18
0.39 190992
2.286912131
48.63206761
0.8027252 1
1.50928E-05
9.26002E-18
0.000598395
13.0982922 1
0.004430 168
0.04 1674652
0.004908
0.0 1277923
0.0026244
0.0037 18682
0.002678798
1.9 19264594
0.0058 19023
0.048196322
26.05544549
3-35

Table 3 -22. (continued).
Best Estimate Percent of Total Radionuclide (Ci) ("/.I Upper Bound
MO-93
MO-99
Na-22
Nb-93m
Nb-94
Nb-95
Ni-59
Ni-63
Np-237
Np-239
P-32
Pa-23 1
Pa-233
Pa-234
Pa-234m
Pb-209
Pb-2 10
Pb-212
Pb-214
Pd- 107
Pm-147
Po-2 10
Po-2 12
PO-2 13
PO-2 14
PO-2 16
Po-2 18
Pr-144
Pr-144m
PU-236
PU-23 8
PU-239
0.0008900 15
0.000 16755
0.013016881
0.01283655 1
0.002 180878
0.543537389
0.032640748
3.189978438
0.00034 1808
5.91 186E-06
1.352E-11
0.000858145
0.00 1536226
0.0029 1476
0.3 6447 1482
5.43 18E-08
5.09308E-07
0.000 170432
0.000262582
2.5 08 87E-07
25.9543154
5.06944E-07
0.0007 17734
2.46534E-06
5.75828E-07
1.05 72 1 E-05
5.82498E-07
0.881236338
0.007453161
8.1E-11
0.01435878
0.06 1589474
0.000462437
8.70562E-05
0.006763358
0.006669662
0.001 133 149
0.282413125
0.0 16959598
1.657460548
0.000 177598
3.0717E-06
7.02477E- 12
0.000445878
0.000798198
0.001514462
0.189373413
2.82227E-08
2.64628E-07
8.85535E-05
0.000 136434
1.30357E-07
13.485437 18
2.634E-07
0.000372923
1.28095E-06
2.99 19 1E-07
5.493 1E-06
3.02656E-07
0.457875968
0.00387254
4.20863E-11
0.007460587
0.032000882
0.00534009
0.00 1005299
0.078101288
0.0770 19308
0.013085268
3.26 1224334
0,195844487
6.479957 132
0.023 113882
3.54712E-05
8.112E-11
0.005 148868
0.0092 17355
0.0 1748856 1
2.186828894
3.25908E-07
3.05585E-06
0.00 102259
0.00 1575495
1.50532E-06
168.4769059
3.04166E-06
0.004306401
1.4792E-05
3.45497E-06
6.34328E-05
3.49499E-06
5.287418028
0.044718964
4.86E- 10
0.1 1607 1625
0.375 11765
3-36

Table 3 -22. (continued).
Best Estimate Percent of Total Radionuclide (Ci) ("/.I Upper Bound
PU-240
PU-24 1
PU-242
Ra-224
Ra-225
Ra-226
Ra-228
Rh- 106
Rn-220
Rn-222
RU- 103
RU- 106
s-35
Sb-124
Sb-125
SC-46
Sm-151
Sn-113
Sn- 1 17m
Sn- 1 19m
Sn-123
Sn-126
Sr-85
Sr-89
Sr-90
Ta- 182
TC-99
Te-125m
Te-127m
Te-132
Th-227
Th-228
0.018557163
0.387513959
4.10137E-08
1.137 12E-05
2.52546E-06
0.074079077
1.0708 1E-05
0.561378118
1.14671E-05
5.82498E-07
0.001 178363
0.607233308
0.01224
0.000843828
0.164468857
0.04882625
0.0203 6225 9
0.00 1396827
0
4.0802E-05
0.000 172667
2.30085E-06
0.000776242
0
9.22073 1095
0.002552847
0.642868796
0.0 104239 16
0.000 109536
0
0.000572
0.000180766
0.00964 1998
0.20 1345906
2.13 1E-08
5.9083E-06
1.3 12 19E-06
0.038490275
5.56376E-06
0.291682875
5.95 8 12E-06
3.02656E-07
0.0006 12258
0.315508481
0.006359704
0.000438439
0.085455324
0.02536932
0.0 10579896
0.000725769
0
2.12E-05
8.97 148E-05
1.19548E-06
0.000403323
0
4.79094085 1
0.00 13264 18
0.334024097
0.0054 16096
5.69 13E-05
0
0.000297202
9.3 9229E-05
0.11692378
2.389893099
2.46082E-07
1.137 12E-05
2.52546E-06
0.074079077
1.0708 1E-05
3.368268706
6.88026E-05
3.49499E-06
0.007070175
3.643399849
0.07344
0.005062969
1.070075 147
0.292957499
0.122173554
0.008380965
0
0.000244812
0.001036
1.38051E-05
0.004657453
0
69.52483 3 64
0.015317085
3.857460762
0.062543497
0.0006572 14
0
0.000572
0.000333805
3-37

Table 3 -22. (continued).
Best Estimate Percent of Total Radionuclide (Ci) ("/.I Upper Bound
Th-229
Th-230
Th-23 1
Th-232
Th-234
T1-208
T1-209
U-228
U-232
U-233
U-234
U-235
U-236
U-237
U-23 8
Y-88
Y-90
Y-9 1
Zn-65
Zr-93
Zr-95
Total
2.5 3 348E-06
0.01 1048072
0.00542 1472
0.00 1647505
0.365490824
3.01205E-05
5.43 18E-08
0.000000024
0.000350562
0.004872 183
0.0557261 17
0.186046517
0.003668677
4.30548E-06
0.404902105
0.0000708
4.425874294
8.55315E-06
0.067108159
2.10694E-05
0.8629 18599
192.46 1802
1.31635E-06
0.005740397
0.002816908
0.0008560 16
0.189903046
1.56501E-05
2.82227E-08
1.247E-08
0.000 182 146
0.00253 1506
0.028954378
0.096666723
0.00 1906 184
2.23706E-06
0.210380502
3.67865E-05
2.29961 1792
4.44408E-06
0.0348683
1.09473E-05
0.448358371
100
2.5 3 348E-06
0.01 1159001
0.00542 1472
0.00 1757783
0.365490824
0.000180723
3.25908E-07
0.000000024
0.000350562
0.004872 183
0.12295477
0.187149547
0.003668677
4.30548E-06
0.522832207
0.0004248
25.02322257
5.13 189E-05
0.402648952
0.000 1264 17
5.1775 1 1596 -
3-38

4. REFERENCES
10 CFR 6 1, Code of Federal Regulations, Title 10, “Energy,” Part 6 1, “Licensing Requirements for Land Disposal of Radioactive Waste.”
40 CFR 26 1, Appendix 11, 2002, Title 40, “Protection of Environment,” Part 26 1, “Identification and Listing of Hazardous Waste,” Appendix 11, “Method 13 1 1, Toxicity Characteristic Leaching Procedure,” Code of Federal Regulations, Office of the Federal Register.
42 USC 9 6901 et seq., October 21, 1976, United States Code, “Resource Conservation and Recovery Act (Solid Waste Disposal Act).”
42 USC 9 9601 et seq., December 11, 1980, United States Code, “Comprehensive Environmental Response, Compensation and Liability Act of 1980 (CERCLAKuperhnd).”
Akers, D. W., 1994, TRA Activity Weighting Factors/Physical and Chemical Properties of C-14, Tc-99 and 1-129, Engineering Design File ER-WAG 7-5 1, Idaho National Engineering and Environmental Laboratory, EG&G Idaho, Inc., Idaho Falls, Idaho.
ANL-W, 200 1, Argonne National Laboratory-West website, http://www.anl. yov/OPA/progs.htm 1 sf, Idaho National Engineering and Environmental Laboratory, Argonne National Laboratory-West, Idaho Falls, Idaho.
Barg, D. C., 2000, Determination of Limits for Depleted Uranium Containing Transuranic and Fission Product Materials, Engineering Design File SMC-2000-00 1, Idaho National Engineering and Environmental Laboratory, Bechtel BWXT LLC, Idaho, Idaho Falls, Idaho.
Best, W. T., and A. D. Miller, 1987, Updated Scaling Factors in Low-Level Radwaste, EPRI NP-5077, Impell Corporation, Walnut Creek, California, Electric Power Research Institute, Palo Alto, California,.
Best, W. T, A. D. Miller, R. Wessman, and L. Leventhal, 1985, Radionuclide Correlations in Low-Level Radwaste, EPRI NP-4037, Impell Corporaton, Walnut Creek, California.
Croff, A. G., 1980,0RIGEN2-A Revised and Updated Version of the Oak Ridge Generation and Depletion Code, ORNL-5G2 1, Oak Edge National Laboratory, Oak Edge, Tennessee.
DOE-ID, 1998, Radioactive Waste Management Information for 1997 and Record to Date-RMIS Report, DOE/ID-10054, Rev. 0, U.S. Department of Energy Idaho Operations Office, Idaho Falls, Idaho.
DOE, 1995a, “Draft Environmental Assessment: Test Area North Pool Stabilization Project (Draft),” U. S. Department of Energy.
DOE, 1995b, Settlement Agreement, U. S. Department of Energy, Environmental Management; U. S. Department of the Navy, Naval Nuclear Propulsion Program; and the State of Idaho, October 17, 1995.
DOE-ID, 199 1, Federal Facility Agreement and Consent Order for the Idaho National Engineering Laboratory, Administrative Record No. 1088-06-29-120, U.S. Department of Energy Operations
4- I

Office; U. S. Environmental Protection Agency, Region 10; Idaho Department of Health and Welfare, December 4, 199 1.
Einerson, J. J., 1995, Estimation and Application of Scaling Factor Uncertainties for the Historical Data Task and the Recent and Projected Data Task, Engineering Design File ER-WAG 7-62, Idaho National Engineering and Environmental Laboratory, Lockheed Martin Idaho Technologies Company, Idaho Falls, Idaho.
Einerson, J. J., and T. H. Smith, 1995, Estimation and Application of Scaling Factor Uncertainties for the Historical Data Task and the Recent and Projected Data Task, Engineering Design File EDF-ER-WAG 4-62, 95/08 1, Idaho National Engineering and Environmental Laboratory, Lockheed Martin Idaho Technologies Company, Idaho Falls, Idaho.
EPRI, 1987, Updated Scaling Factors in Low-Level Radwaste, EPRINP-5077, Electric Power Research Institute, Palo Alto, California.
Evans, J. C., E. L. Lepel, R. W. Sanders, C. L. Wilkerson, W. Silker, C. W. Thomas, K. H. Abel, and D. R. Robertson, 1984, Long-Lived Activation Products in Reactor Materials, NUREG/CR-3474, Pacific Northwest Laboratory, Battelle Memorial Institute, Echland, Washington.
Harker, Y. D., 1995, Scaling Factors for Waste Activities Measured by G-MMethod, Engineering Design File ER-WAG 7-5 7, Idaho National Engineering and Environmental Laboratory, Lockheed Martin Idaho Technologies Company, Idaho Falls, Idaho.
INEEL, 200 1, Idaho National Engineering and Environmental Laboratory Comprehensive Facility and Land Use Plan, Idaho National Engineering and Environmental Laboratory, Idaho Falls, Idaho, URL: http://mceris.inel.gov/.
LMITCO, 1995a, A Comprehensive Inventory of Radiological and Nonradiological Contaminants in Waste Buried or Projected to Be Buried in the Subsurface Disposal Area of the INEL RWMC During the Years 1984-2003, INEL-95/0 135, Idaho National Engineering and Environmental Laboratory, Lockheed Martin Idaho Technologies Company, Idaho Falls, Idaho.
LMITCO, 1995b, A Comprehensive Inventory of Radiological and Nonradiological Contaminants in Waste Buried in the Subsurface Disposal Area of the INEL RWMC During the Years 1952-1983, INEL-95/03 10, Idaho National Engineering Laboratory, Lockheed Martin Idaho Technologies Company, Idaho Falls, Idaho.
Sheldon, D. E., Interoffice Facsimile to J. Grande, November 7, 2000, “Major Isotopic Constituents in SMC Depleted Uranium-Bearing Wastes (Cu) Conversion Factors,” Idaho National Engineering and Environmental Laboratory, Bechtel BWXT LLC, Idaho, Idaho Falls, Idaho.
Tyger, G. L., 1999, Radioactive Waste Characterization Requirements for Reactor-Generated Low-Level Waste, Engineering Design File WROC-EDF-392, Rev. 1, Idaho National Engineering and Environmental Laboratory, Lockheed Martin Idaho Technologies, Idaho Falls, Idaho.
Vance, J. N., 1988, Assessing the Impact ofNRC Regulation 10 CFR 61 on the Nuclear Industry, EPRI NP-5983, Research Project 2412-6, Final Report, Ruidoso, New Mexico.
WGS, 1996, Waste Generator Services Certificate, Waste Shipment Form, Waste Generator Services
4-2

Zagula, T. A,, 1995, A Modern Depleted Uranium Munufucturing Facility, INEL-95-00265, Idaho National Engineering and Environmental Laboratory, Lockheed Martin Idaho Technologies Company, Idaho Falls, Idaho.
4-3

Appendix A
Standardized Five-Page Data Form Used Previously to Compile and Record Subsurface Disposal Area
Waste Data
A- 1

A-2

Appendix A
Standardized Five-Page Data Form Used Previously to Compile and Record Subsurface Disposal Area
Waste Data
This appendix presents three items related to collecting the information on the contaminant inventories.
The first item is a blank, five-page data collection form. One data form was completed for each identified waste stream disposed of in the Subsurface Disposal Area. Continuation pages were added to the form as necessary. The Contaminant Inventory Database for f i sk Assessment (CIDRA) was modeled after this form. Completed forms for all identified waste streams are stored in CIDRA and constitute Appendix B of this report.
The second item is a list of the general physical forms represented in the waste. The list is used in the database compilation of the inventory to facilitate the rollup of all waste streams having a similar physical form, regardless of the generator or building that produced the waste.
The third item is a list of the general container types used for the waste at the SDA. The abbreviations match those used in the Radioactive Waste Management System (RWMIS) database.
A-3

A-4

A-5

I I
y i l
A-6

A-7

a
a c m
A-8

t
I -.I
A-9

A-10

Number
1 2 3 4 5 6 7 8 9 10
11 12 13 14 15 16 17
21 22 23 24
31
41 42 43 44 45 46 47
51 52
GENERAL PHYSICAL FORMS FOR WASTE BURIED ZN THE SUBSURFACE DISPOSAL AREA
Fom
Irradiated fuel rods from experiments Irradiated fuel from experiments Unirradiated fuel from srperiments Irradiated end boxes Other core, fegcto~ vessel, and loop components Ventilation systems Lead Beryllium zirwnium Other scrap metals
Sludge Resin Vermidte and other sorbents Evaporated salts Other liquid setups Graphite Reactive metals
Cambusti%les (paper, cloth, wood, e&.) HEPA filters ocherfilters Biological waste
Radiation sources
Concrete, brick, asphalt Glass soil Plastics Rubber Soot, ash Asbestos
Liquids unknown
53 Other
A-1 1