3 q14 presentation
TRANSCRIPT

Third Quarter 2014
Financial Results
Conference Call
October 20, 2014

1
Forward-looking Statements This communication may contain forward-looking statements within the meaning of the Private Securities Litigation Reform Act of 1995 and Canadian securities
laws. These forward-looking statements include, but are not limited to, statements regarding Valeant Pharmaceuticals International, Inc.’s (“Valeant”) business
development activities, including the timing of closing of pending transactions, clinical results and timing of development products, timing of expected product
launches and its expected future performance (including expected results of operations, outlook and financial guidance), and Valeant’s offer to acquire
Allergan, Inc. (“Allergan”) and the combined company’s future financial condition, operating results, strategy and plans. Forward-looking statements may be
identified by the use of the words “anticipates,” “expects,” “intends,” “plans,” “should,” “could,” “would,” “may,” “will,” “believes,” “estimates,” “potential,”
“target,” “opportunity,” “tentative,” “positioning,” “designed,” “create,” “predict,” “project,” “seek,” “ongoing,” “upside,” “increases” or “continue” and
variations or similar expressions. These statements are based upon the current expectations and beliefs of management and are subject to numerous
assumptions, risks and uncertainties that change over time and could cause actual results to differ materially from those described in the forward-looking
statements. These assumptions, risks and uncertainties include, but are not limited to, assumptions, risks and uncertainties discussed in Valeant’s most recent
annual and quarterly report filed with the Securities and Exchange Commission (the “SEC”) and the Canadian Securities Administrators (the “CSA”) and
assumptions, risks and uncertainties relating to the proposed merger, as detailed from time to time in Valeant’s filings with the SEC and the CSA, which factors
are incorporated herein by reference. Important factors that could cause actual results to differ materially from the forward-looking statements we make in this
communication are set forth in other reports or documents that we file from time to time with the SEC and the CSA, and include, but are not limited to:
the ultimate outcome of any possible transaction between Valeant and Allergan including the possibilities that Valeant will not pursue a transaction with
Allergan and that Allergan will reject a transaction with Valeant;
if a transaction between Valeant and Allergan were to occur, the ultimate outcome and results of integrating the operations of Valeant and Allergan, the
ultimate outcome of Valeant’s pricing and operating strategy applied to Allergan and the ultimate ability to realize synergies;
the effects of the business combination of Valeant and Allergan, including the combined company’s future financial condition, operating results, strategy
and plans;
the effects of governmental regulation on our business or potential business combination transaction;
ability to obtain regulatory approvals and meet other closing conditions to the transaction, including all necessary stockholder approvals, on a timely
basis;
our ability to sustain and grow revenues and cash flow from operations in our markets and to maintain and grow our customer base, the need for
innovation and the related capital expenditures and the unpredictable economic conditions in the United States and other markets;
the impact of competition from other market participants;
the development and commercialization of new products;
the availability and access, in general, of funds to meet our debt obligations prior to or when they become due and to fund our operations and necessary
capital expenditures, either through (i) cash on hand, (ii) free cash flow, or (iii) access to the capital or credit markets;
our ability to comply with all covenants in our indentures and credit facilities, any violation of which, if not cured in a timely manner, could trigger a
default of our other obligations under cross-default provisions; and
the risks and uncertainties detailed by Allergan with respect to its business as described in its reports and documents filed with the SEC.
All forward-looking statements attributable to us or any person acting on our behalf are expressly qualified in their entirety by this cautionary statement.
Readers are cautioned not to place undue reliance on any of these forward-looking statements. These forward-looking statements speak only as of the date
hereof. Valeant undertakes no obligation to update any of these forward-looking statements to reflect events or circumstances after the date of this
communication or to reflect actual outcomes, expected as required by applicable law.

2
More Information ADDITIONAL INFORMATION
This communication does not constitute an offer to buy or solicitation of an offer to sell any securities. This communication relates, in part, to the
exchange offer which Valeant has made to Allergan stockholders. The exchange offer is being made pursuant to a tender offer statement on Schedule TO
(including the offer to exchange, the letter of election and transmittal and other related offer materials) and a registration statement on Form S-4 filed by
Valeant with the SEC on June 18, 2014 and with the CSA, as each may be amended from time to time. These materials, as they may be further amended
from time to time, contain important information, including the terms and conditions of the offer. In addition, Valeant has filed a preliminary proxy
statement with the SEC on June 24, 2014, as may be amended from time to time, Pershing Square Capital Management, L.P. (“Pershing Square”) has filed
a definitive proxy statement with the SEC on September 24, 2014, and Valeant and Pershing Square (and, if a negotiated transaction is agreed, Allergan)
have filed or may file one or more additional proxy statements or other documents with the SEC. This communication is not a substitute for any proxy
statement, registration statement, prospectus or other document Valeant, Pershing Square and/or Allergan may file with the SEC in connection with the
proposed transaction. INVESTORS AND SECURITY HOLDERS OF VALEANT AND ALLERGAN ARE URGED TO READ THE TENDER OFFER STATEMENT,
REGISTRATION STATEMENT AND ANY OTHER DOCUMENTS FILED WITH THE SEC CAREFULLY IN THEIR ENTIRETY IF AND WHEN THEY BECOME
AVAILABLE AS THEY WILL CONTAIN IMPORTANT INFORMATION ABOUT THE PROPOSED TRANSACTION. Any definitive proxy statement(s) (if and
when available) will be mailed to stockholders of Allergan and/or Valeant, as applicable. Investors and security holders may obtain free copies of the
tender offer statement, the registration statement and other documents (if and when available) filed with the SEC by Valeant and/or Pershing Square
through the web site maintained by the SEC at http://www.sec.gov.
Information regarding the names and interests in Allergan and Valeant of Valeant and persons related to Valeant who may be deemed participants in any
solicitation of Allergan or Valeant shareholders in respect of a Valeant proposal for a business combination with Allergan is available in the additional
definitive proxy soliciting materials in respect of Allergan filed with the SEC by Valeant on April 21, 2014, May 28, 2014 and September 25, 2014.
Information regarding the names and interests in Allergan and Valeant of Pershing Square and persons related to Pershing Square who may be deemed
participants in any solicitation of Allergan or Valeant shareholders in respect of a Valeant proposal for a business combination with Allergan is available
in additional definitive proxy soliciting material in respect of Allergan filed with the SEC by Pershing Square. The additional definitive proxy soliciting
material referred to in this paragraph can be obtained free of charge from the sources indicated above.
Consent was not obtained nor sought with respect to third party statements referenced in this presentation.
Non-GAAP Information
To supplement the financial measures prepared in accordance with U.S. generally accepted accounting principles (GAAP), Valeant uses non-GAAP
financial measures that exclude certain items, such as amortization of inventory step-up, amortization of alliance product assets & property, plant and
equipment step up, stock-based compensation step-up, contingent consideration fair value adjustments, restructuring, acquisition-related and other
costs, In-process research and development, impairments and other charges, ("IPR&D"), legal settlements outside the ordinary course of business, the
impact of currency fluctuations, amortization including intangible asset impairments and other non-cash charges, amortization and write-down of deferred
financing costs, debt discounts and ASC 470-20 (FSP APB 14-1) interest, loss on extinguishment of debt, (gain) loss on assets sold/held for
sale/impairment, net, (gain) loss on investments, net, and adjusts tax expense to cash taxes. Management uses non-GAAP financial measures internally
for strategic decision making, forecasting future results and evaluating current performance. By disclosing non-GAAP financial measures, management
intends to provide investors with a meaningful, consistent comparison of Valeant’s core operating results and trends for the periods presented. Non-
GAAP financial measures are not prepared in accordance with GAAP. Therefore, the information is not necessarily comparable to other companies and
should be considered as a supplement to, not a substitute for, or superior to, the corresponding measures calculated in accordance with GAAP. Non-
GAAP reconciliations can be found in our press tables under the Investor Relations tab on www.valeant.com.

3
Agenda
1. Third Quarter 2014 Results
2. Business Highlights and Outlook
3. Financial Review and Updated Guidance
4. Allergan Update

4
Q3 2014 Results
Q3 2014 Q3 2013 % Growth
Total Revenue $2.1 B $1.5 B 33%
Cash EPS $2.11 $1.43 48%
GAAP Cash Flow from Operations $619 M $202 M 207%
Adjusted Cash Flow from Operations $771 M $408 M 89%
Cash Conversion 107% 84%

5
Q3 2014 Results
Guidance
Q3 2014
Results
Q3 2014
Organic Growth – Company
Same Store Sales
Second half of year
high single digit 19%
Organic Growth – B&L Second half of year
double digit 12%
Total Revenue $1.9B - $2.1B $2.1B
Cash EPS $1.90 - $2.00 $2.11
Adjusted Cash Flow from
Operations
Second half of year
~$1.3B $771M
Restructuring <$70M $63M
Total revenue at high end of guidance despite FX impact of $(31M)
Cash EPS FX Impact of $(0.04)

6
Q3 2014 Organic Growth Including All Generic Impact
(a) As reported.
(b) Excludes injectables for Q1 in YTD organic growth.
Same Store Sales – YoY growth rates for businesses that have been owned for one year or more
Q1 2014(a) Q2 2014(a) Q3 2014 YTD 2014(b)
Total U.S. 2% 5% 29% 15%
Total Developed 1% 2% 22% 11%
Total Emerging Markets 3% 8% 12% 9%
Total Company 1% 4% 19% 11%
Pro Forma – YoY growth rates for entire business, including those that have been acquired within the last year
Q1 2014(a) Q2 2014 (a) Q3 2014 YTD 2014 (b)
Total U.S. 3% 9% 24% 13%
Total Developed 3% 7% 18% 10%
Total Emerging Markets 4% 10% 9% 8%
Total Company 4% 8% 16% 10%

7
Bausch + Lomb Organic Growth
(adjusted for only FX)
Country/Region Q3 2014
Product
Sales
Q/Q% Since
Ownership
(8/5/13)
CAGR
United States $369M 18% 12%
Consumer $104M 17% 13%
Rx Pharma $107M 25% 9%
Surgical $53M 10% 12%
Contact Lens $45M 23% 14%
Generics $60M 12% 17%
Other Developed
Markets
$256M 5% 5%
Emerging Markets $217M 11% 13%
Total $843M 12% 10%

8
Q3 Organic Growth Drivers
Turnaround in U.S. Dermatology performance has accelerated with the launches of
Jublia®, LuzuTM, and RAM 0.08%
Strong double digit growth in the B+L businesses globally
Continued strong performance in Emerging Markets (12% organic growth), despite
geopolitical uncertainties
At or above our forecasted growth in most of our other businesses
U.S. Dentistry – driven by expanded sales force
U.S. Neuro/Generics – growth in Xenazine, Wellbutrin XL, and orphan products and
the impact of competitive stock outs on certain generic products
Obagi – driven by improved sales force effectiveness
More growth from volume than price for total company

9
Q3 2014 Top 20 Global Brands (1/3)
Top 20 products YTD revenue of $1.8B, representing 31% of total revenue
Top 20 products grew 32% Q3 2014 over Q3 2013 and 16% YTD
All 20 products grew in Q3 2014 over Q3 2013
~50% of Q3 growth from volume for top 20 products
Top 20 products demonstrate diversification
Largest product contributed ~3.5% of Q3 2014 revenue
Top 10 products contributed 22% of Q3 2014 revenue
Mix of products includes Rx, OTC and devices (solutions)
Jublia® was 28th largest product in Q3 2014, anticipated to be in top 20 products in Q4

10
Q3 2014 Top 20 Global Brands (2/3) ($ in M)
Product Q3 2014
Revenue Primary Growth Driver
2014 YTD
Revenue
1) Wellbutrin® $72 Volume $195
2) Ocuvite®/PreserVision® $62 Volume $188
3) Xenazine® US $56 Volume $160
4) Solodyn® $54 Volume $148
5) Targretin® Capsules $44 Price + Volume $88
6) ReNu Multiplus® $41 Volume $145
7) Lotemax® Franchise $35 Price $106
8) Arestin® $30 Price $75
9) Retin-A® Franchise $30 Volume $68
10) BioTrue® Solution $26 Volume $77

11
Q3 2014 Top 20 Global Brands (3/3) ($ in M)
Product Q3 2014
Revenue
Primary Growth
Driver
2014 YTD
Revenue
11) ArtelacTM $25 Volume $76
12) Zovirax® Franchise $23 Price $82
13) Elidel® $22 Price + Volume $72
14) CeraVe® $21 Volume $68
15) Syprine® $20 Price $57
16) Boston Solutions $20 Price $59
17) Cardizem® CD AG $18 Volume $26
18) Ziana® $17 Volume $45
19) Duromine® $17 Volume $45
20) Prolensa® $16 Volume $46
28) Jublia $12 Volume $15

12
Q3 U.S. Business Highlights (1/3)
Dermatology, $273M Revenues, 33% Q/Q Growth
Strong growth for promoted brands, e.g. Solodyn, Elidel, Acanya®, Zyclara®
After only three months, Jublia has 7% TRx share of total onychomycosis market
Luzu TRx uptake continues to accelerate with 13% share of branded topical
antifungal market
Includes PreCision since acquisition closed on July 7
Consumer, $141M Revenues, 43% Q/Q Growth
One of the fastest growing OTC Health Care company in the US (September
YTD)(a)
CeraVe - fastest growing (Major) skin care brand(a)
PreserVision AREDS 2 - #1 selling Vitamin over last 12 weeks(a)
Entire PreserVision brand grew 20% Q/Q based on consumption(a)
BioTrue Multipurpose Solution - Fastest growing Lens Care brand(a)
(a) Source: IRI consumption data.

13
Q3 U.S. Business Highlights (2/3)
Ophthalmology Rx, $118M Revenues, 57% Q/Q Growth
Strong performance of Anti-infective/Anti-viral portfolio – Besivance®, Zylet®,
Zirgan®
Continued Q/Q organic growth from Prolensa +11% and Lotemax Franchise +13%
Contact Lenses, $45M Revenues, 82% Q/Q Growth
Fastest growing contact lens business – market share expanded from 7% to over
10% since B+L acquisition(a)
BioTrue ONEday and PureVision® 2 for Presbyopia exceeding expectations and
capturing market share; current growth doesn’t reflect upside in Bausch + Lomb
Ultra ® given limited distribution (less than $5M of revenues in Q3 2014)
(a) Source: Independent third party data.

14
Q3 U.S. Business Highlights (3/3)
Surgical, $54M Revenues, 74% Q/Q Growth
Greater than 55% growth for the cataract refractive lens business
Greater than 40% growth for Stellaris® and Stellaris PC
Number two player in the Posterior Chamber IOL market(a)
28 Victus® machines expected to be installed in 2014 in the U.S., compared with 14 installed in
2013
Neuro & Other/Generics, $392M Revenues, 40% Q/Q Growth
Neuro growth driven by promoted brands – Xenazine, Wellbutrin XL® and Syprine/Cuprimine®
Continued growth of generics through portfolio expansion and due to competitor stock outs
Dental, $32M Revenues, 20% Q/Q Growth
Growth driven by new customers and strong early performance of launch products (e.g. Onset)
Aesthetics, $32M Revenues(b)
Improved sales force effectiveness resulted in 21% Q/Q organic growth for Obagi
(a) Source: Market Scope, an ophthalmic market research firm, based on data as of Q2 2014.
(b) No injectables revenues in Q3 2014.

15
Q3 Rest of World Business Highlights
Emerging Markets-Europe/Middle East, $279M Revenues, 36% Q/Q Growth
Strong performance across all regions even with significant FX headwinds
FX impacts on European Emerging Markets ~ $(18M) Revenues (relative to 7/31 Guidance)
Q/Q organic growth in Russia, Ukraine and CIS of ~20%
Emerging Markets-Asia/Africa, $155M Revenues, 66% Q/Q Growth
China organic growth of 11% driven primarily by lens franchise
iNova South-East Asia business organic growth of 18% Q/Q
Emerging Markets-Latin America, $114M Revenues, 13% Q/Q Growth
Strong performance in Mexico of 12% organic growth, following resolution of supply issues
Brazil and Argentina impacted by economic slowdown and import restrictions in Argentina
Export business negatively impacted by capital controls in Venezuela
ROW Developed, $421M Revenues, 29% Q/Q Growth
Australian organic growth of 15% due to strong cough & cold season
Japanese lens care is gaining market share
Continued mid-single digit organic growth in Western Europe
Offset by a decline in Canada largely due to genericization of Wellbutrin® XL and FX impact

16
JUBLIA Growth Accelerating by Comprehensive Campaign
5,831 TRxs/week
U.S. Weekly TRx Volume
To
tal P
res
cri
pti
on
s (
TR
x) 5,462 TRxs/month
Source: IMS Compuscript for month ending 9/30.
Source: Wolters Kluwer Pharmaceutical + Specialty Pharmacy Data week ending 10/10.
Canada Monthly TRx Volume

17
asd
Physician Website
Physician
eBlast/Banners Physician Journal Ads
Speaker Programs
Webinars
Medical Education
Ad Boards
Consumer Website Consumer Banners Consumer Print
Physician Campaign
JUBLIA Growth Accelerating by Comprehensive Campaign
Print and digital advertising rolled out 2H Q3
TV advertising materials recently reviewed by FDA; expected to be on air mid-Q4
Salesforce focused on Jublia
U.S.: ~60 person podiatry and ~90 dermatology reps; Canada: ~ 25 dermatology reps
Decision to shift spend from a contracted primary care sales force to additional dermatology reps
and consumer advertising
Consumer Campaign

18
-
200
400
600
800
1,000
1,200
1,400
1,600
3/2
8/2
014
4/1
1/2
014
4/2
5/2
014
5/9
/2014
5/2
3/2
014
6/6
/2014
6/2
0/2
014
7/4
/2014
7/1
8/2
014
8/1
/2014
8/1
5/2
014
8/2
9/2
014
9/1
2/2
014
9/2
6/2
014
10/1
0/2
014
Luzu TRx Volume Now Accounts for 13% of
Branded Topical Antifungal Market
Luzu Weekly TRx Volume
To
tal
Pre
scri
pti
on
s (
TR
x)
1,335 TRxs/week
Source: Wolters Kluwer Pharmaceutical + Specialty Pharmacy Data week ending 10/10.

19
Retin-A Micro® 0.08% Exceeded 1,400 TRx’s
Through Week of October 10th
1,443 TRx/week
Source: Wolters Kluwer Pharmaceutical + Specialty Pharmacy Data week ending 10/10.
Retin-A Micro 0.08% Weekly TRx Volume
To
tal
Pre
scri
pti
on
s (
TR
x)

20
Update on Other U.S. Product Launches Bausch + Lomb Ultra
Expanding sales force by 50% to reach peak distribution
Lines 1 and 2 being installed; lines 3 and 4 ordered
Commercial quantities from line 1 expected Q2 2015
Selling to capacity (pilot line)
BioTrue ONEday – contact lens
2nd consecutive quarter with greater than 90% growth
BioTrue Multi-purpose Solution
Grew 56% Q/Q pro forma
TrulignTM Toric IOL
213% Q/Q pro forma growth
Victus
28 Victus machines expected to be installed in 2014, compared
with 14 installed in 2013
CeraVe BabyTM (Q1), Peroxiclear (Q2) ® and SootheXPTM (Q3)
Continue to promote to and gain recommendations from
dermatologists and eye care professionals
Sales and market share building

21
Near-Term Launch/Pipeline Update (1/2)
Product Description Expected Launch
Date Highlights
Adrenaline auto-injector for
anaphylaxis
European launch 1H
2014; U.S. launch
late 2016 / early
2017
• Strong start in Europe, with 20%+ market share
in Sweden and U.K., ~6% share in Germany
OnextonTM Acne January 2015
• New combination acne product
• PDUFA date of November 30, 2014
VesneoTM Glaucoma 2016
• Positive Phase 3 results
• NDA to be filed in 1H2015
• Peak sales potential of ~$500M in the US and
~$1B globally
Next Gen 0.38%
Post-Operative Inflammation
and Pain 2016
• First twice-daily ophthalmic steroid
• Positive Phase 3 results
• 2nd Phase 3 initiated
• NDA to be filed in 3Q2015

22
Near-Term Launch/Pipeline Update (2/2)
Product Description
Expected Launch
Date Highlights
Hydrating Cleansing Bar January 2015
• Locks in moisture 3x longer than the leading
cleansing bar (Dove) and 6x longer than Cetaphil
bar
SA Cleanser, Baby Cream,
Baby Sunscreen SPF 45,
Night Cream, Anti-Itch
Various • Continues brand expansion
Gummies
Eye Health Q1 2015 • Continues brand expansion
• Gummies is the fastest growing vitamin category
Brimonidine Eye Whitening 2016 • Recent completion of Phase 3 studies
• Planned NDA submission Q1 2015

23
Continued Growth Through Business Development
Acquisitions Closed since Q2 Earnings(a)
Bescon – Asia
Contact lenses, full range of modalities for both clear and color, and daily silicone
hydrogel lenses
Global opportunity
PT Armoxindo Farma – Indonesia
Branded generics
Acquisitions Closed in Q4
MedPharma – Middle East and North Africa
Branded generics platform including manufacturing
Zarracom – Turkey
Acrylic hydrophobic IOLs
Acquisitions signed since Q2 Earnings
Croma – Europe
Expanding existing Central and Eastern European rights to global rights; existing
sales concentrated in Western Europe
Surgical products including viscolelastics, IOLs and instruments; dry eye and anti-
inflammatory pharmaceuticals
(a) ~$2M revenue impact from closed deals in Q3 2014.

Financial Outlook
Howard Schiller
25
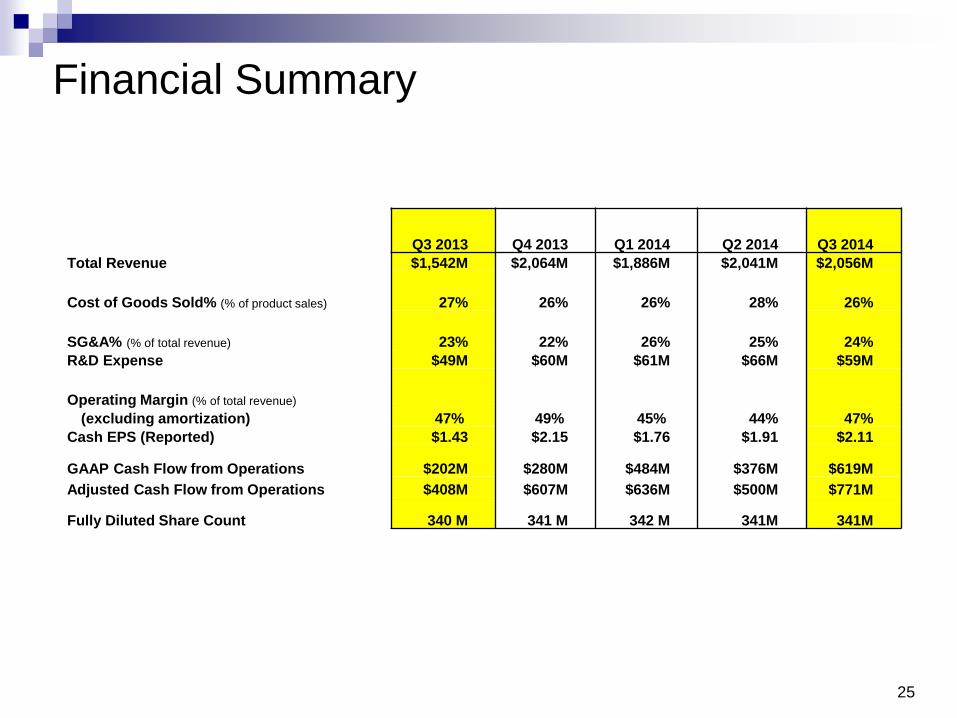
Financial Summary
Q3 2013 Q4 2013 Q1 2014 Q2 2014 Q3 2014
Total Revenue $1,542M $2,064M $1,886M $2,041M $2,056M
Cost of Goods Sold% (% of product sales) 27% 26% 26% 28% 26%
SG&A% (% of total revenue) 23% 22% 26% 25% 24%
R&D Expense $49M $60M $61M $66M $59M
Operating Margin (% of total revenue) (excluding amortization) 47% 49% 45% 44% 47%
Cash EPS (Reported) $1.43 $2.15 $1.76 $1.91 $2.11
GAAP Cash Flow from Operations $202M $280M $484M $376M $619M
Adjusted Cash Flow from Operations $408M $607M $636M $500M $771M
Fully Diluted Share Count 340 M 341 M 342 M 341M 341M

26
Significant Q3 FX headwinds - Revenue: $(31)M; Cash EPS: $(0.04)
FX Impact on Q3/Q4 versus 7/31 Guidance
(a) Order is based on actual financial impact versus outlook as of July 31, 2014.
Q4 impact
• Revenue: ~$(53)M
• Cash EPS: ~$(0.06) (assuming current rates)
Russian Ruble (14.6)%
Euro (4.4)%
Polish Zloty (6.2)%
Canadian Dollar (3.6)%
Japanese Yen (3.0)%
Brazilian Real (9.5)%
Serbian Dinar (6.4)%
Australian Dollar (6.2)%
Mexican Peso (3.5)%
British Pound (5.8)%
South African Rand (4.5)%
Argentine Peso (3.6)%
Indian Rupee (1.9)%
Hungarian Forint (3.4)%
Currency(a)
10/15/14
Spot % Change vs. 7/31/14

27
Restructuring and Integration Update
B+L Restructuring and Integration charges were $36M for the quarter, down from $53M
in Q2
Restructuring and Integration charges for deals completed in Q3 (PT Armoxindo Farma,
Bescon) were ~$3M for the quarter
Due to uncertain timing of close, these expenses were not included in restructuring
expense estimate presented on 7/31
Restructuring and Integration charges expected to further decline in Q4 to less than
$50M Q4 14 and less than $25M in Q1 15, assuming no additional deals
Q2 14 Q3 14
Q4 14 Q1 15 Estimate Estimate
Restructuring / Integration Expense $143M $63M < $50M < $25M

28
Cash Flow from Operations
Guided to cash conversion of 90%
Q1 14 Q2 14 Q3 14 YTD
Adjusted Net Income 600 651 719 1,969
GAAP Cash Flow from Operations 484 376 619 1,479
Adjusted Cash Flow from Operations 636 500 771 1,907
Cash Conversion 106% 77% 107% 97%
Investment in Working Capital 43 166 <10 ~219

29
Balance Sheet
Significant deleveraging in Q3
$1.1B Term Loan repaid in Q3 resulting in $16.3B debt outstanding
Net leverage ratio reduced to ~4.0 times adjusted pro forma EBITDA
In addition, on October 15, redeemed $500M 6.75% senior notes due 2017
Accounts Receivable DSO have declined each quarter in 2014 (calculated using gross
sales):
Q1 2014: 72 Days
Q2 2014: 66 Days
Q3 2014: 64 Days
Today and going forward, we will be disclosing gross sales to allow you to do this
calculation
Due to changes in product mix and higher gross sales, accounts receivable increased by
$109M with an offsetting increase in accrued liabilities of ~$90M related to rebates,
returns and allowances
Net increase of ~$20M in receivables in Q3 vs. Q2 2014 against $30M increase in net sales
U.S. Rx wholesale inventory levels flat on a unit basis and down on a dollar basis vs. Q2
2014

30
Accelerated organic growth from <5% pre acquisition to 10% since acquisition (adjusted
only for FX)
Continued strength of pharma
Turnaround for lens and surgical
Increased scale of combined Valeant and B+L consumer business has accelerated growth
Benefit from Valeant’s decentralized approach
Valeant’s emerging market capabilities have accelerated B+L’s emerging market growth
Successful recent product launches; limited contribution to date, will be growth drivers in
future
Bausch + Lomb Ultra
BioTrue ONEday for Presbyopia
PureVision 2 for Presbyopia
Peroxiclear
On track to achieve at least $900 million in Bausch + Lomb synergies
~$800 million annualized run rate realized by Q3 14
Remainder of synergies expected to be achieved by end of 2015
Primarily related to manufacturing, Europe and small amounts from a number of other areas
Cost to achieve synergies expected to be ~$600M
Great people added at all levels to our organization
Victus
Trulign
enVista BLIS™ lens inserter
Soothe XP
B+L One Year Anniversary Update – Blueprint for Allergan

31
Q4 Outlook
Continued growth drivers for Q4
Confident in 10+% same store organic growth
Expect continued strong performance from Jublia and other recent product launches
Updated Q4 guidance
Revenues: unchanged
Based on current exchange rates, FX revenue impact would be ~$(53)M
Cash EPS: raised $0.10 to $2.45 to $2.55
Based on current exchange rates, FX Cash EPS impact would be ~$(0.06)
Reflects strong momentum of our overall business
Full year 2014 guidance
Revenues: from $8.0B - $8.3B to $8.1B - $8.3B
Cash EPS: from $7.90 - $8.10 to $8.22 - $8.32
Adjusted Cash Flow from Operations: from $2.3B - $2.6B to greater than $2.5B (expect
at least 90% cash conversion for full year 2014)
Net leverage ratio reduced to ~3.9 times adjusted pro forma EBITDA by year end

32
2015 Outlook July 31
2015 Outlook
Current
2015 Outlook Rationale
2015 Revenue
Growth
(No acquisitions)
~$8.9 B
9%
~$9.1 B+
10%+
• Higher than expected 2H 2014
revenue, strength across all
businesses and increasing
confidence in Jublia
Gross Margins 74% 75%
• Q3 and Q4 gross margins
better than expected
• Expected improved mix,
declining Xenazine revenue
and current cost improvement
initiatives
SG&A Margins
Low to mid
20% as % of
revenue
Low to mid
20% as % of
revenue
• ~23% - 24%
• Will continue to invest in
launch products in 2015
Cash EPS
Assuming no acquisitions
~$9.40
~$10.00
• Cash EPS Growth Assuming
No Acquisitions
• July 31st – 17%
• Oct 20th – 21%
Acquisitions -
Leverage stays at ~4.0x
or below
~$9.90 ~$10.70

Allergan Update

34
Allergan Update
We remain focused on completing the Allergan Transaction
Record date to vote at Special Meeting is October 30th
With T+3 settlement, shares need to be purchased by October 27th
Special Meeting will be held December 18th
Allergan shareholders need to remove a majority of directors in order for Allergan
to be compelled to negotiate
The economic choice is clear
Receive greater than ~$20.00 of 2016 EPS per Allergan share in a combination
with Valeant vs. ~$10.00 standalone Allergan EPS
VRX + AGN combination will generate significantly more synergies than any
other combination

Appendix: Organic Growth Detail

36
Same Store Organic Growth Calculation
SAME STORE SALES ORGANIC GROWTH CURRENT YEAR PRIOR YEAR
Quarterly Product Sales 2,023.5 1,511.3
Subtract: Prior Year Revenue for Acquired
Businesses (1)
343.5 -
Add/(Subtract): Year over Year Fx impact 24.9
Subtract: Divestitures and Discontinuations 81.7
Basis for Organic Growth Calculation 1,704.9 A 1,429.6 B
Same Store Organic Growth % = (A-B)/B 19%
(1) Revenue is subtracted for the period of time that the business was not owned in the prior year. For example, B+L was acquired on
August 5th, 2013 so revenues from Jul 1 - Aug 5 2013 are excluded from the current year revenues

37
Pro Forma Organic Growth Calculation
PRO FORMA ORGANIC GROWTH CURRENT YEAR PRIOR YEAR
Quarterly Product Sales ($M) 2,023.5 1,511.3
Add: Prior Year Revenue for Acquired Businesses (1) - 340.9
Add/(Subtract): Year over Year Fx impact 25.0
Subtract: Divestitures and Discontinuations 81.7
Basis for Organic Growth Calculation 2,048.5 A 1,770.5 B
Pro Forma Organic Growth % = (A-B)/B 16%
(1) Revenue is added for the period of time that the business was not owned in the prior year. For example, B+L was acquired on
August 5th, 2013 so revenues from Jul 1 - Aug 5 2013 are added to the prior year revenues

Appendix: Accounts Receivable Details

39
Accounts Receivable
Q1 14 Q2 14 Q3 14 YTD 14
Gross Revenue (A) 2,451 2,750 2,980 8,180
Provisions for Returns, Rebates and Allowances 599 756 957 2,312
Net Revenue 1,851 1,994 2,023 5,868
Percentage of provisions to gross sales 24% 27% 32% 28%
Gross Accounts Receivable (B) 1,955 2,022 2,112
Provisions for Cash Discounts, Chargebacks, DSA fees and Doubtful
Accounts 249 251 231
Net Accounts Receivable 1,706 1,771 1,880
Days Sales Outstanding = B/(A/90) 72 66 64

Appendix: Dermatology Rx Branded Share Among Dermatologists

41
Solodyn is capturing 48% of the Dermatologist share
CONFIDENTIAL
Source: PHAST Prescription Weekly & AF Data (week ending 10/10/14)

42
Acanya Has 88% Share Among Dermatologists
CONFIDENTIAL
Source: PHAST Prescription Weekly & AF Data (week ending 10/10/14)

43
Ziana (20% share) and Atralin (15% share) have grown in
Dermatologists over the last 4 weeks
CONFIDENTIAL
Source: PHAST Prescription Weekly & AF Data (week ending 10/10/14)

44
Elidel continues to widen the share gap at 52% share among
Dermatologists
CONFIDENTIAL
Source: PHAST Prescription Weekly & AF Data (week ending 10/10/14)

45
Zyclara has 41% share among Dermatologists
CONFIDENTIAL
Source: PHAST Prescription Weekly & AF Data (week ending 10/10/14)

Third Quarter 2014
Financial Results
Conference Call
October 20, 2014