3 infosys (inftec) | 930content.icicidirect.com/mailimages/idirect_infosys_q4fy17.pdfthough infosys...
TRANSCRIPT

April 13, 2017
ICICI Securities Ltd | Retail Equity Research
Result Update
Tweaks margin band, Payout Policy…
Infosys’ Q4FY17 performance was below our expectation on the
operational front. US$ revenues grew 0.7% QoQ to $2,569 million,
below 1.7% growth and $2,594.6 million estimate. Constant currency
revenues were flat QoQ vs. our estimate of 2% QoQ
Rupee revenues declined 0.9% QoQ to | 17,120 crore, below our
0.5% QoQ growth and | 17,358 crore estimate
EBIT margins at 24.6% declined 50 bps QoQ and were below our
estimate of 25.1% largely on account of slower revenue growth
Reported PAT of | 3,603 crore was above our | 3,569.5 crore
estimate led by lower tax expense
The company announced a dividend of | 14.75 per share
Guides for CC revenue guidance of 6.5-8.5% for FY18E…
Infosys’ dollar revenues grew 0.7% sequentially to $2,569 million, below
our 1.7% growth and $2,594.6 million estimate. Constant currency
revenues were flat QoQ owing to weaker execution and drag in India
geography revenues (declined 6.9% in CC terms) and retail, CPG &
Lifesciences (declined 3.1% in CC terms). Going ahead, the management
is optimistic about BFSI while retail and hi-tech could see some softness
in the coming quarters. The company has guided for 6.5-8.5% CC
revenue growth vs. our estimate of 7-9% citing a challenging demand
environment and uncertain client spending among a few verticals. The
revenue guidance implies growth of 2.1-2.9% QoQ over the next four
quarters. Furthermore, the management remained optimistic about
adoption of new offerings Skava, Mana, Panaya and Edge across verticals
and cited that revenues from these offerings grew at ~20% YoY in FY17.
Lowers EBIT margin band to 23-25% in FY18E…
Infosys’ EBIT margins declined 50 bps QoQ to 24.6% in Q4FY17 below
our expectation of 25.1%. Margins declined owing to rupee appreciation
(35 bps impact), decline in realisation (65 bps impact) offset by cross
currency tailwind and revenue hedges (50 bps) and operational efficiency.
The management revised its targeted EBIT margin band downward to 23-
25% vs. 24-26% earlier due to rupee appreciation (70 bps impact), ramp
up of onsite development centres in US to mitigate any visa concerns.
Recast of capital allocation policy…
The Board revised the capital allocation policy of the company after taking
into consideration the strategic and operational cash requirements of
Infosys in the medium term. The company plans to pay ~| 13,000 crore
via dividend/share buyback to shareholders in FY18E. Additionally,
effective from FY18E, Infosys revised its payout policy to 70% of free cash
flow from ~50% of PAT earlier. The revised capital allocation policy
seems to be a positive step in shareholder value creation.
Maintain BUY with revised target price of | 1060…
Though Infosys surprised negatively on the EBIT margin guidance front,
we believe the current market price is already priced in. Currently, it is
trading at attractive valuation of ~13.2x FY19 EPS & offers FY19 FCF yield
of ~5%. Secondly, Infosys intends to return part of the cash and recast
capital allocation policy that are steps in the right direction towards
shareholder value creation. Hence, we maintain our BUY
recommendation on the stock. We also roll over to FY19E and revise our
target price to | 1060 (15x FY19E).
Rating matrix
Rating : Buy
Target : | 1060
Target Period : 12 months
Potential Upside : 14%
What’s Changed?
Target Changed from |1110 to |1060
EPS FY18E Changed from | 69.2 to | 64.6
EPS FY19E Introduced at | 70.7
Rating Unchanged
Quarterly Performance
Q4FY17 Q4FY16 YoY (%) Q3FY17 QoQ (%)
Revenue 17,120 16,550 3.4 17,273 (0.9)
EBIT 4,212 4,220 (0.2) 4,334 (2.8)
EBIT (%) 24.6 25.5 -90 bps 25.1 -49 bps
PAT 3,603 3,598 0.1 3,707 (2.8)
Key Financials
| Crore FY16 FY17E FY18E FY19E
Net Sales 62,441 68,485 71,406 79,411
EBITDA 17,079 18,605 18,851 21,123
Net Profit 13,491 14,353 13,983 15,315
EPS (|) 59.0 62.8 64.6 70.7
Valuation summary
FY16 FY17E FY18E FY19E
P/E 15.8 14.8 14.4 13.1
Target P/E 18.0 16.9 16.4 15.0
EV / EBITDA 10.4 9.3 9.6 8.3
P/BV 3.4 3.1 3.2 2.9
RoNW (%) 21.8 20.8 22.3 21.7
RoCE (%) 30.2 28.8 31.0 30.5
Stock data
Particular Amount
Market Capitalization (| Crore) 212,553.7
Total Debt -
Cash and Investments 32,697.0
EV (| Crore) 178,045.7
52 week H/L 1278 / 900
Equity capital 1,144.0
Face value | 5
Price performance (%)
1M 3M 6M 12M
TCS (6.8) 3.9 1.1 (1.6)
Infosys (6.4) (0.2) (4.3) (16.9)
Wipro (0.1) 6.1 5.0 (8.9)
HCL Tech (2.6) (0.8) 3.1 (0.2)
Research Analysts
Deepak Purswani, CFA
Deepti Tayal
Infosys (INFTEC) | 930
ICICI Securities Ltd | Retail Equity Research Page 2
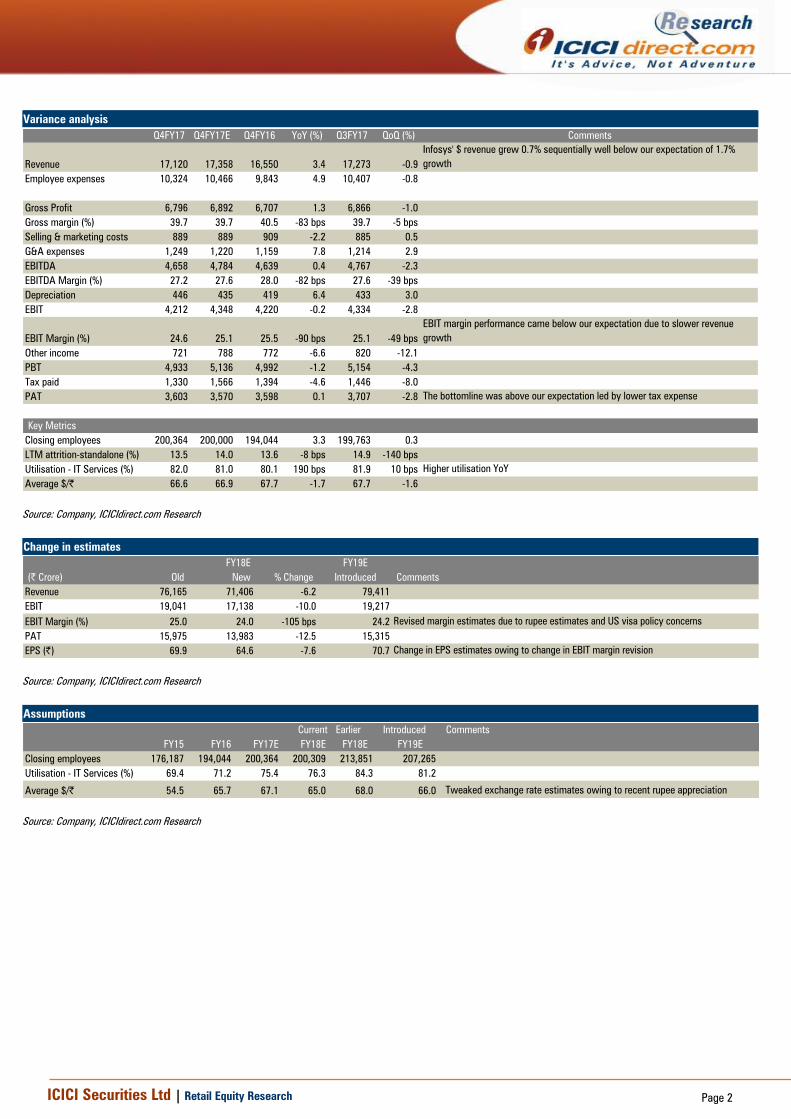
Variance analysis
Q4FY17 Q4FY17E Q4FY16 YoY (%) Q3FY17 QoQ (%) Comments
Revenue 17,120 17,358 16,550 3.4 17,273 -0.9
Infosys' $ revenue grew 0.7% sequentially well below our expectation of 1.7%
growth
Employee expenses 10,324 10,466 9,843 4.9 10,407 -0.8
Gross Profit 6,796 6,892 6,707 1.3 6,866 -1.0
Gross margin (%) 39.7 39.7 40.5 -83 bps 39.7 -5 bps
Selling & marketing costs 889 889 909 -2.2 885 0.5
G&A expenses 1,249 1,220 1,159 7.8 1,214 2.9
EBITDA 4,658 4,784 4,639 0.4 4,767 -2.3
EBITDA Margin (%) 27.2 27.6 28.0 -82 bps 27.6 -39 bps
Depreciation 446 435 419 6.4 433 3.0
EBIT 4,212 4,348 4,220 -0.2 4,334 -2.8
EBIT Margin (%) 24.6 25.1 25.5 -90 bps 25.1 -49 bps
EBIT margin performance came below our expectation due to slower revenue
growth
Other income 721 788 772 -6.6 820 -12.1
PBT 4,933 5,136 4,992 -1.2 5,154 -4.3
Tax paid 1,330 1,566 1,394 -4.6 1,446 -8.0
PAT 3,603 3,570 3,598 0.1 3,707 -2.8 The bottomline was above our expectation led by lower tax expense
Key Metrics
Closing employees 200,364 200,000 194,044 3.3 199,763 0.3
LTM attrition-standalone (%) 13.5 14.0 13.6 -8 bps 14.9 -140 bps
Utilisation - IT Services (%) 82.0 81.0 80.1 190 bps 81.9 10 bps Higher utilisation YoY
Average $/| 66.6 66.9 67.7 -1.7 67.7 -1.6
Source: Company, ICICIdirect.com Research
Change in estimates
FY18E FY19E
(| Crore) Old New % Change Introduced Comments
Revenue 76,165 71,406 -6.2 79,411
EBIT 19,041 17,138 -10.0 19,217
EBIT Margin (%) 25.0 24.0 -105 bps 24.2 Revised margin estimates due to rupee estimates and US visa policy concerns
PAT 15,975 13,983 -12.5 15,315
EPS (|) 69.9 64.6 -7.6 70.7 Change in EPS estimates owing to change in EBIT margin revision
Source: Company, ICICIdirect.com Research
Assumptions
Current Earlier Introduced Comments
FY15 FY16 FY17E FY18E FY18E FY19E
Closing employees 176,187 194,044 200,364 200,309 213,851 207,265
Utilisation - IT Services (%) 69.4 71.2 75.4 76.3 84.3 81.2
Average $/| 54.5 65.7 67.1 65.0 68.0 66.0 Tweaked exchange rate estimates owing to recent rupee appreciation
Source: Company, ICICIdirect.com Research

ICICI Securities Ltd | Retail Equity Research Page 3
Company Analysis
Revisits its CC revenue guidance to 6.5-8.5% in FY18E …
The company has guided for 6.5-8.5% CC revenue growth vs. our
estimate of 7-9% citing challenging environment and uncertain client
spending among few verticals. We now anticipate Infosys US$ revenue
will grow 7.6%, 9.5% in FY18E, FY19E, respectively. The management
said revenues from new software and software related services including
Mana, Panaya, Skava and Edge grew ~42% YoY in FY17. Infosys has
appointed Independent Director Ravikumar Venkatesan as Co-Chairman
of the Board.
Infosys won six large deals worth US$806 million during the quarter
implying a growth rate of ~6.5% YoY. Total order book for FY17 was up
~25% YoY. The aspirational target is to get total contract value (TCV) to
$1 billion. We believe strong deal wins may witness healthy growth in
FY18E.
Exhibit 1: Dollar revenues may grow at 8.2% CAGR in FY16-19E vs. 9.5% CAGR in FY11-16 7398
8249
8711
2256
2392
2407
2446
9501
2501
2587
2551
2569
10208
10986
12032
5.8
11.5
5.65.8
8.7
8.5
13.3
9.1
10.9
8.2
6.05.0
7.47.6
9.5
0.0
2.0
4.0
6.0
8.0
10.0
12.0
14.0
0
2000
4000
6000
8000
10000
12000
14000
FY13
FY14
FY15
Q1FY16
Q2FY16
Q3FY16
Q4FY16
FY16
Q1FY17
Q2FY17
Q3FY17
Q4FY17
FY17E
FY18E
FY19E
$ m
illion
Dollar revenue Growth, YoY
Source: Company, ICICIdirect.com Research
Exhibit 2: Infosys growth vs. Nasscom guidance
5.8
11.5
5.6
9.17.7
9.1 8.6
13.0 13.0 13
9.0
9.0
8.0 7.0
10.2
-5
3
11
19
27
35
FY13 FY14 FY15 FY16 FY17E
%
Growth, YoY Company guidance (mid-point) NASSCOM guidance (mid-point)
Source: Company, ICICIdirect.com Research
Optimistic about BFSI…
Among geographies, North America (62.3% of revenue) grew 1.2% in CC
while Europe (22.1% of revenue), India (3.2%) and RoW (12.4%)
witnessed a decline of 1.6%, 6.9% and 1.3% QoQ in CC terms,
respectively. Among industries, BFSI (33.5% of revenue) grew 0.5% in CC
basis while manufacturing (22.4%) was flat QoQ. RCL (22.7%) and ECS

ICICI Securities Ltd | Retail Equity Research Page 4
(21.4%) witnessed 3.1% and 2.8% CC decline, respectively. Going ahead,
the management is optimistic about BFSI while retail and hi-tech could
see some softness in coming quarters.
Client metric among US$ 50 million+ bucket increases by 2…
Client additions were muted as Infosys added 71 gross clients during the
quarter (vs. 77, 78, 95 in Q3, Q2, Q1, respectively) taking the active client
base to 1,162 compared to 1152, 1136, 1126 in Q3FY17, Q2FY17, and
Q1FY17 end, respectively. Across bands, client concentration grew by
one to 19 in $100 million+ bucket while seven clients transitioned to $5
million+ bucket. Overall, $1 million+ customers increased by seven to
598. Top client revenue contribution inclined to 3.3% from 3.1% in
Q3FY17. Revenue per full time equivalent (FTE) for consolidated business
increased 0.4% QoQ to $51,400 vs. $51,200 in Q3 and expanded 1.4%
YoY. The aspirational target of the management is to achieve revenue per
FTE of $80,000 by 2020 while 30% operating margins remain intact
despite multiple headwinds.
Exhibit 3: Client contribution $1 million+ increases by seven to 598 in Q4FY17
448
529 535 542 555 558 558574 577 591 598
0
100
200
300
400
500
600
700
FY13
FY15
Q1FY16
Q2FY16
Q3FY16
Q4FY16
FY16
Q1FY17
Q2FY17
Q3FY17
Q4FY17
x
Clients contributing $1 million+
Source: Company, ICICIdirect.com Research
Rupee appreciation & visa concerns to overweigh on margins…
Infosys EBIT margins declined 50 bps QoQ to 24.6% in
Q4FY17 below our expectation of 25.1%. Margins declined owing to
rupee appreciation (35 bps impact), decline in realisation (65 bps impact)
offset by cross currency tailwind and revenue hedges (50 bps) and
operational efficiency. The management revised its targeted EBIT margin
band downward to 23-25% vs. 24-26% earlier possibly on account of
rupee appreciation, ramp up of onsite development centres in US to
mitigate any visa concerns. Going ahead, any adverse change made to
H1-B visa cost could impact margins, which are not factored in current
margin expectations.

ICICI Securities Ltd | Retail Equity Research Page 5
Exhibit 4: Expect FY18E margins to decline 70 bps YoY to 24%
25.8
24.0
25.9
24.0
25.524.9
25.525.0
24.1
24.9 25.124.6 24.7
24.0 24.2
20
23
26
29
32
35
FY13
FY14
FY15
Q1FY16
Q2FY16
Q3FY16
Q4FY16
FY16
Q1FY17
Q2FY17
Q3FY17
Q4FY17
FY17E
FY18E
FY19E
%
EBIT margin
Source: Company, ICICIdirect.com Research
Attrition declines consecutively for last four quarters…
Attrition declined 140 bps QoQ to 13.5% in Q4FY17 with attrition at top
performer level reducing to single digits. Utilisation (ex-trainees) saw an
increase of 190 bps YoY to 82% in Q4 leading to utilisation level
consistently higher than 80% in last eight quarters mainly due to
optimisation. We expect utilisation to be ~80%, 81% in FY18E, FY19E,
respectively.
Exhibit 5: Attrition declines 140 bps QoQ to 13.5%
16.3
18.7 18.9
14.2 14.113.4
12.6
13.6
15.8 15.7
14.9
13.5
10
13
16
19
22
25
FY13
FY14
FY15
Q1FY16
Q2FY16
Q3FY16
Q4FY16
FY16
Q1FY17
Q2FY17
Q3FY17
Q4FY17
%
LTM attrition - standalone
Source: Company, ICICIdirect.com Research
Exhibit 6: Utilisation to be key lever in maintaining margin
70.7
76.4
80.980.2
81.380.6
80.180.6 80.5
82.581.9 82.0 81.7
80.0
81.0
65
70
75
80
85
FY13
FY14
FY15
Q1FY16
Q2FY16
Q3FY16
Q4FY16
FY16
Q1FY17
Q2FY17
Q3FY17
Q4FY17
FY17E
FY18E
FY19E
%
Utilisation - IT Services (ex-trainees)
Source: Company, ICICIdirect.com Research

ICICI Securities Ltd | Retail Equity Research Page 6
Outlook and valuation
Infosys reported marginal dollar revenue growth for Q4FY17 while EBIT
margins came in below our estimates by ~50 bps. The company has
guided for 6.5-8.5% CC revenue growth, which translates to dollar
revenue growth of 6.1-8.1% (based on March 31, 2017 rates). The
company had revised its targeted EBIT margin band downward to 23-25%
vs. 24-26% earlier possibly on account of rupee appreciation and rising
visa cost.
Though Infosys surprised negatively on the EBIT margin guidance front,
we believe the market has already priced it in. Currently, it is trading at
attractive valuation of ~13.2x FY19 EPS & offers FY19 FCF yield of ~5%.
Secondly, Infosys intends to return part of cash and recasting capital
allocation policy are steps in right direction towards shareholder value
creation. Hence, we maintain our BUY recommendation. We also roll over
to FY19E and revise our target price to | 1060 (15x FY19E). We have
lowered target multiple at 15x due to slowing growth trajectory, growing
protectionism measures leading to risk in margin profile.
Exhibit 7: One year forward rolling PE
0
300
600
900
1200
1500
1800
Apr-
07
Oct-
07
Apr-
08
Oct-
08
Apr-
09
Oct-
09
Apr-
10
Oct-
10
Apr-
11
Oct-
11
Apr-
12
Oct-
12
Apr-
13
Oct-
13
Apr-
14
Oct-
14
Apr-
15
Oct-
15
Apr-
16
Oct-
16
Apr-
17
Price 26 22 18 14 10
Source: Company, ICICIdirect.com Research
Exhibit 8: Valuation
Sales Growth EPS Growth PE EV/EBITDA RoNW RoCE
(| cr) (%) (|) (%) (x) (x) (%) (%)
FY16 62,441 17.1 59.0 9.4 15.8 10.4 21.8 30.2
FY17E 68,485 9.7 62.8 6.4 14.8 9.3 20.8 28.8
FY18E 71,406 4.3 64.6 2.9 14.4 9.6 22.3 31.0
FY19E 79,411 11.2 70.7 9.5 13.1 8.3 21.7 30.5
Source: Company, ICICIdirect.com Research

ICICI Securities Ltd | Retail Equity Research Page 7
Recommendation History vs. Consensus
0.0
10.0
20.0
30.0
40.0
50.0
60.0
70.0
80.0
90.0
0
200
400
600
800
1,000
1,200
1,400
1,600
Apr-17Jan-17Nov-16Sep-16Jun-16Apr-16Jan-16Nov-15Aug-15Jun-15Apr-15
(%
)(|)
Price Idirect target Consensus Target Mean % Consensus with BUY
Source: Bloomberg, Company, ICICIdirect.com Research
Key events
Date Event
Sep-16 According to media, Infosys executive Vice President Sanjay Purohit resigned , making it the seventh key executive to quit since Vishal Sikka joined
Oct-16
Infosys launches blockchain pilot network for international remittances and trade finance with leading Indian private bank and with leading banking group in Middle
East, Emirates NBD
Nov-16
Infosys invested in US based start-up, TidalScale making it the 10th investment in a start-up from its $500 million innovation fund, though only 3rd investment in
CY16
Nov-16
Media article suggest Infosys has bagged a contract from Council of Europe.. As part of the contract Infosys would upgrade human resource management and
payroll system.
Nov-16 Infosys has made an investment of ~ 14.49 crore in UNSILO, a Danish artificial intelligence startup focussed on advanced text analysis
Nov-16 Infosys invests | 31.6 crore in Stellaris Venture Partners, an India based early stage venture fund.
Jan-17
Infosys General Counsel and Chief Compliance officer David Kennedy has quit the company marking the eighth high-profile resignation in Infosys in Vishal Sikka's
two-year reign.
Feb-17
According to media sources, Infosys is planning for buy-back worth | 12,000 crores approximately. Currently Infosys has liquid assets including cash and cash
equivalents and investments to the tune of | 35,697 crore as on December 31, 2016.
Feb-17
Infosys has changed norms for severance pay of its management team. Benchmarking has been done for severance pay according to each country and has
reworked the senior management contract to reflect it.
Mar-17 Infosys Finacle, part of EdgeVerve systems (subsidiary of Infosys) has been selected by Housing bank Algeria (Middle East) to power its bank operations.
Mar-17
Infosys shareholders have approved the proposal to adopt a new AoA, revision in compensation of COO & Whole-time Director U B Pravin Rao, and also appointment
of D N Prahlad as an Independent Director.
Source: Company, ICICIdirect.com Research
Top 10 Shareholders Shareholding Pattern
Rank Name Latest Filing Date % O/S Position (m) Change (m)
1 Life Insurance Corporation of India 31-Dec-16 6.6% 151.7 3.4
2 Gopalakrishnan (Sudha) 31-Dec-16 3.1% 70.8 0.0
3 OppenheimerFunds, Inc. 28-Feb-17 2.6% 60.5 9.2
4 GIC Private Limited 31-Dec-16 2.4% 55.0 1.4
5 BlackRock Institutional Trust Company, N.A. 31-Mar-17 2.3% 51.7 2.8
6 Invest AD 31-Dec-16 1.7% 40.0 -2.2
7 HDFC Asset Management Co., Ltd. 31-Dec-16 1.5% 33.8 3.6
8 Murthy (Rohan) 31-Dec-16 1.4% 31.8 0.0
9 ICICI Prudential Life Insurance Company Ltd. 31-Dec-16 1.2% 28.0 -21.9
10 The Vanguard Group, Inc. 30-Sep-16 1.2% 27.9 -23.0
(in %) Jun-16 Sep-16 Dec-16
Promoter 12.75 12.75 12.75
Public 86.76 86.76 86.76
Others 0.49 0.49 0.49
Total 100.00 100.00 100.00
Source: Reuters, ICICIdirect.com Research
Recent Activity
Investor name Value Shares Investor name Value Shares
OppenheimerFunds, Inc. 139.2m 9.2m The Vanguard Group, Inc. -358.6m -23.0m
HDFC Asset Management Co., Ltd. 53.9m 3.6m ICICI Prudential Life Insurance Company Ltd. -326.1m -21.9m
Templeton Asset Management Ltd. 51.7m 3.5m Lyxor Asset Management -108.3m -6.9m
Life Insurance Corporation of India 49.9m 3.4m Invest AD -32.7m -2.2m
TIAA Global Asset Management 43.1m 2.9m T. Rowe Price International (UK) Ltd. -27.3m -1.8m
Buys Sells
Source: Reuters, ICICIdirect.com Research

ICICI Securities Ltd | Retail Equity Research Page 8
.
Financial summary
Profit and loss statement | Crore
(Year-end March) FY16 FY17E FY18E FY19E
Total operating Income 62,441 68,485 71,406 79,411
Growth (%) 17.1 9.7 4.3 11.2
COGS (employee expenses) 37,639 41,550 43,629 48,520
Admin expenses 4,292 4,739 4,998 5,559
S&M expenses 3,431 3,591 3,927 4,209
Total Operating Expenditure 45,362 49,880 52,555 58,287
EBITDA 17,079 18,605 18,851 21,123
Growth (%) 14.6 8.9 1.3 12.1
Depreciation 1,459 1,703 1,714 1,906
Other Income 3,125 3,079 2,452 2,389
PBT 18,742 19,951 19,557 21,570
Total Tax 5,251 5,598 5,574 6,255
PAT 13,491 14,353 13,983 15,315
Growth (%) 9.4 6.4 (2.6) 9.5
EPS (|) 59 63 65 71
Growth (%) 9.4 6.4 2.9 9.5
Source: Company, ICICIdirect.com Research
Cash flow statement | Crore
(Year-end March) FY16 FY17E FY18E FY19E
Profit after Tax 13,491 14,353 13,983 15,315
Add: Depreciation 1,459 1,703 1,714 1,906
(Inc)/dec in Current Assets (3,096) (1,820) (880) (2,411)
Inc/(dec) in CL and Provisions 842 769 372 1,018
Taxes paid (5,865) (5,598) (5,574) (6,255)
CF from operating activities 12,243 11,925 12,736 13,439
(Inc)/dec in Investments* 88 3,079 2,452 2,389
(Inc)/dec in Fixed Assets (2,723) (2,500) (2,500) (2,500)
CF from investing activities (3,116) 579 (48) (111)
Dividend paid & dividend tax (6,813) (7,119) (7,165) (7,657)
Others - - - -
CF from financing activities (6,813) (7,119) (20,165) (7,657)
Net Cash flow 2,314 5,385 (7,477) 5,671
Exchange difference 16 - - -
Opening Cash 30,367 32,697 38,083 30,606
Closing Cash 32,697 38,083 30,606 36,277
Source: Company, ICICIdirect.com Research
Balance sheet | Crore
(Year-end March) FY16 FY17E FY18E FY19E
Equity Capital 1,144 1,144 1,084 1,084
Reserve and Surplus 60,635 67,869 61,747 69,405
Total Shareholders funds 61,779 69,013 62,831 70,489
Employee benefit obligations - - - -
Debt - - - -
Deferred Tax Liability 256 256 256 256
Other non current liabilties 115 115 115 115
Total Liabilities 62,150 69,384 63,202 70,860
Assets
Property,plant and equipment 10,530 11,327 12,113 12,707
Goodwill 3,764 3,764 3,764 3,764
Intangibles 985 985 985 985
Available for sale assets 1,811 1,811 1,811 1,811
Other assets 6,604 6,604 6,604 6,604
Cash 32,697 38,083 30,606 36,277
Investment in CD - - - -
Trade receivables 11,330 12,427 12,957 14,409
Unbilled revenue 3,029 3,322 3,464 3,852
Prepayment & O.fin.assets 4,448 4,879 5,087 5,657
Other current assets 191 191 191 191
Total Current Assets 51,695 58,901 52,304 60,386
Trade payables 386 423 441 491
Unearned revenue 1,332 1,461 1,523 1,694
OCL & provisions 11,521 12,124 12,415 13,213
Total Current Liabilities 13,239 14,008 14,379 15,398
Net Current Assets 38,456 44,893 37,925 44,989
Application of Funds 62,150 69,384 63,202 70,860
Source: Company, ICICIdirect.com Research
Key ratios
(Year-end March) FY16 FY17E FY18E FY19E
Per share data (|)
EPS 59.0 62.8 64.6 70.7
Cash EPS 65.4 70.2 72.5 79.6
BV 270.3 301.9 290.3 325.6
DPS 24.5 25.8 27.5 29.4
Cash Per Share 143.0 166.6 141.4 167.6
Operating Ratios (%)
EBIT Margin 25.0 24.7 24.0 24.2
PBT Margin 30.0 29.1 27.4 27.2
PAT Margin 21.6 21.0 19.6 19.3
Debtor days 66 66 66 66
Unbilled revenue 17 17 17 17
Creditor days 2 2 2 2
Return Ratios (%)
RoE 21.8 20.8 22.3 21.7
RoCE 30.2 28.8 31.0 30.5
RoIC 65.4 65.7 63.4 66.2
Valuation Ratios (x)
P/E 15.8 14.8 14.4 13.1
EV / EBITDA 10.4 9.3 9.6 8.3
EV / Net Sales 2.9 2.5 2.5 2.2
Market Cap / Sales 3.4 3.1 3.0 2.7
Price to Book Value 3.4 3.1 3.2 2.9
Solvency Ratios
Debt/EBITDA - - - -
Debt / Equity - - - -
Current Ratio 1.9 2.0 2.0 2.0
Quick Ratio 1.9 2.0 2.0 2.0
Source: Company, ICICIdirect.com Research
ICICI Securities Ltd | Retail Equity Research Page 9
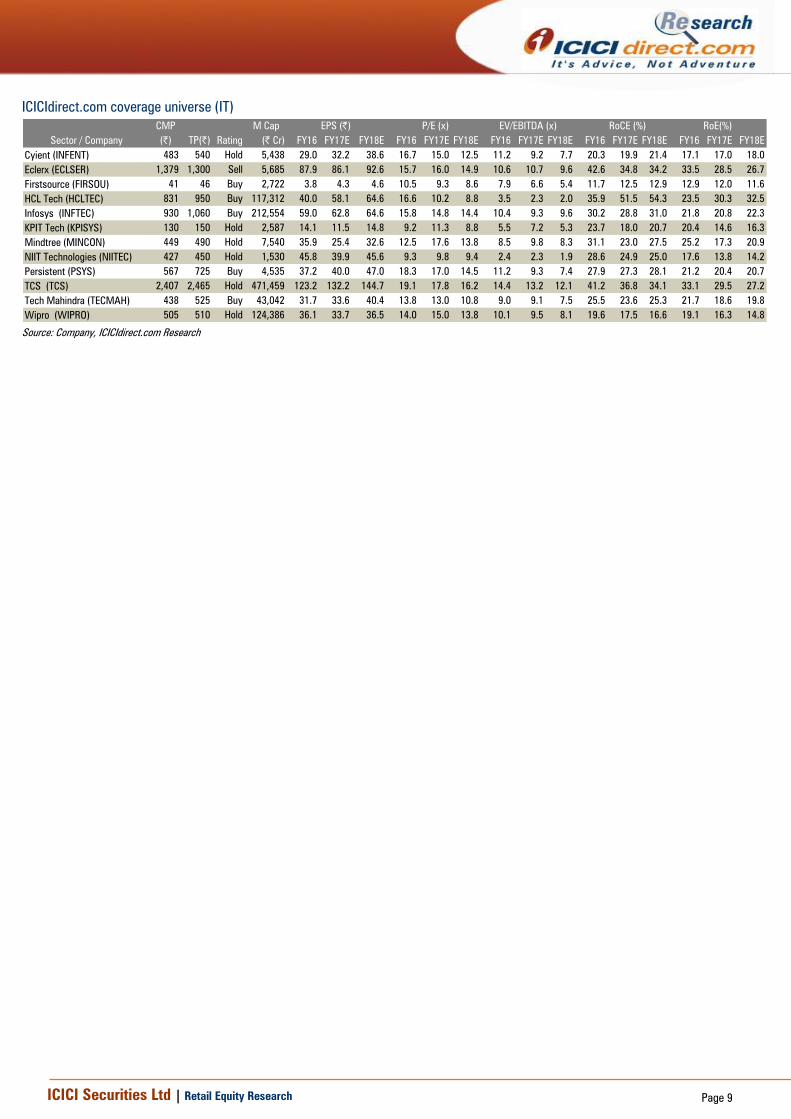
ICICIdirect.com coverage universe (IT)
CMP M Cap EPS (|) P/E (x) RoCE (%) RoE(%)
(|) TP(|) Rating (| Cr) FY16 FY17E FY18E FY16 FY17E FY18E FY16 FY17E FY18E FY16 FY17E FY18E FY16 FY17E FY18E
Cyient (INFENT) 483 540 Hold 5,438 29.0 32.2 38.6 16.7 15.0 12.5 11.2 9.2 7.7 20.3 19.9 21.4 17.1 17.0 18.0
Eclerx (ECLSER) 1,379 1,300 Sell 5,685 87.9 86.1 92.6 15.7 16.0 14.9 10.6 10.7 9.6 42.6 34.8 34.2 33.5 28.5 26.7
Firstsource (FIRSOU) 41 46 Buy 2,722 3.8 4.3 4.6 10.5 9.3 8.6 7.9 6.6 5.4 11.7 12.5 12.9 12.9 12.0 11.6
HCL Tech (HCLTEC) 831 950 Buy 117,312 40.0 58.1 64.6 16.6 10.2 8.8 3.5 2.3 2.0 35.9 51.5 54.3 23.5 30.3 32.5
Infosys (INFTEC) 930 1,060 Buy 212,554 59.0 62.8 64.6 15.8 14.8 14.4 10.4 9.3 9.6 30.2 28.8 31.0 21.8 20.8 22.3
KPIT Tech (KPISYS) 130 150 Hold 2,587 14.1 11.5 14.8 9.2 11.3 8.8 5.5 7.2 5.3 23.7 18.0 20.7 20.4 14.6 16.3
Mindtree (MINCON) 449 490 Hold 7,540 35.9 25.4 32.6 12.5 17.6 13.8 8.5 9.8 8.3 31.1 23.0 27.5 25.2 17.3 20.9
NIIT Technologies (NIITEC) 427 450 Hold 1,530 45.8 39.9 45.6 9.3 9.8 9.4 2.4 2.3 1.9 28.6 24.9 25.0 17.6 13.8 14.2
Persistent (PSYS) 567 725 Buy 4,535 37.2 40.0 47.0 18.3 17.0 14.5 11.2 9.3 7.4 27.9 27.3 28.1 21.2 20.4 20.7
TCS (TCS) 2,407 2,465 Hold 471,459 123.2 132.2 144.7 19.1 17.8 16.2 14.4 13.2 12.1 41.2 36.8 34.1 33.1 29.5 27.2
Tech Mahindra (TECMAH) 438 525 Buy 43,042 31.7 33.6 40.4 13.8 13.0 10.8 9.0 9.1 7.5 25.5 23.6 25.3 21.7 18.6 19.8
Wipro (WIPRO) 505 510 Hold 124,386 36.1 33.7 36.5 14.0 15.0 13.8 10.1 9.5 8.1 19.6 17.5 16.6 19.1 16.3 14.8
Sector / Company
EV/EBITDA (x)
Source: Company, ICICIdirect.com Research

ICICI Securities Ltd | Retail Equity Research Page 10
RATING RATIONALE
ICICIdirect.com endeavours to provide objective opinions and recommendations. ICICIdirect.com assigns
ratings to its stocks according to their notional target price vs. current market price and then categorises them
as Strong Buy, Buy, Hold and Sell. The performance horizon is two years unless specified and the notional
target price is defined as the analysts' valuation for a stock.
Strong Buy: >15%/20% for large caps/midcaps, respectively, with high conviction;
Buy: >10%/15% for large caps/midcaps, respectively;
Hold: Up to +/-10%;
Sell: -10% or more;
Pankaj Pandey Head – Research [email protected]
ICICIdirect.com Research Desk,
ICICI Securities Limited,
1st Floor, Akruti Trade Centre,
Road No 7, MIDC,
Andheri (East)
Mumbai – 400 093

ICICI Securities Ltd | Retail Equity Research Page 11
ANALYST CERTIFICATION
We /I, Deepak Purswani, CFA MBA (Finance), Deepti Tayal, MBA, Research Analysts, authors and the names subscribed to this report, hereby certify that all of the views expressed in this research report
accurately reflect our views about the subject issuer(s) or securities. We also certify that no part of our compensation was, is, or will be directly or indirectly related to the specific recommendation(s) or
view(s) in this report.
Terms & conditions and other disclosures:
ICICI Securities Limited (ICICI Securities) is a full-service, integrated investment banking and is, inter alia, engaged in the business of stock brokering and distribution of financial products. ICICI Securities
Limited is a Sebi registered Research Analyst with Sebi Registration Number – INH000000990. ICICI Securities is a wholly-owned subsidiary of ICICI Bank which is India’s largest private sector bank and has
its various subsidiaries engaged in businesses of housing finance, asset management, life insurance, general insurance, venture capital fund management, etc. (“associates”), the details in respect of which
are available on www.icicibank.com.
ICICI Securities is one of the leading merchant bankers/ underwriters of securities and participate in virtually all securities trading markets in India. We and our associates might have investment banking
and other business relationship with a significant percentage of companies covered by our Investment Research Department. ICICI Securities generally prohibits its analysts, persons reporting to analysts
and their relatives from maintaining a financial interest in the securities or derivatives of any companies that the analysts cover.
The information and opinions in this report have been prepared by ICICI Securities and are subject to change without any notice. The report and information contained herein is strictly confidential and
meant solely for the selected recipient and may not be altered in any way, transmitted to, copied or distributed, in part or in whole, to any other person or to the media or reproduced in any form, without
prior written consent of ICICI Securities. While we would endeavour to update the information herein on a reasonable basis, ICICI Securities is under no obligation to update or keep the information current.
Also, there may be regulatory, compliance or other reasons that may prevent ICICI Securities from doing so. Non-rated securities indicate that rating on a particular security has been suspended
temporarily and such suspension is in compliance with applicable regulations and/or ICICI Securities policies, in circumstances where ICICI Securities might be acting in an advisory capacity to this
company, or in certain other circumstances.
This report is based on information obtained from public sources and sources believed to be reliable, but no independent verification has been made nor is its accuracy or completeness guaranteed. This
report and information herein is solely for informational purpose and shall not be used or considered as an offer document or solicitation of offer to buy or sell or subscribe for securities or other financial
instruments. Though disseminated to all the customers simultaneously, not all customers may receive this report at the same time. ICICI Securities will not treat recipients as customers by virtue of their
receiving this report. Nothing in this report constitutes investment, legal, accounting and tax advice or a representation that any investment or strategy is suitable or appropriate to your specific
circumstances. The securities discussed and opinions expressed in this report may not be suitable for all investors, who must make their own investment decisions, based on their own investment
objectives, financial positions and needs of specific recipient. This may not be taken in substitution for the exercise of independent judgment by any recipient. The recipient should independently evaluate
the investment risks. The value and return on investment may vary because of changes in interest rates, foreign exchange rates or any other reason. ICICI Securities accepts no liabilities whatsoever for any
loss or damage of any kind arising out of the use of this report. Past performance is not necessarily a guide to future performance. Investors are advised to see Risk Disclosure Document to understand the
risks associated before investing in the securities markets. Actual results may differ materially from those set forth in projections. Forward-looking statements are not predictions and may be subject to
change without notice.
ICICI Securities or its associates might have managed or co-managed public offering of securities for the subject company or might have been mandated by the subject company for any other assignment
in the past twelve months.
ICICI Securities or its associates might have received any compensation from the companies mentioned in the report during the period preceding twelve months from the date of this report for services in
respect of managing or co-managing public offerings, corporate finance, investment banking or merchant banking, brokerage services or other advisory service in a merger or specific transaction.
ICICI Securities or its associates might have received any compensation for products or services other than investment banking or merchant banking or brokerage services from the companies mentioned
in the report in the past twelve months.
ICICI Securities encourages independence in research report preparation and strives to minimize conflict in preparation of research report. ICICI Securities or its associates or its analysts did not receive any
compensation or other benefits from the companies mentioned in the report or third party in connection with preparation of the research report. Accordingly, neither ICICI Securities nor Research Analysts
and their relatives have any material conflict of interest at the time of publication of this report.
It is confirmed that Deepak Purswani, CFA MBA (Finance), Deepti Tayal, MBA, Research Analysts of this report have not received any compensation from the companies mentioned in the report in the
preceding twelve months.
Compensation of our Research Analysts is not based on any specific merchant banking, investment banking or brokerage service transactions.
ICICI Securities or its subsidiaries collectively or Research Analysts or their relatives do not own 1% or more of the equity securities of the Company mentioned in the report as of the last day of the month
preceding the publication of the research report.
Since associates of ICICI Securities are engaged in various financial service businesses, they might have financial interests or beneficial ownership in various companies including the subject
company/companies mentioned in this report.
It is confirmed that Deepak Purswani, CFA MBA (Finance), Deepti Tayal, MBA, Research Analysts do not serve as an officer, director or employee of the companies mentioned in the report.
ICICI Securities may have issued other reports that are inconsistent with and reach different conclusion from the information presented in this report.
Neither the Research Analysts nor ICICI Securities have been engaged in market making activity for the companies mentioned in the report.
We submit that no material disciplinary action has been taken on ICICI Securities by any Regulatory Authority impacting Equity Research Analysis activities.
This report is not directed or intended for distribution to, or use by, any person or entity who is a citizen or resident of or located in any locality, state, country or other jurisdiction, where such distribution,
publication, availability or use would be contrary to law, regulation or which would subject ICICI Securities and affiliates to any registration or licensing requirement within such jurisdiction. The securities
described herein may or may not be eligible for sale in all jurisdictions or to certain category of investors. Persons in whose possession this document may come are required to inform themselves of and
to observe such restriction.