3 forest evapotranspiration: measurement and modelling at ... · for personal use only. please do...
TRANSCRIPT

For personal use only. Please do not distribute.
This chapter is in the public domain. Forest Hydrology: Processes, Management 32 and Assessment (eds D.M. Amatya, T.M. Williams, L. Bren and C. de Jong)
3.1 Introduction
Compared with traditional engineering hydrol-ogy, forest hydrology has a relatively long history of studying the effects of vegetation in regulating streamflow through evapotranspiration (Hewlett, 1982; Swank and Crossley, 1988; Andreassian, 2004; Brown et al., 2005; Amatya et al., 2011, 2015, 2016; Sun et al., 2011b; Vose et al., 2011). It is estimated that more than half of the solar energy absorbed by land surfaces is used to evaporate water (Trenberth et al., 2009). Evapo-transpiration (ET), the sum of evaporation from soil (E), canopy and litter interception (I), and plant surface and plant transpiration (T), is critical to understanding the energy, water and biogeo-chemical cycles in forests (Baldocchi et al., 2001; Levia et al., 2011).
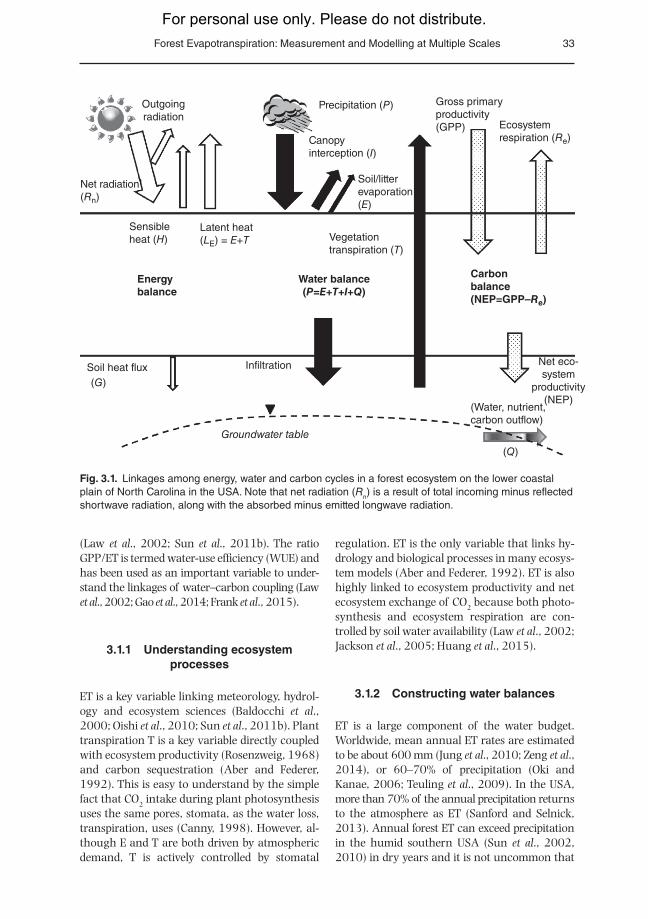
The linkage among energy, water and car-bon balances at a forest-stand level over a long time period (Fig. 3.1), in which ET plays a key role, can be described conceptually in the fol-lowing interlinked formulae (Sun et al., 2010, 2011a).Water balance:
P = ET +Q (3.1)
Energy balance:
R = L + H = ET L + Hn E × (3.2)
Carbon balance:
NEP GPP WUE R= R L = LC C− − × − −e eET
(3.3)
In the above, P is precipitation (mm), Q is runoff (mm), Rn is net radiation (W/m2), LE is latent heat (W/m2) that represents the energy used to evap-orate the amount of water by ET assuming a constant conversion factor called the latent heat of vaporization of water (L = 539 cal/g H2O = 2256 kJ/kg H2O), H is sensible heat that is con-sumed to heat the air near the forest canopy. The net ecosystem productivity (NEP; g C/m2) is the carbon balance between carbon gain by gross ecosystem productivity (i.e. plant photosynthesis) and carbon loss by ecosystem respiration (Re; g C/m2) and lateral export in stream runoff (LC; g C/m2). The magnitude of both gross primer productiv-ity (GPP; g C/m2) and Re is much larger than that of NEP and LC, and all four variables are influenced by soil moisture and the hydrology. In many cases, ET explains the majority of the seasonal variability of GPP for all ecosystems
3 Forest Evapotranspiration: Measurement and Modelling
at Multiple Scales
G. Sun1*, J.-C. Domec2,3 and D.M. Amatya4
1USDA Forest Service, Raleigh, North Carolina,USA; 2North Carolina State University, Raleigh, North Carolina, USA; 3Bordeaux Sciences AGRO, UMR1391/ISPA/INRA,
Gradignan, France; 4USDA Forest Service, Cordesville, South Carolina, USA
*Corresponding author; e-mail: [email protected]
For personal use only. Please do not distribute. Forest Evapotranspiration: Measurement and Modelling at Multiple Scales 33
(Law et al., 2002; Sun et al., 2011b). The ratio GPP/ET is termed water-use efficiency (WUE) and has been used as an important variable to under-stand the linkages of water–carbon coupling (Law et al., 2002; Gao et al., 2014; Frank et al., 2015).
3.1.1 Understanding ecosystem processes
ET is a key variable linking meteorology, hydrol-ogy and ecosystem sciences (Baldocchi et al., 2000; Oishi et al., 2010; Sun et al., 2011b). Plant transpiration T is a key variable directly coupled with ecosystem productivity (Rosenzweig, 1968) and carbon sequestration (Aber and Federer, 1992). This is easy to understand by the simple fact that CO
2 intake during plant photosynthesis uses the same pores, stomata, as the water loss, transpiration, uses (Canny, 1998). However, al-though E and T are both driven by atmospheric demand, T is actively controlled by stomatal
regulation. ET is the only variable that links hy-drology and biological processes in many ecosys-tem models (Aber and Federer, 1992). ET is also highly linked to ecosystem productivity and net ecosystem exchange of CO2 because both photo-synthesis and ecosystem respiration are con-trolled by soil water availability (Law et al., 2002; Jackson et al., 2005; Huang et al., 2015).
3.1.2 Constructing water balances
ET is a large component of the water budget. Worldwide, mean annual ET rates are estimated to be about 600 mm (Jung et al., 2010; Zeng et al., 2014), or 60–70% of precipitation (Oki and Kanae, 2006; Teuling et al., 2009). In the USA, more than 70% of the annual precipitation returns to the atmosphere as ET (Sanford and Selnick, 2013). Annual forest ET can exceed precipitation in the humid southern USA (Sun et al., 2002, 2010) in dry years and it is not uncommon that
Outgoingradiation
Precipitation (P) Gross primaryproductivity(GPP) Ecosystem
respiration (Re)Canopyinterception (I)
Vegetationtranspiration (T)
(Water, nutrient,carbon outflow)
(Q)
Net eco-system
productivity(NEP)
Soil/litterevaporation(E)
Latent heat(LE) = E+T
Soil heat flux Infiltration
Groundwater table
(G)
Sensibleheat (H)
Energybalance
Water balance(P=E+T+I+Q)
Carbonbalance(NEP=GPP–Re)
Net radiation(Rn)
Fig. 3.1. Linkages among energy, water and carbon cycles in a forest ecosystem on the lower coastal plain of North Carolina in the USA. Note that net radiation (Rn) is a result of total incoming minus reflected shortwave radiation, along with the absorbed minus emitted longwave radiation.
For personal use only. Please do not distribute.34 G. Sun et al.
ET exceeds precipitation during the growing season in forests. Vegetation affects watershed hydrology and water balances through ET (Zhang et al., 2001; Oudin et al., 2008; Ukkola and Pren-tice, 2013; Jayakaran et al., 2014). Land-use con-version (i.e. bioenergy crop expansion) can dra-matically change plant cover and biomass, affecting transpiration and evaporation rates, and therefore site water balances (King et al., 2013; Albaugh et al., 2014; Amatya et al., 2015; Christopher et al., 2015), including streamflow quantity (Ford et al., 2007; Palmroth et al., 2010; Amatya et al., 2015) and quality such as total sediment loading (Boggs et al., 2015).
3.1.3 Understanding climate change, variability and feedbacks
The ET processes are closely linked to energy par-titioning, water balances and climate systems (Betts, 2000; Bonan, 2008). ET is tightly coupled to land-surface energy balance and thus influ-ences vegetation–climate feedbacks (Bonan, 2008; Cheng et al., 2011). Changes in ET directly affect runoff, soil water storage, and local precipi-tation and temperature at the regional scale (Liu, 2011). The cooling or warming effects of refor-estation are due to the increase in ET by planted trees or altered surface albedo (Peng et al., 2014). ET may be considered an ‘air conditioner’.
Global climate change, in turn, directly af-fects the local water resources through ET (Sun et al., 2000, 2008). An increase in air tempera-ture generally means an increase in vapour pres-sure deficit and evaporative demand or potential ET, resulting in an increase in water loss by ET, and thus a decrease in groundwater recharge and soil water availability to ecosystems and human water supply. Regions that are experien-cing more warming would see more severe hydrological droughts regardless of changes in precipitation (Mann and Gleick, 2015).
3.1.4 Modelling regional ecosystem biodiversity
ET has long been regarded as an index to represent the available environmental energies and ecosys-tem productivity by bioclimatologists. Thus, ET has
been used to explain the large regional variations in plant and animal species’ richness and biodiver-sity. For example, the variability in species richness in vertebrate classes could be statistically explained by a monotonically increasing function of a single variable, potential evapotranspiration (PET) (Cur-rie, 1991). In contrast, regional tree richness was more closely related to actual ET (Currie, 1991; Hawkins et al., 2003).
3.2 Evapotranspiration Processes
Forest ET processes are inherently complex due to the many ecohydrological interactions within a forest ecosystem that often consists of multiple plant species with heterogeneous spatial distri-bution and variable microclimate over space and time (Canny, 1998). Both the physiological (e.g. stomata control) and physical processes (e.g. water potential control) influence the water va-pour movements from plant organs of roots, xylem and leaf, to stands and landscapes (i.e. watersheds). Since soil evaporation can be minor in closed-canopy forests (McCarthy et al., 1992; Domec et al., 2012b), this chapter focuses on the processes that control canopy and litter intercep-tion (I) and transpiration (T), and methods to quantify these two major components of ET.
3.2.1 Canopy and litter interception
The quantity of canopy and litter interception (I) in forests can be a large component of the ET and water balances, depending on forest structure characteristics such as leaf area index (LAI) and canopy holding capacity, and the amount of litter and litter water-holding capacity, respectively (Gash, 1979; Deguchi et al., 2006). In addition, the frequency of storms and the drying and wetting cycles affect total canopy and litter interception. Although interception can be 20–50% of the pre-cipitation, most hydrological models do not simu-late this process explicitly (Gerrits et al., 2007).
The earliest studies by Horton (1919) showed highly variable interception rates between and across species, with the spruce– fir–hemlock forest type the highest, followed by pines and then hardwoods. Helvey (1974) reported annual canopy interception as

For personal use only. Please do not distribute. Forest Evapotranspiration: Measurement and Modelling at Multiple Scales 35
17% for red pine (Pinus resinosa Ait.), 16% for ponderosa pine (Pinus ponderosa Dougl. ex. Laws.), 19% for eastern white pine and 28% for the spruce–fir–hemlock forest type. The diffe-rence in canopy interception rates between hardwood and conifer forests partially explained the observed difference in streamflow (Swank and Miner, 1968). Summer interception rates of deciduous forests in the south- eastern USA ranged from 8 to 33%, with a mean of 17%, and winter rates ranged from 5 to 22%, with a mean of 12% (Helvey and Patric, 1965). Annual can-opy interception rate was 18% for wetland sites, 20% for hardwood sites and a longleaf pine (Pi-nus palustus Mill.) plantation and 23% for pine-dominated forests in the south-eastern USA (Bryant et al., 2005). Thinning of a lob-lolly pine (Pinus taeda L.) plantation forest re-duces basal area and subsequent leaf area, re-sulting in a decrease in canopy interception (McCarthy et al., 1992). Interception rates vary between 10–35% and 5–25% for un-thinned versus thinned loblolly pine stands, respect-ively (Gavazzi et al., 2015). Forests in tropical and subtropical regions could intercept 6 to 42% of precipitation (Bryant et al., 2005). In the USA, reported annual values of litter pre-cipitation interception rate for eastern forests vary by about 2–5%, generally less than 50 mm per year (Helvey and Patric, 1965). However, lit-ter interception may be higher than canopy interception in other forest ecosystems (Gerrits et al., 2007).
3.2.2 Transpiration
The transpiration process (T) represents water loss through leaf stomata, the tiny openings found on one side or both sides of the tree leaves (Canny, 1998). Because T is an inevitable conse-quence of CO
2 assimilation by plants through photosynthesis, maintaining of leaf tissue tur-gidity and plant nutrient uptake, together with soil evaporation, T represents an ecosystem water loss and thus is a ‘necessary evil’ for net ecosystem productivity.
A global synthesis study indicates that T ac-counts for 61 ± 15% of total ET and returns ap-proximately 39 ± 10% of incident precipitation to the atmosphere, playing a great role in the global water cycle (Schlesinger and Jasechko,
2014). The T/ET ratios are highest in tropical rainforests (70 ± 14%) and lowest in steppes, shrublands and deserts (51 ± 15%). Transpir-ation is the major component of the total evapo-transpiration in global hydrological cycles and ET is highly dependent upon biophysical param-eters like stomatal conductance (Jasechko et al., 2013). Therefore, changes in transpiration due to increasing CO
2 concentrations, land-use changes, shifting ecozones, air pollution and cli-mate warming may have significant impacts on water resources (Schlesinger and Jasechko, 2014). An increase in CO2 concentrations may reduce plant leaf stomata conductance and in-crease WUE, but T can arise from increased leaf area in addition to lengthened growing seasons and enhanced evaporative demand in a warm-ing climate with increased CO2 concentration (Frank et al., 2015).
Carbon and water fluxes are coupled through the stomata activities: water vapour exits the stomata along with oxygen; carbon di-oxide flows into the stomata and is absorbed by the photosynthesis process to produce carbohy-drate (Crétaz and Barten, 2007). Transpiration is an active water translocation process that oc-curs only when water exists continuously along the soil–root–stem–branch–leaf–stomata flow pathway (Kumagai, 2011). However, transpir-ation rates differ tremendously among different tree species and ages (Plate 2). For example, a Quercus rubra tree with a 50 cm trunk diameter transpires an average of 30 kg H
2O/day, but Bet-ula lenta can transpire as high as 110 kg H2O/day under the same climate in the southern Appa-lachians in the south-eastern USA (Vose et al., 2011). A review of 52 whole-tree water use studies for 67 tree species worldwide using differ-ent techniques concluded that maximum daily water use rates for trees averaging 21 m in height were within 10–200 kg/day (Wullschleger et al., 1998).
The transpiration rates are controlled by numerous biophysical factors such as microcli-matic characteristics, atmospheric CO
2 concen-tration, soil water potential, stand characteris-tics (e.g. leaf area, species compositions, tree density) and hydraulic transport properties of plant tissues (Domec et al., 2009, 2010, 2012a). The species compositions of forests change over space and time due to natural regeneration or in response to climatic change and/or human

For personal use only. Please do not distribute.36 G. Sun et al.
Tab
le 3
.1.
A c
ompa
rison
of m
ajor
met
hods
for
estim
atin
g ev
apot
rans
pira
tion
(ET
) at
mul
tiple
sca
les.
Met
hod
Str
engt
hW
eakn
ess
Sou
rce
Dire
ct fi
eld-
base
dP
orom
eter
and
cuv
ette
Leaf
-leve
l phy
siol
ogic
al
proc
ess
Diff
icul
t to
scal
e up
due
to
unce
rtai
nty
on th
e in
fluen
ce
of b
ound
ary
laye
rs a
nd
varia
bilit
y of
leaf
age
, ra
diat
ion
and
hum
idity
Olb
rich
(199
1)
Wei
ghin
g ly
sim
eter
Sin
gle
who
le-t
ree
wat
er u
seH
igh
cost
Hea
t bal
ance
/hea
t dis
sipa
tion
sapf
low
Allo
ws
rout
ine
unsu
perv
ised
m
easu
rem
ent a
ccur
atel
y at
si
ngle
pla
nt s
cale
Larg
e-sc
ale
mea
sure
men
t er
rors
are
det
erm
ined
by
sam
ple
size
and
the
varia
bilit
y of
sam
ples
Gra
nier
(19
87)
Edd
y co
varia
nce
Mea
surin
g flu
xes
cont
inu-
ousl
y, o
fferin
g da
ta w
ith
high
tem
pora
l res
olut
ion
Hig
h co
st in
inst
rum
enta
tion,
ga
p fil
ling
requ
ired,
ene
rgy
imba
lanc
e pr
oble
ms
Bal
docc
hi e
t al.
(200
1)
Bow
en r
atio
Wor
ks fo
r bo
th c
rops
and
na
tura
l veg
etat
ion
Rel
ies
on s
ever
al a
ssum
p-tio
ns, e
rror
s as
soci
ated
with
lo
w g
radi
ents
Irm
ak e
t al.
(201
4)
Cat
chm
ent w
ater
bal
ance
Eas
y to
mea
sure
Onl
y lo
ng-t
erm
ave
rage
is
relia
ble
Ukk
ola
and
Pre
ntic
e (2
013)
Rem
ote
sens
ing
MO
DIS
Pro
vide
s hi
gh-r
esol
utio
n sp
atia
l, co
ntin
uous
and
te
mpo
ral d
ata
Unc
erta
intie
s du
e to
err
ors
gene
rate
d by
mea
sure
men
t of
spa
rse
cano
pies
, dat
a m
ostly
from
cle
ar-s
ky
cond
ition
s
Kal
ma
et a
l. (2
008)
Mat
hem
atic
al m
odel
ling
for
ET
alo
ne o
r th
e fu
ll hy
drol
ogic
al c
ycle
The
oret
ical
mod
els
(e.g
. P
enm
an–M
onte
ith
equa
tion)
Wid
ely
test
ed, i
nclu
ding
all
cond
ition
s, lo
w c
ost
Req
uire
s si
te-s
peci
fic
para
met
ers,
not
eas
y to
ap
ply
to d
ata-
poor
reg
ions
McM
ahon
et a
l. (2
013)
Isot
opes
Sta
ble
isot
ope
H a
nd O
Pro
cess
-bas
ed u
nder
stan
ding
of
wat
er s
ourc
e of
ET
; pa
rtiti
onin
g of
eva
pora
tion
and
tran
spira
tion
Cos
t and
sca
ling
up to
sta
nd
leve
lG
ood
et a
l. (2
015)
For personal use only. Please do not distribute. Forest Evapotranspiration: Measurement and Modelling at Multiple Scales 37
activities such as silviculture (i.e. reforestation, afforestation). In addition, forest ecosystem structure changes in both above-ground charac-teristics, including leaf (i.e. leaf biomass) and stem (i.e. sapwood area) (Domec et al., 2012a; Komatsu and Kume, 2015), and below ground (i.e. root biomass) over time. Little is known about water pathways between soil water and roots and the water uptake mechanism of deep roots in response to drought (Meinzer et al., 2004; Warren et al., 2007).
Different from croplands, forests have mul-tiple canopies and the understorey vegetation is an important component of a forest stand by intercepting and transpiring a significant amount of water. For example, over 20% of the total ET for a 17-year-old pine plantation was from understories (Domec et al., 2012b). Emer-gent understorey vegetation soon after harvest in the humid coastal plain was shown to have a substantial LAI, potentially affecting water bal-ance for 4–5 years until the planted pine seed-lings dominated the understorey (Sampson et al., 2011).
3.2.3 Hydraulic redistribution by roots: exchange of water at the soil–root
interface
Plants can reduce water stress by extracting water from deeper and moist soil layers through plant roots and storing it in the upper, drier soil layers for use by shallow roots. The bidirectional (upward and downward) processes are termed ‘hydraulic redistribution’ (HR) (Burgess et al., 1998). The HR process occurs widely in all water-limited vegetated environments (Meinzer et al., 2004; Neumann and Cardon, 2012). HR is a passive process that depends on the soil suc-tion head (soil water potential) and the root dis-tribution within the soil column. HR by roots acts as a large water capacitor, increasing the efficiency of whole-plant water transport, buf-fering the seasonality of ET against water stress during seasonal water deficits, and representing 20–40% of whole-stand water use (Domec et al., 2010). Even when HR represents only a rela-tively small amount of ecosystem water use (e.g. <0.5 mm/day) and just a fraction (e.g. 5–10%) of total ET during the dry period, the
partial recharge of upper soil moisture by HR is important to slow down the decline of soil water content and thus maintain water availability in topsoil layers (Warren et al., 2007). The influx of soil water maintains root water-uptake cap-acity and extends root functioning later into the drought period (Domec et al., 2004), influen-cing forest productivity (Domec et al., 2010).
3.2.4 Total evapotranspiration
The total ET rates at the ecosystem or watershed landscape level are controlled mainly by regional energy and water availability (Douglass, 1983; Zhang et al., 2001), but also are influenced by other anthropogenic management factors such as site fertilization (CO
2 effects and N deposition) (Tian, H.Q., et al., 2012; Frank et al., 2015), tree genetic improvement, species conversion (Swank and Douglass, 1974), artificial drainage (Amatya et al., 2000) and irrigation (Amatya et al., 2011). During the course of the forest stand develop-ment, site-level energy and water availability also vary, resulting in dramatic seasonal changes in total ET and its partitioning into sensible heat and other energy balance variables (Sun et al., 2010).
Forested watershed ET generally decreases soon after removal of the canopy by either har-vesting or other natural disturbances (hurri-canes, invasive species, fires, wind and snow storms, etc.) as a result of reduced canopy inter-ception and transpiration (Sun et al., 2010; Tian, S.Y., et al., 2012; Jayakaran et al., 2014; Boggs et al., 2015). However, ET generally tends to increase soon after plantation (afforestation/reforestation) and after natural regeneration (Sun et al., 2010; Jayakaran et al., 2014). Fig-ures 3.2 and 3.3 present an example of increase in annual ET after planting a harvested water-shed (Amatya et al., 2000; Amatya and Skaggs, 2001, 2011; Tian, S.Y., et al., 2012) and after natural regeneration of a watershed (Jayakaran et al., 2014) substantially impacted by hurri-cane force winds. The inter-annual variability of ET was a result of precipitation variability at both the sites, consistent with other studies (Sun et al., 2002, 2010; Ukkola and Prentice, 2013).
Forest ET rates also vary dramatically across space and time on a heterogeneous terrain.

For personal use only. Please do not distribute.38 G. Sun et al.
For example, ET rates of a forest stand are higher in the sunny side or/and near the ridges in a mountain watershed due to more solar radiation available (Douglass, 1983; Emanuel et al., 2010). Forest thinning practices reduce forest biomass, thus canopy interception and transpir-ation from remaining trees (Boggs et al., 2015), but do not necessarily reduce total ET (Sun et al., 2015).
3.3 Direct Measurement of Evapotranspiration
Forest ET processes have been quantified at multiple temporal and spatial scales from leaf to watershed, and even to global scale, using vari-ous methods from the hand-held cuvette method to the remote sensing approach (Table 3.1). The porometer method has been used to understand the environmental control on gas (CO2 and H2O) exchange at the leaf level (Olbrich, 1991).
Other methods to measure T include ventilated chambers (Denmead et al., 1993), complex models parameterized by leaf-scale physiological traits and three-dimensional tree architecture (Kumagai et al., 2014), or sap flux density based on thermal dissipation and heat transport theor-ies (Granier et al., 1996; Granier, 1987).
The sapflow technique has the advantage of not being limited by landform heterogeneity (Granier, 1987). The sapflow method measures water use by a single plant or tree, and thus an-swers questions on water use at the species and whole-stand levels. Components of forest water loss may be determined by measuring differences between total ET and tree sapflow, providing in-sights in terms of the response of water use by plants to climatic variability and stand development (Domec et al., 2012a). Sapflow measurements provide a powerful tool for quantifying plant water use and physiological responses of plants to envir-onmental conditions (Domec et al., 2009).
In contrast, the eddy covariance technique measures forest ET by calculating the covariance
01996 1999 2002 2005
Year
y = 17.2x – 33,541R2 = 0.37
2008 2011
200
400
An
nu
al E
T (
mm
)
600
800
1000
1200
1400
1600
Fig. 3.2. Annual forest ecosystem evapotranspiration (ET) calculated as the differences between measured precipitation and measured streamflow for an experimental watershed. The ET rate increases gradually following tree/forest harvest in 1995 and replanting with loblolly pine in 1997 in Carteret County, coastal North Carolina, USA.

For personal use only. Please do not distribute. Forest Evapotranspiration: Measurement and Modelling at Multiple Scales 39
between fluctuations in vertical eddy velocity and the specific water vapour content above forest canopies (Baldocchi and Ryu, 2011). The method is designed to understand the gas ex-change at the boundary layer between vegeta-tion and the atmosphere, and answers questions at the landscape scale (the footprint of the flux tower) (Baldocchi et al., 1988). The method re-lies on several assumptions such as an extensive fetch over a homogeneous surface.
Global participation in flux measurements through the FLUXNET (over 500 sites) (http://www.fluxnet.ornl.gov) since the 1990s has been a major driving force for advancing ET science (Baldocchi et al., 2001).
The Bowen ratio methods have been used in quantifying ET in croplands under various soil (tillage), crop and irrigation management (sprink-lers, subsurface drip, gravity irrigation, etc.) prac-tices through the NEBFLUX project (Irmak, 2010) and have similar accuracy to the eddy flux methods (Irmak et al., 2014). The method esti-mates ET from the ratio of sensible heat to latent heat, using air temperature and humidity gradi-ents measured above the canopy, net radiation
and soil heat flux. The fetch requirements for the Bowen ratio method are less than those for the eddy covariance method.
In addition to micrometeorological methods, stable isotopes have been used as tracers for identi-fying the sources of water uptake in ecosystems and evaluating quantitatively the relationships among water, energy and isotopic budgets. For ex-ample, tree-ring 13C is used to identify changes in WUE and soil water stress (McNulty and Swank, 1995), and 18O assists in determining whether those changes in WUE are due to changes in photosynthetic rate or stomatal conductance. Vegetation affects water/energy balance and iso-topic budget through transpiration. Recently, us-ing the D/H isotope ratios of continental runoff and evapotranspiration, independent of terres-trial hydrological partitioning, Good et al. (2015) demonstrated that globally the transpired fraction of evapotranspiration is estimated to be 56 to 74% (25th to 75th percentile), with a median of 65% and mean of 64%. Furthermore, studies across an ecosystem gradient in the USA and Mexico provided evidence of ecohydrological separation, whereby different subsurface compartmentalized
400
600
800
1000
1200
1400
1600
01990 1993 1996 1999 2002
Year2005 2008 2011 2014
200
An
nu
al E
T (
mm
)
y = 10.7x – 20,378R2 = 0.17
Fig. 3.3. Recovery of annual evapotranspiration (ET) calculated as the differences between measured precipitation and streamflow for a forested watershed that was naturally regenerated after the impact of Hurricane Hugo in 1989 at Santee Experimental Forest in coastal South Carolina, USA.

For personal use only. Please do not distribute.40 G. Sun et al.
pools of water supply either plant transpiration fluxes or the combined fluxes of groundwater and streamflow (Evaristo et al., 2015).
Estimating regional ET using satellite re-mote sensing data has emerged since the 1980s when there was an increasing interest in spatial dynamics in water use at the land-scape scale (Kalma et al., 2008). Remote sens-ing ET products such as MODIS (Moderate Resolution Image Spectroradiometer) (Mu et al., 2011) have provided spatially and tem-porally continuous ET estimates at a 1 km resolution for understanding regional hy-drology and environmental controls. How-ever, uncertainties in modelling effective sur-face emissivity and effective aerodynamic exchange resistance, and sparse canopies and cloud conditions may make the remote sensing methods less reliable (Shuttleworth, 2012). Coupling energy balance models with remotely sensed land- surface temperature retrieved from thermal infrared imagery pro-vides proxy information regarding the sur-face moisture and vegetation growth status (Anderson et al., 2012). Models such as the regional Atmosphere–Land Exchange In-verse (ALEXI) and the associated flux disag-gregation model (DisALEXI) are based on the Two Source Energy Balance (TSEB) land-sur-face representations (Kustas and Norman, 1996). These modelling systems have re-cently been applied in a lower coastal plain in North Carolina and show promise to map high-resolution ET (e.g. daily, 30 m) for a land-scape with mixed land uses with natural wet-land forests, drained pine forest with multiple stand ages, and croplands (see also Chapter 9, this volume).
Long-term and annual watershed water bal-ance ET are generally estimated using a simple water balance as the difference between meas-ured precipitation and streamflow, assuming a negligible change in storage (Wilson et al., 2001; Sun et al., 2005; Amatya and Skaggs, 2011; Ukkola and Prentice, 2013). Watershed-scale ET is also de-pendent upon its land use or the area covered by vegetation (Amatya et al., 2015) in addition to the broader controls of precipitation and potential ET. Using observed data from 109 river basins during 1961–1999, Ukkola and Prentice (2013) showed strong control by precipitation
followed by vegetation processes on ET trends and variability.
A few studies comparing multiple ET methods found that each method has its own limitations (Wilson et al., 2001; Ford et al., 2007; Domec et al., 2012b). The eddy covariance method measures fluxes continuously, offering time series data with high temporal resolution, but data availability is limited by costly site instru-mentation, gap filling issues and extensive data corrections issues. In addition, the eddy covari-ance method may underestimate ET by as much as 30% due to a lack of energy balance closure (Wilson et al., 2002). The eddy covariance tech-nique has also been shown to be problematic to underestimate ET on wet days because the sonic anemometer and infrared gas analyser must be dry to function properly (Wilson et al., 2001).
3.4 Indirect Estimates of Evapotranspiration
3.4.1 Methods based on potential evapotranspiration
Due to the high cost of trained personnel re-quirements for measuring ET directly at field and larger scales, mathematical modelling has been widely used to estimate ET (McMahon et al., 2013). ET models can be roughly div-ided into two groups: biophysical (theoretical) and empirical models. The former type of models refers to those developed based on physical and physiological principles describing energy and water transport in the soil–plant–atmosphere continuum (SPAC). Many theoretical models have evolved from the famous Penman (1948) and later from the Penman–Monteith model (Monteith, 1965) that represents the most ad-vanced process-based ET model. The Penman–Monteith model estimates ET as a function of available energy, vapour pressure deficit, air temperature and pressure, and aerodynamic and canopy resistance. In contrast, empirical ET models are models developed using empir-ical observed ET data, land cover type, bio-physical variables of plant characteristics such as LAI, soil moisture and atmospheric conditions. Empirical ET models do not intend

For personal use only. Please do not distribute. Forest Evapotranspiration: Measurement and Modelling at Multiple Scales 41
ET P PET PET= × + × + × + × ×0 174 0 502 5 31 0 0222. . . .LAI LAI (3.5)
to describe the processes of vaporization, but can give a reasonable estimate with limited en-vironmental information.
In practice, it is often rather difficult to par-ameterize the process-based ET models to esti-mate actual ET. To simplify calculations, the concept of potential ET (PET) was introduced in the 1940s. For any ecosystem, PET represents the potential maximum water loss when soil water is not limiting. Actual ET then can be scaled down from the hypothetical PET by limit-ing canopy conductance and soil moisture, and correlates to pan evaporation (Grismer et al., 2002). Such PET models are often embedded in hydrological models that can simulate the dy-namics of soil moisture, a major control on soil evaporation and transpiration (Sun et al., 1998; Tian, S.Y., et al., 2012). McMahon et al. (2013) provide a comprehensive review on conceptual PET models and the techniques to estimate ac-tual ET from open-surface waters, landscapes, catchments, deep lakes, shallow lakes, farm dams, lakes covered with vegetation, irrigation areas and bare soils.
Existing PET models can be classified into five groups (Lu et al., 2005): (i) water budget; (ii) mass transfer; (iii) combination; (iv) radiation; and (v) temperature-based. There are approximately 50 models available to estimate PET that are devel-oped considering input data availability and re-gional climate characteristics. The models give in-consistent values due to their different assumptions and input data requirements, or because they were often developed for specific climatic regions.
Numerous studies have suggested that dif-ferent PET methods may give significantly differ-ent results (Amatya et al., 1995; Lu et al., 2005; McMahon et al., 2013), so the standardized grass-reference PET method (Allen et al., 2005), ET
o, is recommended to achieve comparable re-sults across sites. Details of the computation pro-cedures for ETo are found in Allen et al. (1994). A computer program is available for public use (http://www.agr.kuleuven.ac.be/lbh/lsw/iup-ware/downloads/elearning/software/EtoCalcu-lator.pdf). Once ETo is calculated, actual ET for a
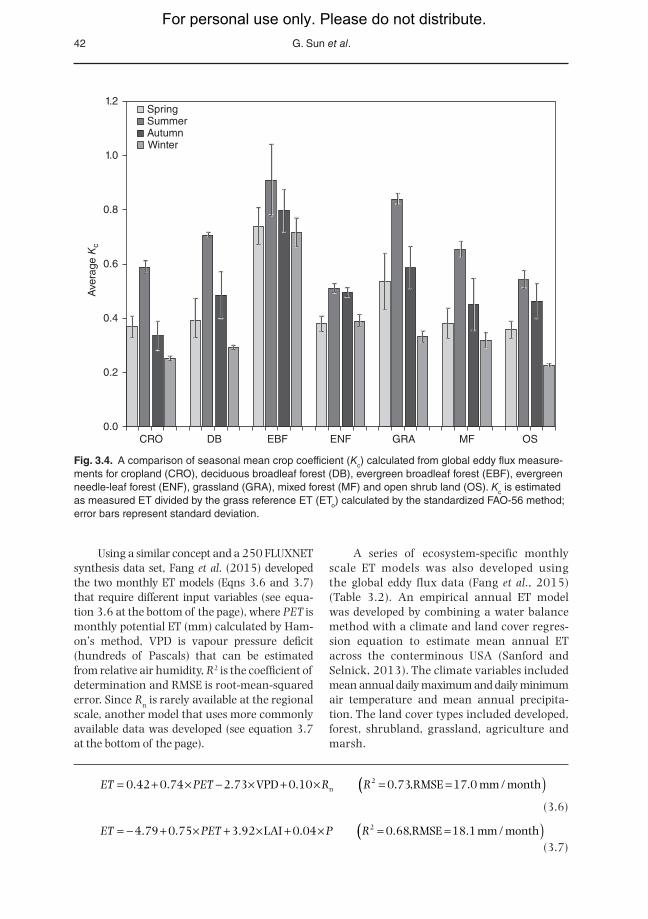
particular ecosystem type can be estimated by simply multiplying by a ‘crop coefficient, Kc’ de-veloped for that crop using ET measured by lysimeter or some other method (Allen et al., 2005; Irmak, 2010). The Kc method works well in irrigation agriculture for various croplands that have uniform phenology. However, for forests, this method can be problematic given the large variability of species composition of a forest, leaf biomass dynamics throughout the season, and the age and density effects on tree biomass and water transport properties (canopy conduct-ance, sapwood area). In addition, the reference ET concept may be misleading, because actual forest ET rates in humid climates often exceed the ET
o (Sun et al., 2010). A casual use of ETo as the maximum ET in a hydrological model may re-sult in underestimation of actual ET (Amatya and Harrison, 2016). A recent study sug-gests that Kc for any forest type may vary tremen-dously and latitude, precipitation and LAI are the best predictors of Kc (Liu et al., 2015). Forests gen-erally have higher Kc values than other ecosystem types (Fig. 3.4).
3.4.2 Empirical evapotranspiration models
Empirical ET models are derived from direct ET measurements at the ecosystem scale. Empirical models may be best used as a first-order approxi-mation of mean climatic conditions. The follow-ing model was derived from field data collected at 13 sites using a variety of methods (Sun et al., 2011a). The model estimates monthly ET as a function of LAI, ETo (mm/month) and precipita-tion P (mm/month) (see equation 3.4 at the bot-tom of the page), where ETo is the FAO (Food and Agriculture Organization) reference ET as dis-cussed above.
Other forms of the ET model use Hamon’s po-tential ET (PET) instead of the more data-demanding FAO reference ET method (Sun et al., 2011b) (see equation 3.5 at the bottom of the page).
ET ET P= + × + × + × +( )11 94 4 76 0 032 0 0026 0 15. . . . .LAI LAIo (3.4)
For personal use only. Please do not distribute.42 G. Sun et al.
Using a similar concept and a 250 FLUXNET synthesis data set, Fang et al. (2015) developed the two monthly ET models (Eqns 3.6 and 3.7) that require different input variables (see equa-tion 3.6 at the bottom of the page), where PET is monthly potential ET (mm) calculated by Ham-on’s method, VPD is vapour pressure deficit (hundreds of Pascals) that can be estimated from relative air humidity, R2 is the coefficient of determination and RMSE is root-mean-squared error. Since Rn is rarely available at the regional scale, another model that uses more commonly available data was developed (see equation 3.7 at the bottom of the page).
A series of ecosystem-specific monthly scale ET models was also developed using the global eddy flux data (Fang et al., 2015) (Table 3.2). An empirical annual ET model was developed by combining a water balance method with a climate and land cover regres-sion equation to estimate mean annual ET across the conterminous USA (Sanford and Selnick, 2013). The climate variables included mean annual daily maximum and daily minimum air temperature and mean annual precipita-tion. The land cover types included developed, forest, shrubland, grassland, agriculture and marsh.
0.0CRO DB EBF ENF GRA MF OS
0.2
0.4
0.6
Ave
rage
Kc
0.8
1.0
1.2SpringSummerAutumnWinter
Fig. 3.4. A comparison of seasonal mean crop coefficient (Kc) calculated from global eddy flux measure-ments for cropland (CRO), deciduous broadleaf forest (DB), evergreen broadleaf forest (EBF), evergreen needle-leaf forest (ENF), grassland (GRA), mixed forest (MF) and open shrub land (OS). Kc is estimated as measured ET divided by the grass reference ET (ETo) calculated by the standardized FAO-56 method; error bars represent standard deviation.
ET PET R R= + × − × + × = =0 42 0 74 2 73 0 10 0 73 17 02. . . . . . /VPD ,RMSE mm monthn (( )
(3.6)
ET PET P R= − + × + × + × = =4 79 0 75 3 92 0 04 0 68 18 12. . . . . . /LAI ,RMSE mm month(( )
(3.7)

For personal use only. Please do not distribute. Forest Evapotranspiration: Measurement and Modelling at Multiple Scales 43
The long-term mean ET in a region is con-trolled mainly by water availability (precipitation) and atmosphere demand (potential ET), and this re-lationship is well described in the Budyko frame-work (Budyko et al., 1962; Zhang et al., 2001; Zhou et al., 2015). Using the same concept, Zhang et al. (2001) analysed watershed balances data for over 250 catchments worldwide and developed a simple two-parameter ET model. The model offers a practical tool that can be readily used for assessing the long-term average effect of vegeta-tion changes on catchment evapotranspiration:
ET Pw PET P
w PET P P PET= ×
+ ( )+ ( ) + ( )
1
1
/
/ / (3.8)
where w is the plant-available water coefficient which represents the relative difference in plant water use for transpiration. PET can be esti-mated by the Priestley and Taylor (1972) model. P is annual precipitation. The best fitted value of w for forest and grassland is 2.0 and 0.5, respect-ively, when PET is estimated using the Priestley and Taylor (1972) model (Zhang et al., 2001). Sun et al. (2005) suggested that w can be as high as 2.8 when the Hamon PET method is used in applying the model for the humid south-eastern
USA, consistent with a study for a managed pine forest in the Atlantic coastal plain (Amatya et al., 2002). Kumagai et al. (Chapter 6, this volume) modified the above equation to obtain ET for tropical forests.
By combining remote sensing and climate data for 299 large river basins, Zeng et al. (2014) developed an annual ET model that has been used to estimate global ET (see equation 3.9 at the bottom of the page), where ET is basin-averaged annual evapotranspiration (mm/year), P, T and NDVI are annual precipitation (mm/year), mean annual temperature (°C) and annual normalized difference vegetation index, respectively. Simi-larly, an empirical model was developed using only mean annual temperature from 43 catch-ment water balance data sets in Japan (Komatsu et al., 2008).
3.5 Future Directions
3.5.1 Response to climate change
Climate change is the largest environmental threat to forest ecosystems in the 21st century (Vose et al., 2012). Climate warming and the
Table 3.2. Empirical models by land cover type developed using three commonly measured biophysical variables.
Land cover type Model RMSE R2 n
Shrubland ET PET P= − + × + × + ×3 11 0 39 0 09 11 127. . . . LAI 12.5 0.80 193Cropland ET PET P= − + × + × + ×8 15 0 86 0 01 9 54. . . . LAI 20.9 0.70 653Grassland ET PET P= − + × + × + ×1 36 0 70 0 04 6 56. . . . LAI 16.8 0.66 803Deciduous
forestET PET= − + × + ×14 82 0 98 2 72. . . LAI 23.7 0.74 754
Evergreen needle-leaf forest
ET PET P= + × + × + ×0 10 0 64 0 04 3 53. . . . LAI 17.8 0.68 1382
Evergreen broadleaf forest
ET PET= + × + ×7 71 0 74 1 85. . . LAI 16.8 0.76 233
Mixed forest ET PET= − + ×8 763 0 95. . 13.1 0.79 259Savannah ET PET P= − + × + × + ×5 66 0 18 0 10 44 63. . . . LAI 11.1 0.68 36
ET = evapotranspiration (mm/month); P = precipitation (mm/month); PET = potential ET estimated by Hamon’s method (mm/month); LAI = leaf area index; RMSE = root-mean-squared error; R2 = coefficient of determination; n = sample size.
ET P T= ±( )× + ±( )× + ±( )× + ±0 4 0 02 10 62 0 39 9 63 2 27 31 58 7 89. . . . . . . .NDVI (( ) =( )R2 0 85.
(3.9)

For personal use only. Please do not distribute.44 G. Sun et al.
increased variability of precipitation form, amount and timing are expected to have rip-pling effects on forest ecosystem structure and functions through directly or indirectly altering ET processes. However, because precipitation, a key environmental control of tree transpiration and soil evaporation, is uncertain and difficult to predict, we have little capacity to project ET changes at the local scale.
3.5.2 Managing evapotranspiration in a water-shortage world
Accurate quantification of watershed water budgets including water use by trees and shrubs is becoming increasingly important given the grow-ing competition for water resources among all users, from agricultural irrigation and bioenergy development to domestic water withdrawals by cities, in the Anthropocene (Sun et al., 2008). We need better simulation models to reliably account for the role of forest ET in regulating streamflow and other ecosystem services (carbon fluxes) in large basins. Land managers have long asked the question: is it practical to manage upland head-water forests to meet future water supply demand in an urbanizing world (Douglass, 1983)? We know a lot of the basic relationships among forest cover, ET and water yield, but applying the know-ledge to management remains a challenge (Vose and Klepzig, 2014). The services provided by for-ests in regulating local and regional climate (e.g. urban heat island, or cooling effects) through in-fluencing the local energy balances, ET and pre-cipitation patterns have been studied using com-puter simulation models (Liu, 2011), but these regional climate models need further parameter-ization, validation and refinement to enhance their prediction accuracy.
3.5.3 Measuring evapotranspiration everywhere all the time
Although large progress has been made in the past two decades towards measuring ET ‘everywhere all the time’ (Baldocchi et al., 2001; Baldocchi and Ryu, 2011), the study of ET is still regarded as an imprecise science (Shuttleworth, 2012). Research is needed to scale up or scale down among plot, watershed, regional and global scales to integrate
methods and data (Amatya et al., 2014). In recent years remote sensing and radar technologies have advanced rapidly and enhanced our capability to accurately quantify water use and irrigation sched-uling for croplands. However, the remote sensing applications in forest water management and water supply monitoring are rare. In fact, few studies have examined the accuracy of remote sensing-based ET products for forested areas. For-est ET measurements on the ground for calibrat-ing remote sensing models are costly and the re-mote sensing techniques are often hampered by cloud cover and the complexity of multilayered tree canopies that vary spatially and temporally. For example, leaf clustering and light saturation problems are often problematic in estimating LAI for forests. Although images with high spatial and temporal resolution obtained from unmanned aer-ial vehicles may potentially play a role for precision agriculture and irrigation scheduling in the future, the validity of this method in estimating forest ET requires a significant amount of research (Amatya et al., 2014). The best approach to estimate ET for large watersheds is achieved by combining field hydrological measurements with high-resolution remote sensing and energy balance-based land-surface modelling (Wang et al., 2015).
3.5.4 New generation of ecohydrological models
Field measurements of ET at the leaf, tree, stand and landscape scale are essential to parameter-ize process-based hydrological models that have often not been validated with spatial and tem-poral distribution of various ET components (Sun et al., 2011b). The so-called ‘equifinality’ in hydrological models is common, partially due to the lack of understanding of ET processes or the lack of ET data for model verification. To de-velop reliable predictive models, there is a great need for better understanding of the inter-actions and feedback mechanisms of ET and other ecohydrological processes (Evaristo et al., 2015), including the canopy resistance factor used in the Penman–Monteith based ET models. More information is needed about how forest ET may be affected by species, density, stand age and management (managed versus natural for-ests, fertilization, thinning) in various eco-regions. Budyko’s framework has been widely
For personal use only. Please do not distribute. Forest Evapotranspiration: Measurement and Modelling at Multiple Scales 45
References
Aber, J.D. and Federer, C.A. (1992) A generalized, lumped-parameter model of photosynthesis, evapo-transpiration and net primary production in temperate and boreal forest ecosystems. Oecologia 92, 463–474.
Albaugh, J.M., Domec, J.C., Maier, C.A., Sucre, E.B., Leggett, Z.H. and King, J.S. (2014) Gas exchange and stand-level estimates of water use and gross primary productivity in an experimental pine and switch-grass intercrop forestry system on the Lower Coastal Plain of North Carolina, USA. Agriculture and Forest Meteorology 192, 27–40.
Allen, R.G., Smith, M., Perrier, A. and Pereira, L.S. (1994) An update for the definition of reference evapo-transpiration. ICID Bulletin 43, 1–34.
Allen, R.G., Pereira, L.S., Smith, M., Raes, D. and Wright, J.L. (2005) FAO-56 dual crop coefficient method for estimating evaporation from soil and application extensions. Journal of Irrigation and Drainage Engineering–ASCE 131, 2–13.
Amatya, D.M. and Harrison, C.A. (2016) Grass and forest potential evapotranspiration comparison using five methods in the Atlantic coastal plain. ASCE Journal of Hydraulic Engineering (in press).
Amatya, D.M. and Skaggs, R.W. (2001) Hydrologic modeling of a drained pine plantation on poorly drained soils. Forest Science 47, 103–114.
Amatya, D.M. and Skaggs, R.W. (2011) Long-term hydrology and water quality of a drained pine plantation in North Carolina. Transactions of the ASABE 54, 2087–2098.
Amatya, D.M., Skaggs, R.W. and Gregory, J.D. (1995) Comparison of methods for estimating Reference-ET. Journal of Irrigation and Drainage Engineering–ASCE 121, 427–435.
Amatya, D.M., Gregory, J.D. and Skaggs, R.W. (2000) Effects of controlled drainage on storm event hydrol-ogy in a loblolly pine plantation. Journal of the American Water Resources Association 36, 175–190.
Amatya, D.M., Chescheir, G.M., Skaggs, R.W., Fernandez, G.P. and Gilliam, J.W. (2002) A watershed ana-lysis & treatment evaluation routine spreadsheet (WATERS). In: Total Maximum Daily Load (TMDL) Environmental Regulations: Proceedings of the March 11–13, 2002 Conference (Fort Worth, Texas, USA). American Society of Agricultural and Biological Engineers, St Joseph, Michigan, pp. 490–495.
Amatya, D.M., Douglas-Mankin, K.R., Williams, T.M., Skaggs, R.W. and Nettles, J.E. (2011) Advances in forest hydrology: challenges and opportunities. Transactions of the ASABE 54, 2049–2056.
Amatya, D., Sun, G. and Gowda, P. (2014) Evapotranspiration: challenges in measurement and modeling. Eos, Transactions of the AGU 95(28), 256.
Amatya, D.M., Sun, G., Rossi, C.G., Ssegane, H.S., Nettles, J.E. and Panda, S. (2015) Forests, land use change, and water. In: Zolin, C.A. and Rodrigues, R.d.A.R. (eds) Impact of Climate Change on Water Resources in Agriculture. CRC Press/Taylor & Francis, Boca Raton, Florida, pp. 116–153.
Amatya, D.M., Tian, S., Dai, Z., Sun, G. and Trettin, C. (2016) Long-term potential evapotranspiration and actual evapotranspiration of two different forests on the Atlantic coastal plain. Transactions of the ASABE (in press).
Anderson, M.C., Allen, R.G., Morse, A. and Kustas, W.P. (2012) Use of Landsat thermal imagery in monitor-ing evapotranspiration and managing water resources. Remote Sensing of Environment 122, 50–65.
Andreassian, V. (2004) Waters and forests: from historical controversy to scientific debate. Journal of Hy-drology 291, 1–27.
used to explain the mean spatial patterns of ET under land cover change (Zhou et al., 2015) and climate change (Creed et al., 2014). However, the model needs to be extended to finer temporal scale such as daily or seasonal to fully capture the dynamics of ET over time (Zhang et al., 2008; Wang et al., 2011). A new generation of eco-hydrological models that combine the effects of CO
2 on ET processes and couple the phys-ical and biological processes such as soil moisture redistribution, hydraulic distribu-tion, photosynthesis, canopy conductance
and tree growth is needed to fully understand the atmosphere–vegetation–soil processes mechanistically (Cheng et al., 2014). Such models can provide better information to re-gional land-surface and climate models for quantifying the feedbacks of forest cover change to regional and global climate systems. Oversim-plified model designs in the ET processes likely contain errors in the computation of dry-season water balances and the associated heat fluxes, and thus in the possible feedbacks between soil moisture and climate (Bonetti et al., 2015).

For personal use only. Please do not distribute.46 G. Sun et al.
Baldocchi, D.D. and Ryu, Y. (2011) A synthesis of forest evaporation fluxes – from days to years as meas-ured with eddy covariance. Ecological Studies: Analysis and Synthesis 216, 101–116.
Baldocchi, D.D., Hincks, B.B. and Meyers, T.P. (1988) Measuring biosphere–atmosphere exchanges of bio-logically related gases with micrometeorological methods. Ecology 69, 1331–1340.
Baldocchi, D., Kelliher, F.M., Black, T.A. and Jarvis, P. (2000) Climate and vegetation controls on boreal zone energy exchange. Global Change Biology 6, 69–83.
Baldocchi, D., Falge, E., Gu, L.H., Olson, R., Hollinger, D., Running, S., Anthoni, P., Bernhofer, C., Davis, K., Evans, R., et al. (2001) FLUXNET: a new tool to study the temporal and spatial variabil-ity of ecosystem-scale carbon dioxide, water vapor, and energy flux densities. Bulletin of the American Meteorological Society 82, 2415–2434.
Betts, R.A. (2000) Offset of the potential carbon sink from boreal forestation by decreases in surface albedo. Nature 408, 187–190.
Boggs, J., Sun, G. and McNulty, S.G. (2015) Effects of timber harvest on water quantity and quality in small watersheds in the piedmont of North Carolina. Journal of Forestry 114, 27–40.
Bonan, G.B. (2008) Forests and climate change: forcings, feedbacks, and the climate benefits of forests. Science 320, 1444–1449.
Bonetti, S., Manoli, G., Domec, J.C., Putti, M., Marani, M. and Katul, G.G. (2015) The influence of water table depth and the free atmospheric state on convective rainfall predisposition. Water Resources Re-search 51, 2283–2297.
Brown, A.E., Zhang, L., McMahon, T.A., Western, A.W. and Vertessy, R.A. (2005) A review of paired catch-ment studies for determining changes in water yield resulting from alterations in vegetation. Journal of Hydrology 310, 28–61.
Bryant, M.L., Bhat, S. and Jacobs, J.M. (2005) Measurements and modeling of throughfall variability for five forest communities in the southeastern US. Journal of Hydrology 312, 95–108.
Budyko, M.I., Yefimova, N.A., Aubenok, L.I. and Strokina, L.A. (1962) The heat-balance of the surface of the Earth. Soviet Geography: Review and Translation 3, 3–16.
Burgess, S.S.O., Adams, M.A., Turner, N.C. and Ong, C.K. (1998) The redistribution of soil water by tree root systems. Oecologia 115, 306–311.
Canny, M.J. (1998) Transporting water in plants. American Scientist 86, 152–159.Cheng, L., Xu, Z.X., Wang, D.B. and Cai, X.M. (2011) Assessing interannual variability of evapotranspiration
at the catchment scale using satellite-based evapotranspiration data sets. Water Resources Research 47, W09509, doi: 10.1029/2011WR010636 (accessed 20 March 2016).
Cheng, L., Zhang, L., Wang, Y.P., Yu, Q., Eamus, D. and O’Grady, A. (2014) Impacts of elevated CO2, climate change and their interactions on water budgets in four different catchments in Australia. Journal of Hydrology 519, 1350–1361.
Christopher, S.F., Schoenholtz, S.H. and Nettles, J.E. (2015) Water quantity implications of regional-scale switchgrass production in the southeastern US. Biomass and Bioenergy 83, 50–59.
Creed, I.F., Spargo, A.T., Jones, J.A., Buttle, J.M., Adams, M.B., Beall, F.D., Booth, E.G., Campbell, J.L., Clow, D., Elder, K., et al. (2014) Changing forest water yields in response to climate warming: results from long-term experimental watershed sites across North America. Global Change Biology 20, 3191–3208.
Crétaz, A.L.d.l. and Barten, P.K. (2007) Land Use Effects on Streamflow and Water Quality in the North-eastern United States. CRC Press/Taylor & Francis, Boca Raton, Florida.
Currie, D.J. (1991) Energy and large-scale patterns of animal-species and plant-species richness. Ameri-can Naturalist 137, 27–49.
Deguchi, A., Hattori, S., Park, H.T. (2006) The influence of seasonal changes in canopy structure on inter-ception loss: application of the revised Gash model. Journal of Hydrology 318, 80–102.
Denmead, O.T., Dunin, F.X., Wong, S.C. and Greenwood, E.A.N. (1993) Measuring water use efficiency of Eucalypt trees with chambers and micrometeorological techniques. Journal of Hydrology 150, 649–664.
Domec, J.C., Warren, J.M., Meinzer, F.C., Brooks, J.R. and Coulombe, R. (2004) Native root xylem embol-ism and stomatal closure in stands of Douglas-fir and ponderosa pine: mitigation by hydraulic redistri-bution. Oecologia 141, 7–16.
Domec, J.C., Noormets, A., King, J.S., Sun, G., McNulty, S.G., Gavazzi, M.J., Boggs, J.L. and Treasure, E.A. (2009) Decoupling the influence of leaf and root hydraulic conductances on stomatal conductance and its sensitivity to vapour pressure deficit as soil dries in a drained loblolly pine plantation. Plant and Cell Environment 32, 980–991.
Domec, J.C., King, J.S., Noormets, A., Treasure, E., Gavazzi, M.J., Sun, G. and McNulty, S.G. (2010) Hy-draulic redistribution of soil water by roots affects whole-stand evapotranspiration and net ecosystem carbon exchange. New Phytologist 187, 171–183.

For personal use only. Please do not distribute. Forest Evapotranspiration: Measurement and Modelling at Multiple Scales 47
Domec, J.C., Lachenbruch, B., Pruyn, M.L. and Spicer, R. (2012a) Effects of age-related increases in sap-wood area, leaf area, and xylem conductivity on height-related hydraulic costs in two contrasting coniferous species. Annals of Forest Science 69, 17–27.
Domec, J.C., Sun, G., Noormets, A., Gavazzi, M.J., Treasure, E.A., Cohen, E., Swenson, J.J., McNulty, S.G. and King, J.S. (2012b) A comparison of three methods to estimate evapotranspiration in two contrast-ing lob lolly pine plantations: age-related changes in water use and drought sensitivity of evapotrans-piration components. Forest Science 58, 497–512.
Douglass, J.E. (1983) The potential for water yield augmentation from forest management in the eastern-United-States. Water Resources Bulletin 19, 351–358.
Emanuel, R.E., Epstein, H.E., McGlynn, B.L., Welsch, D.L., Muth, D.J. and D’Odorico, P. (2010) Spatial and temporal controls on watershed ecohydrology in the northern Rocky Mountains. Water Resources Research 46, W11553, doi: 10.1029/2009WR008890 (accessed 20 March 2016).
Evaristo, J., Jasechko, S. and McDonnell, J.J. (2015) Global separation of plant transpiration from ground-water and streamflow. Nature 525, 91–94.
Fang, Y., Sun, G., Caldwell, P., McNulty, S.G., Noormets, A., Domec, J.-C., King, J., Zhang, Z., Zhang, X., Lin, G., et al. (2015) Monthly land cover-specific evapotranspiration models derived from global eddy flux measurements and remote sensing data. Ecohydrology, doi: 10.1002/eco.1629 (accessed 20 March 2016).
Ford, C.R., Hubbard, R.M., Kloeppel, B.D. and Vose, J.M. (2007) A comparison of sap flux-based evapo-transpiration estimates with catchment-scale water balance. Agricultural and Forest Meteorology 145, 176–185.
Frank, D.C., Poulter, B., Saurer, M., Esper, J., Huntingford, C., Helle, G., Treydte, K., Zimmermann, N.E., Schleser, G.H., Ahlstrom, A., et al. (2015) Water-use efficiency and transpiration across European for-ests during the Anthropocene. Nature Climate Change 5, 579.
Gao, Y., Zhu, X.J., Yu, G.R., He, N.P., Wang, Q.F. and Tian, J. (2014) Water use efficiency threshold for ter-restrial ecosystem carbon sequestration in China under afforestation. Agricultural and Forest Meteor-ology 195, 32–37.
Gash, J.H.C. (1979) Analytical model of rainfall interception by forests. Quarterly Journal of the Royal Me-teorological Society 105, 43–55.
Gavazzi, M.G., Sun, G., McNulty, S.G. and Treasure, E.A. (2015) Canopy rainfall interception measured over 10 years in a coastal plain loblolly pine (Pinus taeda L.) plantation. Transactions of the ASABE (in press).
Gerrits, A.M.J., Savenije, H.H.G., Hoffmann, L. and Pfister, L. (2007) New technique to measure forest floor interception – an application in a beech forest in Luxembourg. Hydrology and Earth System Sciences 11, 695–701.
Good, S.P., Noone, D., Kurita, N., Benetti, M. and Bowen, G.J. (2015) D/H isotope ratios in the global hydro-logic cycle. Geophysical Research Letters 42, 5042–5050.
Granier, A. (1987) Evaluation of transpiration in a Douglas-fir stand by means of sap flow measurements. Tree Physiology 3, 309–320.
Granier, A., Huc, R. and Barigah, S.T. (1996) Transpiration of natural rain forest and its dependence on cli-matic factors. Agricultural and Forest Meteorology 78, 19–29.
Grismer, M.E., Orang, M., Snyder, R. and Matyac, R. (2002) Pan evaporation to reference evapotranspir-ation conversion methods. Journal of Irrigation and Drainage Engineering–ASCE 128, 180–184.
Hawkins, B.A., Field, R., Cornell, H.V., Currie, D.J., Guegan, J.F., Kaufman, D.M., Kerr, J.T., Mittelbach, G.G., Oberdorff, T., O’Brien, E.M., et al. (2003) Energy, water, and broad-scale geographic patterns of spe-cies richness. Ecology 84, 3105–3117.
Helvey, J.D. (1974) Summary of rainfall interception by certain conifers on North America. In: Proceedings of the 3rd International Seminar for Hydrology Professors. NSFASS, West Lafayette, Indiana, pp. 103–113.
Helvey, J.D. and Patric, J.H. (1965) Canopy and litter interception of rainfall by hardwoods of eastern united states. Water Resources Research 1, 193–206.
Hewlett, J.D. (1982) Principles of Forest Hydrology. University of Georgia Press, Athens, Georgia.Horton, R.E. (1919) Rainfall interception. Monthly Weather Review 47, 16.Huang, M.T., Piao, S.L., Sun, Y., Ciais, P., Cheng, L., Mao, J.F., Poulter, B., Shi, X.Y., Zeng, Z.Z. and Wang, Y.P.
(2015) Change in terrestrial ecosystem water-use efficiency over the last three decades. Global Change Biology 21, 2366–2378.
Irmak, S. (2010) Nebraska Water and Energy Flux Measurement, Modeling, and Research Network (NEBFLUX). Transactions of the ASABE 53, 1097–1115.

For personal use only. Please do not distribute.48 G. Sun et al.
Irmak, S., Skaggs, K.E. and Chatterjee, S. (2014) A review of the Bowen ratio surface energy balance method for quantifying evapotranspiration and other energy fluxes. Transactions of the ASABE 57, 1657–1674.
Jackson, R.B., Jobbagy, E.G., Avissar, R., Roy, S.B., Barrett, D.J., Cook, C.W., Farley, K.A., le Maitre, D.C., McCarl, B.A. and Murray, B.C. (2005) Trading water for carbon with biological sequestration. Science 310, 1944–1947.
Jasechko, S., Sharp, Z.D., Gibson, J.J., Birks, S.J., Yi, Y. and Fawcett, P.J. (2013) Terrestrial water fluxes dominated by transpiration. Nature 496, 347–350.
Jayakaran, A.D., Williams, T.M., Ssegane, H., Amatya, D.M., Song, B. and Trettin, C.C. (2014) Hurricane impacts on a pair of coastal forested watersheds: implications of selective hurricane damage to forest structure and streamflow dynamics. Hydrology and Earth System Sciences 18, 1151–1164.
Jung, M., Reichstein, M., Ciais, P., Seneviratne, S.I., Sheffield, J., Goulden, M.L., Bonan, G., Cescatti, A., Chen, J.Q., de Jeu, R., et al. (2010) Recent decline in the global land evapotranspiration trend due to limited moisture supply. Nature 467, 951–954.
Kalma, J.D., McVicar, T.R. and McCabe, M.F. (2008) Estimating land surface evaporation: a review of methods using remotely sensed surface temperature data. Surveys in Geophysics 29, 421–469.
King, J.S., Ceulemans, R., Albaugh, J.M., Dillen, S.Y., Domec, J.C., Fichot, R., Fischer, M., Leggett, Z., Sucre, E., Trnka, M. and Zenone, T. (2013) The challenge of lignocellulosic bioenergy in a water-limited world. Bioscience 63, 102–117.
Komatsu, H. and Kume, T. (2015) Changes in the sapwood area of Japanese cedar and cypress plantations after thinning. Journal of Forest Research 20, 43–51.
Komatsu, H., Maita, E. and Otsuki, K. (2008) A model to estimate annual forest evapotranspiration in Japan from mean annual temperature. Journal of Hydrology 348, 330–340.
Kumagai, T. (2011) Transpiration in forest ecosystems. In: Levia, D.F., Carlyle-Moses, D. and Tanaka, T. (eds) Forest Hydrology and Biogeochemistry: Synthesis of Past Research and Future Directions. Springer, New York, pp. 389–406.
Kumagai, T., Tateishi, M., Miyazawa, Y., Kobayashi, M., Yoshifuji, N., Komatsu, H. and Shimizu, T. (2014) Estimation of annual forest evapotranspiration from a coniferous plantation watershed in Japan (1): Water use components in Japanese cedar stands. Journal of Hydrology 508, 66–76.
Kustas, W.P. and Norman, J.M. (1996) Use of remote sensing for evapotranspiration monitoring over land surfaces. Hydrological Sciences Journal 41, 495–516.
Law, B.E., Falge, E., Gu, L., Baldocchi, D.D., Bakwin, P., Berbigier, P., Davis, K., Dolman, A.J., Falk, M., Fuentes, J.D., et al. (2002) Environmental controls over carbon dioxide and water vapor exchange of terrestrial vegetation. Agricultural and Forest Meteorology 113, 97–120.
Levia, D.F., Carlyle-Moses, D. and Tanaka, T. (2011) Forest Hydrology and Biogeochemistry: Synthesis of Past Research and Future Directions. Springer, New York.
Liu, C., Sun, G., McNulty, S.G. and Kang, S. (2015) An improved evapotranspiration model for an apple orchard in northwestern China. Transactions of the ASABE 58, 1253–1264.
Liu, Y.Q. (2011) A numerical study on hydrological impacts of forest restoration in the southern United States. Ecohydrology 4, 299–314.
Lu, J.B., Sun, G., McNulty, S.G. and Amatya, D.M. (2005) A comparison of six potential evapotranspiration methods for regional use in the southeastern United States. Journal of the American Water Resources Association 41, 621–633.
Mann, M.E. and Gleick, P.H. (2015) Climate change and California drought in the 21st century. Proceedings of the National Academy of Sciences USA 112, 3858–3859.
McCarthy, E.J., Flewelling, J.W. and Skaggs, R.W. (1992) Hydrologic model for drained forest watershed. Journal of Irrigation and Drainage Engineering–ASCE 118, 242–255.
McMahon, T.A., Peel, M.C., Lowe, L., Srikanthan, R. and McVicar, T.R. (2013) Estimating actual, potential, reference crop and pan evaporation using standard meteorological data: a pragmatic synthesis. Hy-drology and Earth System Sciences 17, 1331–1363.
McNulty, S.G. and Swank, W.T. (1995) Wood δ13C as a measure of annual basal area growth and soil-water stress in a Pinus strobus forest. Ecology 76, 1581–1586.
Meinzer, F.C., James, S.A. and Goldstein, G. (2004) Dynamics of transpiration, sap flow and use of stored water in tropical forest canopy trees. Tree Physiology 24, 901–909.
Monteith, J.L. (1965) Evaporation and the environment. Symposium of the Society of Experimental Biology 19, 205–234.
Mu, Q.Z., Zhao, M.S. and Running, S.W. (2011) Improvements to a MODIS global terrestrial evapotranspir-ation algorithm. Remote Sensing of Environment 115, 1781–1800.

For personal use only. Please do not distribute. Forest Evapotranspiration: Measurement and Modelling at Multiple Scales 49
Neumann, R.B. and Cardon, Z.G. (2012) The magnitude of hydraulic redistribution by plant roots: a review and synthesis of empirical and modeling studies. New Phytologist 194, 337–352.
Oishi, A.C., Oren, R., Novick, K.A., Palmroth, S. and Katul, G.G. (2010) Interannual invariability of forest evapotranspiration and its consequence to water flow downstream. Ecosystems 13, 421–436.
Oki, T. and Kanae, S. (2006) Global hydrological cycles and world water resources. Science 313, 1068–1072.
Olbrich, B.W. (1991) The verification of the heat pulse velocity technique for estimating sap flow in Eucalyp-tus grandis. Canadian Journal of Forest Research 21, 836–841.
Oudin, L., Andreassian, V., Lerat, J. and Michel, C. (2008) Has land cover a significant impact on mean annual streamflow? An international assessment using 1508 catchments. Journal of Hydrology 357, 303–316.
Palmroth, S., Katul, G.G., Hui, D.F., McCarthy, H.R., Jackson, R.B. and Oren, R. (2010) Estimation of long-term basin scale evapotranspiration from streamflow time series. Water Resources Research 46, W10512, doi: 10.1029/2009WR008838 (accessed 20 March 2016).
Peng, S.S., Piao, S.L., Zeng, Z.Z., Ciais, P., Zhou, L.M., Li, L.Z.X., Myneni, R.B., Yin, Y. and Zeng, H. (2014) Afforestation in China cools local land surface temperature. Proceedings of the National Academy of Sciences USA 111, 2915–2919.
Penman, H.L. (1948) Natural evaporation from open water, bare soil and grass. Proceedings of the Royal Society of London Series–A, Mathematical and Physical Sciences 193, 120–145.
Priestley, C.H.B. and Taylor, R.J. (1972) On the assessment of surface heat-flux and evaporation using large-scale parameters. Monthly Weather Review 100, 81–92.
Rosenzweig, M.L. (1968) Net primary productivity of terrestrial communities – prediction from climatological data. American Naturalist 102, 67–74.
Sampson, D.A., Amatya, D.M., Lawson, C.D.B. and Skaggs, R.W. (2011) Leaf area index (LAI) of loblolly pine and emergent vegetation following a harvest. Transactions of the ASABE 54, 2057–2066.
Sanford, W.E. and Selnick, D.L. (2013) Estimation of evapotranspiration across the conterminous united states using a regression with climate and land-cover data. Journal of the American Water Resources Association 49, 217–230.
Schlesinger, W.H. and Jasechko, S. (2014) Transpiration in the global water cycle. Agricultural and Forest Meteorology 189, 115–117.
Shuttleworth, W.J. (2012) Terrestrial Hydrometeorology. Wiley, Hoboken, New Jersey.Sun, G., Riekerk, H. and Comerford, N.B. (1998) Modeling the forest hydrology of wetland-upland ecosys-
tems in Florida. Journal of the American Water Resources Association 34, 827–841.Sun, G., Amatya, D.M., McNulty, S.G., Skaggs, R.W. and Hughes, J.H. (2000) Climate change impacts on
the hydrology and productivity of a pine plantation. Journal of the American Water Resources Associ-ation 36, 367–374.
Sun, G., McNulty, S.G., Amatya, D.M., Skaggs, R.W., Swift, L.W., Shepard, J.P. and Riekerk, H. (2002) A comparison of the watershed hydrology of coastal forested wetlands and the mountainous uplands in the southern US. Journal of Hydrology 263, 92–104.
Sun, G., McNulty, S.G., Lu, J., Amatya, D.M., Liang, Y. and Kolka, R.K. (2005) Regional annual water yield from forest lands and its response to potential deforestation across the southeastern United States. Journal of Hydrology 308, 258–268.
Sun, G., McNulty, S.G., Moore-Myers, J.A. and Cohen, E.C. (2008) Impacts of multiple stresses on water demand and supply across the southeastern United States. Journal of the American Water Resources Association 44, 1441–1457.
Sun, G., Noormets, A., Gavazzi, M.J., McNulty, S.G., Chen, J., Domec, J.C., King, J.S., Amatya, D.M. and Skaggs, R.W. (2010) Energy and water balance of two contrasting loblolly pine plantations on the lower coastal plain of North Carolina, USA. Forest Ecology and Management 259, 1299–1310.
Sun, G., Alstad, K., Chen, J.Q., Chen, S.P., Ford, C.R., Lin, G.H., Liu, C.F., Lu, N., McNulty, S.G., Miao, H.X., et al. (2011a) A general predictive model for estimating monthly ecosystem evapotranspiration. Ecohy-drology 4, 245–255.
Sun, G., Caldwell, P., Noormets, A., McNulty, S.G., Cohen, E., Moore Myers, J., Domec, J.-C., Treasure, E., Mu, Q., Xiao, J., et al. (2011b) Upscaling key ecosystem functions across the conterminous United States by a water-centric ecosystem model. Journal of Geophysical Research–Biogeosciences 116, G00J05.
Sun, X.C., Onda, Y., Kato, H., Gomi, T. and Komatsu, H. (2015) Effect of strip thinning on rainfall interception in a Japanese cypress plantation. Journal of Hydrology 525, 607–618.

For personal use only. Please do not distribute.50 G. Sun et al.
Swank, W.T. and Crossley, D.A. (eds) (1988) Forest Hydrology and Ecology at Coweeta. Ecological Studies Vol. 66. Springer, New York.
Swank, W.T. and Douglass, J.E. (1974) Streamflow greatly reduced by converting deciduous hardwood stands to pine. Science 185, 857–859.
Swank, W.T. and Miner, N.H. (1968) Conversion of hardwood-covered watersheds to white pine reduces water yield. Water Resources Research 4, 947–954.
Teuling, A.J., Hirschi, M., Ohmura, A., Wild, M., Reichstein, M., Ciais, P., Buchmann, N., Ammann, C., Montagnani, L., Richardson, A.D., et al. (2009) A regional perspective on trends in continental evaporation. Geophysical Research Letters 36, L02404, doi: 10.1029/2008GL036584 (accessed 20 March 2016).
Tian, H.Q., Chen, G.S., Zhang, C., Liu, M.L., Sun, G., Chappelka, A., Ren, W., Xu, X.F., Lu, C.Q., Pan, S.F., et al. (2012) Century-scale responses of ecosystem carbon storage and flux to multiple environmental changes in the southern United States. Ecosystems 15, 674–694.
Tian, S.Y., Youssef, M.A., Skaggs, R.W., Amatya, D.M. and Chescheir, G.M. (2012) Modeling water, carbon and nitrogen dynamics for two drained pine plantations under intensive management practices. Forest Ecology and Management 264, 20–36.
Trenberth, K.E., Fasullo, J.T. and Kiehl, J. (2009) Earth’s global energy budget. Bulletin of the American Meteorological Society 90, 311–323, doi: 10.1175/2008BAMS2634.1 (accessed 20 March 2016).
Ukkola, A.M. and Prentice, I.C. (2013) A worldwide analysis of trends in water-balance evapotranspiration. Hydrology and Earth System Sciences 17, 4177–4187.
Vose, J.M. and Klepzig, K.D. (eds) (2014) Climate Change Adaptation and Mitigation Management Op-tions: A Guide for Natural Resource Managers in Southern Forest Ecosystems. CRC Press, Boca Raton, Florida.
Vose, J.M., Sun, G., Ford, C.R., Bredemeier, M., Otsuki, K., Wei, X.H., Zhang, Z.Q. and Zhang, L. (2011) Forest ecohydrological research in the 21st century: what are the critical needs? Ecohydrology 4, 146–158.
Vose, J.M., Peterson, D. and Patel-Weynand, T. (eds) (2012) Effects of Climatic Variability and Change on Forest Ecosystems: A Comprehensive Science Synthesis for the US Forest Sector. US Forest Ser-vice, Pacific Northwest Research Station, Portland, Oregon.
Wang, Q.J., Pagano, T.C., Zhou, S.L., Hapuarachchi, H.A.P., Zhang, L. and Robertson, D.E. (2011) Monthly versus daily water balance models in simulating monthly runoff. Journal of Hydrology 404, 166–175.
Wang, S., Pan, M., Mu, Q., Shi, X., Mao, J., Brümmer, C., Jassal, R.S., Krishnan, P., Li, J. and Black, T.A. (2015) Comparing evapotranspiration from eddy covariance measurements, water budgets, remote sensing, and land surface models over Canada. Journal of Hydrometeorolgy 16, 1540–1560.
Warren, J.M., Meinzer, F.C., Brooks, J.R., Domec, J.C. and Coulombe, R. (2007) Hydraulic redistribution of soil water in two old-growth coniferous forests: quantifying patterns and controls. New Phytologist 173, 753–765.
Wilson, K.B., Hanson, P.J., Mulholland, P.J., Baldocchi, D.D. and Wullschleger, S.D. (2001) A comparison of methods for determining forest evapotranspiration and its components: sap-flow, soil water budget, eddy covariance and catchment water balance. Agricultural and Forest Meteorology 106, 153–168.
Wilson, K., Goldstein, A., Falge, E., Aubinet, M., Baldocchi, D., Berbigier, P., Bernhofer, C., Ceulemans, R., Dolman, H., Field, C., et al. (2002) Energy balance closure at FLUXNET sites. Agricultural and Forest Meteorology 113, 223–243.
Wullschleger, S.D., Meinzer, F.C. and Vertessy, R.A. (1998) A review of whole-plant water use studies in trees. Tree Physiology 18, 499–512.
Zeng, Z.Z., Wang, T., Zhou, F., Ciais, P., Mao, J.F., Shi, X.Y. and Piao, S.L. (2014) A worldwide analysis of spatiotemporal changes in water balance-based evapotranspiration from 1982 to 2009. Journal of Geophysical Research–Atmosphere 119, 1186–1202.
Zhang, L., Dawes, W.R. and Walker, G.R. (2001) Response of mean annual evapotranspiration to vegeta-tion changes at catchment scale. Water Resources Research 37, 701–708.
Zhang, L., Potter, N., Hickel, K., Zhang, Y.Q. and Shao, Q.X. (2008) Water balance modeling over variable time scales based on the Budyko framework – model development and testing. Journal of Hydrology 360, 117–131.
Zhou, G., Wei, X., Chen, X., Zhou, P., Liu, X., Xiao, Y., Sun, G., Scott, D.F., Zhou, S., Han, L. and Su, Y. (2015) Global pattern for the effect of climate and land cover on water yield. Nature Communications 6, 5918.