3. estimating the economic costs of cancer · pdf file3. estimating the economic costs of...
TRANSCRIPT
Cost of Cancer in NSW
47
3. ESTIMATING THE ECONOMIC COSTS OF CANCER This report intends to quantify the health system costs, productivity losses, and other costs of cancer. In a fundamental sense, such quantification is a historical accounting exercise, although properly complying with best practice health economics methods is not a straightforward task. A full economic analysis of the effects of a disease on the economy would also examine the long-run situation where costs are passed onto society through adjustments in wages and prices. For example, a reduction in the supply of labour would increase wages, which would be passed on to consumers through price increases. At the same time a decrease in the demand for goods and services would decrease prices, which would push down wages. The overall impact on the economy depends on a complex array of elasticities. The implicit and probable economic assumption is that the numbers of such people would not be of sufficient magnitude to substantially influence the overall clearing of these markets.
Therefore, no �what-if�, or counterfactual inferences, such as �what would happen if more people used a particular service� should be drawn from the costing analysis alone.
3.1 INCIDENCE AND PREVALENCE APPROACHES
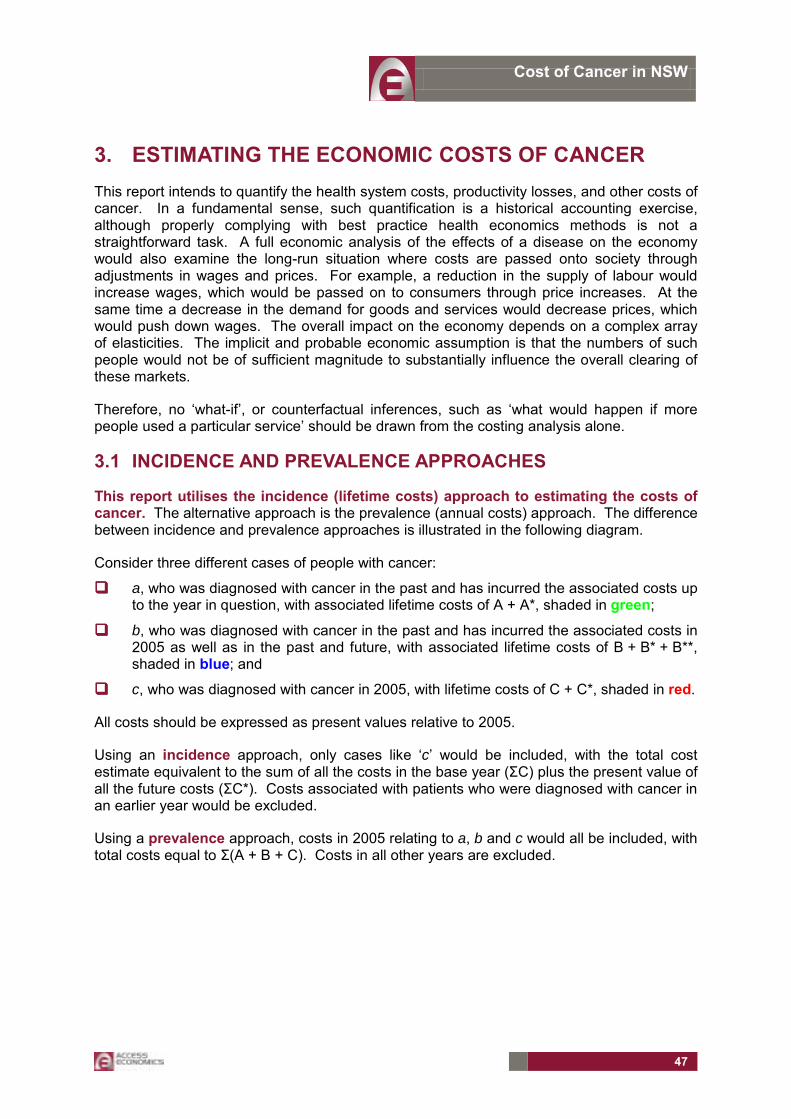
This report utilises the incidence (lifetime costs) approach to estimating the costs of cancer. The alternative approach is the prevalence (annual costs) approach. The difference between incidence and prevalence approaches is illustrated in the following diagram.
Consider three different cases of people with cancer:
!!!! a, who was diagnosed with cancer in the past and has incurred the associated costs up to the year in question, with associated lifetime costs of A + A*, shaded in green;
!!!! b, who was diagnosed with cancer in the past and has incurred the associated costs in 2005 as well as in the past and future, with associated lifetime costs of B + B* + B**, shaded in blue; and
!!!! c, who was diagnosed with cancer in 2005, with lifetime costs of C + C*, shaded in red.
All costs should be expressed as present values relative to 2005.
Using an incidence approach, only cases like �c� would be included, with the total cost estimate equivalent to the sum of all the costs in the base year (ΣC) plus the present value of all the future costs (ΣC*). Costs associated with patients who were diagnosed with cancer in an earlier year would be excluded.
Using a prevalence approach, costs in 2005 relating to a, b and c would all be included, with total costs equal to Σ(A + B + C). Costs in all other years are excluded.

Cost of Cancer in NSW
48
FIGURE 3-1 INCIDENCE AND PREVALENCE APPROACHES TO MEASUREMENT OF ANNUAL COSTS Past Base
year Future
Annual prevalence costs in the base year = Σ(A + B + C); Annual incidence costs in the base year = Σ(C + present value of C*)
Note that Figure 3-1 also defines the lifetime costs of cancer for each person, as follows: Lifetime cost for person c (= Incidence cost) = C + present value of C*
Lifetime cost for person b = B + present values of B* and B** Lifetime cost for person a = A + present value of A*
Using the lifetime approach means that the costs estimated are the expected costs over the person�s lifetime at diagnosis (i.e. based on the probability of quitting work, dying etc).
3.2 CLASSIFICATION OF COSTS
Conceptual issues relating to the classification of costs include the following.
!!!! Direct and indirect costs: Although literature often distinguishes between direct and indirect costs, the usefulness of this distinction is dubious, as the specific costs included in each category vary between different studies, making comparisons of results somewhat difficult.
!!!! Real and transfer costs: �Real costs use up real resources, such as capital or labour, or reduce the economy�s overall capacity to produce (or consume) goods and services. Transfer payments involve payments from one economic agent to another that do not use up real resources. For example, if a person loses their job, as well as the real production lost there is also less income taxation, where the latter is a transfer from an individual to the government. This important economic distinction is crucial in avoiding double-counting. It has attracted some attention in the literature.� (Laing and Bobic 2002, p16, Laurence and Spalter-Roth 1996, p14)
!!!! Economic and non economic costs: Economic costs encompass loss of goods and services that have a price in the market or that could be assigned an approximate price by an informed observer. �Non-economic� costs include the loss of wellbeing of the patient as well as of their family members and carers. This classification is ill-defined, since �non-economic� costs are often ascribed values and the available methodologies are becoming more sophisticated and widely accepted. We acknowledge that controversy still surrounds the valuation of �non-economic� costs and that the results should be presented and interpreted cautiously.
!!!! Prevention and case costs: We distinguish between: the costs following from, and associated with, cancer; and costs directed towards preventing cancer. Prevention activities include quit smoking campaigns, public awareness and education about cancer; workplace mitigation measures, screening programmes and so on. In similar
A* A
B* B B**
C C*

Cost of Cancer in NSW
49
vein, costs of insuring against impacts of the disease are excluded, but the study includes the gross costs of the impacts themselves.
There are six types of costs associated with cancer (see Table 3-1).
!!!! Direct financial costs to the Australian health system (Chapter 4) include the costs of running hospitals and nursing homes (buildings, care, consumables), GP and specialist services reimbursed through Medicare and private funds, the cost of pharmaceuticals (PBS and private) and of over-the-counter medications, allied health services, research and �other� direct costs (such as health administration).
!!!! Productivity costs (Chapter 5) include patient productivity losses (temporary absenteeism, long-term employment impacts and unpaid work), premature mortality and the value of informal care.
!!!! Administrative costs and other financial costs (Chapter 6) include government and non-government programs such as respite, community palliative care, special education, out-of-pocket expenses (such as formal care, aids, equipment and modifications that are required to help cope with illness, transport and accommodation costs associated with receiving treatment, communication costs, complementary and alternative therapy), counselling and support programs, educational materials, and funeral costs.
!!!! Transfer costs (Chapter 7) comprise the deadweight losses associated with government transfers such as taxation revenue foregone, welfare and disability payments.
!!!! Non-financial costs (Chapter 8) are also very important�the pain, suffering and premature death that result from cancer. Although more difficult to measure, these can be analysed in terms of the years of healthy life lost, both quantitatively and qualitatively, known as the �burden of disease�.
Different costs of diseases are borne by different individuals or sectors of society. Clearly the patient bears costs, but so do employers, government, friends and family, co-workers, charities, community groups and other members of society.
It is important to understand how the costs are shared in order to make informed decisions regarding interventions. While the patient will usually be the most severely affected party, other family members and society (more broadly) also face costs as a result of cancer. From the employer�s perspective, depending on the impact of cancer, work loss or absenteeism will lead to costs such as higher wages (i.e. accessing skilled replacement short-term labour) or alternatively lost production, idle assets and other non-wage costs. Employers might also face costs such as rehiring, retraining and workers� compensation.
While it may be convenient to think of these costs as being purely borne by the employer, in reality they may eventually be passed on to end consumers in the form of higher prices for goods and services. Similarly, for the costs associated with the health system and community services provided to the patient, although the Government meets this cost, taxpayers (society) are the ultimate source of funds. However, for the purpose of this analysis, a �who writes the cheque� approach is adopted, falling short of delving into second round or longer term dynamic impacts.
Society bears both the resource cost of providing services to patients, and also the �deadweight� losses (or reduced economic efficiency) associated with the need to raise additional taxation to fund the provision of services and income support.

Cost of Cancer in NSW
50
Typically six groups who bear costs and pay or receive transfer payments are identified, namely the:
!!!! patient;
!!!! friends and family (including informal carers);
!!!! employers;
!!!! Federal government;
!!!! State and local government; and
!!!! the rest of society (non-government, i.e. not-for-profit organisations, workers� compensation groups etc).
Classifying costs by six cost categories and allocating them to six groups enables a framework for analysis of these data to isolate the impacts on the various groups affected by cancer. This includes different levels of government, the business sector and community groups.
The Household

Cost of Cancer in NSW
51
TABLE 3-1 SCHEMA FOR COST CLASSIFICATION
Conceptual group
Subgroups Bearers of Cost Comments
Pain/Suffering and Premature Mortality
Burden of Disease (YLLs, YLDs, DALYs) � incidence approach.
Patient* The VSL implicitly includes costs borne by the individual. Thus the net value of BoD should excludes these costs to avoid double counting.
Health System Costs
Costs by type of service (and incidence in 2001)
Patient*, governments and society (private health insurers, workers� compensation)
Productivity Costs
Lost productivity from temporary absenteeism (time off work � hospital and non-hospital days)
Patient, employer and government#
Lost management productivity Employer and government#
Long-term lower employment rates
Patient and government# Includes premature retirement
Premature death Patient and government# Loss of productive capacity
Additional search and hiring replacement
Employer Incurred when prematurely leave job
Lost unpaid work of patient Patient Includes housework, yardwork, childcare and volunteer work
Lost informal carer productivity Friends and family, and employer#
Includes both paid and unpaid work
Other Financial Respite/Palliative Care
Services Governments, patient, and society
Educational Services Governments Interpreter Services Governments
Out-of-pocket expenses Patient Formal care, aids, equipment, modifications, travel, accommodation, communication costs
Alternative and Complementary Therapies
Patient
Community programs Patient and society Helplines, Support Groups, Educational Material
Funeral costs brought forward Friends and family Transfer costs Deadweight Loss Society Relate to transfers from
taxation, welfare etc * Friends/family may also bear loss of wellbeing, health costs and lower living standards as a result of the individual�s cancer; however, care is needed to assess the extent to which these are measurable, additional (to avoid double counting) and not follow-on impacts. For example, a spouse may pay a medical bill and children may share in lower household income if the patient�s work hours are reduced � but as this is simply redistribution within family income it is not measured here. Moreover, if a family carer develops depression or a musculoskeletal disorder, it would be necessary to estimate the aetiological fraction attributable to the cancer, allowing for other possible contributing factors. # Where earnings are lost, so is taxation revenue and frequently also there are other transfers, such as workers� compensation or welfare payments for disability/sickness/caring etc, so Governments share the burden.

Cost of Cancer in NSW
52
3.3 CALCULATING PARAMETERS
There are essentially two ways of estimating each element of cost for each group:
!!!! Top-down: These data may provide the total costs of a program element (eg, health system); or
!!!! Bottom-up: These data may provide estimates of the number of cases in the category (�n�) and the average cost for that category. The product is the total cost (eg, the wage rate for lost earnings multiplied by the average number of days off, and the number of patients to whom this applies).
The top-down approach is applicable to community programs, and is also part of the approach to health system costs. The bottom-up approach applies in other cases.
It is generally more desirable to use top-down national datasets in order to derive national cost estimates for large and well-studied diseases such as cancer, rather than extrapolate bottom-up data from smaller partial datasets. Consequently throughout the report Australia-wide costs of cancer are often estimated and then converted into costs per person based on Australian estimates of active prevalence of cancer or deaths due to cancer. These costs are subsequently applied to NSW.
However, using top-down estimates can be problematic in some areas (eg, productivity).
Whenever obtaining parameters required for implementing the bottom-up approach, statistical analysis of datasets and a literature review (focussing on Australian literature but sometimes supplemented by international material) has been used.
!!!! Data on direct health costs and the burden of disease from the AIHW, (AIHW, 2004a, AIHW, 2004b, Mathers et al, 1999) � these are in turn based on other data sources, such as the Australian Hospital Statistics 2001�02 and BEACH data for GP costs.
!!!! Data on other financial costs are drawn from a variety of sources, as described in Sections 5 and 6 � for example, the productivity costing combines NSW Cancer Survival Study (CSS), Survey of Disability and Ageing (SDAC) and the Australian Longitudinal Study on Women�s Health (ALSWH) data on lower employment for people with cancer with ABS data on average employment rates and earnings.
The main limitations of these data are in relation to timeliness, comparability and objectivity.
!!!! Direct cost of disease data has been calculated by the AIHW for 1993-94 and 2000-01 (the latter released in May 2004), again with limited comparability � the latter series for example only includes 86% of the recurrent costs included in the former series.
!!!! The CSS, SDAC, and ALSWH use self-reported data. The latter two studies do not use medical verification of whether the person has been diagnosed with cancer.
!!!! Burden of disease data dates to 1996, although a new attribution is underway.
Unfortunately, available data on cancer and its associated costs are subject to considerable uncertainties, with a number of these detailed below.
!!!! Surveys: !!!! Lack of consensus about definition: Which cancers are included in each
category? How are cost components valued? !!!! Variations in survey methodology.

Cost of Cancer in NSW
53
!!!! Gaps in data collections and consistency. !!!! Different time frames: For example, use of annual versus lifetime. !!!! Reluctance to report disease. !!!! Limited populations: Representativeness, clinic or population focused, small
sample sizes. !!!! Survey limitations: The wording of questions may affect the answers given.
!!!! Short-Run Costs: !!!! Patchy administrative information on what proportion of costs are attributable to
different types of cancer. !!!! Limited relevant data from many non-government administrative sources, about
non-government costs relating to cancer. !!!! Often surveys focus on other aspects of cancer (such as treatment outcomes)
rather than the costs of cancer (such as productivity costs). Consequently the questions asked may be less than ideally constructed, if they ask the relevant questions at all.
!!!! Long-Run Costs: In particular, correlation not causation. !!!! Socioeconomic issues: Sometimes it is difficult to separate out the before and
after impact of a cancer on employment, income and education without a longitudinal study (for example, there is evidence that lung cancer is related to a person�s socio-economic status).
!!!! Comorbidities: There may be another disease that is responsible for part (or all) of the costs (such as the presence of another chronic disease having a large impact on productivity costs).
!!!! Factor X: There may be another underlying cause of both cancer and the resulting cost, which makes them look like one is caused by the other (for example, alcohol abuse resulting in both liver cancer and reduced employment rates).
These issues are addressed by controlling for other factors where possible, and conducting sensitivity analysis.
3.3.1 DISCOUNT RATES
A discount rate is used to convert future income or a cost stream into the total value in today�s dollars.
Choosing an appropriate discount rate for present valuations in cost analysis is a subject of some debate, and can vary depending on what type of future income or cost stream is being considered. There is a substantial body of literature, which often provides conflicting advice, on the appropriate mechanism by which costs should be discounted over time, properly taking into account risks, inflation, positive time preference and expected productivity gains.
The absolute minimum option that one can adopt in discounting future income and costs is to set future values in current day dollar terms on the basis of a risk free assessment about the future (that is, assume the future flows are similar to the certain flows attaching to a long-term Government bond).
Cost of Cancer in NSW
54
Wages should be assumed to grow in dollar terms according to best estimates for inflation and productivity growth. In selecting discount rates for this project, we have thus settled upon the following as the preferred approach.
!!!! Positive time preference: We use the long-term nominal bond rate of 5.8% pa (from recent history) as the parameter for this aspect of the discount rate. (If there were no positive time preference, people would be indifferent between having something now or a long way off in the future, so this applies to all flows of goods and services.)
!!!! Inflation: The Reserve Bank has a clear mandate to pursue a monetary policy that delivers 2 to 3% inflation over the course of the economic cycle. This is a realistic longer run goal and we therefore endorse the assumption of 2.5% pa for this variable. (It is important to allow for inflation in order to derive a real (rather than nominal) rate.)
!!!! Productivity growth: The Commonwealth Government's Intergenerational report assumed productivity growth of 1.7% in the decade to 2010 and 1.75% thereafter. We suggest 1.75% for the purposes of this analysis as many of the productivity costs extend past 2010.
There are then three different real discount rates that should be applied:
!!!! To discount income streams of future earnings, the discount rate is: 5.8 - 2.5 - 1.75 = 1.55%.
!!!! To discount health costs, the discount rate is: 5.8 - (3.2 - 1.75) - 1.75 = 2.6%.
!!!! To discount other future streams (healthy life) the discount rate is: 5.8 � 2.5 = 3.3%
While there may be sensible debate about whether health services (or other costs with a high labour component in their costs) should also deduct productivity growth from their discount rate, we argue that these costs grow in real terms over time significantly as a result of other factors such as new technologies and improved quality, and we could reasonably expect this to continue in the future.

Cost of Cancer in NSW
55
4. HEALTH SYSTEM COSTS
4.1 MEASURING HEALTH SYSTEM COSTS
Total health system costs are based on work by AIHW (May 2005), which estimated the hospital (includes admitted and non-admitted patients, and high-level residential care), out-of-hospital expenditure (includes GP services, imaging, pathology and referrals to specialists), pharmaceutical costs and other costs (includes other health professionals, dental and research) associated with cancers in 2000-0113.
The costs of cancer prevention and screening for new cases are removed from the health system cost estimates as they are not directly related to treating cancer patients (see Table 4-1).
TABLE 4-1 EXPENDITURE ON CANCER PREVENTION, 2000�01 ($M)
Total Expenditure Organised mammography 96Other cancer sites 16General cancer prevention 51Total 163
Since 2000-01, additional Government funding for cancer screening and prevention (such as colon cancer screening) has also become available, but these costs are also not included in these estimates.
These costs are divided by the active prevalence of cancer in Australia 2000-01 to estimate the health system cost per person, then indexed to health inflation from 2000-01 to 2005, to estimate the expected health system cost per person in 2005.
Since 2000-01, three significant new cancer-specific treatments have been listed on the PBS (see Table 4-2) and some drugs already listed have had their indications extended to other uses, such as Mabthera (rituximab) for Non-Hodgkins lymphoma (February 2003), Gemcitabine for Ovarian cancer (August 2005) and Temodal (temozolomide) for brain tumours (June 2005). Furthermore, some new drugs have been approved by the TGA but not yet listed on the PBS (such as Herceptin for breast cancer), meaning that a number of patients may be incurring pharmaceutical costs for their use however these are not included in the following cost estimates.
TABLE 4-2 NEW CANCER TREATMENTS
Drug Cancer Date Listed Cost in 2005 ($m) Iressa (Gefitinib) Lung 1 December 2004 0.98Eloxatin (oxaliplatin) Colon 1 December 2001 24.04Glivec (Imatinib mesylate) Leukaemia November 2002 50.70Total 75.72
Scaled up based on data January 2005 to November 2005 Source: http://www.medicare.gov.au/providers/health_statistics/statistical_reporting/pbs.htm
A number of significant new cancer programs implemented by the Federal and NSW governments have also been implemented since 2000-01.
13 Excluding carcinoma in situ cervix uteri and other benign, in situ and unspecified neoplasms.

Cost of Cancer in NSW
56
!!!! The introduction of the Federal Government�s Better treatment for cancer patients: radiation oncology services initiative ($20.4m in both 2004-05 and 2005-06), released in the 2002 Budget14.
!!!! The introduction of the Federal Government�s Investing in Australia�s health: Strengthening Cancer Care initiative ($16.5m in 2004-05 and $35.6m in 2005-06, excluding screening/prevention), including funding for15: !!!! Treatment: provide MBS eligibility for a MRI unit at Sydney�s Children�s Hospital;
improve the early detection and management of breast cancer; redevelop the children�s cancer ward at Royal Children�s Hospital in Melbourne.
!!!! Training: develop and implement training courses for cancer nurses; improve professional development for cancer professionals, counsellors and general practitioners; develop and implement mentoring for regional cancer services; provide additional radiation therapy internships and undergraduate places.
!!!! Support: improve support for those newly diagnosed with breast cancer; build cancer support groups; support children with cancer and their families; enhance palliative care programs.
!!!! Research: increase cancer research; support cancer clinical trials; establish a new national cancer agency, Cancer Australia; establish a national research centre for asbestos related diseases.
!!!! The introduction of a Federal Government program that provides funding to treat women with metastatic breast cancer with Herceptin (trastuzumab). In the 2003-04 budget, the government announced $20.7 million to be provided in 2004-05 and $22.7 million to be provided in 2005-0616. The latter was increased to $38.1 million in the 2005-06 budget17.
!!!! The increasing of the Cancer Institute NSW budget from $35m in 2004-05 to $65m in 2005-200618.
These additional health system costs would not be included in the AIHW estimates, and allowance has been made for this additional $186.6m in health system expenditure in 2005 (6.4%).
Finally, the AIHW include only 86% of total recurrent health expenditure in their estimates of expenditure by disease and injury, referred to as �allocated� health expenditure. The �unallocated� remainder includes capital expenditures, expenditure on community health (excluding mental health), public health programs (except cancer screening), health administration and health aids and appliances. Allowance has been made for the unallocated components of health system expenditure in the AIHW estimates.
The AIHW estimates do not include the costs of community palliative care services (but palliative care costs provided by hospitals and hospices are included) or respite services in aged care homes or in hospitals. Estimates of these costs are undertaken in Sections 6.1 and 6.2. Nor do the estimates include the costs of aids and modifications that are funded
14 http://www.health.gov.au/internet/wcms/publishing.nsf/Content/health-budget2002-fact-hfact2.htm 15 http://www.health.gov.au/internet/budget/publishing.nsf/Content/health-budget2005-hbudget-hfact1.htm and http://www.health.gov.au/internet/budget/publishing.nsf/Content/health-budget2005-glance.htm 16 http://ofw.facs.gov.au/publications/budget_0304.htm 17 http://www.budget.gov.au/2005-06/bp2/html/expense-14-c.htm 18 http://www.health.nsw.gov.au/cancer_inst/news/pdfs/CancerGetsMajorBoost.pdf

Cost of Cancer in NSW
57
privately or supplied by community health centres (but aids and modifications provided by hospitals are included). Estimates of these costs are undertaken in Section 6.5.
The estimates are only for the treatment of cancer, and do not include increased treatment costs of the long-term negative side-effects of cancer (for example, ongoing heart, lung or hearing problems due to chemotherapy) as technically these are classified as other diseases, or the reduction in lifetime health system costs due to premature death.
The final estimates of health system costs per person in 2005 are calculated by assuming:
!!!! everyone incurs the health system costs per person once in 2005; and
!!!! a smaller proportion of patients (based on the likelihood of dying in each following year) also incur these health costs in the following years (i.e. those that have active cancer).
The total health system costs are estimated by multiplying these costs per person by the incidence of cancer in NSW in 2005.
The proportions of health costs that are borne by each party are based on 2003-04 data on health system costs by sector (hospital, out of hospital, pharmaceutical and other costs) that are borne by each party (see Table 4-4). This methodology is used because some cancer treatments use less hospital services and more GP and specialist services and more pharmaceuticals (such as melanoma, prostate and breast cancer), which means that the individual is more likely to bear the cost of treatment.
TABLE 4-3 HEALTH SYSTEM COSTS BY SECTOR, 2003-04
Males Females H OoH P O H OoH P O
Melanoma 62% 18% 3% 17% 60% 22% 1% 17%Colorectal 81% 4% 1% 14% 80% 5% 2% 14%Prostate 29% 5% 48% 18% - - - -Breast* 53% 16% 20% 11% 53% 16% 20% 11%Lung 70% 3% 5% 22% 67% 5% 6% 22%Non-Hodgkin�s Lymphoma 81% 3% 1% 16% 78% 5% 2% 16%Leukaemia 78% 2% 0% 19% 78% 2% 0% 19%Bladder 72% 2% 2% 24% 72% 1% 3% 24%Kidney 82% 3% 2% 13% 83% 3% 1% 13%Stomach, Liver and Pancreatic 82% 1% 2% 15% 80% 2% 2% 15%Uterine, Ovarian and Cervical - - - - 74% 5% 3% 18%Brain 82% 2% 2% 15% 81% 2% 2% 15%Head, Neck and Thyroid 83% 1% 1% 15% 82% 2% 1% 15%Other 75% 2% 5% 17% 77% 2% 3% 17%
H = Hospital (includes admitted and out-patient expenditure, high-level residential care, ambulance), OoH = Out of Hospital (includes unreferred attendances, imaging, pathology and other professional services), P = Prescription (includes benefit-paid pharmaceuticals and other pharmaceuticals), O = Other (includes aids and modifications, community health and other, public health, dental services, administration, and research). *Health system costs for the treatment of breast cancer in males is assumed to be similar to the treatment of breast cancer in females. Source: AIHW (May 2005), Data tables.

Cost of Cancer in NSW
58
TABLE 4-4 HEALTH SECTORS BY WHO BEARS THE COST, 2003-04
Federal Government
State/Territory Government
Private Health Insurance
Individuals Other
Hospital 46.6% 32.7% 9.6% 6.4% 4.7%Out of Hospital 65.0% 0.0% 5.4% 22.0% 7.6%Prescription 52.0% 0.0% 0.4% 46.6% 1.0%Other 23.6% 30.0% 9.7% 34.1% 2.7%
Hospital includes admitted and out-patient expenditure, high-level residential care, ambulance. Out of Hospital includes unreferred attendances, imaging, pathology and other professional services. Prescription (includes benefit-paid pharmaceuticals and other pharmaceuticals). Other (includes aids and modifications, community health and other, public health, dental services, administration, and research). Source: AIHW (September 2005), Table A4.
4.2 SUMMARY OF HEALTH SYSTEM COSTS
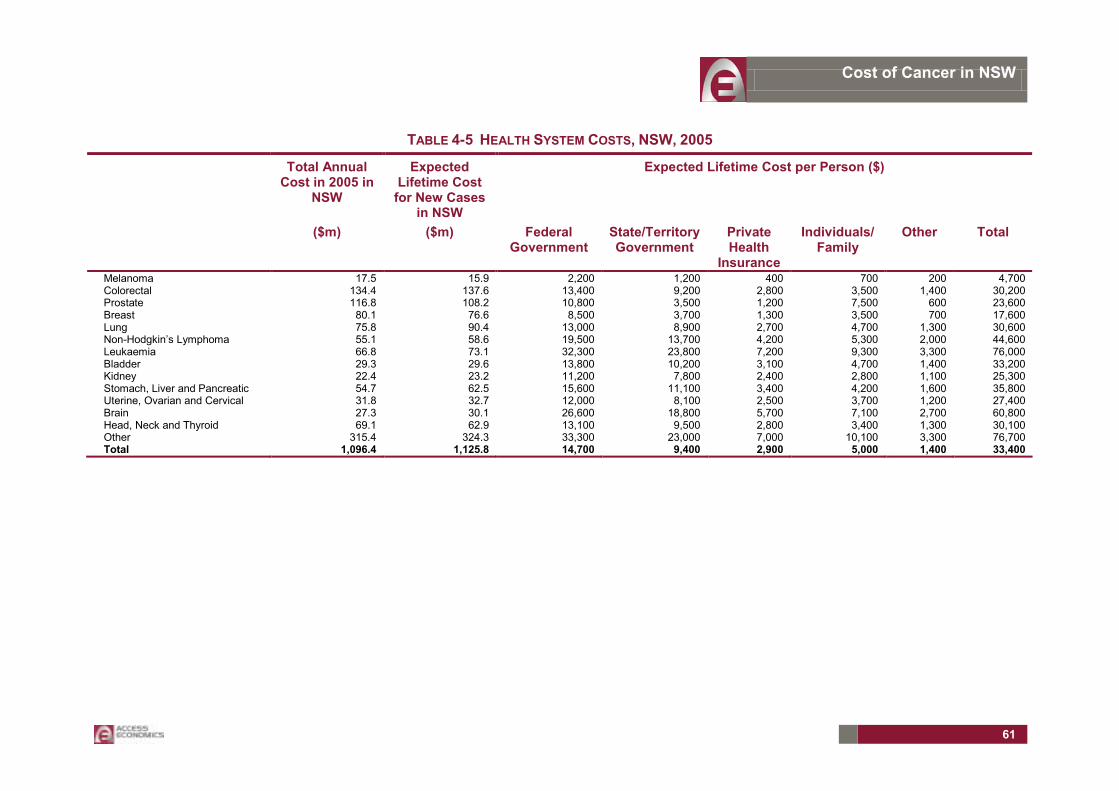
In 2005, the total annual health system cost of cancer in NSW is around $1,096.4 million, of which the most expensive cancers were colorectal (12%), prostate (11%), breast (7%) and lung (7%).
FIGURE 4-1 DISTRIBUTION OF TOTAL HEALTH SYSTEM COSTS, NSW, 2005
2%12%
11%
7%
7%
5%6%3%2%5%
3%2%
6%
29%
Melanoma
Colorectal
Prostate
Breast
Lung
Non-Hodgkin�s Lymphoma
Leukaemia
Bladder
Kidney
Stomach, Liver and Pancreatic
Uterine, Ovarian and Cervical
Brain
Head, Neck and Thyroid
Other
$1,096.4 millionTotal Cost =
The expected lifetime health system cost of people diagnosed in 2005 with cancer in NSW is around $1,125.8 million, of which $19.4 million will be spent on treating children (0-14 years), $415.3 million will be spent on treating people of working age (15-65 years), and $691.4 million will be spent on treating older persons (65+ years). The most costly cancers to the health system are colorectal ($137.6m), prostate ($108.2m), lung ($90.4m) and breast cancer ($76.6m).
The expected lifetime health system cost is $33,400 per person. Due to the types of cancers being treated, in general relatively more is spent for children ($94,500 per person) than people of working age or older persons ($29,900 and $35,300 per person, respectively). The most expensive cancers to treat are leukaemia ($76,000 per person) and brain cancer ($60,800 per person).

Cost of Cancer in NSW
59
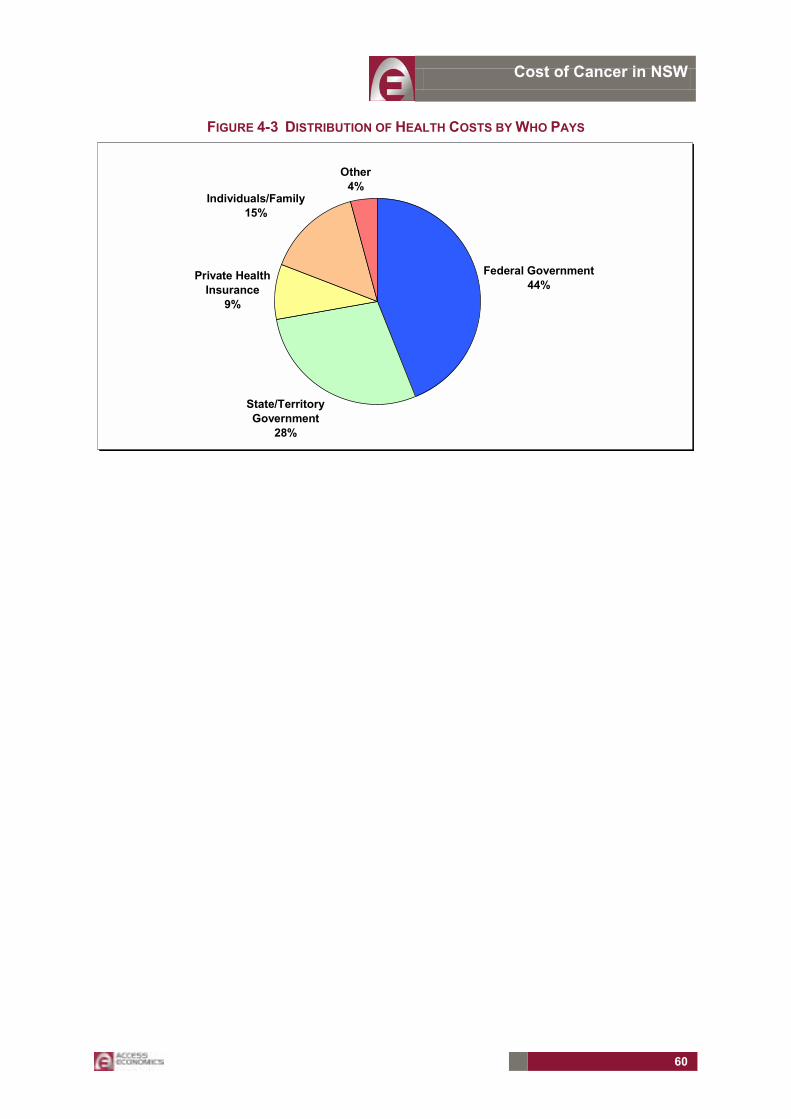
The expected lifetime health system cost borne by individuals and/or their family is $5,000 per person; with governments ($24,100), private health insurance ($2,900) and other organisations (such as workers� compensation and charities) ($1,400) funding the remaining cost of treatment19.
The proportion of treatment costs borne by individuals and/or their family is highly variable across cancers. For example, people with prostate and breast cancer bear 32% and 20% of the cost of treatment, respectively, compared to an average of 15% across all the cancers, mainly because treatment of these cancers use more GP and specialist services, and more pharmaceuticals and thus individuals contribute more in the form of gap and co-payments.
FIGURE 4-2 LIFETIME HEALTH SYSTEM COSTS PER PERSON, NSW, 2005
$0
$20,000
$40,000
$60,000
$80,000
$100,000
$120,000
$140,000
Melanoma ColorectalCancer
ProstateCancer
BreastCancer
LungCancer
Non-Hodgkin�sLymphoma
Leukaemia Bladdercancer
KidneyCancer
Stomach,Liver and
PancreaticCancer
Uterine,Ovarian
andCervical
BrainCancer
Head, Neckand Thyroid
Other
Children (Average = $94500)Working Age Population (Average = $29900)Older Population (Average = $35300)
19 Average across all cancer patients � the actual distribution of costs will differ depending on whether the patient has private health insurance and their level of coverage.
Cost of Cancer in NSW
60
FIGURE 4-3 DISTRIBUTION OF HEALTH COSTS BY WHO PAYS
Federal Government44%
State/Territory Government
28%
Private Health Insurance
9%
Individuals/Family15%
Other4%
Cost of Cancer in NSW
61
TABLE 4-5 HEALTH SYSTEM COSTS, NSW, 2005
Total Annual Cost in 2005 in
NSW
Expected Lifetime Cost for New Cases
in NSW
Expected Lifetime Cost per Person ($)
($m) ($m) Federal Government
State/Territory Government
Private Health
Insurance
Individuals/ Family
Other Total
Melanoma 17.5 15.9 2,200 1,200 400 700 200 4,700 Colorectal 134.4 137.6 13,400 9,200 2,800 3,500 1,400 30,200 Prostate 116.8 108.2 10,800 3,500 1,200 7,500 600 23,600 Breast 80.1 76.6 8,500 3,700 1,300 3,500 700 17,600 Lung 75.8 90.4 13,000 8,900 2,700 4,700 1,300 30,600 Non-Hodgkin�s Lymphoma 55.1 58.6 19,500 13,700 4,200 5,300 2,000 44,600 Leukaemia 66.8 73.1 32,300 23,800 7,200 9,300 3,300 76,000 Bladder 29.3 29.6 13,800 10,200 3,100 4,700 1,400 33,200 Kidney 22.4 23.2 11,200 7,800 2,400 2,800 1,100 25,300 Stomach, Liver and Pancreatic 54.7 62.5 15,600 11,100 3,400 4,200 1,600 35,800 Uterine, Ovarian and Cervical 31.8 32.7 12,000 8,100 2,500 3,700 1,200 27,400 Brain 27.3 30.1 26,600 18,800 5,700 7,100 2,700 60,800 Head, Neck and Thyroid 69.1 62.9 13,100 9,500 2,800 3,400 1,300 30,100 Other 315.4 324.3 33,300 23,000 7,000 10,100 3,300 76,700 Total 1,096.4 1,125.8 14,700 9,400 2,900 5,000 1,400 33,400

Cost of Cancer in NSW
62
5. PRODUCTIVITY COSTS Productivity costs due to cancer can have a significant and sometimes �hidden� impact on people with cancer and their family, reducing disposable household income.
In the short-term most people with cancer require time off work to attend medical appointments, receive treatment in hospital, or simply recover from their symptoms at home. Their carers may also take time off work to accompany them to medical appointments, stay with them in hospital, or care for them at home. Carers may also take time off work to undertake much of the unpaid work the person with cancer used to do � such as provide childcare, do the housework, yard work, shopping and so on. Some people with cancer and their carers may actually increase their productivity (at the expense of their leisure time) in order to pay for their increased cancer-related expenses or as a distraction from the illness.
In the long-term, if the cancer is terminal then the labour pool is reduced thus reducing the capacity of the economy to produce at any given level of unemployment. A cancer survivor may also choose to retire early and remain permanently out of the workforce (�permanently disabled�), or return to work at a lower level of productivity through:
!!!! reduced hours of work;
!!!! decreased efficiency;
!!!! changed responsibilities; and/or
!!!! changed employment.
The likelihood that the individual will return to work often increases with time passed since the end of treatment. However, other factors that influence whether a cancer survivor returns to work, and at what level of productivity, include the following (Main et al, 2005, Spelten et al, 2002).
!!!! Physical Impacts of Cancer !!!! Functional health, such as the ability to undertake labour-intensive tasks, or
limitations in mobility due to the loss of a limb. !!!! Physical health, such as coping with pain, nausea, fatigue, reduced hearing or
vision. !!!! Mental health, such as lack of sleep, stress, anxiety, depression, personality
changes from brain surgery. !!!! Cognitive health, such as the impact on memory, IQ, and the ability to remain
focussed.
!!!! Economic Needs !!!! The need for income or to pay off debt. !!!! The need to pay for bills and medical insurance. !!!! The need to provide for others.
!!!! Feelings about Work !!!! Workplace environment, such as the employer�s willingness to accommodate the
worker�s needs, how co-workers respond, and whether social support is provided.

Cost of Cancer in NSW
63
!!!! Motivation, such as finding work that is meaningful to the individual in terms of enjoyment, using the patient�s talents, and the perceived contribution to society.
!!!! Balance, such as the number of hours spent at work compared to hours spent with family/friends.
!!!! Personal growth, such as the role of work as a distraction from their illness (or just something to do), providing a sense of self-worth and control over their life.
!!!! The fear of job loss.
Depending on the length of time the patient is out of work, cancer can have a substantial impact on the attainment of experience and hence career development.
Especially for children, cancer may lead to long-term impacts on their future productivity through reduced educational achievement as a result of cognitive problems and non-attendance at school (Stam 2005: 228).
There are two components to productivity losses which are measured in this section:
A the initial short-run disruption (friction) until production is restored to former levels (due to temporary absences); and
B the loss of the labour resource (if there is permanent disability or fatality) over the longer term, which reduces the capacity of the economy to produce at any given level of unemployment.
Figure 5-1 illustrates some potential variations in productivity losses, and whether they are �funded� through sick leave, Sickness Allowance, the Disability Support Pension (DSP) or lost/reduced earnings.

Cost of Cancer in NSW
64
FIGURE 5-1 PRODUCTIVITY LOSSES
Minimal Productivity Loss - Covered Entirely by Sick Leave Minimal Productivity Loss - Covered Partially by Sick Leave
Moderate Productivity Loss - Reduced Rate of Future Earnings Significant Productivity Loss - Permanent Disability
Significant Productivity Loss - Death
Income ($)
Time
Diagnosis Return to work
Sick leave
Income ($)
Time
Diagnosis Return to work
Sick leave
Sickness allowance
Lost current earnings
Income ($)
Time
Diagnosis Return to work
Sick leave
Sickness allowance
Lost current earnings
Lost future earnings
Reduced future earnings
Income ($)
Time
Diagnosis
Sick leave
Lost current and future earnings
Disability Support Pension
Income ($)
Time
Diagnosis
Sick leave
Lost current and future earnings
Disability Support Pension
Death
Cost of Cancer in NSW
65
5.1 SHORT-TERM PRODUCTIVITY COSTS
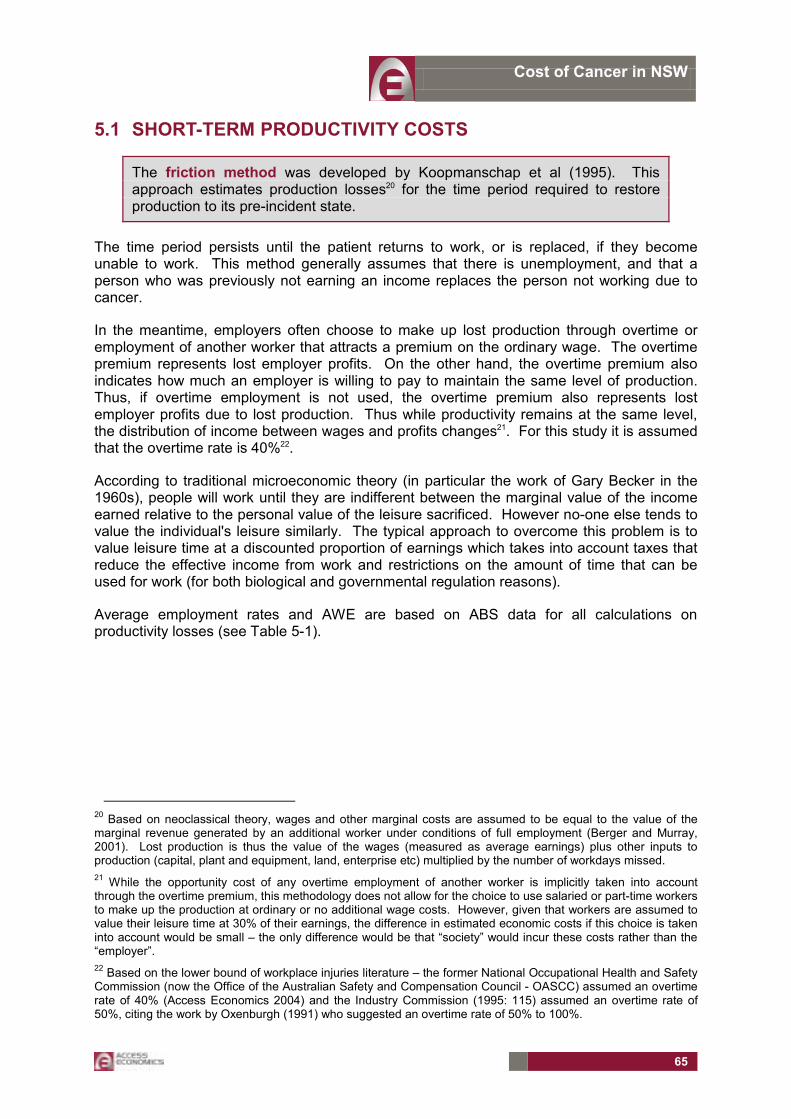
The friction method was developed by Koopmanschap et al (1995). This approach estimates production losses20 for the time period required to restore production to its pre-incident state.
The time period persists until the patient returns to work, or is replaced, if they become unable to work. This method generally assumes that there is unemployment, and that a person who was previously not earning an income replaces the person not working due to cancer.
In the meantime, employers often choose to make up lost production through overtime or employment of another worker that attracts a premium on the ordinary wage. The overtime premium represents lost employer profits. On the other hand, the overtime premium also indicates how much an employer is willing to pay to maintain the same level of production. Thus, if overtime employment is not used, the overtime premium also represents lost employer profits due to lost production. Thus while productivity remains at the same level, the distribution of income between wages and profits changes21. For this study it is assumed that the overtime rate is 40%22.
According to traditional microeconomic theory (in particular the work of Gary Becker in the 1960s), people will work until they are indifferent between the marginal value of the income earned relative to the personal value of the leisure sacrificed. However no-one else tends to value the individual's leisure similarly. The typical approach to overcome this problem is to value leisure time at a discounted proportion of earnings which takes into account taxes that reduce the effective income from work and restrictions on the amount of time that can be used for work (for both biological and governmental regulation reasons).
Average employment rates and AWE are based on ABS data for all calculations on productivity losses (see Table 5-1).
20 Based on neoclassical theory, wages and other marginal costs are assumed to be equal to the value of the marginal revenue generated by an additional worker under conditions of full employment (Berger and Murray, 2001). Lost production is thus the value of the wages (measured as average earnings) plus other inputs to production (capital, plant and equipment, land, enterprise etc) multiplied by the number of workdays missed. 21 While the opportunity cost of any overtime employment of another worker is implicitly taken into account through the overtime premium, this methodology does not allow for the choice to use salaried or part-time workers to make up the production at ordinary or no additional wage costs. However, given that workers are assumed to value their leisure time at 30% of their earnings, the difference in estimated economic costs if this choice is taken into account would be small � the only difference would be that �society� would incur these costs rather than the �employer�. 22 Based on the lower bound of workplace injuries literature � the former National Occupational Health and Safety Commission (now the Office of the Australian Safety and Compensation Council - OASCC) assumed an overtime rate of 40% (Access Economics 2004) and the Industry Commission (1995: 115) assumed an overtime rate of 50%, citing the work by Oxenburgh (1991) who suggested an overtime rate of 50% to 100%.

Cost of Cancer in NSW
66
TABLE 5-1 AVERAGE EMPLOYMENT RATE AND AWE IN THE AUSTRALIAN POPULATION
Chance of Being Employed (%) Average Weekly Earnings ($) Age Males Females Males Females
0-4 0.0 0.0 0 05-9 0.0 0.0 0 010-14 0.0 0.0 0 015-19 55.8 58.9 268 20120-24 85.2 78.8 571 49025-29 89.9 74.8 917 68130-34 90.3 68.7 917 68135-39 90.6 70.8 1065 65840-44 89.4 75.0 1065 65845-49 90.0 77.4 1076 67950-54 86.0 68.7 1076 67955-59 72.8 52.7 1009 66260-64 50.8 28.1 862 58965-69 20.7 8.5 578 38970-74 5.9 1.3 578 38975-79 0.0 0.0 578 38980-84 0.0 0.0 578 38985-89 0.0 0.0 578 38990+ 0.0 0.0 578 389
Source: ABS 6105.0, ABS 6310.0 (Indexed to $2005).
5.1.1 TEMPORARY ABSENTEEISM
Two studies were identified that estimate average days absent from work of employed people with cancer.
!!!! A US study interviewed 445 employed people with breast or prostate cancer and found that 93% of people with breast cancer and 82% of people with prostate cancer missed at least one day of work over a period of six months from diagnosis, and on average they missed 44.5 days and 27 days from work, respectively (Bradley 2005).
!!!! The NHS estimated that, of employed people with cancer, 17.2% of males and 15.5% of females had days away from work due to their illness in the past two weeks, and on average they lost 4.8 days from work � equivalent to 20.5 days over 12 months per employed person. While this estimate includes people with cancer taking time off for work due to non-cancer related reasons, this estimate is more likely to underestimate days absent as the survey is more likely to capture cancer survivors rather than people actively being treated for cancer (see Section 2.3.4) � thus lowering the average days absent.
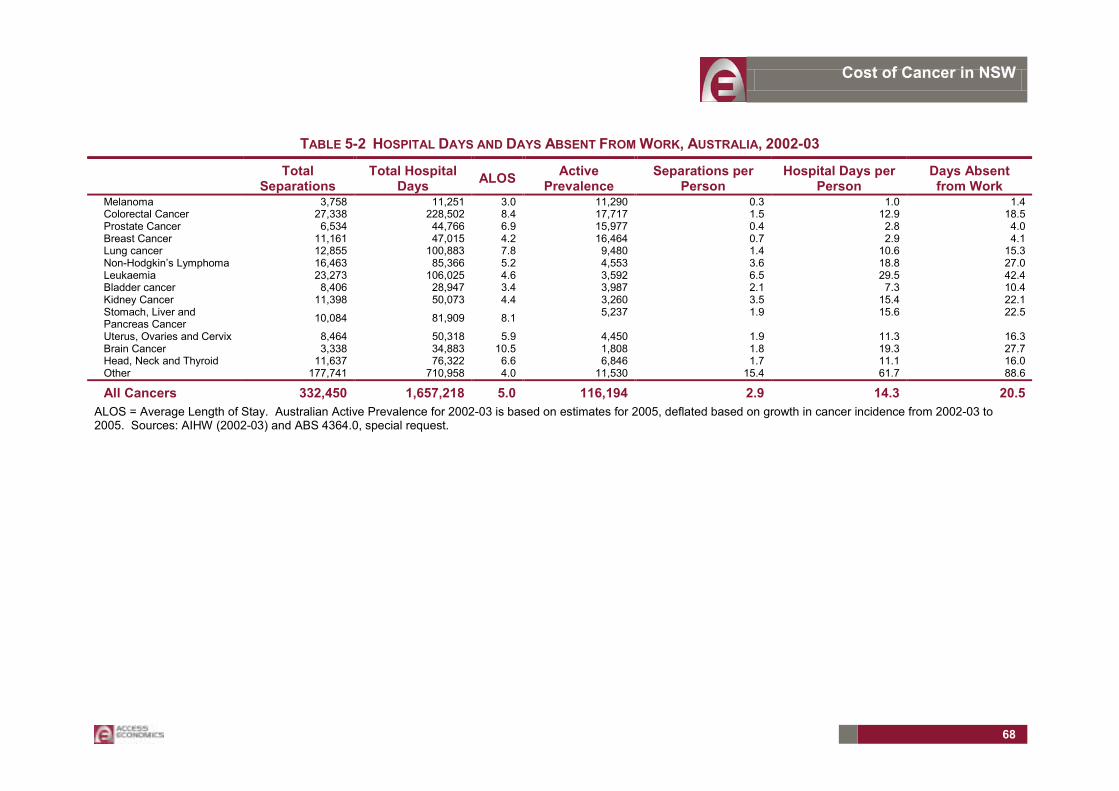
In addition, data collected from the AIHW show that the average length of stay in hospital in 2002-03 for a person with cancer was 14.3 days, which represents 70% of days absent from work compared to the NHS. Estimating days absent from work by cancer type by inflating hospital days by 43% (1/70%) will provide a more accurate distribution of likely absenteeism, as well as being a conservative estimate since:
!!!! the NHS is likely to underestimate days absent for people actively being treated for cancer,
!!!! if the hospital days excluded days in hospital on weekends then the ratio between hospital days and days absent would decrease (thus increasing the inflation rate), and

Cost of Cancer in NSW
67
!!!! for some cancers, notably breast and prostate, chemotherapy with recovery in the home, rather than treatment in hospital, is increasingly used.
Some people may use sick, annual, or long service leave when they are temporarily absent from work. It is estimated that 71.2% of females and 78.1% of males are paid for the days taken off paid work (ABS 6342.0) and the employer incurs wages, on-costs and an overtime premium relating to the paid days off work, while the worker incurs the lost wages relating to the remaining unpaid days off work.
Furthermore, each day a patient is absent from work it is estimated that 30 minutes of management time is lost processing those absent workers23. This includes the time of line managers in rearranging work and the time of back-office personnel. The cost of managers� time in 2004 is estimated to be $1286 for an average working week of 40.2 hours (ABS 6310.0) plus 15.5% on costs (ABS 6348.0.55.001).
23 The HSE (1999) assume that administrative costs associated with dealing with absences (such as the calculation and payments of benefits, processing of sick leave and extra management time) equates to an average of 30 minutes per day of absence.
Cost of Cancer in NSW
68
TABLE 5-2 HOSPITAL DAYS AND DAYS ABSENT FROM WORK, AUSTRALIA, 2002-03
Total Separations
Total Hospital Days ALOS Active
Prevalence Separations per
Person Hospital Days per
Person Days Absent from Work
Melanoma 3,758 11,251 3.0 11,290 0.3 1.0 1.4 Colorectal Cancer 27,338 228,502 8.4 17,717 1.5 12.9 18.5 Prostate Cancer 6,534 44,766 6.9 15,977 0.4 2.8 4.0 Breast Cancer 11,161 47,015 4.2 16,464 0.7 2.9 4.1 Lung cancer 12,855 100,883 7.8 9,480 1.4 10.6 15.3 Non-Hodgkin�s Lymphoma 16,463 85,366 5.2 4,553 3.6 18.8 27.0 Leukaemia 23,273 106,025 4.6 3,592 6.5 29.5 42.4 Bladder cancer 8,406 28,947 3.4 3,987 2.1 7.3 10.4 Kidney Cancer 11,398 50,073 4.4 3,260 3.5 15.4 22.1 Stomach, Liver and Pancreas Cancer 10,084 81,909 8.1 5,237 1.9 15.6 22.5
Uterus, Ovaries and Cervix 8,464 50,318 5.9 4,450 1.9 11.3 16.3 Brain Cancer 3,338 34,883 10.5 1,808 1.8 19.3 27.7 Head, Neck and Thyroid 11,637 76,322 6.6 6,846 1.7 11.1 16.0 Other 177,741 710,958 4.0 11,530 15.4 61.7 88.6
All Cancers 332,450 1,657,218 5.0 116,194 2.9 14.3 20.5 ALOS = Average Length of Stay. Australian Active Prevalence for 2002-03 is based on estimates for 2005, deflated based on growth in cancer incidence from 2002-03 to 2005. Sources: AIHW (2002-03) and ABS 4364.0, special request.

Cost of Cancer in NSW
69
5.2 LONG-TERM PRODUCTIVITY COSTS
The human capital method estimates production losses based on the remaining expected lifetime earnings for the individual.
Avenues through which cancer can lead to the long-term reduction in the productive capacity of the labour force include long-term absence from employment or reduction in hours of work, long-term reduction in the productivity per hour worked, premature retirement24 and premature mortality (i.e. some people may die before retirement age).
A full economic analysis of the effects of a disease on the economy would also examine the long-run situation where the lost productive capacity of the labour force (incurred via the worker or the employer) is passed onto society through adjustments in wages and prices. A reduction in the supply of labour would increase wages, which would be passed on to consumers through price increases. At the same time a decrease in the demand for goods and services would decrease prices, which would push down wages. The overall impact on the economy depends on a complex array of elasticities. However, this study assumes that, in the absence of the disease, people with cancer would participate in the labour force and obtain employment at the same rate as other Australians, and earn the same average weekly earnings. The implicit and probable economic assumption is that the numbers of such people would not be of sufficient magnitude to substantially influence the overall clearing of the labour market.
The following methodology is used to estimate lost long-run productivity costs.
!!!! The expected retirement age by the current age of the worker is calculated based on the participation rates at each age group. Similar to life expectancy, the older the person, the less time it is expected that the person will remain in the workforce but the older they are when they do leave the workforce (see Table 5-3). Note that this methodology takes into account the probability that the patient is working.
!!!! As the person ages, the annual income (based on AWE) is multiplied by the average employment rate at each age group while alive. Income earned at each age is then summed to calculate the expected total income over a person�s lifetime (discounted back to present values).
24 Note that the methodology for premature retirement cannot be used in addition to long-term reduction in employment and premature death due to double counting.

Cost of Cancer in NSW
70
TABLE 5-3 EXPECTED RETIREMENT AGE AND REMAINING LIFETIME EARNINGS (2005 DOLLARS)
Expected Retirement Age if Employed
Expected Remaining Lifetime Earnings ($m)
Age Males Females Males Females 0-4 63 60 1.03 0.57 5-9 63 60 1.12 0.62 10-14 63 60 1.20 0.67 15-19 63 60 1.30 0.72 20-24 63 60 1.36 0.75 25-29 63 60 1.34 0.70 30-34 63 60 1.22 0.62 35-39 63 60 1.10 0.54 40-44 63 60 0.92 0.46 45-49 63 60 0.74 0.36 50-54 63 61 0.53 0.24 55-59 64 62 0.32 0.13 60-64 65 64 0.15 0.05 65-69 68 68 0.04 0.01 70-74 72 72 0.01 0.00 75-79 77 77 0.00 0.00 80-84 82 82 0.00 0.00 85-89 87 87 0.00 0.00 90+ 92 92 0.00 0.00
Sources: ABS 6105.0, ABS 6310.0 (Indexed to $2005)
Consequently:
!!!! For permanent disability: the expected remaining lifetime earnings are reduced by the percentage reduction in employment during the period the individual has a lower level of employment.
!!!! For premature death: the entire expected remaining lifetime earnings for the individual are lost. The productivity costs of premature mortality are allocated to the year that the person died.
If an employed person stops working or prematurely dies from cancer, there are also staff turnover costs borne by the employer. These turnover costs are estimated to be equal to 26 weeks salary of the incumbent worker (Access Economics 2004a). However this cost is merely �brought forward� a number of years because there would be some normal turnover of cancer patients � approximately 15% per annum (which implies that people change jobs, on average, approximately once every 6.7 years (Access Economics 2004b).
5.2.1 STUDIES EXAMINING EMPLOYMENT RATES
International Studies
A literature review revealed that various international studies report that cancer reduced employment rates by 27%, on average (see Table 5-4). However, it may not be appropriate to apply this rate to the Australian context due to differences in health care access, disability laws and access to income support.

Cost of Cancer in NSW
71
TABLE 5-4 INTERNATIONAL STUDIES ON THE IMPACT ON EMPLOYMENT
Study Cancer No. of Resp.
Yrs since Diagnosis
Impact on Employment*
Cross Sectional Bradley et al (2002) Breast 39 <=2 -10% Bradley et al (2002) Breast 117 >=3 -6% Longitudinal Satariano and DeLorenzo (1996) Breast 296 1 -28% Maunsell (2004) Breast 646 3 -21% Bushunow et al (1995) Breast 145 6 -7% Greenwald et al (1989) Mixed 247 1 -50% Staley et al (1987) Mixed 61 1 -10% Short et al (2005) Mixed 1372 4 -16% Weis et al (1992) Mixed 377 4 -59% Main (2005) Mixed 27 7 -19% van der Wouden et al (1992) Mixed 309 8 -56% de Lima et al (1997) Leukaemia 181 3 -26% Razavi et al (1993) Lymphoma 41 4 -46%
Weighted Average 3,858 3.7 -27%* In the cross sectional analysis this is the difference in employment rates between cancer survivors and the control group, controlling for other factors. While in the longitudinal analysis this is the proportion of cancer survivors who were employed at diagnosis, who are employed at a point in time after diagnosis.
Survey of Disability, Ageing and Carers, 2003
The 2003 Survey of Disability, Ageing and Carers (SDAC) is a national survey conducted by the ABS to measure disability. In particular it collected detailed information on:
!!!! people with disabilities;
!!!! older people; and
!!!! those who provided care for older people and people with disabilities.
Information was also collected on people who were not in these populations, allowing for comparison of their relative demographic and socioeconomic situations. In addition to people living in private dwellings, those in cared accommodation, such as nursing homes, were also surveyed. Data on long-term health conditions was based on self-identification rather than clinical diagnosis (thus there may be under reporting of cancer) and time elapsed since diagnosis was not reported. The survey uses questions about activity limitation to screen for respondents before asking questions about conditions present, and thus is likely to miss people with cancer without activity limitation � for example those in the very early stages of diagnosis, and those who have finished their treatment regimes. Consequently the SDAC estimate of prevalence is more likely to identify people currently undergoing treatment and would be closer to the estimate of �active prevalence�.
Analysis of mean employment rates from SDAC reveals (see Table 5-5) that overall cancer reduces the probability of employment by 41% in males and 17% in females (28% overall); however this affect is mainly driven by reduced employment in the 45-64 year olds when decisions about the age of retirement become important.
Cost of Cancer in NSW
72
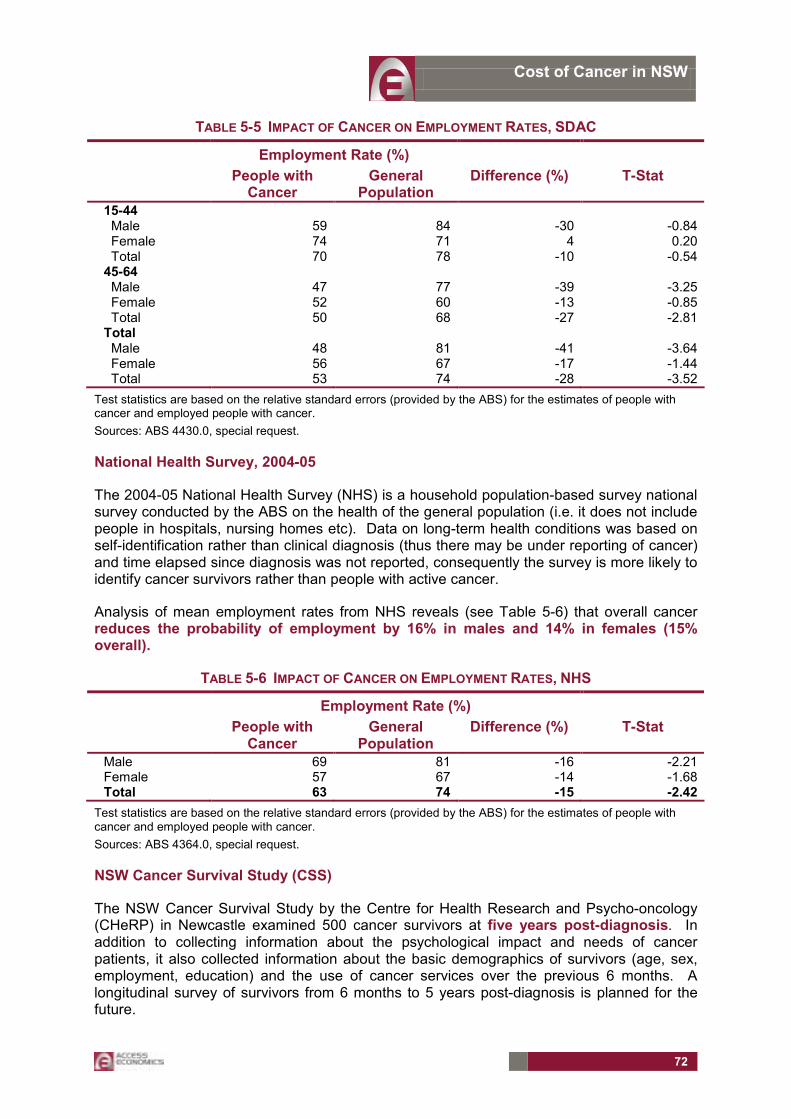
TABLE 5-5 IMPACT OF CANCER ON EMPLOYMENT RATES, SDAC
Employment Rate (%) People with
Cancer General
Population Difference (%) T-Stat
15-44 Male 59 84 -30 -0.84 Female 74 71 4 0.20 Total 70 78 -10 -0.5445-64 Male 47 77 -39 -3.25 Female 52 60 -13 -0.85 Total 50 68 -27 -2.81Total Male 48 81 -41 -3.64 Female 56 67 -17 -1.44 Total 53 74 -28 -3.52
Test statistics are based on the relative standard errors (provided by the ABS) for the estimates of people with cancer and employed people with cancer. Sources: ABS 4430.0, special request.
National Health Survey, 2004-05
The 2004-05 National Health Survey (NHS) is a household population-based survey national survey conducted by the ABS on the health of the general population (i.e. it does not include people in hospitals, nursing homes etc). Data on long-term health conditions was based on self-identification rather than clinical diagnosis (thus there may be under reporting of cancer) and time elapsed since diagnosis was not reported, consequently the survey is more likely to identify cancer survivors rather than people with active cancer.
Analysis of mean employment rates from NHS reveals (see Table 5-6) that overall cancer reduces the probability of employment by 16% in males and 14% in females (15% overall).
TABLE 5-6 IMPACT OF CANCER ON EMPLOYMENT RATES, NHS
Employment Rate (%) People with
Cancer General
Population Difference (%) T-Stat
Male 69 81 -16 -2.21Female 57 67 -14 -1.68Total 63 74 -15 -2.42
Test statistics are based on the relative standard errors (provided by the ABS) for the estimates of people with cancer and employed people with cancer. Sources: ABS 4364.0, special request.
NSW Cancer Survival Study (CSS)
The NSW Cancer Survival Study by the Centre for Health Research and Psycho-oncology (CHeRP) in Newcastle examined 500 cancer survivors at five years post-diagnosis. In addition to collecting information about the psychological impact and needs of cancer patients, it also collected information about the basic demographics of survivors (age, sex, employment, education) and the use of cancer services over the previous 6 months. A longitudinal survey of survivors from 6 months to 5 years post-diagnosis is planned for the future.
Cost of Cancer in NSW
73
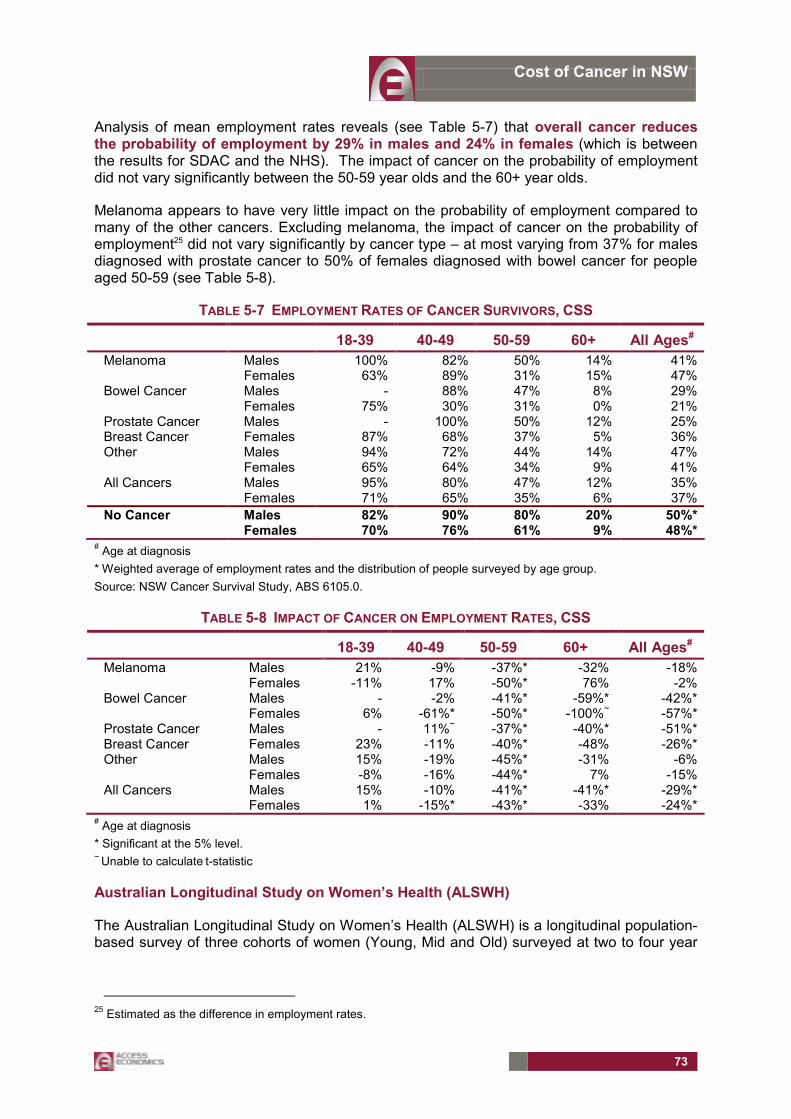
Analysis of mean employment rates reveals (see Table 5-7) that overall cancer reduces the probability of employment by 29% in males and 24% in females (which is between the results for SDAC and the NHS). The impact of cancer on the probability of employment did not vary significantly between the 50-59 year olds and the 60+ year olds.
Melanoma appears to have very little impact on the probability of employment compared to many of the other cancers. Excluding melanoma, the impact of cancer on the probability of employment25 did not vary significantly by cancer type � at most varying from 37% for males diagnosed with prostate cancer to 50% of females diagnosed with bowel cancer for people aged 50-59 (see Table 5-8).
TABLE 5-7 EMPLOYMENT RATES OF CANCER SURVIVORS, CSS
18-39 40-49 50-59 60+ All Ages# Melanoma Males 100% 82% 50% 14% 41% Females 63% 89% 31% 15% 47%Bowel Cancer Males - 88% 47% 8% 29% Females 75% 30% 31% 0% 21%Prostate Cancer Males - 100% 50% 12% 25%Breast Cancer Females 87% 68% 37% 5% 36%Other Males 94% 72% 44% 14% 47% Females 65% 64% 34% 9% 41%All Cancers Males 95% 80% 47% 12% 35% Females 71% 65% 35% 6% 37%No Cancer Males 82% 90% 80% 20% 50%* Females 70% 76% 61% 9% 48%*
# Age at diagnosis * Weighted average of employment rates and the distribution of people surveyed by age group. Source: NSW Cancer Survival Study, ABS 6105.0.
TABLE 5-8 IMPACT OF CANCER ON EMPLOYMENT RATES, CSS
18-39 40-49 50-59 60+ All Ages# Melanoma Males 21% -9% -37%* -32% -18% Females -11% 17% -50%* 76% -2%Bowel Cancer Males - -2% -41%* -59%* -42%* Females 6% -61%* -50%* -100%~ -57%*Prostate Cancer Males - 11%~ -37%* -40%* -51%*Breast Cancer Females 23% -11% -40%* -48% -26%*Other Males 15% -19% -45%* -31% -6% Females -8% -16% -44%* 7% -15%All Cancers Males 15% -10% -41%* -41%* -29%* Females 1% -15%* -43%* -33% -24%*
# Age at diagnosis * Significant at the 5% level. ~ Unable to calculate t-statistic
Australian Longitudinal Study on Women�s Health (ALSWH)
The Australian Longitudinal Study on Women�s Health (ALSWH) is a longitudinal population-based survey of three cohorts of women (Young, Mid and Old) surveyed at two to four year
25 Estimated as the difference in employment rates.
Cost of Cancer in NSW
74
intervals over a 20 year period. Management and research of the ALSWH is conducted by the University of Newcastle and the University of Queensland.
Econometric analysis found that, all else being equal, ever being diagnosed with (non skin) cancer reduces the probability of employment on average by 4.2%, but has no significant negative impact on hours worked and earnings per hour worked (see Appendix).
5.2.2 EMPLOYMENT PATHWAYS AFTER DIAGNOSIS
Short et al (2005) examined the employment pathways of cancer survivors after diagnosis. The study surveyed 1763 cancer survivors aged between 25 and 62, found that of the 88% of male survivors and 78% of female survivors who were working at the time of diagnosis, 41% and 39% stopped working during cancer treatment (0-5 months after diagnosis). Gradually these survivors returned to work, although:
!!!! of the survivors who continued to work during their cancer treatment, 9% quit working for cancer-related reasons in the following three years; and
!!!! of the survivors who returned to working during the first year after diagnosis, 11% quit working for cancer-related reasons in the following three years.
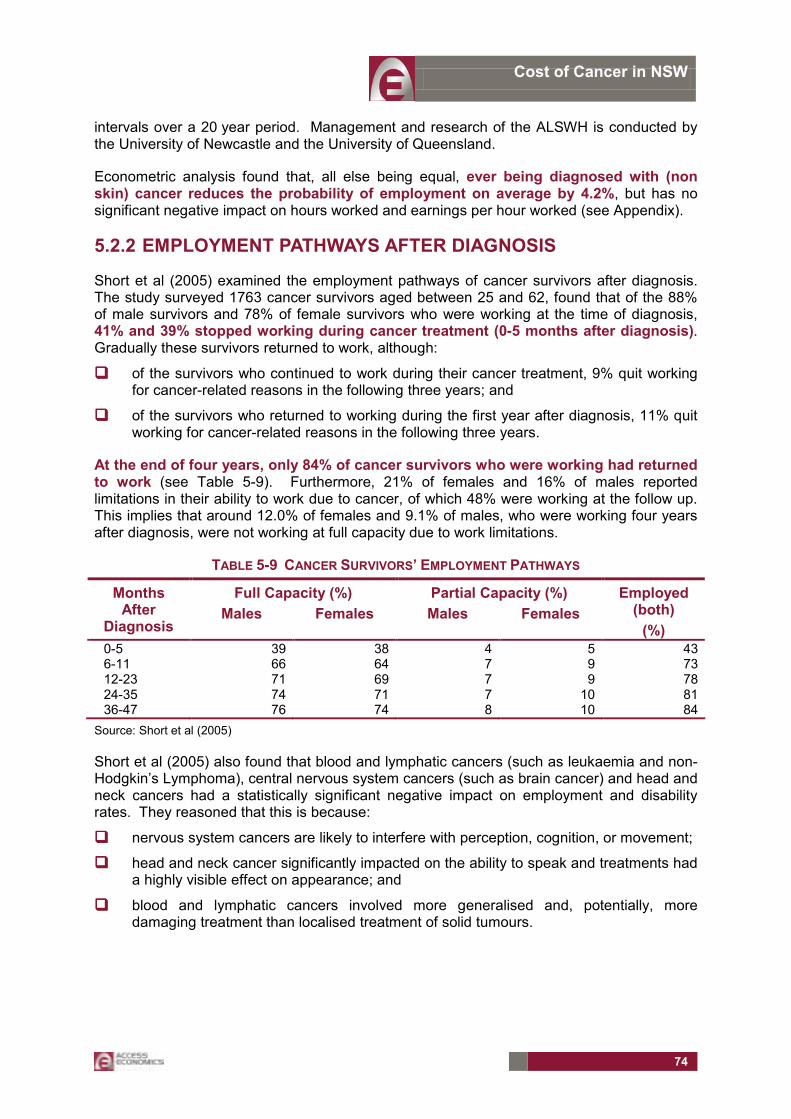
At the end of four years, only 84% of cancer survivors who were working had returned to work (see Table 5-9). Furthermore, 21% of females and 16% of males reported limitations in their ability to work due to cancer, of which 48% were working at the follow up. This implies that around 12.0% of females and 9.1% of males, who were working four years after diagnosis, were not working at full capacity due to work limitations.
TABLE 5-9 CANCER SURVIVORS� EMPLOYMENT PATHWAYS
Full Capacity (%) Partial Capacity (%) Months After
Diagnosis Males Females Males Females
Employed (both)
(%) 0-5 39 38 4 5 436-11 66 64 7 9 7312-23 71 69 7 9 7824-35 74 71 7 10 8136-47 76 74 8 10 84
Source: Short et al (2005)
Short et al (2005) also found that blood and lymphatic cancers (such as leukaemia and non-Hodgkin�s Lymphoma), central nervous system cancers (such as brain cancer) and head and neck cancers had a statistically significant negative impact on employment and disability rates. They reasoned that this is because:
!!!! nervous system cancers are likely to interfere with perception, cognition, or movement;
!!!! head and neck cancer significantly impacted on the ability to speak and treatments had a highly visible effect on appearance; and
!!!! blood and lymphatic cancers involved more generalised and, potentially, more damaging treatment than localised treatment of solid tumours.

Cost of Cancer in NSW
75
TABLE 5-10 CANCER SURVIVORS� LIKELIHOOD OF QUITTING BY CANCER TYPE
Odds Ratio 95% CI Blood Cancers 3.030 1.238�7.416Central Nervous System 2.202 0.785�6.179Head and Neck 1.713 0.684�4.293
Comparison group has colorectal cancer, which was the most prevalent cancer in the group surveyed. Source: Short et al (2005)
Although Short et al (2005) did not find a significant variation in quit rates by age, there is a noticeable pattern with the odds ratio of likelihood of quitting with age.
TABLE 5-11 CANCER SURVIVORS LIKELIHOOD OF QUITTING BY AGE
Odds Ratio 95% CI 45-52 years 1.081 0.631-1.85353-57 years 1.080 0.603-1.93558-61 years 1.268 0.677-2.37662+ years 1.631 0.819-3.245
Comparison group is aged <45. Source: Short et al (2005)
5.2.3 SUMMARY OF IMPACT ON EMPLOYMENT RATES
While the international literature may not be directly comparable with the Australian context, it does allow comparison to ensure the results from the Australian studies are sensible. Given the survey methodology, SDAC is more likely to capture people actively being treated for cancer (comparable to Short et al (2005) which estimates a 50% reduction in employment rates in the first six months since diagnosis). In comparison, the NHS is more likely to have captured mainly longer-term survivors.
Consequently this study will assume that the short-term impact of cancer on the probability of employment for people while they have active cancer is -41% for males and -17% for females (based on SDAC).
ALSWH focused on people who have ever been diagnosed with cancer, and thus is most likely to reflect the long-term impact of cancer. Furthermore as the analysis controlled for most other factors that influence employment rates, it is probably the most accurate in attributing changes in employment to cancer. As many of the surveys identified found significant differences between males and females, the impact on productivity for females from the ALSWH will be inflated by the ratio between males and females from SDAC to estimate the long-term impact on males.
Consequently this study will assume that the long-term impact of cancer on the probability of employment for people ever diagnosed with cancer is -10.3% for males and -4.2% for females, with people gradually returning to work at a linear rate until five years after diagnosis.
Short et al (2005) found no significant difference by age between 45 to 62 years old and neither did analysis of the CSS between the 50-59 year olds and the 60+ year olds. There is not enough information to determine any significant difference between these age groups and the younger ages.
Cost of Cancer in NSW
76
Consequently for adult survivors of cancer the impact on employment rates by age group will not be varied for this study.
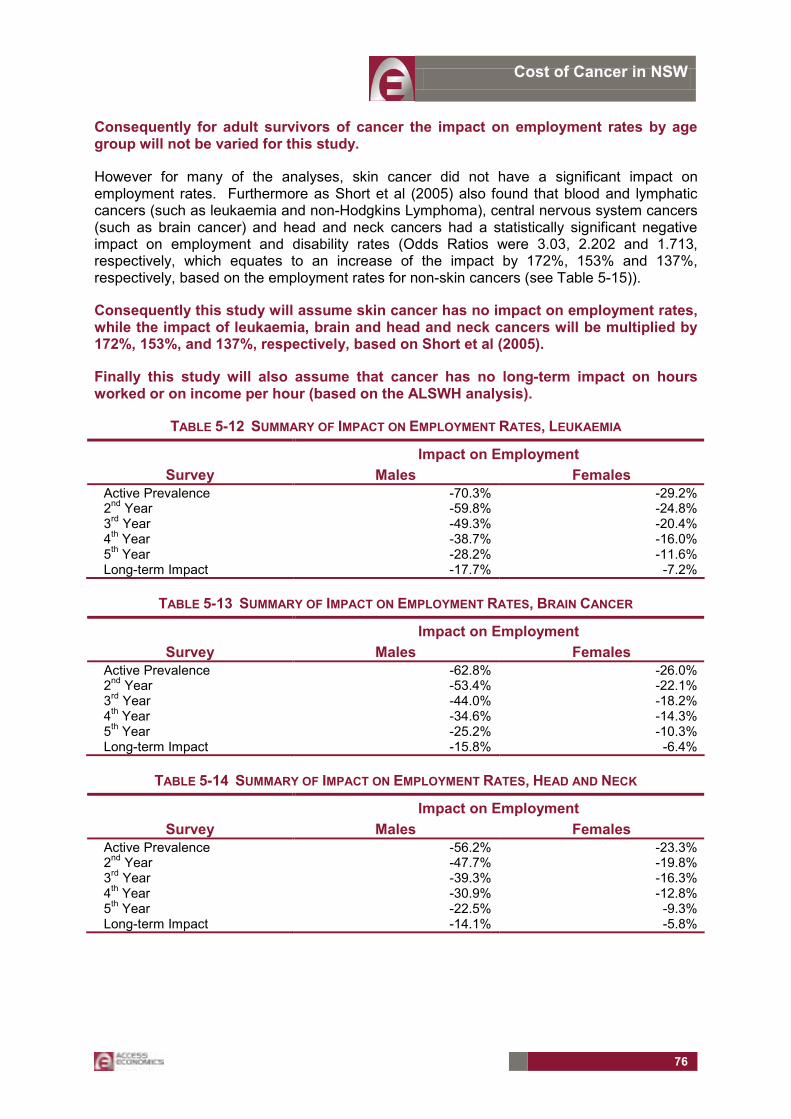
However for many of the analyses, skin cancer did not have a significant impact on employment rates. Furthermore as Short et al (2005) also found that blood and lymphatic cancers (such as leukaemia and non-Hodgkins Lymphoma), central nervous system cancers (such as brain cancer) and head and neck cancers had a statistically significant negative impact on employment and disability rates (Odds Ratios were 3.03, 2.202 and 1.713, respectively, which equates to an increase of the impact by 172%, 153% and 137%, respectively, based on the employment rates for non-skin cancers (see Table 5-15)).
Consequently this study will assume skin cancer has no impact on employment rates, while the impact of leukaemia, brain and head and neck cancers will be multiplied by 172%, 153%, and 137%, respectively, based on Short et al (2005).
Finally this study will also assume that cancer has no long-term impact on hours worked or on income per hour (based on the ALSWH analysis).
TABLE 5-12 SUMMARY OF IMPACT ON EMPLOYMENT RATES, LEUKAEMIA
Impact on Employment Survey Males Females
Active Prevalence -70.3% -29.2%2nd Year -59.8% -24.8%3rd Year -49.3% -20.4%4th Year -38.7% -16.0%5th Year -28.2% -11.6%Long-term Impact -17.7% -7.2%
TABLE 5-13 SUMMARY OF IMPACT ON EMPLOYMENT RATES, BRAIN CANCER
Impact on Employment Survey Males Females
Active Prevalence -62.8% -26.0%2nd Year -53.4% -22.1%3rd Year -44.0% -18.2%4th Year -34.6% -14.3%5th Year -25.2% -10.3%Long-term Impact -15.8% -6.4%
TABLE 5-14 SUMMARY OF IMPACT ON EMPLOYMENT RATES, HEAD AND NECK
Impact on Employment Survey Males Females
Active Prevalence -56.2% -23.3%2nd Year -47.7% -19.8%3rd Year -39.3% -16.3%4th Year -30.9% -12.8%5th Year -22.5% -9.3%Long-term Impact -14.1% -5.8%

Cost of Cancer in NSW
77
TABLE 5-15 SUMMARY OF IMPACT ON EMPLOYMENT RATES, OTHER NON SKIN CANCERS
Impact on Employment Survey Males Females
Active Prevalence -41.0% -17.0%2nd Year -34.9% -14.4%3rd Year -28.7% -11.9%4th Year -22.6% -9.3%5th Year -16.4% -6.8%Long-term Impact -10.3% -4.2%
5.2.4 PRODUCTIVITY IMPACTS ON CHILDREN AND ADOLESCENTS
While many adult survivors are able to return to similar productivity levels after recovering from cancer, reduced educational attainment through reduced cognitive functioning and memory from radiotherapy and chemotherapy, and frequent and sometimes extended non-attendance at school will lead to longer-term impacts on future productivity (Stam 2005: 228 and Eiser 1998: 625). Ongoing health problems as a result of treatment can further reinforce these impacts on productivity.
There is a strong body of evidence that the age of treatment is a strong predictor of IQ deficits, with children treated below the age of 5 years being highly vulnerable (Eiser 1998: 625).
Langeveld (2003), a Dutch study of 500 childhood cancer survivors and a 1092 person reference group (average age of 24 years), examined the impact of cancer on education and employment. By comparing means, it found that survivors of childhood cancer are 19% less likely to have a high school qualification or higher, and a 25% to 32% lower employment rate.
In comparison, an econometric analysis of the Australian Longitudinal Study on Women�s Health (ALSWH) found that, all else being equal, at least seven years after diagnosis/treatment, childhood cancer survivors were 12% less likely to attain a university degree or higher � resulting in a 2.2% reduction in employment rates, 1.7% reduction in hours worked, and 5.9% reduction in earnings per hour worked. Overall earnings of childhood cancer survivors were 9.6% lower (see Appendix).
While for some people childhood cancer may have just delayed their education rather than permanently reduced it (which would be further alleviated by the current availability of facilities providing education while the child undertakes cancer treatment at hospital and while recovering at home), unfortunately for some cancers the impacts may be much longer term due to treatment type and length. For example, the impact of brain cancer (and its treatment by surgery, radiotherapy or chemotherapy) may affect both the child�s physical and intellectual development, particularly in the very young when the brain is growing quickly.
Langeveld (2003) reported that for young adults who had childhood brain cancer, 80% had a low level of education (did not complete high school or less) compared to 57.1% of the population (a 40.1% increase), while 20% had a high level of education (completed high school or did more) compared to 42.9% of the population (a 53.4% decrease). Langeveld (2003) also found a positive relationship between cranial irradiation as part of the cancer treatment for leukaemia and non-Hodgkin�s disease and lower education in later years.
As seven years (or more) after diagnosis/treatment is a significant lapse in time and the impact appear to be ongoing and increasing (rather than decreasing), this study will assume that, on average, the impact of childhood cancer on educational

Cost of Cancer in NSW
78
attainment opportunities permanently reduces lifetime earnings by 9.6% (based on the ALSWH analysis).
5.2.5 PREMATURE DEATH
Premature death from cancer results in a long-term reduction in the productive capacity of the labour force. The value of each person�s remaining expected earnings is allocated to the year that they die.
People who prematurely died from cancer who were employed results in turnover costs to the employer. Turnover costs are estimated to be equal to 26 weeks salary of the incumbent worker (Access Economics 2004a). However this cost is merely �brought forward� a number of years because there would be some normal turnover of cancer patients � approximately 15% per annum (which implies that people change jobs, on average, approximately once every 6.7 years (Access Economics 2004b).
5.3 LOST UNPAID WORK
Outside of work individuals are also highly productive � taking care of children, housework, yardwork and volunteer work are all productive activities even if the individual isn�t paid for their efforts. The NHS estimated that 23.3% of males and 28.2% of females with cancer experienced days of reduced activity26 in the past two weeks.
TABLE 5-16 PROPORTION OF PEOPLE WHO EXPERIENCED A DAY OF REDUCED ACTIVITY
Cancer No Cancer Males 23.3% 8.7%Females 28.2% 12.3%Persons 25.8% 10.5%
Source: ABS 4364.0, Special Request.
In addition to a decreased ability to undertake unpaid activities while alive, premature mortality will also result in lost unpaid work.
While there is little information available on the amount of unpaid work lost due to cancer, the source studies from which the Value of a Statistical Life is drawn already implicitly include the individual�s net estimation of other personal costs � including the value of unpaid work to the individual. Thus the value of unpaid work is technically estimated in Section 8.
5.4 INFORMAL CARER PRODUCTIVITY LOSSES
Carers are people who provide informal care to others in need of assistance or support. For example, carers may take time off work to accompany people with cancer to medical appointments, stay with them in hospital, or care for them at home. Carers may also take time off work to undertake many of the unpaid work the person with cancer used to do � such as provide childcare, do the housework, yard work, shopping and so on.
26 Excluding days away from work or study on which a person had cut down on their usual activities for at least half the day, as a result of personal injury or illness.
Cost of Cancer in NSW
79
Informal care is distinguished from services provided by people employed in the health and community sectors (formal care) because the care is generally provided free of charge to the recipient and is not regulated by the government. Most informal carers are family or friends of the person receiving care.
While informal care is provided free of charge, it is not free in an economic sense, as time spent caring is time that cannot be directed to other activities such as paid work, unpaid work (such as housework or yard work) or leisure. As such, informal care is a use of economic resources.
There are three potential methodologies which can be used to place a dollar value on the level of informal care:
!!!! the opportunity cost method � measures the formal sector productivity losses associated with caring, as time devoted to caring responsibilities is time which cannot be spent in the paid workforce;
!!!! the self-valuation method � measures that carers themselves feel they should be paid; and
!!!! the replacement cost method � measures the cost of �buying� an equivalent amount of care from the formal sector, if the informal care were not supplied.
The self-valuation method is not commonly used, and there are no reliable Australian studies of the amount Australian carers feel they should be compensated. Interestingly, a 2000 Irish study of dementia carers provided a very low figure, of between £2 and £4 per hour (O�Shea, 2000).
Estimates of the value of informal care are very sensitive to the estimation methodology used. In this study, the opportunity cost method is used as data about the age and sex of the carers are available from SDAC and the aim of this report is to estimate the current impacts on people with cancer and their families, rather than a �what if� scenario if this care were instead provided by formal care providers.
Note that some people with cancer and their carers may actually increase their productivity (at the expense of their leisure time) in order to pay for their increased cancer-related expenses or as a distraction from the illness. However, due to a lack of data, this effect has not been able to be estimated in this analysis.
5.4.1 ADULTS
The Survey of Disability, Ageing and Carers (SDAC) provides the most recent and comprehensive profile of Australians with cancer and the people who provide them with assistance and support.
SDAC reported that in 2003 in Australia there were 18,800 carers of people whose main condition was cancer, of which 4,300 were primary carers. Thus, on average, there were 17 carers per 100 people with active cancer27 (after indexing to population growth) � implying in 2005 in NSW there were 6,700 carers of people with cancer, of which 69% were of working age.
27 Not a one-to-one relationship mainly due to the high presence of other conditions also causing disability in people with cancer.

Cost of Cancer in NSW
80
TABLE 5-17 CARERS OF PEOPLE WITH CANCER, AUSTRALIA, 2005
Carers Carers Per Person with Active Cancer
Primary Non-Primary
Total Primary Non-Primary
Total
Males 0-64 1,400 5,300 6,700 0.01 0.04 0.0565+ 900 2,800 3,700 0.01 0.02 0.03Total 2,300 8,100 10,400 0.02 0.07 0.08
Females 0-64 1,400 5,200 6,600 0.01 0.04 0.0565+ 600 1,700 2,300 0.00 0.01 0.02Total 2,000 6,900 8,900 0.02 0.06 0.07
Persons 0-64 2,900 10,500 13,400 0.02 0.08 0.1165+ 1,500 4,500 6,000 0.01 0.04 0.05Total 4,300 15,000 19,300 0.03 0.12 0.16
May not add due to rounding. Source: ABS 4430.0
TABLE 5-18 CARERS OF PEOPLE WITH CANCER, NSW , 2005
Primary Non-Primary Total Males 0-64 500 1,800 2,30065+ 300 1,000 1,300Total 800 2,800 3,600
Females 0-64 500 1,800 2,30065+ 200 600 800Total 700 2,400 3,100
Persons 0-64 1,000 3,600 4,60065+ 500 1,600 2,100Total 1,500 5,200 6,700
May not add due to rounding.
As SDAC reports hours of informal care provided per week for primary carers only, it is necessary to impute the average number of hours of care given per week by primary and non-primary carers. Overall in 2005, around 1.3 million hours of informal care were provided to people with cancer in NSW, equivalent to 32 hours per person with active cancer per year.

Cost of Cancer in NSW
81
TABLE 5-19 AVERAGE HOURS OF INFORMAL CARE PROVIDED TO PEOPLE WITH CANCER
<20 Hours per Week
20-39 Hours per Week
40+ Hours per Week
Average Hours per Week
Primary Carers 0-64 14% 18% 71% 4265+ 14% 0% 86% 44Total 14% 12% 74% 42
Non-Primary Carers
0-64 565+ 5Total 5
10 hours, 29.5, and 50 hours per week was imputed in the <20 hours, 20-39 hours, and 40+ hours per week groups, respectively. 5 hours per week was imputed for the non-primary carers. Based on Access Economics (August 2005). Source: ABS 4430.0.
The opportunity cost method is calculated by multiplying the total number of informal hours of care by the average employment rate and AWE and then dividing by the average hours worked (adjusted for the demographic profile of carers).
TABLE 5-20 HOURS AND COST OF INFORMAL CARE OF PEOPLE WITH CANCER, NSW, 2005
Total Hours of Care Provided
(m)
Employment Rate (%)
AWE ($) Opportunity Cost ($m)
Males 0-64 1.6 63% 681 $17.065+ 1.0 8% 578 $1.1Total 2.5 $18.1
Females 0-64 0.6 52% 468 $5.065+ 0.2 3% 389 $0.1Total 0.6 $5.1
Persons 0-64 0.9 $22.065+ 0.4 $1.2Total 1.3 $23.2
In 2005 males worked on average 39.3 per week, and females worked 28.9 hours per week. May not add due to rounding. Sources: ABS 6105.0, ABS 6310.0 (Indexed to $2005).
Overall in 2005, informal care provided to people with cancer in NSW cost $23.2 million, or $545 per person with active cancer per year.
5.4.2 CHILDREN
Evidence suggests that there may be a greater impact on carers of children with cancer (namely their parents) compared to carers of adults with cancer. Children often require someone to accompany them to medical appointments, whereas many adult patients are able to attend these appointments by themselves. Many children with cancer also have siblings that require care, resulting in the shifting of parenting responsibilities or �tag-team parenting� (Cohn et al 2003, 855).
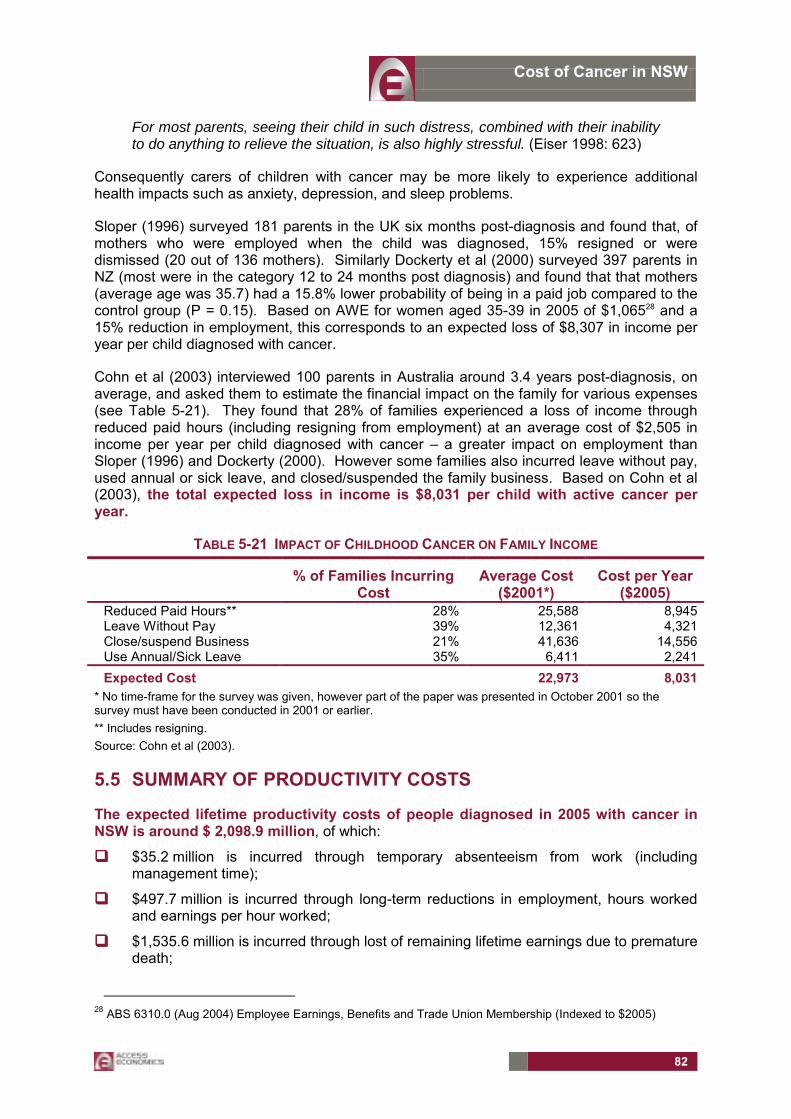
Cost of Cancer in NSW
82
For most parents, seeing their child in such distress, combined with their inability to do anything to relieve the situation, is also highly stressful. (Eiser 1998: 623)
Consequently carers of children with cancer may be more likely to experience additional health impacts such as anxiety, depression, and sleep problems.
Sloper (1996) surveyed 181 parents in the UK six months post-diagnosis and found that, of mothers who were employed when the child was diagnosed, 15% resigned or were dismissed (20 out of 136 mothers). Similarly Dockerty et al (2000) surveyed 397 parents in NZ (most were in the category 12 to 24 months post diagnosis) and found that that mothers (average age was 35.7) had a 15.8% lower probability of being in a paid job compared to the control group (P = 0.15). Based on AWE for women aged 35-39 in 2005 of $1,06528 and a 15% reduction in employment, this corresponds to an expected loss of $8,307 in income per year per child diagnosed with cancer.
Cohn et al (2003) interviewed 100 parents in Australia around 3.4 years post-diagnosis, on average, and asked them to estimate the financial impact on the family for various expenses (see Table 5-21). They found that 28% of families experienced a loss of income through reduced paid hours (including resigning from employment) at an average cost of $2,505 in income per year per child diagnosed with cancer � a greater impact on employment than Sloper (1996) and Dockerty (2000). However some families also incurred leave without pay, used annual or sick leave, and closed/suspended the family business. Based on Cohn et al (2003), the total expected loss in income is $8,031 per child with active cancer per year.
TABLE 5-21 IMPACT OF CHILDHOOD CANCER ON FAMILY INCOME
% of Families Incurring Cost
Average Cost ($2001*)
Cost per Year ($2005)
Reduced Paid Hours** 28% 25,588 8,945Leave Without Pay 39% 12,361 4,321Close/suspend Business 21% 41,636 14,556Use Annual/Sick Leave 35% 6,411 2,241Expected Cost 22,973 8,031
* No time-frame for the survey was given, however part of the paper was presented in October 2001 so the survey must have been conducted in 2001 or earlier. ** Includes resigning. Source: Cohn et al (2003).
5.5 SUMMARY OF PRODUCTIVITY COSTS
The expected lifetime productivity costs of people diagnosed in 2005 with cancer in NSW is around $ 2,098.9 million, of which:
!!!! $35.2 million is incurred through temporary absenteeism from work (including management time);
!!!! $497.7 million is incurred through long-term reductions in employment, hours worked and earnings per hour worked;
!!!! $1,535.6 million is incurred through lost of remaining lifetime earnings due to premature death;
28 ABS 6310.0 (Aug 2004) Employee Earnings, Benefits and Trade Union Membership (Indexed to $2005)
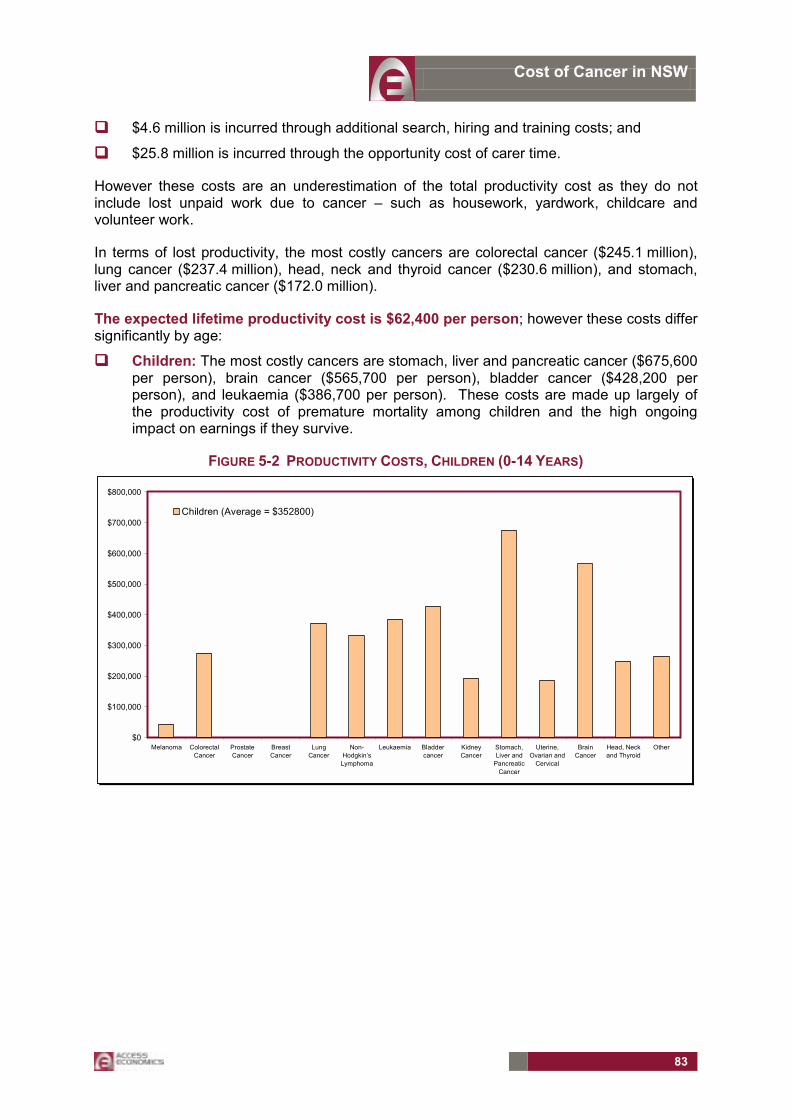
Cost of Cancer in NSW
83
!!!! $4.6 million is incurred through additional search, hiring and training costs; and
!!!! $25.8 million is incurred through the opportunity cost of carer time.
However these costs are an underestimation of the total productivity cost as they do not include lost unpaid work due to cancer � such as housework, yardwork, childcare and volunteer work.
In terms of lost productivity, the most costly cancers are colorectal cancer ($245.1 million), lung cancer ($237.4 million), head, neck and thyroid cancer ($230.6 million), and stomach, liver and pancreatic cancer ($172.0 million).
The expected lifetime productivity cost is $62,400 per person; however these costs differ significantly by age:
!!!! Children: The most costly cancers are stomach, liver and pancreatic cancer ($675,600 per person), brain cancer ($565,700 per person), bladder cancer ($428,200 per person), and leukaemia ($386,700 per person). These costs are made up largely of the productivity cost of premature mortality among children and the high ongoing impact on earnings if they survive.
FIGURE 5-2 PRODUCTIVITY COSTS, CHILDREN (0-14 YEARS)
$0
$100,000
$200,000
$300,000
$400,000
$500,000
$600,000
$700,000
$800,000
Melanoma ColorectalCancer
ProstateCancer
BreastCancer
LungCancer
Non-Hodgkin�sLymphoma
Leukaemia Bladdercancer
KidneyCancer
Stomach,Liver and
PancreaticCancer
Uterine,Ovarian and
Cervical
BrainCancer
Head, Neckand Thyroid
Other
Children (Average = $352800)

Cost of Cancer in NSW
84
!!!! Working Age Population: The most costly cancers are brain ($351,700 per person), leukaemia ($315,100 per person), and stomach, liver and pancreatic cancer ($304,700 per person). These costs are made up largely of the productivity cost of premature mortality.
FIGURE 5-3 PRODUCTIVITY COSTS, WORKING AGE POPULATION (15-64 YEARS)
$0
$50,000
$100,000
$150,000
$200,000
$250,000
$300,000
$350,000
$400,000
Melanoma ColorectalCancer
ProstateCancer
BreastCancer
LungCancer
Non-Hodgkin�sLymphoma
Leukaemia Bladdercancer
KidneyCancer
Stomach,Liver and
PancreaticCancer
Uterine,Ovarian
andCervical
BrainCancer
Head, Neckand Thyroid
Other
Working Age Population (Average = $139000)
!!!! Older Population: The most costly cancers are brain ($8,600 per person), lung
($8,200), and head, neck and thyroid ($7,800). These costs are made up largely of the productivity cost of premature mortality.
FIGURE 5-4 PRODUCTIVITY COSTS, OLDER POPULATION (65+ YEARS)
$0
$1,000
$2,000
$3,000
$4,000
$5,000
$6,000
$7,000
$8,000
$9,000
$10,000
Melanoma ColorectalCancer
ProstateCancer
BreastCancer
LungCancer
Non-Hodgkin�sLymphoma
Leukaemia Bladdercancer
KidneyCancer
Stomach,Liver and
PancreaticCancer
Uterine,Ovarian and
Cervical
BrainCancer
Head, Neckand Thyroid
Other
Older Population (Average = $5000)
Productivity costs are shared between the worker, the employer, governments (through tax losses) and the family (through the opportunity cost of carers). Post-tax:

Cost of Cancer in NSW
85
!!!! Workers: The expected lifetime cost for all cancers borne by workers is $1,290.1 million, or $38,300 per person � largely consisting of lost remaining lifetime earnings due to premature mortality and reduced lifetime earnings of survivors.
!!!! Employers: The expected lifetime cost for all cancers borne by employers is $22.0 million, or $700 per person � largely consisting of overtime and management costs of temporary absenteeism, and search, hiring and retraining costs of workers that leave paid employment.
!!!! Governments: The expected lifetime cost for all cancers borne by the government is $770.5 million, or $22,900 per person � entirely consisting of lost taxation revenue.
!!!! Carers: The expected lifetime opportunity cost of carer�s time for all cancers borne by carers (post-tax) is $16.3 million, or $500 per person. However, the expected lifetime opportunity cost of carer�s time for childhood cancer is around $7,600, compared to $400 for adults. This difference is largely driven by parents of working age being the prime carers of children with cancer; whereas for adults with cancer, around 31% of carers are aged over 65 years, and many patients are more independent in seeking help and may already be receiving formal care (such as in a nursing home).
FIGURE 5-5 DISTRIBUTION OF PRODUCTIVITY COSTS, NSW, 2005
Employee61.5%
Employer1.0%
Government36.7%
Carers0.8%

Cost of Cancer in NSW
86
6. OTHER FINANCIAL COSTS
6.1 NATIONAL RESPITE FOR CARERS PROGRAM
The National Respite for Carers Program (NRCP) provides services for at-home carers of people who are unable to look after themselves due to frailty, disability, or chronic illness. These services are provided through three distinct programs (ANAO, 04-05)29:
!!!! Commonwealth Carer Resource Centres (9 Centres); !!!! Provide information and advice to carers;
!!!! Commonwealth Carer Respite Centres (89 Centres and outlets); !!!! Arrange short-term or emergency respite for carers through existing services; !!!! Purchase or subsidise (broker) flexible respite care;
!!!! Respite Services (432 providers); !!!! Deliver respite and other support appropriate to the individual needs of carers
and their dependents.
FIGURE 6-1 NATIONAL RESPITE FOR CARERS PROGRAM
Source: ANAO (2004�05).
29 Respite programs for carers of cancer patients also exist that do not fall under NRCP. For example, respite is one service among many offered under the Home and Community Care Program (HACC). However this program targets the aged and the disabled and not those with an illness.

Cost of Cancer in NSW
87
Funding for NRCP was $99.73 million in 2003-04, in $99.20 million in 2004-0530, and will be $134.8 million in 2005-06 with the allocation of funds between the three program parts as presented in Table 6-1.
TABLE 6-1 NRCP FUNDING
Funding 2005-06
Estimated Funding
($m)
Carers Assisted
Cost per Carer ($)
Program $m % 2003-04 2003-04 2003-04 2005 Commonwealth Carer Resource Centres 4.7 3% 3.5 42,627 82 96 Commonwealth Carer Respite Centres 46.2 34% 34.2 47,800 715 839 Respite Services 59.5 44% 44.0 28,000 1572 1844 Other* 24.4 18% 18.1 Total 134.8 100% 99.73
*A number of other small programs also come under NRCP. A further funding breakdown is not available. In addition to Federal government funding through NRCP, Commonwealth Carer Resource Centres receive funding from the National Palliative Care Program (NPCP) ($3 million per year to assist carers of people with life limiting illness), the Department of Family and Community Services (FaCS) ($5 million each year, to assist carers of young people with severe and profound disabilities) and some State and Territory governments also contribute funding. Source: ANAO (2004�05).
The groups targeted by the NRCP and the proportion of services provided to each group is presented in Table 6-2.
TABLE 6-2 CARERS TARGETED UNDER NRCP FUNDING
% TargetedCarers of people with dementia 28.1% Carers of frail aged people (65 years or over, or 50 and over if Indigenous) 21.9% Carers of people with dementia and challenging behaviours 21.6% Carers of young people (under 65 or under 50 if Indigenous) with moderate, severe or profound disabilities 21.2% Carers of people with a terminal illness in need of palliative care; who are living at home 5.5% Unspecified* 1.7%
However it is possible that actual provision across target groups differs to funding objectives stated above. Source: ANAO (2004�05).
Total expenditure in 2005 on respite for carers of cancer patients was $5.8 million, or $169 per death31 � assuming that services were provided in line with funding objectives (i.e. 5.5% of expenditure was on services for carers of people receiving palliative care) and 89.8% of patients in community based palliative care programs have cancer as a principle diagnosis (Palliative Care Australia, 1998, p.23 and see, in the next section, Table 6-3).
For people diagnosed with cancer in 2005, the expected lifetime cost of respite for carers of cancer patients was $2.3 million32.
30 Productivity Commission (2006) Table 12A.49; Table 12A.46 31 Approximately 35,500 in Australia in 2005 (see Footnote 12). 32 This is lower than the total expenditure on respite in 2005 because the cost of respite of people diagnosed in 2005 that are expected to die is discounted over the following five years
Cost of Cancer in NSW
88
6.2 PALLIATIVE CARE
Palliative care is the specialised care provided for people who are dying from active, progressive and far-advanced diseases, with little or no prospect of cure. The aim of palliative care is to achieve the best possible quality of life, both for the person who is dying and for their family33.
Services are provided by both government and non-government organisations, delivered by family and friends, general practitioners, and palliative care specialists, and provided in:
!!!! inpatient units, hospices, residential and aged care facilities; and
!!!! in the homes of patients (supported by community-based programs and consultancy services).
State and Territory governments have the primary responsibility for management of palliative care services in Australia, while the Federal government has an oversight role (responsible for planning and strategy).
For the 1998 census conducted by Palliative Care Australia, palliative care programs were broken down into five classifications (community, inpatient, consultative (hospital), outpatient clinic, day centre). On November 18 1998 (Census day) it was estimated that 11,902 patients were registered in palliative care programs34, of which around 10,680 had cancer as a principle diagnosis.
TABLE 6-3 PALLIATIVE CARE SERVICES PROVIDERS, 1998
Proportion of Service Providers providing
Program
Proportion of Patients Registered in Palliative Care
Programs
Proportion of Patients Diagnosed with
Cancer
Inpatient 49%Outpatient 19% 89.6%Day 10%
12%*
Community 78% 78% 89.8%Consultative 45% Unknown 10%
* Inpatients of hospices and hospital consultancy programs Source: Palliative Care Australia (November 1998) p7, Table 2.1, and p22-23.
Palliative care in Australia is funded from a range of sources, including the Federal government, State and Territory governments, health funds, private donations and fundraising. According to the National Palliative Care Plan Initiative, Final Report of 2003, palliative care service providers received their funding (primary source) from35: government sources (91.82%), private sources (eg health funds) (5.45%) and donations and in-kind support (2.73%).
33 AIHW (July 2003) and DoHA (October 2000: 4) 34 The total palliative care population at a single point in time is expected to be lower than this as it was possible for individuals to be simultaneously registered for more than one program. 35 Data from respondents to a survey of all service providers listed in the Palliative Care Australia national directory.
Cost of Cancer in NSW
89
Federal government funding for palliative care comes under the National Palliative Care Program, and is guided by the National Palliative Care Strategy. The total Federal government funding for the National Palliative Care Program in 2005 was approximately $60 million, of which $53.6 million was for the palliative care of cancer patients or $1,570 per death �assuming that the cost of palliative care is equally distributed across patients, regardless of disease diagnosis.
TABLE 6-4 FEDERAL GOVERNMENT FUNDING FOR PALLIATIVE CARE
Total Funding Funding in 2005 (Approx.)
Australian Health Care Agreements (AHCA) $201.2 million over five years (2003-2008) 40.2
Palliative Care in the Community $55 million over four years (2002-2006) 13.8
Local Palliative Care grants program $23.1 million over four years (2005-2009) 5.8
Total Funding 59.8Source: DoHA (December 2005)
This estimate would underestimate the total funding for palliative care, as it does not include contributions from State and Territory governments and private sources.
The AIHW estimates of health costs in Section 4 already include the costs of palliative care done by hospitals and hospices, but not community palliative care services. Consequently to avoid double counting, only 78% of these costs are attributed to community based services (assuming the cost of care is the same across services).
In addition to funding, approximately 78% of services reported the use of volunteer services, with each service receiving approximately 35.7 hours per week of volunteer time36. Thus for the 254 services registered on the Register of Palliative Care Services held by Palliative Care Australia, around 367,790 hours of volunteer service was provided, or 10.7 hours per annum per death37. Thus in 2005 around 366,900 volunteer hours were provided to palliative care services, worth $9.2 million (valued at a replacement cost of $25.0138) of which $8.2 million was provided to people with cancer, or $268 per death.
Consequently the total value of community based palliative care services is $1,494 per death, which equates to an expected lifetime cost of $19.9 million for people diagnosed with cancer in 2005.
6.3 SPECIAL EDUCATION
As previously discussed, people with childhood cancer experience lower educational attainment through reduced cognitive functioning and memory as a result of treatment, and frequent and sometimes extended non-attendance at school will lead to longer-term impacts on future productivity (Stam 2005: 228 and Eiser 1998: 625).
36 Palliative Care Australia (November 1998: 34-35). 37 There were 34,270 deaths from cancer in 1998 (AIHW, October 2001) 38 Access Economics (August 2005: 15)

Cost of Cancer in NSW
90
In particular, educational attainment and cognitive functioning is most often reported for children with acute lymphoblastic leukaemia and central nervous system (CNS) tumours, and those who received intrathecal methotrexate or cranial radiation (Mitby et al 2003).
To counteract the impact of cancer on education, many children utilise special education services. In government schools in NSW, students with disabilities may be enrolled in regular classes with additional support, in a support class in a regular school or in a special school. Support may be provided through (NSW Department of Education and Training, 2005b):
!!!! development of individualised learning programs;
!!!! adjustment of teaching strategies;
!!!! use of peer tutoring and individualised teaching;
!!!! use of additional staff such as an itinerant teachers and teachers� aides (special);
!!!! modification and adaptation of class programs, equipment, resources and technology;
!!!! adaptation of classroom organisation including seating arrangements; and
!!!! assistance to parents to support learning in the home.
Mitby et al (2003) surveyed 14,054 childhood cancer survivors and 3,528 siblings in the US and found that survivors of leukaemia, brain cancer, non-Hodgkin�s lymphoma and kidney cancer were significantly more likely to receive special education services (see Table 6-5). On average these survivors received special education for 5.7 years; however, children who were diagnosed at younger ages were more likely to receive special education and remain in the service for a longer period of time.
TABLE 6-5 PROPORTION OF CHILDREN WHO RECEIVED SPECIAL EDUCATION, BY AGE OF DIAGNOSIS
0-5 years 6-10 years 11-15 years 16-20 YearsLeukaemia 53.9% 26.2% 13.3% -Brain 70.3% 55.8% 32.3% 23.9%Non-Hodgkins Lymphoma 26.3% 21.8% 14.3% -
Kidney 18.6% - - -Siblings 9.2% 9.2% 9.2% 9.2%
Rates are reported only if significant at the 95% level. Source: Mitby et al (2003)
The reasons identified for receiving special education services were missing school, low test scores, learning or concentrating issues, and emotional or behavioural issues. Missing school and low test scores were consistently associated with receiving special education across almost all of the cancers and age groups. However, learning or concentrating issues were only significant for children who were diagnosed with brain cancer.
In 2004 in NSW, 2.2% of students are currently in support classes or attend special education schools (NSW Department of Education 2005a). By applying the ratio of the proportion of siblings receiving special education compared to their counterparts with cancer, the additional probability of a child with cancer requiring special education in NSW can be estimated.

Cost of Cancer in NSW
91
TABLE 6-6 ADDITIONAL PROBABILITY OF RECEIVING SPECIAL EDUCATION, NSW, BY AGE OF DIAGNOSIS
0-5 years 6-10 years 11-15 years 16-20 YearsLeukaemia 12.9% 6.3% 3.2% -Brain 16.9% 13.4% 7.7% 5.7%Non-Hodgkin�s Lymphoma 6.3% 5.2% 3.4% -Kidney 4.5% - - -
The cost of special education in NSW is not easily available; however a rough estimate can be based on the additional teaching staff required for a child in special education. Across Queensland, Western Australia, South Australia and the Australian Capital Territory the average student to teacher ratio for primary, secondary and combined schools was 13.5, and for special schools was 4.439. Applying the ratio of teachers required for non-special education to special education, the additional employee costs of special education in 2004 of $11,358 for primary school, and $15,334 for secondary school (see Table 6-7), or $11,984 for primary school and $16,190 for secondary school special education in 2005 (indexed to growth in AWE).
This report will assume that each student attends special education for 5.7 years after diagnosis.
TABLE 6-7 COSTS OF SPECIAL EDUCATION, NSW, 2004
Primary Secondary Employee Related Expenditure ($m) 2,473 2,314Staff 33,474 30,516Expenditure per Staff Member ($) 73,871 75,826Students 440,309 305,199Students per Staff Member Non-Special 13.2 10.0Special 4.4 3.3
Employee Expenditure per Student ($) Non-Special 5,616 7,582Special 16,974 22,915
Additional Cost of Special Education 11,358 15,334
The NSW Government also provides educational services to inpatients in larger hospitals in order to ensure there is as little disruption as possible to the child�s education and to provide an emotionally supportive environment. However as most children with cancer would be very sick when receiving treatment in hospital, the use of these schools would be minimal by children with cancer and thus an estimate of these costs has not been attempted in this report.
Overall the expected lifetime cost of additional special education is $1.0 million for children diagnosed with cancer in 2005.
6.4 INTERPRETER SERVICES
All cancer patients would need to seek some medical advice at some stage. Assuming that the proportion who do not speak English, or do not speak it well (ABS 2001.0), is 2.3% �
39 Productivity Commission (2006) Tables 3A.104, 3A.105, 3A.107, 3A.108, 3A.111, 3A.112, 3A.119 and 3A.120

Cost of Cancer in NSW
92
774 people will require interpreter services each year. The telephone and face to face interpreter charge rates from the Translating and Interpreting Service are $112.80 and $93.50 per hour, respectively (averaging the business hours and after hours charge out rates as at 5 February 200440). Unfortunately the number of interpreter hours required for people with cancer is unknown, and so an estimate of these costs has not been attempted in this report.
6.5 OUT-OF-POCKET EXPENSES
Patient treatment and care is slowly moving away from hospital-based treatment towards day treatment combined with home-based care. While this can be less stressful for the patient, it means that patients and their families incur many more out-of-pocket expenses that would be otherwise be provided by the government or private health insurance (for example, some aids and equipment costs).
The centralisation of specialist cancer services in major cities also means that many rural and remote patients are often required to relocate, or at least travel substantial distances, to receive treatment. Thus out-of-pocket expenses such as travel costs, accommodation, and communication costs can be particularly burdensome for people living in regional areas. In addition to out-of-pocket expenses, the time and effort involved also increases psychological distress, physical distress (for example increased tiredness or pain from the treatment), and may (although not conclusive) influence initiation, continuation and compliance with treatment (Payne 2000). In addition to the patient travelling for treatment, carers may also need to travel with the patient for support (especially the parents of sick children).
Due to the effects of cancer and the side-effects of treatment, the ability for people to undertake everyday activities, such as childcare, housework, yardwork and shopping may be impaired. For some people these activities may be undertaken by family or friends, however in other cases formal paid care may be required.
6.5.1 ADULT CANCER
A broad range of additional out-of-pocket expenses are incurred by adults with cancer and their families. For modelling purposes it is assumed that these costs are incurred by the individual, however by-and-large these costs are often borne by the entire family.
Aids, Equipment and Modifications
Most aids and equipment are provided by hospitals, although there are considerable out-of-pocket expenses if the patient is receiving home-based care, and for specific cancers. For example:
!!!! communication devices, especially for people with head and neck cancers, and for those who have experienced hearing loss as a side-effect from treatment;
!!!! mobility devices, both temporary and permanent (especially for people who have lost a limb);
!!!! wigs for people who have experienced hair loss during chemotherapy;
!!!! specialist clothing, such as bras and swimsuits for women who have had severe breast surgery;
40 Access Economics (2004: Part II, 60)

Cost of Cancer in NSW
93
!!!! over-the-counter medicines and nutritional supplements;
!!!! incontinence pads;
!!!! heaters, air conditioners, blood glucose machines, nebulisers, oxygen concentrator, lifters; and
!!!! home modifications such as shower chairs, raised toilets, bathroom rails and ramps.
Assistance is available to cover some of the costs of these items. For example, some of the bigger-ticket items can be borrowed from a community organisation; the Program of Appliances for Disabled People (PADP) scheme can assist with access to aids and equipment, and the Community Options Program (COP) can assist with the cost of home modifications.
Formal Care
Some people with limited access to extended family and friends may incur additional formal care costs, such as:
!!!! childcare;
!!!! housekeeper;
!!!! gardener;
!!!! shopping (delivery etc); and
!!!! private nursing not covered by private health insurance or the government.
Emanuel (1999) found that women with a terminal illness were more likely to pay for formal care (odds ratio of 2.05).
Travel and Accommodation Costs
Travel and accommodation costs are particularly burdensome for regional and remote patients travelling to metropolitan areas for treatment. Sometimes the patient may choose to commute on a daily basis, while other times the patient may choose to stay for part or all of their duration of the treatment (perhaps travelling home on weekends or more irregularly). However, even if the medical treatment is available locally, travel costs can still be substantial in terms of both distance and time.
Out-of-pocket expenses for travel costs include:
!!!! petrol, road tolls, additional car maintenance, taxi, train, bus and air fares;
!!!! accommodation costs for both the patient and/or family at hotels/hostels near the treatment facility (although some out-of-town patients may be able to stay with friend/family);
!!!! additional meal costs; and
!!!! item duplication, luggage and clothing.
In NSW some of these travel and accommodation costs can be subsidised by the NSW Isolated Patients� Travel and Accommodation Assistance Scheme (IPTAAS) if the individual must travel more than 100km (one way) to obtain specialist medical treatment not available locally (see Section 7.1.2). The IPTAAS does not always cover travelling costs of carers/family members.

Cost of Cancer in NSW
94
Communication
Increased communication costs may be incurred by people with cancer, for example, to obtain information and support from medical specialists and support groups, or stay in touch with friends and family while away. Communication costs include:
!!!! mail;
!!!! mobile telephone, local telephone, and long-distance telephone;
!!!! fax; and
!!!! email/internet.
Summary of Out of Pocket Expenses
Other than a few articles focusing on palliative care costs, the literature review revealed very little research estimating the cost of out-of-pocket expenses for cancer patients in Australia. Currently the Centre for Health Research and Psycho-oncology (CHeRP) is undertaking research into this area. However, at the time of publication this survey was still underway and the findings not yet released.
Instead, estimates of out-of-pocket expenses were based on Arozullah et al (2004) who surveyed 156 women with breast cancer in the US between October 1999 and November 2002. These results were also used for males, although with childcare and housekeeping costs are multiplied by 51% and 53% respectively, based on Emanuel et al (1999).
Overall the additional financial costs for adult cancer are $2,648 and $2,120 per year per person diagnosed with cancer, for females and males respectively.
TABLE 6-8 OUT-OF-POCKET EXPENSES FOR PEOPLE WITH CANCER
Expense Proportion of Patients
Incurring Cost (%)
Mean Cost per Month per
Person with Cancer
($US 2001)
Mean Cost per Year per Person with Cancer ($AU 2005)*
Females Males Counselling/Support 8% 16 277 277Special equipment 6% 4 69 69Childcare 7% 39 675 341Transport 78% 33 571 571Housekeeping 16% 24 415 221Meals 51% 21 363 363Telephone 36% 11 190 190Accommodation 4% 5 87 87Total 153 2,648 2,120
*PPP (cost to buy the same basket of goods in Australia compared to the US) = 1.33 in June 2001 Source: OECD (2006)
Complementary or Alternative Therapies
Two Australian Studies, Miller et al (1998) and Yates et al (1993) found that between 40% and 52% of cancer patients, respectively, had used at least one complementary or alternative therapy since their diagnosis. Recently a study by the National Breast Cancer Centre found that 91% of women with breast cancer had used at least one complementary

Cost of Cancer in NSW
95
therapy41, with an average of 3.7 therapies per person. The most commonly practised therapies include meditation/relaxation, diet, multivitamins, herbal medicines and antioxidants. Often these therapies had produced psychological benefits (feeling calmer, having a sense of control over their illness or coping better with their illness) as well as physical benefits (reducing symptoms and side-effects of treatment), while some also believed that the therapy would cure or assist treatment.
Sometimes additional costs are incurred for these therapies � the expected cost of complementary or alternative therapies is $422 per patient for the entire course of the cancer (see Table 6-9). However this is a conservative estimate as it is based on patients currently receiving treatment. Many cancer patients are required to finance these treatments themselves as they are not usually accessible through traditional avenues for funding, although some funding is now available through private health insurance ancillary cover.
TABLE 6-9 USE AND COST OF COMPLEMENTARY AND ALTERNATIVE THERAPIES
Therapy Number of Patients Using
Therapy
Average Cost ($)
Chance of Using Therapy
(%)
Expected Cost ($)
Recommended or Supported by Doctors Antioxidants 8�9 448 5 23Change in diet 14�20 224 9 20Meditation/relaxation 30�36 244 19 47Hypnotherapy 4 74 3 2Exercise 3 1,024 2 20Acupuncture 1�3 215 1 1
Other Common Therapies Multivitamins 11�15 655 7 46Herbal medicine 9 1,454 6 84Mental imagery 3�4 168 2 3Naturopathy 2 450 1 6Aromatherapy 1 2,500 1 16Gerson therapy 1 800 1 5Homeopathy 1 360 1 2Iridology 1 200 1 1Psychotherapy 1 9,000 1 58
Radical Therapies Reiki 1 150 1 1Coffee enemas 1 120 1 1Faith healing 1 250 1 2Magnetotherapy 0 0 0 0Shark cartilage 6�7 1,113 4 43High-dose vitamin C 6 1,074 4 41Oxygen therapy 1 0 1 0
Total 156 52 422Source: Miller et al (1998)
6.5.2 CHILDHOOD CANCER
For some financial costs childhood cancer may be more burdensome than adult cancer � children often require someone to accompany them to medical appointments thus resulting in higher transport costs, whereas many adult patients are able to attend these appointments
41 Including attending support groups.

Cost of Cancer in NSW
96
by themselves. Many children with cancer also have siblings that require care, whereas many adults are much older when diagnosed with cancer and do not have dependent children. There is evidence that childcare and domestic help is often used by families with no extended family support (Cohn et al 2003: 862).
Based on Cohn et al (2003)42, the additional financial costs for childhood cancer are $1,318 per year per child diagnosed with cancer (see Table 6-10). It is assumed that these costs are incurred by the family of the child, rather than the individual.
However the following additional costs were reported to have been incurred but were not costed:
!!!! bus, train, roadway toll, car parking;
!!!! email/internet and fax;
!!!! respite, shopping and home modification; and
!!!! counselling costs;
Vehicle purchase, maintenance and registration were also reported, but some of these costs may have been incurred otherwise and thus have not been included in this analysis. Some parents also nominated other expenses such as toys for a hospital stay, �bribes� to take medicines, patient food cravings, and an answering machine.
42 Medical and productivity expenses were not included in this section as they are estimated in previous sections of this report.

Cost of Cancer in NSW
97
TABLE 6-10 OTHER FINANCIAL COSTS OF CHILDHOOD CANCER
Mean Cost % of Families Incurring Cost ($2001) Metro Regional Rural Overall*
Travel Airfare 2,941 6% 11% 59% 11%Petrol 1,313 73% 97% 84% 79%Taxi 164 24% 9% 9% 20%
Accommodation Meals 1,487 52% 60% 84% 56% Room/bed 85 6% 37% 81% 19%
Communication Mail 44 21% 23% 25% 22% Mobile Telephone 542 55% 63% 75% 58% Local Telephone 215 55% 66% 78% 59% Long-distance Telephone 431 48% 6% 91% 43%
Formal Care Babysitter/care centre 2,937 27% 17% 22% 25% Domestic Help 908 33% 11% 19% 27%
Personal Item duplication 153 30% 51% 72% 38% Additional luggage 61 15% 26% 47% 20% Clothing 313 33% 46% 53% 37%
Other Educational products 576 18% 17% 28% 19%
Total Cost ($2005) $4,273 $4,327 $6,977 $4,507 Average Time Since Diagnosis (Years) 3.1 4.3 2.8 3.4
Cost per Year ($2005) $1,398 $1,007 $2,467 $1,318*Weighted average of Metropolitan, Regional and Rural families based on split for NSW: 71%, 21% and 8%, respectively. Source: Cohn et al (2003), ABS 2001.0
6.5.3 OUT-OF-POCKET EXPENSES SUMMARY
Overall, the expected lifetime cost of out-of-pocket expenses (such as aids, equipment and modifications, formal care, travel and accommodation, communication, and complementary or alternative therapies) is $118.3 million for people diagnosed in 2005.
6.6 COMMUNITY PROGRAMS
Many non-profit organisations also provide a wide range of programs for people with cancer paid for with funding from government grants and donations from the wider community.
6.6.1 COUNSELLING AND SUPPORT
Counselling and support programs provide emotional support for people with cancer and their families, as well as providing a break from their illness and the associated side-effects of the treatment. Often people are better able to cope with the uncertainties of a cancer diagnosis by meeting each other and talking about their experiences, problems and solutions. In 2005 at least $2.7 million was spent on these programs and 7,600 hours of volunteer time was provided � worth a further $73,000 (based on AWE, employment rates

Cost of Cancer in NSW
98
and hours worked for people aged 15-65). This equates to around $65 per person with active cancer.
The Cancer Council NSW
Is a non-profit organisation that aims to support people with cancer through providing information, support services (including accommodation and transport), funding for cancer support groups, and assisting research into the causes, prevention, diagnosis and treatment of cancer. Some services provided by the Cancer Council NSW are outlined below.
!!!! Cancer Council Helpline � Telephone information and support service, where specialist cancer nurses can answer questions relating to cancer, including prevention, diagnosis and treatment. The support service can also distribute educational materials, provide contacts for other support services, and offer emotional support for people with cancer and their families.
!!!! Cancer Council Connect � People with cancer receive one-to-one contact with specially trained volunteers who share their experience with cancer and can provide practical information and emotional support.
!!!! Telephone Support Groups � People with cancer who are unable to attend traditional support groups can attend telephone support groups.
!!!! "Take a Break" Holidays � Funding for holidays for people with cancer and their families.
!!!! Support groups for young women with breast cancer.
Look Good �Feel Better
Look Good...Feel Better provides services to women to help them manage the appearance related side-effects of chemotherapy and radiotherapy, thereby helping to restore their appearance and self image.
CanTeen
CanTeen�s mission is to support, develop and empower young people living with cancer. They provide a peer support network of young people living with cancer who share experiences, have fun, offer resources and promote understanding, well-being and leadership. Peer support programs (such as TeenLink), educational workshops and discussion groups, and overnight programs, such as:
!!!! camps,
!!!! patient, sibling and offspring weekends, and
!!!! Good Grief programs (specifically focussing on coping with grief)
Camp Quality
Camp Quality aims to bring hope and happiness to every child living with cancer and their families. Through the camps they provide quality recreational and educational programs.
Leukaemia Foundation
The Leukaemia Foundation funds research and provides support for people and families living with leukaemias, lymphomas, myeloma and related blood disorders.
Cost of Cancer in NSW
99
RedKite
RedKite aims to provide emotional and financial support to families facing childhood cancer. They provide social workers at oncology units, music therapy, and family support groups and family days.
Make-a-Wish Foundation
Make-a-Wish grants a wish to children and young people with a life threatening illness, and thus provides a temporary break. For example, a child might wish for a holiday, or a shopping trip, or to meet a celebrity.
Ronald McDonald House Charities
Ronald McDonald Family Rooms are located within the hospital to provide parents and families of children with a place to have a break, cook a meal, relax and unwind. Ronald McDonald Beach Houses provide free accommodation by the beach to allow children and their families have a break from their illness.
Starlight Children�s Foundation
The Starlight Children�s Foundation aims to provide positive distraction and entertainment for children with cancer through entertainment programs within and outside the hospital environment. Services include Starlight Express Rooms located in paediatric hospitals, mobile Starlight Fun Centres (entertainment units that can be wheeled right next to the bedside of a child), Captain Starlight, the Starlight Express Van, and Starlight Escapes that provide tickets to events, shows and activities to children and their families.
6.6.2 ACCOMMODATION
To assist rural and remote families stay together during treatment, many organisations also provide accommodation close to treatment facilities. For example, the Cancer Council NSW provides accommodation at: Alkira Lodge at the Illawarra Cancer Care Centre, Casuarina Lodge at Westmead Hospital, and Blue Gum Lodge at Greenwich Hospital for patients being treated at Royal North Shore Hospital. Can Assist has two facilities: Lilier Lodge (jointly owned with the Cancer Council NSW) and Ecclesbourne, Ronald McDonald House Charities has two facilities in Sydney, and others in Newcastle and Wagga Wagga, and the Leukaemia Foundation has two facilities in Sydney and another in Newcastle.
In 2005 at least $2.5 million was spent on providing accommodation to people with cancer by non-profit organisations, or $59 per person with active cancer.
6.6.3 EDUCATIONAL MATERIALS AND PROGRAMS
While the costs listed below are mainly educational programs and paper-based educational material, patients can also find a wealth of information about cancer on the internet.
The Cancer Council NSW provides educational materials such as the Support and Information Pack (general information about where to find practical and financial help and emotional support, as well as providing general information on treatment and care) and Understanding Cancer Booklets (series on booklets on specific cancers and general information about cancer, for example nutrition guides). The Cancer Council NSW also

Cost of Cancer in NSW
100
maintains a library of information on many cancer-related topics, and provides additional information to local libraries throughout NSW.
The Cancer Council NSW also runs educational programs such as the Living with Cancer Education Program and Cancer Awareness Workshops for Aboriginal and Torres Strait Islander Health Workers.
Specialist educational support services for children to help them catch up on their education that they have missed due to their illness are provided by RedKite and Ronald McDonald House Charities.
In 2005 at least $1.4 million was spent on providing educational material and programs to people with cancer by non-profit organisations and 700 hours of volunteer time was provided � worth a further $7,000 (based on AWE, employment rates and hours worked for people aged 15-65), or $34 per person with active cancer.
6.6.4 COMMUNITY PROGRAMS SUMMARY
Overall, the expected lifetime cost of community programs (such as counselling and support, accommodation and educational programs) is at least $6.8 million for people diagnosed in 2005.
6.7 FUNERAL EXPENSES
The �additional� cost of funerals borne by family and friends of cancer patients is based on the likelihood of death in the five years due to cancer. However, some patients (particularly older patients) would have died during this time anyway, and eventually everyone must die, and thus incur funeral expenses � so the true cost is the cost brought forward (adjusted for the likelihood of dying anyway). The BTRE (2000) calculated a weighted average cost of a funeral across all States and Territories, to estimate an Australian total average cost of $3,200 per person for 1996, or $3,949 per person in 2005.
Note that some families may receive financial assistance for funeral expenses through Centrelink�s Bereavement payment, the Commonwealth Department of Veterans' Affairs, some private health insurance funds, trade unions, pensioners' associations and various other clubs.
Individuals may also incur various costs for legal services, for example transfer of house deeds, will, living will and so on.
Overall, the expected lifetime cost of funeral expenses brought forward is at least $14.1 million for people diagnosed in 2005.
6.8 SUMMARY OF OTHER FINANCIAL COSTS
The expected lifetime cost of additional other financial costs associated with cancer for people diagnosed in 2005 with cancer in NSW is around $162.3 million, of which:
!!!! $2.3 million is government funding for respite;
!!!! $19.9 million is government funding and volunteer time for community-based palliative care;
!!!! $1.0 million is additional special education costs;
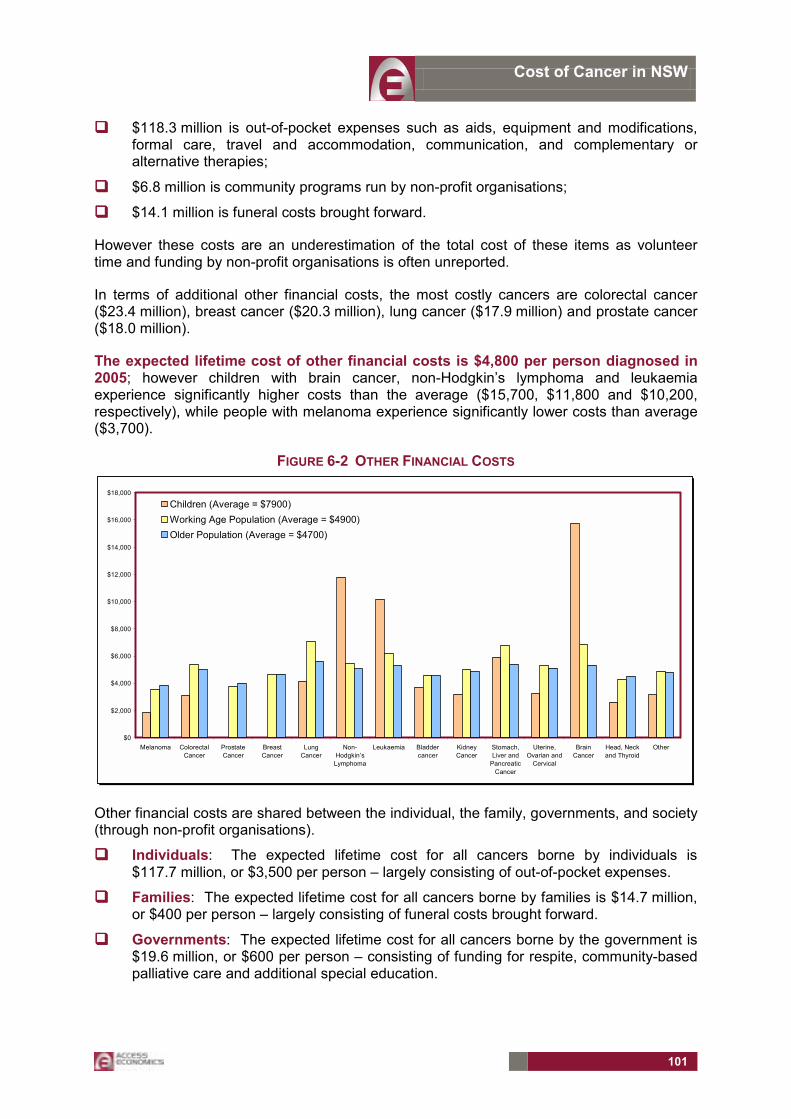
Cost of Cancer in NSW
101
!!!! $118.3 million is out-of-pocket expenses such as aids, equipment and modifications, formal care, travel and accommodation, communication, and complementary or alternative therapies;
!!!! $6.8 million is community programs run by non-profit organisations;
!!!! $14.1 million is funeral costs brought forward.
However these costs are an underestimation of the total cost of these items as volunteer time and funding by non-profit organisations is often unreported.
In terms of additional other financial costs, the most costly cancers are colorectal cancer ($23.4 million), breast cancer ($20.3 million), lung cancer ($17.9 million) and prostate cancer ($18.0 million).
The expected lifetime cost of other financial costs is $4,800 per person diagnosed in 2005; however children with brain cancer, non-Hodgkin�s lymphoma and leukaemia experience significantly higher costs than the average ($15,700, $11,800 and $10,200, respectively), while people with melanoma experience significantly lower costs than average ($3,700).
FIGURE 6-2 OTHER FINANCIAL COSTS
$0
$2,000
$4,000
$6,000
$8,000
$10,000
$12,000
$14,000
$16,000
$18,000
Melanoma ColorectalCancer
ProstateCancer
BreastCancer
LungCancer
Non-Hodgkin�sLymphoma
Leukaemia Bladdercancer
KidneyCancer
Stomach,Liver and
PancreaticCancer
Uterine,Ovarian and
Cervical
BrainCancer
Head, Neckand Thyroid
Other
Children (Average = $7900)Working Age Population (Average = $4900)Older Population (Average = $4700)
Other financial costs are shared between the individual, the family, governments, and society (through non-profit organisations).
!!!! Individuals: The expected lifetime cost for all cancers borne by individuals is $117.7 million, or $3,500 per person � largely consisting of out-of-pocket expenses.
!!!! Families: The expected lifetime cost for all cancers borne by families is $14.7 million, or $400 per person � largely consisting of funeral costs brought forward.
!!!! Governments: The expected lifetime cost for all cancers borne by the government is $19.6 million, or $600 per person � consisting of funding for respite, community-based palliative care and additional special education.

Cost of Cancer in NSW
102
!!!! Society: The expected lifetime opportunity cost for all cancers borne by society is $10.4 million, or $300 per person � consisting of funding for community programs by non-profit organisations.
FIGURE 6-3 DISTRIBUTION OF OTHER FINANCIAL COSTS, NSW, 2005
Individual72.5%
Family9.1%
Governments12.1%
Society6.4%

Cost of Cancer in NSW
103
7. TRANSFERS Transfer payments represent a shift of resources from one economic entity to another. The act of taxation and redistribution creates distortions and inefficiencies in the economy, so transfers also involve real net costs to the economy.
7.1 FINANCIAL SUPPORT
7.1.1 WELFARE PAYMENTS
A number of welfare payments are available to cancer patients and their carers, and can sometimes be back-dated to when costs began to be incurred (i.e. when the person stopped working). Table 7-3 describes a range of payments, and the amount received, available to cancer patients. However this table should be used as a guide only. Please contact the nearest Centrelink office to confirm eligibility and payment rates.
The cost of welfare payments in this section relate to those directly attributable to cancer. They do not include potential increases in welfare payments due to the long-term negative side-effects of cancer nor the reduction in welfare payments due to premature death.
Patients
In June 2005 there were 5,776 people in NSW who were listed to have received either the Disability Support Pension, Newstart, or Sickness Allowance due to cancer (see Table 7-1). However this estimate is an underestimation of the number of people who received welfare payments because:
!!!! people aged over 65 years would be eligible for the aged pension instead43;
!!!! it does not include people who did not indicate cancer as a reason for receiving the payment; and
!!!! some individuals after recovering from cancer may still experience prolonged absence from the labour force or premature retirement due to cancer, thus continuing to receive welfare payments such as Newstart.
Furthermore there is a range of additional payments available that have not been costed in this section.
Applying the proportion of recipients who received each of the payments due to cancer to the total annual payments in 2004, it is estimated that $20.1 million was paid to persons with cancer. If it is assumed that all of these people are aged between 15 and 65 (working age and not yet eligible for the aged pension) then 33% of all working aged people who had active cancer in 2005 received welfare payments.
43 Note some women aged between 55 and 65 are currently eligible for the age pension, but this is being slowly phased out.

Cost of Cancer in NSW
104
TABLE 7-1 WELFARE PAYMENTS, 2004-05
All People, Australia People with Cancer, NSW No.
Recipients (June 2005)
Payments ($m) (2004-05)
No. recipients
(June 2005)
Payments ($m) (2004-05)
Disability Support 706,782 2,505.2 4,562 16.2Newstart Allowance 453,614 1,474.6 1,026 3.3Sickness Allowance 8,367 27.5 188 0.6Total 1,168,763 4,007.3 5,776 20.1
Sources: Centrelink special request, FACS (2004-05)
However some of these people would have ordinarily received welfare payments which must be netted out to estimate the additional welfare payments due to cancer, using a Melbourne University study (Tseng and Wilkins 2002) about the �reliance� of the general population (aged 15-64 years) on income support.
TABLE 7-2 WELFARE PAYMENTS TO PEOPLE WITH CANCER DUE TO CANCER, 2004-05
Average Reliance (%) Additional Payments ($m) Males Females Persons* 2004-05
Disability Support 10.2 14.9 12.0 14.2NewStart Allowance 14.0 10.2 12.9 2.9Sickness Allowance 10.2 14.9 11.7 0.5Total 17.7
* Weighted average based on statistics of demographics of income support customers Sources: FACS (2006) and Tseng and Wilkins (2002)
Thus each working aged person with active cancer (17,600 people) receives $1,007 in additional welfare payments per annum, on average, resulting in $18.1 million in additional welfare payments to people with cancer over the lifetime of a person diagnosed with cancer in 2005.
Carers
There are two main income support measures available to carers: the Carer Payment and the Carer Allowance. A large number of primary carers may instead receive an age pension or disability support pension (DSP), which is paid at the same rate as the Carer Payment (Access Economics, August 2005). However, since in most cases age pensions and DSP are likely to be paid regardless of whether the person is caring, they are not included in the cost of welfare transfers for caring for people with cancer.
In 2005 around $2,012.7m was paid to carers in the form of the Carer Payment and Carer Allowance and 1.221 billion hours of care was provided (Access Economics, August 2005) � equivalent to $1.68 per hour.
Based on the total amount of hours of care provided and assuming that carers of cancer patients receive the Carer Payment or Allowance at the same rate as the general carer population for the period for which care is required (i.e. while the person has active cancer), then $2.4 million is provided to carers of people with cancer over the lifetime of a person diagnosed with cancer in 2005.
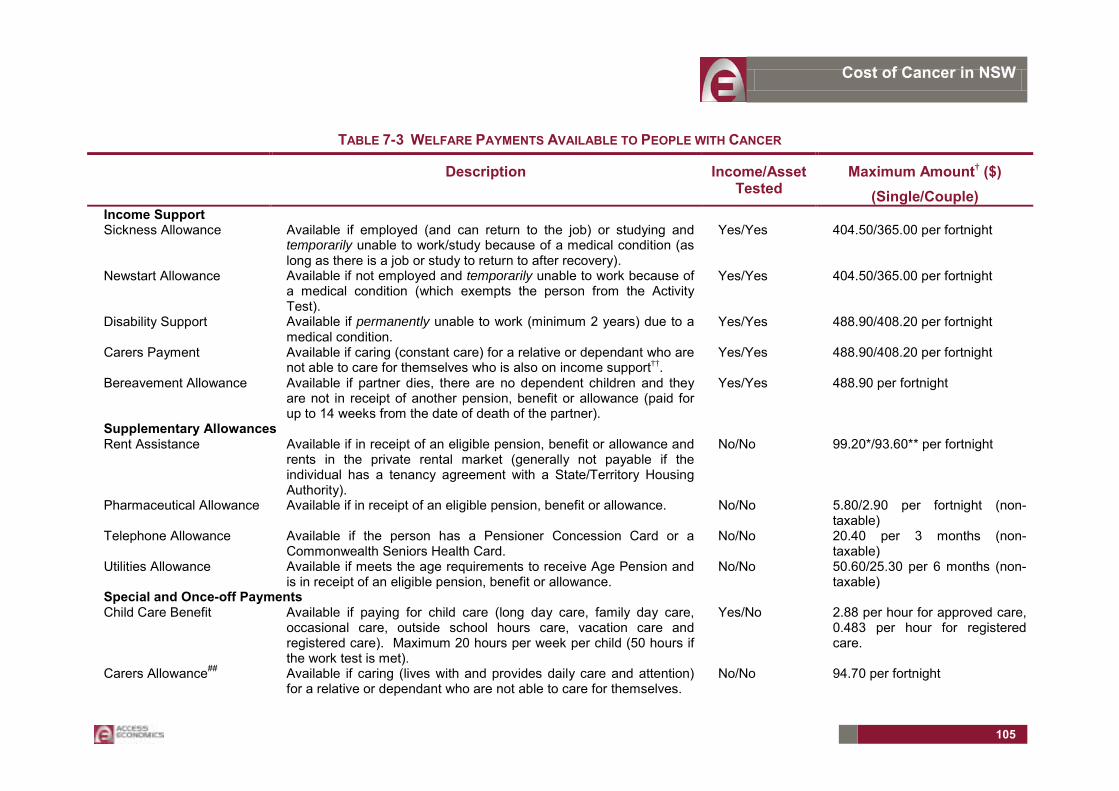
Cost of Cancer in NSW
105
TABLE 7-3 WELFARE PAYMENTS AVAILABLE TO PEOPLE WITH CANCER
Description Income/Asset Tested
Maximum Amount† ($) (Single/Couple)
Income Support Sickness Allowance Available if employed (and can return to the job) or studying and
temporarily unable to work/study because of a medical condition (as long as there is a job or study to return to after recovery).
Yes/Yes 404.50/365.00 per fortnight
Newstart Allowance Available if not employed and temporarily unable to work because of a medical condition (which exempts the person from the Activity Test).
Yes/Yes 404.50/365.00 per fortnight
Disability Support Available if permanently unable to work (minimum 2 years) due to a medical condition.
Yes/Yes 488.90/408.20 per fortnight
Carers Payment Available if caring (constant care) for a relative or dependant who are not able to care for themselves who is also on income support††.
Yes/Yes 488.90/408.20 per fortnight
Bereavement Allowance Available if partner dies, there are no dependent children and they are not in receipt of another pension, benefit or allowance (paid for up to 14 weeks from the date of death of the partner).
Yes/Yes 488.90 per fortnight
Supplementary Allowances Rent Assistance Available if in receipt of an eligible pension, benefit or allowance and
rents in the private rental market (generally not payable if the individual has a tenancy agreement with a State/Territory Housing Authority).
No/No 99.20*/93.60** per fortnight
Pharmaceutical Allowance Available if in receipt of an eligible pension, benefit or allowance. No/No 5.80/2.90 per fortnight (non-taxable)
Telephone Allowance Available if the person has a Pensioner Concession Card or a Commonwealth Seniors Health Card.
No/No 20.40 per 3 months (non-taxable)
Utilities Allowance Available if meets the age requirements to receive Age Pension and is in receipt of an eligible pension, benefit or allowance.
No/No 50.60/25.30 per 6 months (non-taxable)
Special and Once-off Payments Child Care Benefit Available if paying for child care (long day care, family day care,
occasional care, outside school hours care, vacation care and registered care). Maximum 20 hours per week per child (50 hours if the work test is met).
Yes/No 2.88 per hour for approved care, 0.483 per hour for registered care.
Carers Allowance## Available if caring (lives with and provides daily care and attention) for a relative or dependant who are not able to care for themselves.
No/No 94.70 per fortnight

Cost of Cancer in NSW
106
Description Income/Asset Tested
Maximum Amount† ($) (Single/Couple)
Special Benefit Available if in financial hardship and unable to earn a sufficient livelihood for themselves and dependants due to reasons beyond their control. They must not be able to get any other income support payment. Discretionary payment from FACS to affected individuals.
Yes/Yes Short-term: 404.50/365.00 per fortnight. Long-term: no more than 5,000.
Bereavement Payment Available after the death of a partner or person being cared for (adult or child) if the individual is in receipt of an eligible pension, benefit or allowance.
Yes/Yes Lump sum equivalent to 7 payments of the difference between the couple and single rate of the pension, benefit or allowance received; or Receive carers payment for a further 7 payments after the person cared for has died.
† Lower if earning income above a certain rate, possibly higher if person has dependent children. †† A health professional's report is needed to help establish eligibility. * Not sharing. ** If the couple is separated due to illness (including respite care) then they can receive a larger amount. # A lump sum advance equal to 6 months allowance may be paid once a year. ## A back payment of Carer Allowance of up to 26 weeks prior to the claim being lodged is possible; provided the care needed was caused by an acute event i.e. occurred unexpectedly. Source: www.centrelink.gov.au

Cost of Cancer in NSW
107
7.1.2 OTHER AVENUES OF FINANCIAL SUPPORT
There are various other avenues to receive financial support, which include:
!!!! Payments from the Department of Veterans Affairs � In addition to support from Centrelink, some people may be eligible to support payments and health services from the Department of Veterans Affairs.
!!!! Workers� compensation � All workers in NSW are covered by some form of Workers� compensation through their employer. If a cancer is a direct consequence from working conditions (for example, due to working with carcinogens or working in the sun without adequate protection), then the person may be eligible to claim workers� compensation to cover the cost of health services, funeral expenses, and loss of income due to cancer. Some cancers for which there is strong evidence of occupational causation and the associated exposure is listed in the table below:
TABLE 7-4 CANCERS FOR WHICH THERE IS STRONG EVIDENCE OF OCCUPATIONAL CAUSATION
Cancer Occupational Exposures Leukaemia ionising radiation, benzene and ethylene oxide Lung and bronchus asbestos, arsenic, beryllium, cadmium, chromium VI, diesel fumes,
nickel, radon, silica, soots, coke oven emissions, bis (chloro-methyl) ether, and environmental tobacco smoke
Hodgkin�s Lymphoma wood dust Non Hodgkin's Lymphoma phenoxy herbicides (dioxin), chlorophenols and halogenated
hydrocarbon solvents Sino nasal carcinoma wood dust, leather and work with welding, flame cutting and
soldering Naso pharyngeal carcinoma formaldehyde Larynx sulphuric acid mists, asbestos and organic solvents Skin (non melanoma) arsenic, polycyclic hydrocarbons (coal tar products) and sunlight Mesothelioma asbestos Bladder Cancer aromatic amines and poly-cyclic hydrocarbons (and there is good
evidence for paints, dyes, chlorinated hydrocarbons, and other solvents, metals and industrial oils/cutting fluids)
Soft tissue sarcoma dioxin Source: Driscoll (2004)
!!!! Early Access to Superannuation � In general, superannuation is �preserved� in a fund or retirement savings account (RSA) until the person retires from the workforce after age 55 years. However early release of preserved superannuation benefits is permitted in certain restricted circumstances44: !!!! Financial hardship (aged under 55 years and 39 weeks): in receipt of a
Commonwealth income support payment continuously for the last 26 weeks, and unable to meet reasonable and immediate family living expenses. The fund or RSA can release one lump sum payment more than $1,000 and less than $10,000 (or the balance of your benefit if it is less than $1,000).
!!!! Financial hardship (aged over 55 years and 39 weeks): in receipt of a Commonwealth income support payment for a cumulative period of 39 weeks after reaching age 55, and not gainfully employed on a full-time or part-time basis. The fund or RSA can release your entire benefit.
44 http://www.apra.gov.au/Superannuation/Early-Release-of-Superannuation-Benefits.cfm
Cost of Cancer in NSW
108
!!!! Specified grounds for release to cover expenses for45: - medical treatment for the member or their dependant where the treatment
is necessary to treat a life threatening illness or injury, or to alleviate acute/chronic pain or acute/chronic mental disturbance, and where such treatment is not readily available through the public health system;
- medical transport for the member or their dependant to access treatment necessary to treat a life threatening illness or injury, or to alleviate acute/chronic pain or acute/chronic mental disturbance;
- modifications to the family home and/or vehicle to meet the special needs of a disabled member or his/her disabled dependant; or
- palliative care or death, funeral, or burial expenses for a member or his/her dependant.
!!!! Release of benefits to members requires approval from APRA.
!!!! Private Health Insurance, Life Insurance and Income Protection Benefits � Through various insurance schemes, some people may be covered by insurance for the cost of health services, formal care, funeral expenses, and compensation for lost income due to cancer.
!!!! The NSW Isolated Patients� Travel and Accommodation Assistance Scheme (IPTAAS)46 � provides some financial assistance towards travel and accommodation costs for specialist medical not available locally if the patient needs to travel more than 100km (one way). Financially disadvantaged patients may also be eligible for assistance for shorter distances. Other living away from home expenses (e.g. meals) are not reimbursed. Assistance with escort costs is only available if it is medically necessary and is approved by a medical practitioner or treating specialist (however a patient under 17 years of age is automatically eligible to one adult escort, and two escorts if medically necessary and approved). A personal contribution of $40 ($20 for pensioners or Health Care Card holders) is deducted from the total benefits payable per claim. !!!! Travel Costs
- Rail or bus: Provided at economy rates. - Air: Only reimbursed if medically necessary (and prior approval is sought). - Private Car: Standard fuel subsidy rate of 12.7cents/km. - Additional funding for metropolitan public transport or taxi fares may be
available. !!!! Accommodation Assistance for Private Accommodation
- $33.00 per night per single room, or - $46.00 per night per double room.
!!!! Additional allowance of $30.00 per week (after the first week) is available for pensioners and Health Care Card holders.
!!!! Pharmaceutical Benefits Scheme (PBS) � reduces co-payments on medicines listed on the PBS is available if a certain amount of expenditure is reached:
45 It is also possible to have an amount released to prevent foreclosure of a mortgage, or exercise of a power of sale over the member's principal place of residence. 46 http://www.health.nsw.gov.au/policy/hsp/iptaas/about.html#ami
Cost of Cancer in NSW
109
!!!! Patient co-payment per script of $4.70 for concession card holders, up to a Safety Net maximum of $253.80 per year (around 52 prescription medicines), after which the rest is free.
!!!! For everyone else, a maximum co-payment per script of $29.50, up to the safety net maximum of $960.10 per year, after which the rest are $4.70.
!!!! Telephone and Utilities � Various telephone and utility companies offer temporary relief and on-going discounts for customers experiencing financial hardship.
!!!! Charities � A number of charities provide financial assistance to individuals and families in need.
7.2 LOST TAXES
Cancer patients and their carers in paid employment, who are out of the workforce temporarily due to sickness or caring responsibilities, or permanently due to premature retirement or death, will contribute less tax revenue to the Government. This lost value in wages and firm output was calculated in Section 5. Pre-tax:
!!!! Cancer patients lost around $2,038.3 million in wage income due to temporary absenteeism, long-term lost earnings, and premature death;
!!!! Carers lost around $25.8 million in wage income due to caring for the patient;
!!!! Employers lost around $34.8 million in production value on account of absenteeism of the patient or carer, lost management productivity in managing the absenteeism, and direct worker hiring/retraining costs;
In terms of allocating these losses to either personal income or company income, only the employer losses as lost company revenue are included, with the remainder allocated as lost personal income in one form or another. The average personal income tax rate is 21.20% and the average indirect tax rate was 15.51% in 2005, based on the Access Economics Macroeconomic model (AEM). Furthermore the vast majority of company income is distributed to domestic shareholders (as franked dividends) and thus the income is charged at the relevant personal tax rate (Access Economics 2004b).
Together these calculations generate an expected total loss of tax revenue of approximately $770.5 million, or $22,900 per person diagnosed in NSW in 2005. This represents taxation lost that must now be collected from remaining citizens (given no change in expenditure � i.e. for a very small tax change, unlikely to change level of demand for expenditure).
7.3 DEADWEIGHT LOSS
As discussed earlier, transfer payments (Government payments/services and taxes) are not a net cost to society, as they represent a shift of consumption power from one group of individuals to another in the community. If the act of taxation did not create distortions and inefficiencies in the economy, then transfers could be made without a net cost to the community. However through these distortions taxation does impose a deadweight loss on the economy.
Deadweight loss is the loss of consumer and producer surplus, as a result of the imposition of a distortion to the equilibrium (society preferred) level of output and prices. Taxes alter the price and quantity of goods sold compared to what they would be if the market were not distorted, and thus lead to some diminution in the value of trade between
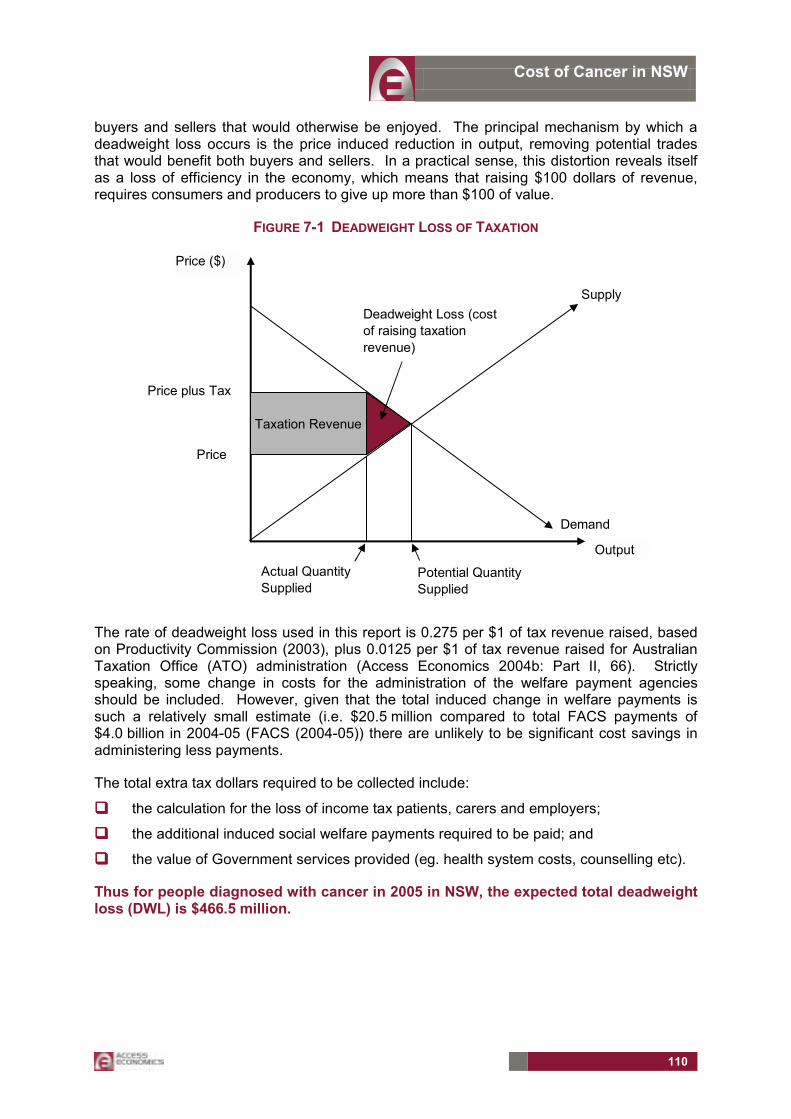
Cost of Cancer in NSW
110
buyers and sellers that would otherwise be enjoyed. The principal mechanism by which a deadweight loss occurs is the price induced reduction in output, removing potential trades that would benefit both buyers and sellers. In a practical sense, this distortion reveals itself as a loss of efficiency in the economy, which means that raising $100 dollars of revenue, requires consumers and producers to give up more than $100 of value.
FIGURE 7-1 DEADWEIGHT LOSS OF TAXATION
Price ($)
Output
Supply
Demand
Price plus Tax
Price
Taxation Revenue
Actual Quantity Supplied
Potential Quantity Supplied
Deadweight Loss (cost of raising taxation revenue)
The rate of deadweight loss used in this report is 0.275 per $1 of tax revenue raised, based on Productivity Commission (2003), plus 0.0125 per $1 of tax revenue raised for Australian Taxation Office (ATO) administration (Access Economics 2004b: Part II, 66). Strictly speaking, some change in costs for the administration of the welfare payment agencies should be included. However, given that the total induced change in welfare payments is such a relatively small estimate (i.e. $20.5 million compared to total FACS payments of $4.0 billion in 2004-05 (FACS (2004-05)) there are unlikely to be significant cost savings in administering less payments.
The total extra tax dollars required to be collected include:
!!!! the calculation for the loss of income tax patients, carers and employers;
!!!! the additional induced social welfare payments required to be paid; and
!!!! the value of Government services provided (eg. health system costs, counselling etc).
Thus for people diagnosed with cancer in 2005 in NSW, the expected total deadweight loss (DWL) is $466.5 million.

Cost of Cancer in NSW
111
TABLE 7-5 SUMMARY OF TRANSFERS, NSW, 2005
$m Health System Costs Borne by Government 811.9Lost Taxes 770.5Welfare Payments 20.5Other Costs Borne by Government 19.6DWL 466.5

Cost of Cancer in NSW
112
8. BURDEN OF DISEASE
8.1 VALUING THE �BURDEN OF DISEASE�
8.1.1 VALUING LIFE AND HEALTH
Since Schelling�s (1968) discussion of the economics of life saving, the health economic literature has properly focused on willingness to pay (willingness to accept) measures of mortality and morbidity risk. Using evidence of market trade-offs between risk and money, including numerous labour market and other studies (such as installing smoke detectors, wearing seatbelts or bike helmets etc), economists have developed estimates of the value of a �statistical� life (VSL).
The willingness to pay approach estimates the value of life in terms of the amounts that individuals are prepared to pay to reduce risks to their lives. It uses stated or revealed preferences to ascertain the value people place on reducing risk to life and reflects the value of intangible elements such as quality of life, health and leisure. While it overcomes the theoretical difficulties of the human capital approach, it involves more empirical difficulties in measurement (BTE, 2000, pp20-21).
Viscusi and Aldy (2002) summarise the extensive literature in this field, most of which has used econometric analysis to value mortality risk and the �hedonic wage� by estimating compensating differentials for on-the-job risk exposure in labour markets, in other words, determining what dollar amount would be accepted by an individual to induce him/her to increase the possibility of death or morbidity by x%. They find the VSL ranges between US$4 million and US$9 million with a median of US$7 million (in year 2000 US dollars), similar but marginally higher than the VSL derived from US product and housing markets, and also marginally higher than non-US studies, although all in the same order of magnitude. They also review a parallel literature on the implicit value of the risk of non-fatal injuries.
A particular life may be regarded as priceless, yet relatively low implicit values may be assigned to life because of the distinction between identified and anonymous (or �statistical�) lives. When a �value of life� estimate is derived, it is not any particular person�s life that is valued, but that of an unknown or statistical individual (Bureau of Transport and Regional Economics, 2002, p19).
Weaknesses in this approach, as with human capital, are that there can be substantial variation between individuals. Extraneous influences in labour markets such as imperfect information, income/wealth or power asymmetries can cause difficulty in correctly perceiving the risk or in negotiating an acceptably higher wage.
Viscusi and Aldy (2002) include some Australian studies in their meta-analysis, notably Kniesner and Leeth (1991) of the Australian Bureau of Statistics (ABS) with VSL47 of US2000 $4.2 million and Miller et al (1997) of the National Occupational Health and Safety Commission (NOHSC) with quite a high VSL of US2000$11.3m-19.1 million (Viscusi and
47 Value of the remaining life left for the average person surveyed.

Cost of Cancer in NSW
113
Aldy, 2002, Table 4, pp92-93). Since there are relatively few Australian studies, there is also the issue of converting foreign (US) data to Australian dollars using either exchange rates or purchasing power parity and choosing a period.
Access Economics (2003) presents outcomes of studies from Yale University (Nordhaus, 1999) � where VSL is estimated as $US2.66m; University of Chicago (Murphy and Topel, 1999) � US$5m; Cutler and Richardson (1998) � who model a common range from US$3m to US$7m, noting a literature range of $US0.6m to $US13.5m per fatality prevented (1998 US dollars). These studies apply discount rates of 0% and 3% (favouring 3%) to the common range to derive an equivalent of $US 75,000 to $US 150,000 for a year of life gained.
8.1.2 DALYS AND QALYS
In an attempt to overcome some of the issues in relation to placing a dollar value on a human life, in the last decade an alternative approach to valuing human life has been derived. The approach is non-financial, where pain, suffering and premature mortality are measured in terms of Disability Adjusted Life Years (DALYs), with 0 representing a year of perfect health and 1 representing death (the converse of a QALY or �quality-adjusted life year� where 1 represents perfect health). This approach was developed by the World Health Organization, the World Bank and Harvard University and provides a comprehensive assessment of mortality and disability from diseases, injuries and risk factors in 1990, projected to 2020 (Murray and Lopez, 1996). Methods and data sources are detailed further in Murray et al (2001).
The DALY approach has been adopted and applied in Australia by the Australian Institute for Health and Welfare (AIHW) with a separate comprehensive application in Victoria. Mathers et al (1999) from the AIHW estimate the burden of disease and injury in 1996, including separate identification of premature mortality (Years of Life Lost - YLL) and morbidity (Years of Life Lost due to Disability - YLD) components:
DALYs = YLLs + YLDs
In any year, the disability weight of a disease (for example, 0.18 for a broken wrist) reflects a relative health state. In this example, 0.18 would represent losing 18% of a year of healthy life because of the inflicted injury.
The DALY approach has been successful in avoiding the subjectivity of individual valuation and is capable of overcoming the problem of comparability between individuals and between nations, although nations have subsequently adopted variations in weighting systems. For example, in some countries DALYs are age-weighted for older people although in Australia the minority approach is adopted � valuing a DALY equally for people of all ages.
The main problem with the DALY approach is that it is not financial and is thus not directly comparable with most other cost measures. In public policy making, therefore, there is always the temptation to re-apply a financial measure conversion to ascertain the cost of an injury or fatality or the value of a preventive health intervention. Such financial conversions tend to utilise �willingness to pay� or risk-based labour market studies described above.
The Department of Health and Ageing (based on work by Applied Economics) adopted a very conservative approach to this issue, placing the value of a human life year at around A$60,000 per annum, which is lower than most international lower bounds on the estimate.

Cost of Cancer in NSW
114
“In order to convert DALYs into economic benefits, a dollar value per DALY is required. In this study, we follow the standard approach in the economics literature and derive the value of a healthy year from the value of life. For example, if the estimated value of life is A$2 million, the average loss of healthy life is 40 years, and the discount rate is 5 per cent per annum, the value of a healthy year would be $118,000.48 Tolley, Kenkel and Fabian (1994) review the literature on valuing life and life years and conclude that a range of US$70,000 to US$175,000 per life year is reasonable. In a major study of the value of health of the US population, Cutler and Richardson (1997) adopt an average value of US$100,000 in 1990 dollars for a healthy year.
Although there is an extensive international literature on the value of life (Viscusi, 1993), there is little Australian research on this subject. As the Bureau of Transport Economics (BTE) (in BTE, 2000) notes, international research using willingness to pay values usually places the value of life at somewhere between A$1.8 and A$4.3 million. On the other hand, values of life that reflect the present value of output lost (the human capital approach) are usually under $1 million.
The BTE (2000) adopts estimates of $1 million to $1.4 million per fatality, reflecting a 7 per cent and 4 per cent discount rate respectively. The higher figure of $1.4 million is made up of loss of workforce productivity of $540,000, loss of household productivity of $500,000 and loss of quality of life of $319,000. This is an unusual approach that combines human capital and willingness to pay concepts and adds household output to workforce output.
For this study, a value of $1 million and an equivalent value of $60,000 for a healthy year are assumed.49 In other words, the cost of a DALY is $60,000. This represents a conservative valuation of the estimated willingness to pay values for human life that are used most often in similar studies.50” (DHA, 2003, pp11-12).”
As the citation concludes, the estimate of $60,000 per DALY is very low. The Viscusi (1993) meta-analysis reviewed 24 studies with values of a human life ranging between $US 0.5 million and $US 16m, all in pre-1993 US dollars. Even the lowest of these converted to 2003 Australian dollars at current exchange rates, exceeds the estimate adopted ($1m) by nearly 25%. The BTE study tends to disregard the literature at the higher end and also adopts a range (A$1-$1.4m) below the lower bound of the international range that it identifies (A$1.8-$4.3m).
The rationale for adopting these very low estimates is not provided explicitly. Certainly it is in the interests of fiscal restraint to present as low an estimate as possible.
In contrast, the majority of the literature as detailed above appears to support a higher estimate for VSL, as presented in Table 8-1, which Access Economics believes is important to consider in disease costing applications and decisions. The US dollar values of the lower bound, midrange and upper bound are shown at left. The �average� estimate is the average
48 In round numbers, $2,000,000 = $118,000/1.05 + $118,000/(1.05)2 + … + $118,000/(1.05).40 [Access Economics comment: The actual value should be $116,556, not $118,000 even in round numbers.] 49 The equivalent value of $60,000 assumes, in broad terms, 40 years of lost life and a discount rate of 5 per cent. [Access Economics comment: More accurately the figure should be $58,278.] 50 In addition to the cited references in the text, see for example Murphy and Topel�s study (1999) on the economic value of medical research. [Access Economics comment. Identical reference to our Murphy and Topel (1999).]

Cost of Cancer in NSW
115
of the range excluding the high NOHSC outlier. Equal weightings are used for each study as the:
!!!! Viscusi and Aldy meta-analysis summarises 60 recent studies;
!!!! ABS study is Australian; and
!!!! Yale and Harvard studies are based on the conclusions of eminent researchers in the field after conducting literature analysis.
Where there is no low or high US dollar estimate for a study, the midrange estimate is used to calculate the average. The midrange estimates are converted to Australian dollars at purchasing power parity (as this is less volatile than exchange rates) of USD=0.7281AUD for 2003 as estimated by the OECD.
Access Economics concludes the VSL range in Australia lies between $3.7m and $9.6m51, with a mid-range estimate of $6.5m. These estimates have conservatively not been inflated to 2004 prices, given the uncertainty levels.
TABLE 8-1 INTERNATIONAL ESTIMATES OF VSL, VARIOUS YEARS
US$m A$m Lower Midrange Upper 0.7281
Viscusi and Aldy meta-analysis 2002
4 7 9 9.6
Australian: ABS 1991 4.2 5.8 NOHSC 1997 11.3 19.1 Yale (Nordhaus) 1999 2.66 3.7Harvard (Cutler and Richardson) 1998
0.6 5 13.7 6.9
Average* 2.9 4.7 7.4 6.5* Average of range excluding high NOHSC outlier, using midrange if no data; conservatively not inflated. A$m conversions are at the OECD 2003 PPP rate.
Discounting the VSL52 of $3.7m from Table 8-1 by the discount rate of 3.3% (see Section 3.3.1) over an average 40 years expected life span (the average from the meta-analysis of wage-risk studies) provides an estimate of the value of a life year of $162,561.
8.1.3 ESTIMATING THE VALUE OF THE BURDEN OF DISEASE
The value of the burden of disease is estimated by applying the lower bound value of a statistical life year of $162,561 (based on the lower bound of the value of a statistical life of $3.7 million) to the total Disability Adjusted Life Years (DALYs) due to cancer:
!!!! For each person, YLDs are based on YLDs per incidence case from Mathers et al (1999), with a discount rate of 3.3% and no age weighting.
!!!! For each person, YLLs are estimated by multiplying the probability of dying of cancer in each year after diagnosis (adjusted by the general mortality rate i.e. the probability of dying anyway of some other cause) by the corresponding YLLs for the age of death in
51 Calculated from the non-indexed studies themselves. Converting the Access Economics average estimates from USD to AUD at PPP would provide slightly higher estimates - $3.9 million and $10.2m, with the same midrange estimate. 52 Value of the remaining life left for the average person surveyed.

Cost of Cancer in NSW
116
the Standard Life Expectancy Table (West Level 26) at a discount rate of 3.3% and no age weighting. YLLs are allocated to the year that the person died.
!!!! YLDs and YLLs are added together to estimate total DALYs.
The source studies from which the VSL is drawn implicitly include the individual�s net estimation of other personal costs � notably lost earnings (after tax) and out-of-pocket expenses. Thus the net cost of suffering and premature death from cancer should exclude these costs to avoid double counting.
8.2 SUMMARY OF BURDEN OF DISEASE
The YLD estimates represent both the incidence of each cancer, the loss of wellbeing while suffering from cancer, and the expected duration of treatment for the cancer. Due to Mathers et al (1999) being based on older survival data with a worse prognosis, the assumed duration of the cancer in 1996 is shorter than would be expected in 2005, and thus the YLD estimates per person would be slightly on the conservative side.
The YLL estimates represent the probability of survival and the age of the person at diagnosis (with YLLs higher for those in the younger age groups). They are based on the most current survival data (however due to being based on survival data, will not necessarily correspond directly to death certificate data).
For people diagnosed in NSW in 2005, the total expected lifetime loss of wellbeing is 34,500 YLDs and 151,300 YLLs lost due to cancer. In general, the cancers with the highest YLDs are breast (19%), colorectal (14%), and prostate cancer (13%). In comparison, the cancers with the highest YLLs are lung (19%), colorectal (14%), and stomach, liver and pancreatic cancer (11%). Overall, the cancers with the highest DALYs are lung (15%), colorectal (14%), breast (9%), and stomach, liver and pancreatic cancer (9%).
FIGURE 8-1 DISTRIBUTION OF TOTAL YLDS, NSW, 2005
8%
14%
13%
19%8%
4%
3%
2%2%
3%
3%1%
8%
12%
MelanomaColorectalProstateBreastLungNon-Hodgkin�s LymphomaLeukaemiaBladderKidneyStomach, Liver and PancreaticUterine, Ovarian and CervicalBrainHead, Neck and ThyroidOther

Cost of Cancer in NSW
117
FIGURE 8-2 DISTRIBUTION OF TOTAL YLLS, NSW, 2005 3%
14%
5%
6%
19%
5%4%2%
3%
11%
4%
3%
8%
13%
MelanomaColorectalProstateBreastLungNon-Hodgkin�s LymphomaLeukaemiaBladderKidneyStomach, Liver and PancreaticUterine, Ovarian and CervicalBrainHead, Neck and ThyroidOther
FIGURE 8-3 DISTRIBUTION OF TOTAL DALYS, NSW, 2005
4%
14%
7%
9%
15%
5%4%
2%
3%
9%
4%
3%
8%
13%
MelanomaColorectalProstateBreastLungNon-Hodgkin�s LymphomaLeukaemiaBladderKidneyStomach, Liver and PancreaticUterine, Ovarian and CervicalBrainHead, Neck and ThyroidOther
On a case basis, the cancers with the greatest lifetime DALYs per case on average are brain (10.5 years), lung (10.3 years), and stomach, liver and pancreatic (9.8 years) � largely due to the poor prognosis for these cancers. Leukaemia (8.0 years) and non-Hodgkin�s lymphoma (6.9 years) also have high DALYs � largely due to the greater proportion of children suffering from these cancers.
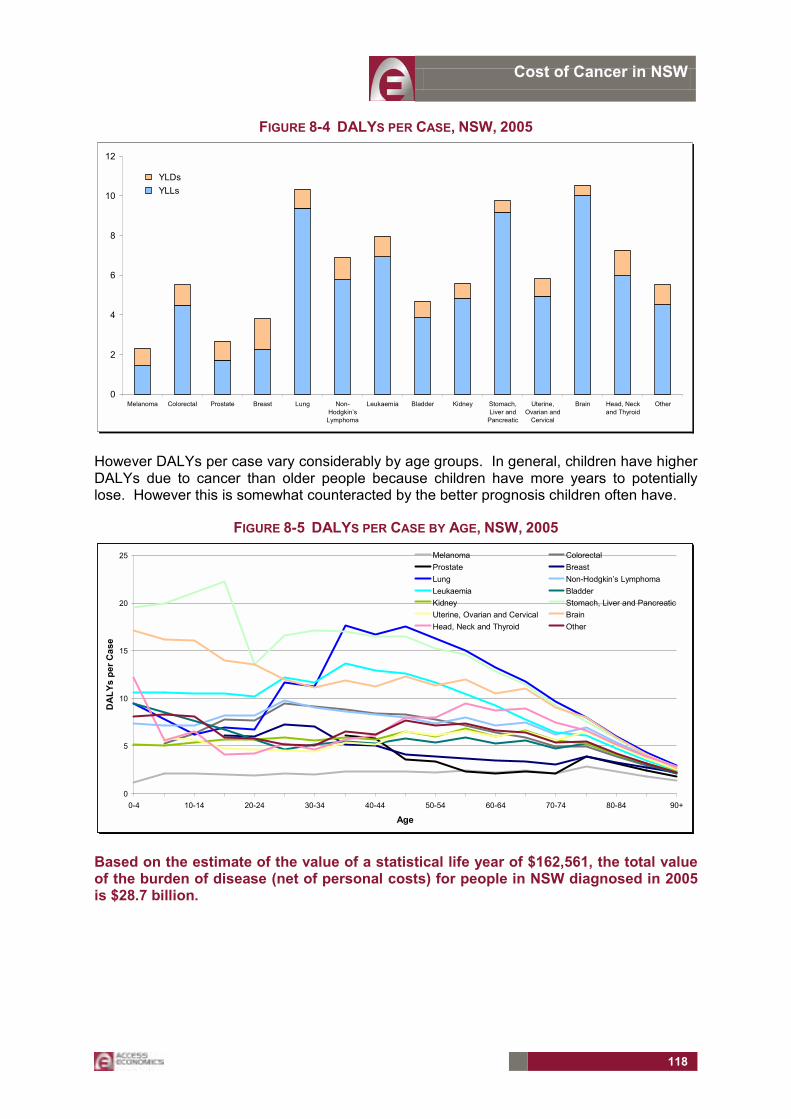
Cost of Cancer in NSW
118
FIGURE 8-4 DALYS PER CASE, NSW, 2005
0
2
4
6
8
10
12
Melanoma Colorectal Prostate Breast Lung Non-Hodgkin�sLymphoma
Leukaemia Bladder Kidney Stomach,Liver and
Pancreatic
Uterine,Ovarian and
Cervical
Brain Head, Neckand Thyroid
Other
YLDs YLLs
However DALYs per case vary considerably by age groups. In general, children have higher DALYs due to cancer than older people because children have more years to potentially lose. However this is somewhat counteracted by the better prognosis children often have.
FIGURE 8-5 DALYS PER CASE BY AGE, NSW, 2005
0
5
10
15
20
25
0-4 10-14 20-24 30-34 40-44 50-54 60-64 70-74 80-84 90+
Age
DA
LYs
per C
ase
Melanoma ColorectalProstate BreastLung Non-Hodgkin�s LymphomaLeukaemia BladderKidney Stomach, Liver and PancreaticUterine, Ovarian and Cervical BrainHead, Neck and Thyroid Other
Based on the estimate of the value of a statistical life year of $162,561, the total value of the burden of disease (net of personal costs) for people in NSW diagnosed in 2005 is $28.7 billion.
Cost of Cancer in NSW
119
9. SUMMARY OF COSTS In NSW in 2005 there were around 33,700 new cases of cancer, of which 13,600 will die from cancer in the next five years53.
In NSW the total expected lifetime economic cost of cancer for people diagnosed in 2005 is around $32.5 billion.
Around 88% of the economic cost of cancer is the net value of burden of disease (BoD). The total lifetime financial cost of cancer of people diagnosed in 2005 in NSW is $3.9 billion � equivalent to 1.3% of gross state product. These are the real economic costs. In addition there are $0.8 billion of transfer payments � loss of tax revenue and welfare payments.
In Australia the total expected lifetime economic cost of cancer for people diagnosed in 2005 is around $94.6 billion and the total financial cost is around $11.2 billion.54
Thus the economic cost of cancer is on par with cardiovascular disease, which was estimated to cost around $93.9 billion in healthy life lost with financial costs around $14.2 billion (or 1.7% of gross domestic product), estimated on a prevalence basis (Access Economics 2005).
While fewer people have cancer at any one time, cancer has a large impact on the individual and ranks second in terms of disease burden in Australia, after cardiovascular disease, and is a National Health Priority Area.
53 Based on relative survival rates. 54 Scaled up based on new cases of cancer in NSW represent 34% of all new cases of cancer in Australia in 2005.

Cost of Cancer in NSW
120
FIGURE 9-1 COMPARISON OF PREVALENCE ACROSS DISEASES IN AUSTRALIA
- 2,000.0 4,000.0 6,000.0 8,000.0 10,000.0 12,000.0
Infectious & parasitic diseases
Congenital malformations etc
Blood & blood forming organs
Cancer*
Genito-urinary system
Diabetes melitus*
Skin & subcutaneous tissue
Digestive system
Nervous system
Asthma*
Mental and behavioural problems*
Hearing loss
Cardiovascular*
Musculoskeletal*
Visual disorders
Number of persons ('000) reporting condition* National Health Priorities
Source: ABS 4364.0
FIGURE 9-2 COMPARISON OF CAUSE OF DEATH IN AUSTRALIA
0 10000 20000 30000 40000 50000 60000
Hearing loss
Visual disorders
Asthma*
Skin & subcutaneous tissue
Blood & blood forming organs
Congenital malformations etc
Musculoskeletal*
Infectious & parasitic diseases
Genito-urinary system
Mental and behavioural problems*
Diabetes melitus*
Digestive system
Nervous system
Cancer*
Cardiovascular*
Number of deaths* National Health Priorities
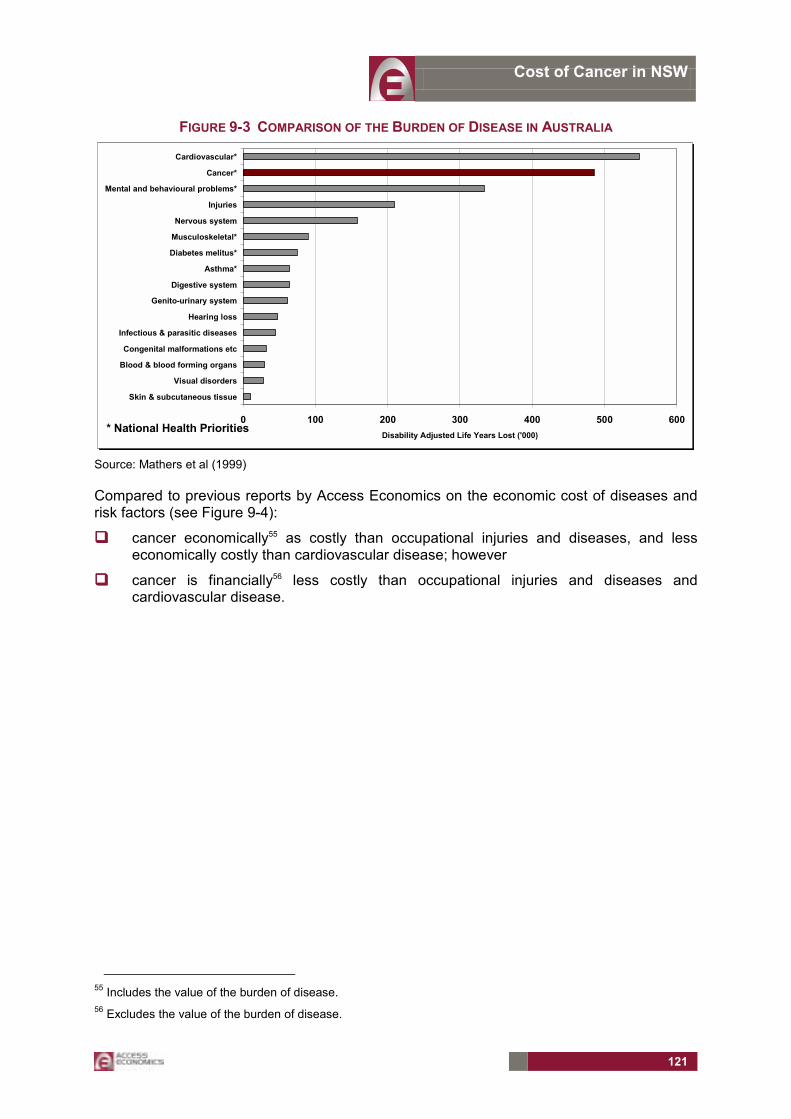
Cost of Cancer in NSW
121
FIGURE 9-3 COMPARISON OF THE BURDEN OF DISEASE IN AUSTRALIA
0 100 200 300 400 500 600
Skin & subcutaneous tissue
Visual disorders
Blood & blood forming organs
Congenital malformations etc
Infectious & parasitic diseases
Hearing loss
Genito-urinary system
Digestive system
Asthma*
Diabetes melitus*
Musculoskeletal*
Nervous system
Injuries
Mental and behavioural problems*
Cancer*
Cardiovascular*
Disability Adjusted Life Years Lost ('000)* National Health Priorities
Source: Mathers et al (1999)
Compared to previous reports by Access Economics on the economic cost of diseases and risk factors (see Figure 9-4):
!!!! cancer economically55 as costly than occupational injuries and diseases, and less economically costly than cardiovascular disease; however
!!!! cancer is financially56 less costly than occupational injuries and diseases and cardiovascular disease.
55 Includes the value of the burden of disease. 56 Excludes the value of the burden of disease.

Cost of Cancer in NSW
122
FIGURE 9-4 COMPARISON OF THE ECONOMIC COST ACROSS HEALTH CONDITIONS IN AUSTRALIA
0.0 20.0 40.0 60.0 80.0 100.0 120.0
Multiple Sclerosis
Bipolar
Schizophrenia
Visual disorders
Sleep Health
Domestic Violence
Osteoporosis*
Arthritis*
Hearing loss
Dementia
OHS
Cancer*
Cardiovascular*
Economic Costs ($ Billion)* National Health Priorities
OHS = Occupational Health and Safety. Some of these costs are based on a prevalence, rather than an incidence, approach to costs. Economic costs in $2005. Source: www.accesseconomics.com.au
The most costly cancers to the NSW economy were lung (16%), colorectal (13%), breast (9%), and stomach, liver and pancreatic cancer (9%), while the least costly cancers were bladder (2%), kidney (3%) and brain cancer (3%).

Cost of Cancer in NSW
123
TABLE 9-1 TOTAL LIFETIME ECONOMIC COST OF CANCER, BY TYPE OF CANCER, NSW, 2005 ($M)
Cancer Value of BoD Financial Cost
Total Economic
Cost
% of GSP
Melanoma 1,213.7 108.3 1,322.0 0.04%Colorectal 3,899.0 463.0 4,362.0 0.16%Prostate 1,860.3 296.9 2,157.1 0.10%Breast 2,565.9 280.0 2,845.9 0.09%Lung 4,787.2 390.8 5,178.0 0.13%Non-Hodgkin�s Lymphoma 1,379.5 219.6 1,599.1 0.07%Leukaemia 1,150.5 249.2 1,399.7 0.08%Bladder 654.5 70.2 724.7 0.02%Kidney 788.8 104.3 893.1 0.04%Stomach, Liver and Pancreatic 2,647.6 277.0 2,924.6 0.09%Uterine, Ovarian and Cervical 1,087.1 108.3 1,195.3 0.04%Brain 774.8 161.0 935.8 0.05%Head, Neck and Thyroid 2,314.3 341.3 2,655.5 0.12%Other 3,536.1 783.5 4,319.6 0.27%All Cancers 28,659.2 3,853.4 32,512.6 1.31%
TABLE 9-2 DISTRIBUTION OF THE LIFETIME ECONOMIC COST OF CANCER, NSW, 2005
4%
13%
7%
9%
16%
5%4%
2%
3%
9%
4%
3%
8%
13%
MelanomaColorectalProstateBreastLungNon-Hodgkin�s LymphomaLeukaemiaBladderKidneyStomach, Liver and PancreaticUterine, Ovarian and CervicalBrainHead, Neck and ThyroidOther
Excluding the BoD, the main cost components of cancer are productivity and carer costs ($2,098.9 million), followed by health system costs ($1,125.8 million), deadweight loss ($466.5 million) and other financial costs ($162.3 million).

Cost of Cancer in NSW
124
TABLE 9-3 LIFETIME FINANCIAL COST OF CANCER, BY TYPE OF COST, NSW, 2005 ($M)
Cancer Health Productivity Carer Other Financial DWL Total
Melanoma 15.9 66.5 2.2 12.4 11.3 1,322.0 Colorectal 137.6 241.7 3.5 23.4 56.9 4,362.0 Prostate 108.2 133.2 3.2 18.0 34.3 2,157.1 Breast 76.6 147.6 3.1 20.3 32.4 2,845.9 Lung 90.4 235.2 2.2 17.9 45.1 5,178.0 Non-Hodgkin�s Lymphoma 58.6 126.4 1.1 6.9 26.5 1,599.1 Leukaemia 73.1 138.0 1.6 5.7 30.8 1,399.7 Bladder 29.6 26.7 0.6 4.1 9.3 724.7 Kidney 23.2 63.7 0.8 4.5 12.1 893.1 Stomach, Liver and Pancreatic
62.5 170.7 1.2 10.1 32.4 2,924.6
Uterine, Ovarian and Cervical 32.7 55.2 0.9 6.2 13.3 1,195.3 Brain 30.1 108.5 0.7 3.4 18.4 935.8 Head, Neck and Thyroid 62.9 229.4 1.2 9.2 38.6 2,655.5 Other 324.3 330.3 3.6 20.3 105.1 4,319.6
All Cancers 1,125.8 2,073.1 25.8 162.3 466.5 3,853.4
FIGURE 9-5 LIFETIME FINANCIAL COST OF CANCER, BY TYPE OF COST
29%
54%
1%
4%
12%
Health System CostsProductivity CostsCarer CostsOther Financial CostsDWL
Due to the BoD, the main bearer of the total cost of cancer is the individual. However of the financial costs, individuals bear around 40.4% of the total cost of cancer, with governments ($1,622.5 million), society ($621.4 million), family and friends ($31.7 million) and employers ($22.0 million) sharing the remaining costs.
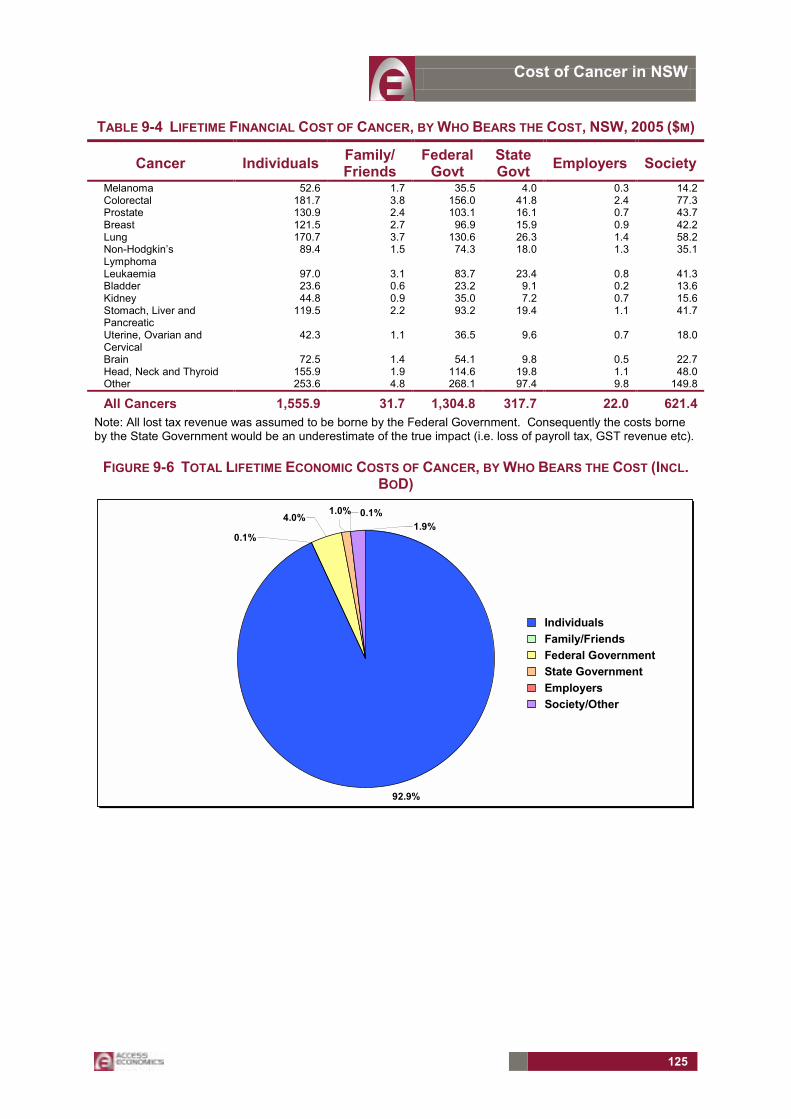
Cost of Cancer in NSW
125
TABLE 9-4 LIFETIME FINANCIAL COST OF CANCER, BY WHO BEARS THE COST, NSW, 2005 ($M)
Cancer Individuals Family/ Friends
Federal Govt
State Govt Employers Society
Melanoma 52.6 1.7 35.5 4.0 0.3 14.2 Colorectal 181.7 3.8 156.0 41.8 2.4 77.3 Prostate 130.9 2.4 103.1 16.1 0.7 43.7 Breast 121.5 2.7 96.9 15.9 0.9 42.2 Lung 170.7 3.7 130.6 26.3 1.4 58.2 Non-Hodgkin�s Lymphoma
89.4 1.5 74.3 18.0 1.3 35.1
Leukaemia 97.0 3.1 83.7 23.4 0.8 41.3 Bladder 23.6 0.6 23.2 9.1 0.2 13.6 Kidney 44.8 0.9 35.0 7.2 0.7 15.6 Stomach, Liver and Pancreatic
119.5 2.2 93.2 19.4 1.1 41.7
Uterine, Ovarian and Cervical
42.3 1.1 36.5 9.6 0.7 18.0
Brain 72.5 1.4 54.1 9.8 0.5 22.7 Head, Neck and Thyroid 155.9 1.9 114.6 19.8 1.1 48.0 Other 253.6 4.8 268.1 97.4 9.8 149.8
All Cancers 1,555.9 31.7 1,304.8 317.7 22.0 621.4Note: All lost tax revenue was assumed to be borne by the Federal Government. Consequently the costs borne by the State Government would be an underestimate of the true impact (i.e. loss of payroll tax, GST revenue etc).
FIGURE 9-6 TOTAL LIFETIME ECONOMIC COSTS OF CANCER, BY WHO BEARS THE COST (INCL. BOD)
92.9%
1.0%1.9%
0.1%4.0%
0.1%
Individuals Family/Friends Federal Government State Government Employers Society/Other

Cost of Cancer in NSW
126
FIGURE 9-7 TOTAL LIFETIME FINANCIAL COST OF CANCER, BY WHO BEARS THE COST (EXCL. BOD)
40.4%8.2%
16.1%
0.6%
33.9% 0.8%
Individuals Family/Friends Federal Government State Government Employers Society/Other
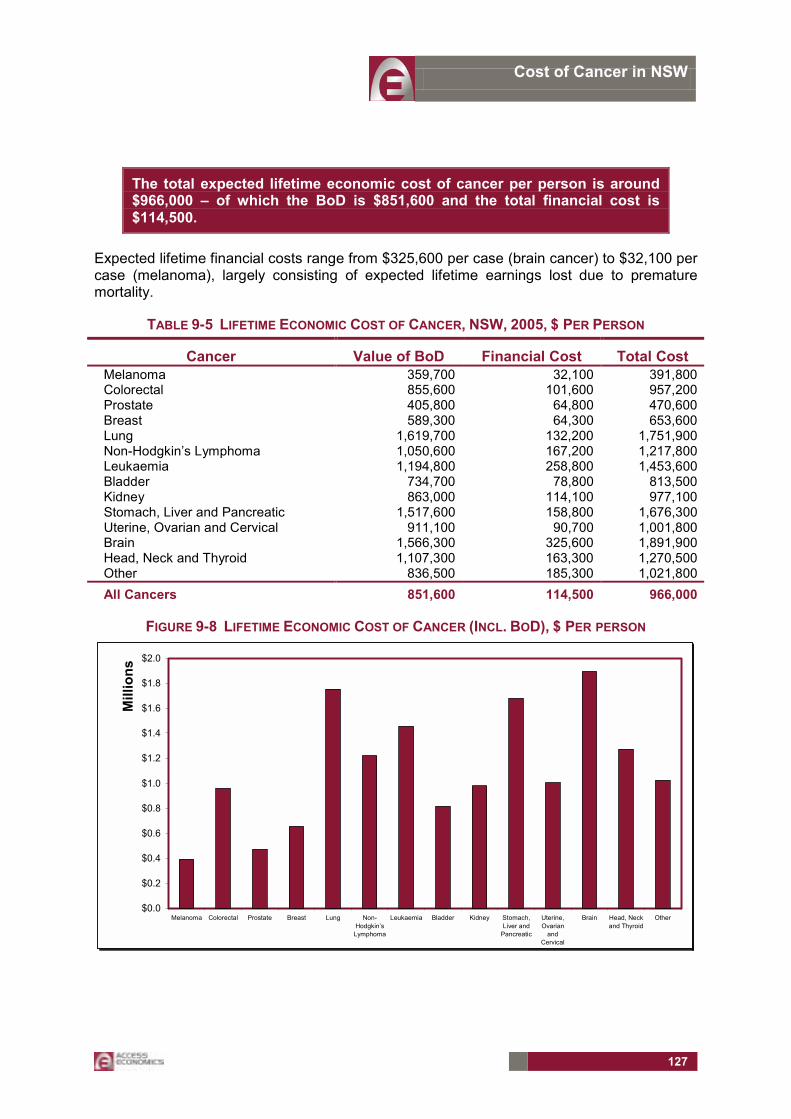
Cost of Cancer in NSW
127
The total expected lifetime economic cost of cancer per person is around $966,000 � of which the BoD is $851,600 and the total financial cost is $114,500.
Expected lifetime financial costs range from $325,600 per case (brain cancer) to $32,100 per case (melanoma), largely consisting of expected lifetime earnings lost due to premature mortality.
TABLE 9-5 LIFETIME ECONOMIC COST OF CANCER, NSW, 2005, $ PER PERSON
Cancer Value of BoD Financial Cost Total Cost Melanoma 359,700 32,100 391,800 Colorectal 855,600 101,600 957,200 Prostate 405,800 64,800 470,600 Breast 589,300 64,300 653,600 Lung 1,619,700 132,200 1,751,900 Non-Hodgkin�s Lymphoma 1,050,600 167,200 1,217,800 Leukaemia 1,194,800 258,800 1,453,600 Bladder 734,700 78,800 813,500 Kidney 863,000 114,100 977,100 Stomach, Liver and Pancreatic 1,517,600 158,800 1,676,300 Uterine, Ovarian and Cervical 911,100 90,700 1,001,800 Brain 1,566,300 325,600 1,891,900 Head, Neck and Thyroid 1,107,300 163,300 1,270,500 Other 836,500 185,300 1,021,800 All Cancers 851,600 114,500 966,000
FIGURE 9-8 LIFETIME ECONOMIC COST OF CANCER (INCL. BOD), $ PER PERSON
$0.0
$0.2
$0.4
$0.6
$0.8
$1.0
$1.2
$1.4
$1.6
$1.8
$2.0
Melanoma Colorectal Prostate Breast Lung Non-Hodgkin�sLymphoma
Leukaemia Bladder Kidney Stomach,Liver and
Pancreatic
Uterine,Ovarian
andCervical
Brain Head, Neckand Thyroid
Other
Mill
ions

Cost of Cancer in NSW
128
FIGURE 9-9 LIFETIME FINANCIAL COST OF CANCER (EXCL. BOD), $ PER PERSON
$0
$50,000
$100,000
$150,000
$200,000
$250,000
$300,000
$350,000
Melanoma Colorectal Prostate Breast Lung Non-Hodgkin�sLymphoma
Leukaemia Bladder Kidney Stomach,Liver and
Pancreatic
Uterine,Ovarian
andCervical
Brain Head, Neckand Thyroid
Other
DWLOther Financial CostsCarer CostsProductivity CostsHealth Costs
For people aged younger than 65 years the lifetime economic cost of cancer is higher for males than females (largely due to the difference in expected lifetime earnings lost due to premature mortality � however this effect disappears from 65 onwards), and the lifetime economic cost of cancer is higher for children than for older people (because children have many more potential years of life to lose).
TABLE 9-6 LIFETIME ECONOMIC COST, BY AGE/SEX (INCL. BOD), $ PER PERSON
Males Females 0-14 15-64 65+ 0-14 15-64 65+
Melanoma 329,300 442,400 422,600 358,700 335,100 328,600 Colorectal 1,212,100 1,293,500 772,000 771,300 1,269,200 811,000 Prostate - 447,600 480,300 - - - Breast - 692,100 511,300 - 712,100 560,400 Lung 1,721,100 2,550,800 1,354,300 788,500 2,577,100 1,492,400 Non-Hodgkin�s Lymphoma 1,477,900 1,536,500 992,100 1,373,900 1,278,000 1,114,200 Leukaemia 2,201,200 2,102,000 939,600 1,904,700 2,075,300 1,008,300 Bladder 1,745,100 958,800 732,100 - 1,061,900 856,100 Kidney 1,152,000 1,162,900 773,100 930,000 1,043,900 1,015,600 Stomach, Liver and Pancreatic 4,301,000 2,572,200 1,252,800 2,556,700 2,563,300 1,319,100 Uterine, Ovarian and Cervical - - - 1,072,200 1,043,300 948,000 Brain 3,044,700 2,134,200 1,342,300 3,165,500 2,120,900 1,512,300 Head, Neck and Thyroid 1,986,100 1,793,700 1,175,500 1,012,600 851,900 1,103,900 Other 1,655,900 1,358,900 839,400 1,463,400 1,153,800 891,100 All Cancers 2,091,800 1,261,600 804,200 1,727,400 1,008,200 886,600
Note that these are expected lifetime costs if a person was diagnosed with cancer � many childhood cancers are rare and so these costs would not always be incurred (for example about one child per year is diagnosed with lung cancer in NSW).

Cost of Cancer in NSW
129
FIGURE 9-10 LIFETIME ECONOMIC COST OF CANCER, BY AGE/SEX (INCL. BOD), $ PER PERSON
$0
$500,000
$1,000,000
$1,500,000
$2,000,000
$2,500,000
0-4 10-14 20-24 30-34 40-44 50-54 60-64 70-74 80-84 90+
MalesFemales
For people aged younger than 65 years the lifetime financial cost of cancer is higher for males than females (largely due to the difference in expected lifetime earnings lost due to premature mortality � however this effect disappears from 65 onwards), and the lifetime financial cost of cancer is higher for children than for older people (because children have many more years in the workforce ahead of them).
TABLE 9-7 LIFETIME FINANCIAL COST, BY AGE/SEX (EXCL. BOD), $ PER PERSON
Males Females 0-14 15-64 65+ 0-14 15-64 65+
Melanoma 72,000 64,100 12,400 54,000 27,000 14,100 Colorectal 388,300 263,800 46,900 190,200 126,600 52,000 Prostate - 118,600 42,200 - - - Breast - 171,400 34,400 - 84,500 31,000 Lung 513,600 388,700 49,900 207,600 204,400 54,900 Non-Hodgkin�s Lymphoma 510,800 381,200 57,500 413,400 169,600 71,300 Leukaemia 719,000 606,500 60,500 407,200 331,700 66,300 Bladder 477,400 200,900 46,100 - 110,500 64,600 Kidney 417,200 261,800 38,700 226,500 114,300 49,200
Stomach, Liver and Pancreatic
1,097,300 468,400 55,100 471,000 237,600 57,800
Uterine, Ovarian and Cervical - - - 257,000 122,500 49,000 Brain 887,300 574,200 81,900 587,400 303,200 91,600 Head, Neck and Thyroid 602,200 368,300 59,100 216,100 109,500 55,200 Other 516,200 396,200 91,600 286,100 216,200 109,800 All Cancers 653,000 275,000 50,400 351,600 118,600 56,800
Note that these are expected lifetime costs if a person was diagnosed with cancer � many childhood cancers are rare and so these costs would not always be incurred (for example about one child per year is diagnosed with lung cancer in NSW).

Cost of Cancer in NSW
130
FIGURE 9-11 LIFETIME FINANCIAL COST OF CANCER, BY AGE/SEX (EXCL. BOD), $ PER PERSON
$0
$100,000
$200,000
$300,000
$400,000
$500,000
$600,000
$700,000
$800,000
0-4 10-14 20-24 30-34 40-44 50-54 60-64 70-74 80-84 90+
MalesFemales

Cost of Cancer in NSW
131
The expected lifetime financial cost of cancer faced by households (made up of individuals and their families) is $47,200 per person.
These financial costs include:
!!!! A reduction in income (for example, productivity and carer costs), and
!!!! An increase in out-of-pocket expenses (for example, health costs and other financial costs).
In terms of the financial costs faced by households:
!!!! the most expensive cancers are brain cancer ($149,400) and leukaemia ($103,900),
!!!! the least expensive cancer is melanoma ($16,100).
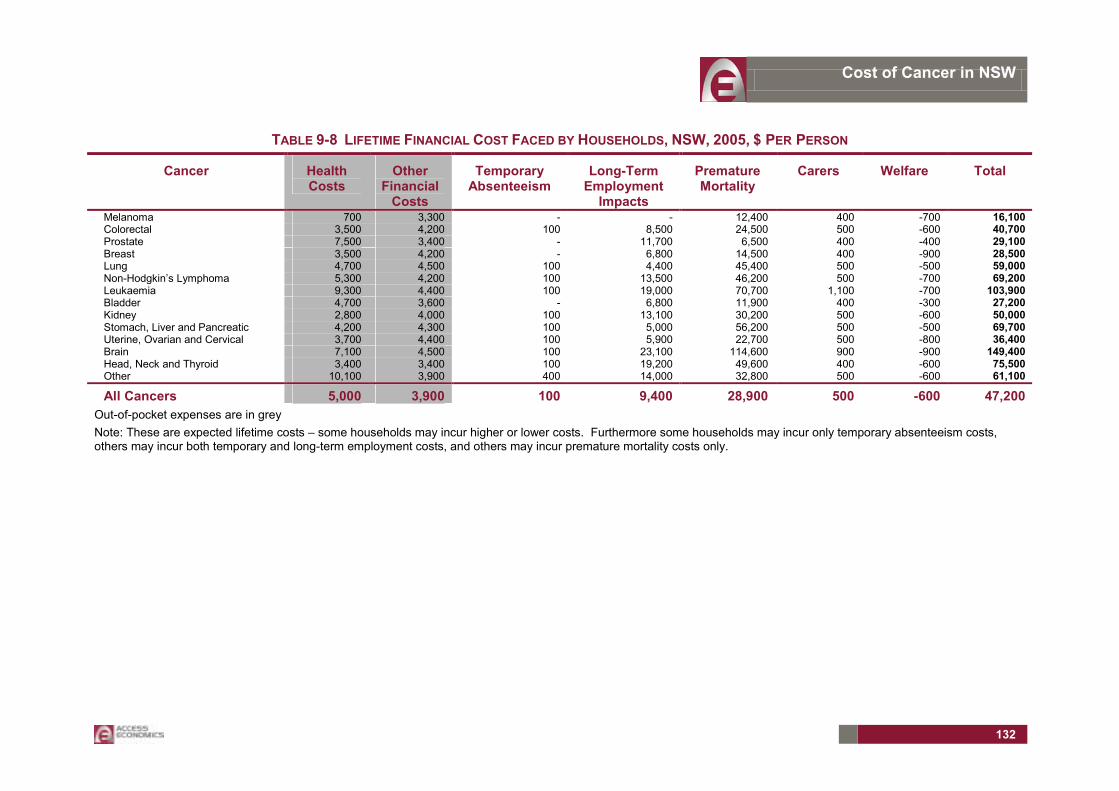
Cost of Cancer in NSW
132
TABLE 9-8 LIFETIME FINANCIAL COST FACED BY HOUSEHOLDS, NSW, 2005, $ PER PERSON
Cancer Health Costs
Other Financial
Costs
Temporary Absenteeism
Long-Term Employment
Impacts
Premature Mortality
Carers Welfare Total
Melanoma 700 3,300 - - 12,400 400 -700 16,100 Colorectal 3,500 4,200 100 8,500 24,500 500 -600 40,700 Prostate 7,500 3,400 - 11,700 6,500 400 -400 29,100 Breast 3,500 4,200 - 6,800 14,500 400 -900 28,500 Lung 4,700 4,500 100 4,400 45,400 500 -500 59,000 Non-Hodgkin�s Lymphoma 5,300 4,200 100 13,500 46,200 500 -700 69,200 Leukaemia 9,300 4,400 100 19,000 70,700 1,100 -700 103,900 Bladder 4,700 3,600 - 6,800 11,900 400 -300 27,200 Kidney 2,800 4,000 100 13,100 30,200 500 -600 50,000 Stomach, Liver and Pancreatic 4,200 4,300 100 5,000 56,200 500 -500 69,700 Uterine, Ovarian and Cervical 3,700 4,400 100 5,900 22,700 500 -800 36,400 Brain 7,100 4,500 100 23,100 114,600 900 -900 149,400 Head, Neck and Thyroid 3,400 3,400 100 19,200 49,600 400 -600 75,500 Other 10,100 3,900 400 14,000 32,800 500 -600 61,100
All Cancers 5,000 3,900 100 9,400 28,900 500 -600 47,200 Out-of-pocket expenses are in grey Note: These are expected lifetime costs � some households may incur higher or lower costs. Furthermore some households may incur only temporary absenteeism costs, others may incur both temporary and long-term employment costs, and others may incur premature mortality costs only.

Cost of Cancer in NSW
133
FIGURE 9-12 LIFETIME FINANCIAL COST FACED BY HOUSEHOLDS, BY CANCER, $ PER PERSON
$0
$20,000
$40,000
$60,000
$80,000
$100,000
$120,000
$140,000
$160,000
Melanoma Colorectal Prostate Breast Lung Non-Hodgkin�s
Lymphoma
Leukaemia Bladder Kidney Stomach,Liver and
Pancreatic
Uterine,Ovarian
andCervical
Brain Head, Neckand
Thyroid
Other
FIGURE 9-13 OUT-OF-POCKET EXPENSES FACED BY HOUSEHOLDS, BY CANCER, $ PER PERSON
$0
$2,000
$4,000
$6,000
$8,000
$10,000
$12,000
$14,000
$16,000
Melanoma Colorectal Prostate Breast Lung Non-Hodgkin�s
Lymphoma
Leukaemia Bladder Kidney Stomach,Liver and
Pancreatic
Uterine,Ovarian
andCervical
Brain Head, Neckand Thyroid
Other
Other Financial CostsHealth Costs

Cost of Cancer in NSW
134
FIGURE 9-14 INTO-POCKET COSTS FACED BY HOUSEHOLDS, BY CANCER, $ PER PERSON
-$5,000
$0
$5,000
$10,000
$15,000
$20,000
$25,000
$30,000
Melanoma Colorectal Prostate Breast Lung Non-Hodgkin�s
Lymphoma
Leukaemia Bladder Kidney Stomach,Liver and
Pancreatic
Uterine,Ovarian
andCervical
Brain Head, Neckand Thyroid
Other
Temporary AbsenteeismLong-Term EmploymentCarersWelfare
FIGURE 9-15 PREMATURE MORTALITY PRODUCTIVITY COSTS FACED BY HOUSEHOLDS, BY
CANCER, $ PER PERSON
$0
$20,000
$40,000
$60,000
$80,000
$100,000
$120,000
$140,000
Melanoma Colorectal Prostate Breast Lung Non-Hodgkin�sLymphoma
Leukaemia Bladder Kidney Stomach,Liver and
Pancreatic
Uterine,Ovarian and
Cervical
Brain Head, Neckand Thyroid
Other
Premature Mortality
These costs vary significantly by age and sex, with costs after 65 falling to below $20,000 for even the most costly cancers.

Cost of Cancer in NSW
135
TABLE 9-9 LIFETIME FINANCIAL COST FACED BY HOUSEHOLDS, BY AGE/SEX, $ PER PERSON
Males Females 0-14 15-64 65+ 0-14 15-64 65+
Melanoma 39,400 34,300 5,300 25,700 13,200 5,200 Colorectal 214,300 132,700 11,600 102,800 56,200 9,600 Prostate - 62,000 15,300 - - - Breast - 89,800 10,200 - 40,300 9,100 Lung 283,000 203,600 14,600 114,500 98,400 12,000 Non-Hodgkin�s Lymphoma 246,200 190,000 12,900 143,700 67,900 11,700 Leukaemia 325,700 272,100 14,200 172,200 124,300 11,400 Bladder 273,200 99,400 10,800 - 43,400 11,500 Kidney 188,300 133,700 11,100 99,600 50,600 8,900 Stomach, Liver and Pancreatic 579,700 245,000 13,500 219,000 111,700 10,300 Uterine, Ovarian and Cervical - - - 124,700 56,700 9,800 Brain 449,100 292,500 17,500 268,900 136,700 13,800 Head, Neck and Thyroid 307,900 192,100 14,000 109,700 51,000 9,200 Other 235,500 181,100 16,300 124,900 63,400 15,700 All Cancers 308,500 137,400 13,400 154,000 51,500 10,600
Note that these are expected lifetime costs if a person was diagnosed with cancer � many childhood cancers are rare and so these costs would not always be incurred (for example about one child per year is diagnosed with lung cancer in NSW).
FIGURE 9-16 LIFETIME FINANCIAL COST FACED BY HOUSEHOLDS, BY AGE/SEX ($ PER PERSON)
$0
$50,000
$100,000
$150,000
$200,000
$250,000
$300,000
$350,000
0-4 10-14 20-24 30-34 40-44 50-54 60-64 70-74 80-84 90+
MalesFemales
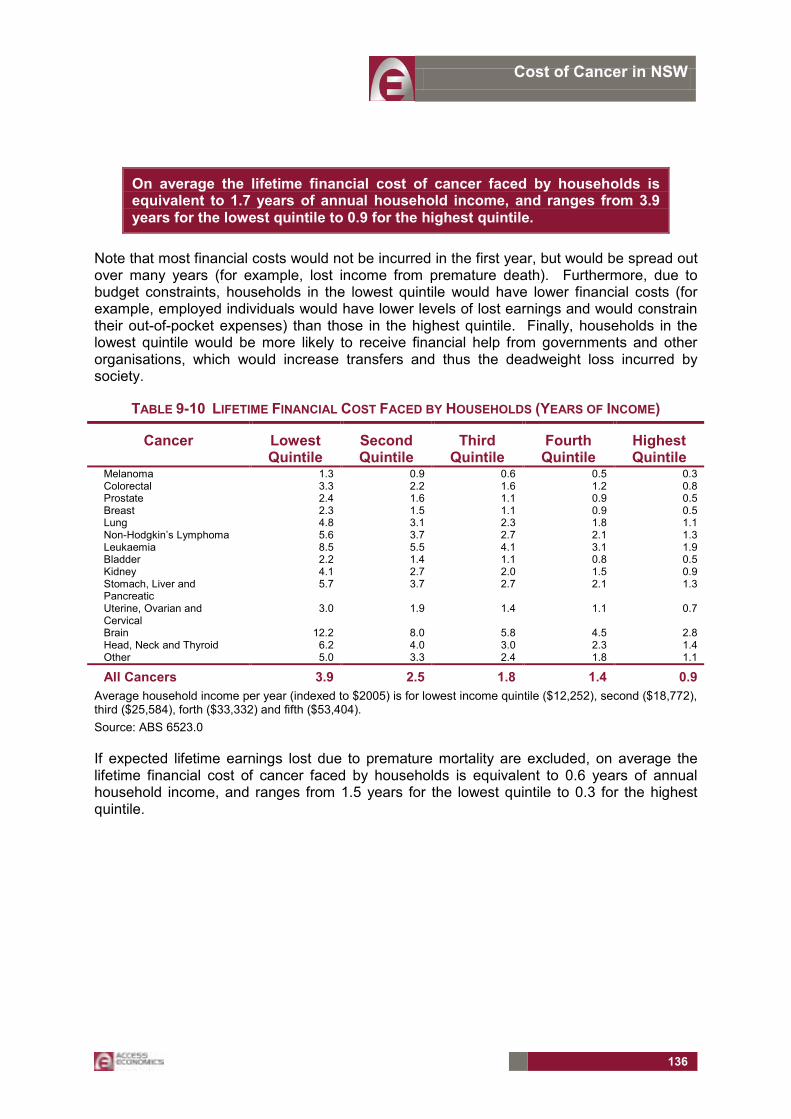
Cost of Cancer in NSW
136
On average the lifetime financial cost of cancer faced by households is equivalent to 1.7 years of annual household income, and ranges from 3.9 years for the lowest quintile to 0.9 for the highest quintile.
Note that most financial costs would not be incurred in the first year, but would be spread out over many years (for example, lost income from premature death). Furthermore, due to budget constraints, households in the lowest quintile would have lower financial costs (for example, employed individuals would have lower levels of lost earnings and would constrain their out-of-pocket expenses) than those in the highest quintile. Finally, households in the lowest quintile would be more likely to receive financial help from governments and other organisations, which would increase transfers and thus the deadweight loss incurred by society.
TABLE 9-10 LIFETIME FINANCIAL COST FACED BY HOUSEHOLDS (YEARS OF INCOME)
Cancer Lowest Quintile
Second Quintile
Third Quintile
Fourth Quintile
Highest Quintile
Melanoma 1.3 0.9 0.6 0.5 0.3 Colorectal 3.3 2.2 1.6 1.2 0.8 Prostate 2.4 1.6 1.1 0.9 0.5 Breast 2.3 1.5 1.1 0.9 0.5 Lung 4.8 3.1 2.3 1.8 1.1 Non-Hodgkin�s Lymphoma 5.6 3.7 2.7 2.1 1.3 Leukaemia 8.5 5.5 4.1 3.1 1.9 Bladder 2.2 1.4 1.1 0.8 0.5 Kidney 4.1 2.7 2.0 1.5 0.9 Stomach, Liver and Pancreatic
5.7 3.7 2.7 2.1 1.3
Uterine, Ovarian and Cervical
3.0 1.9 1.4 1.1 0.7
Brain 12.2 8.0 5.8 4.5 2.8 Head, Neck and Thyroid 6.2 4.0 3.0 2.3 1.4 Other 5.0 3.3 2.4 1.8 1.1
All Cancers 3.9 2.5 1.8 1.4 0.9Average household income per year (indexed to $2005) is for lowest income quintile ($12,252), second ($18,772), third ($25,584), forth ($33,332) and fifth ($53,404). Source: ABS 6523.0
If expected lifetime earnings lost due to premature mortality are excluded, on average the lifetime financial cost of cancer faced by households is equivalent to 0.6 years of annual household income, and ranges from 1.5 years for the lowest quintile to 0.3 for the highest quintile.

Cost of Cancer in NSW
137
TABLE 9-11 LIFETIME FINANCIAL COST (EXCL. PREMATURE MORTALITY PRODUCTIVITY COSTS) FACED BY HOUSEHOLDS (YEARS OF INCOME)
Cancer Lowest Quintile
Second Quintile
Third Quintile
Fourth Quintile
Highest Quintile
Melanoma 0.3 0.2 0.1 0.1 0.1 Colorectal 1.3 0.9 0.6 0.5 0.3 Prostate 1.8 1.2 0.9 0.7 0.4 Breast 1.1 0.7 0.5 0.4 0.3 Lung 1.1 0.7 0.5 0.4 0.3 Non-Hodgkin�s Lymphoma 1.9 1.2 0.9 0.7 0.4 Leukaemia 2.7 1.8 1.3 1.0 0.6 Bladder 1.2 0.8 0.6 0.5 0.3 Kidney 1.6 1.1 0.8 0.6 0.4 Stomach, Liver and Pancreatic
1.1 0.7 0.5 0.4 0.3
Uterine, Ovarian and Cervical
1.1 0.7 0.5 0.4 0.3
Brain 2.8 1.9 1.4 1.0 0.7 Head, Neck and Thyroid 2.1 1.4 1.0 0.8 0.5 Other 2.3 1.5 1.1 0.8 0.5
All Cancers 1.5 1.0 0.7 0.5 0.3Average household income per year (indexed to $2005) is for lowest income quintile ($12,252), second ($18,772), third ($25,584), forth ($33,332) and fifth ($53,404). Source: ABS 6523.0
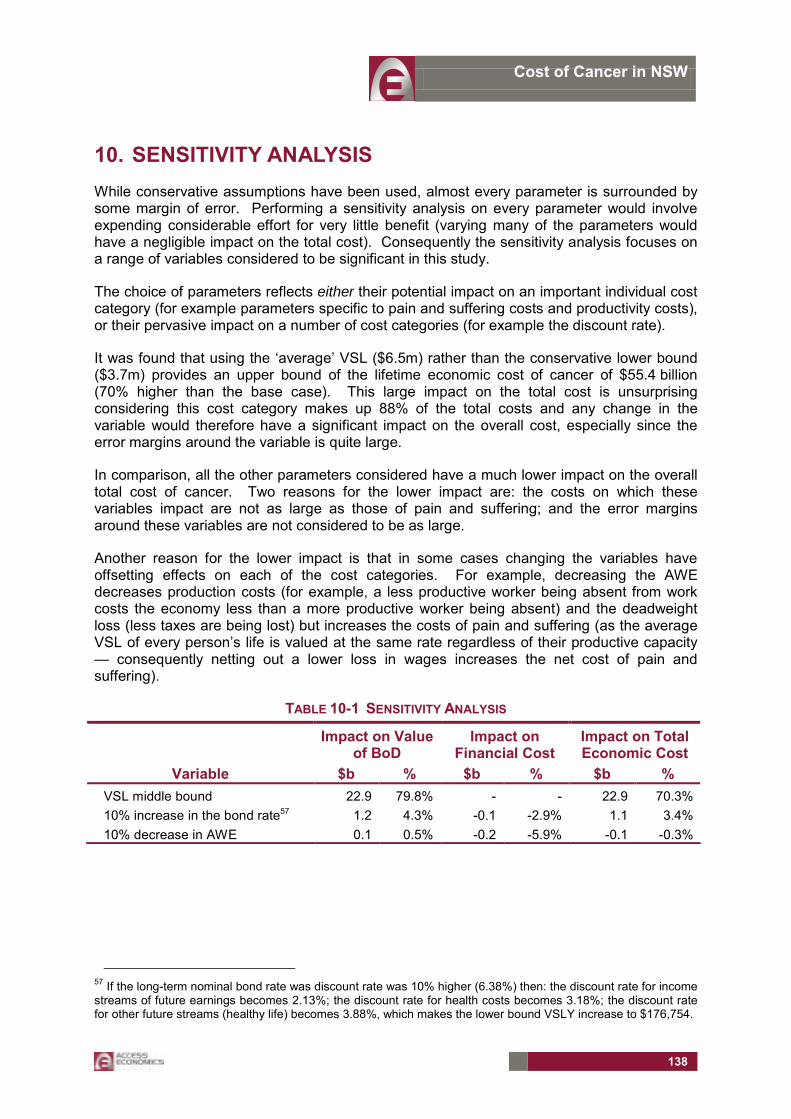
Cost of Cancer in NSW
138
10. SENSITIVITY ANALYSIS While conservative assumptions have been used, almost every parameter is surrounded by some margin of error. Performing a sensitivity analysis on every parameter would involve expending considerable effort for very little benefit (varying many of the parameters would have a negligible impact on the total cost). Consequently the sensitivity analysis focuses on a range of variables considered to be significant in this study.
The choice of parameters reflects either their potential impact on an important individual cost category (for example parameters specific to pain and suffering costs and productivity costs), or their pervasive impact on a number of cost categories (for example the discount rate).
It was found that using the �average� VSL ($6.5m) rather than the conservative lower bound ($3.7m) provides an upper bound of the lifetime economic cost of cancer of $55.4 billion (70% higher than the base case). This large impact on the total cost is unsurprising considering this cost category makes up 88% of the total costs and any change in the variable would therefore have a significant impact on the overall cost, especially since the error margins around the variable is quite large.
In comparison, all the other parameters considered have a much lower impact on the overall total cost of cancer. Two reasons for the lower impact are: the costs on which these variables impact are not as large as those of pain and suffering; and the error margins around these variables are not considered to be as large.
Another reason for the lower impact is that in some cases changing the variables have offsetting effects on each of the cost categories. For example, decreasing the AWE decreases production costs (for example, a less productive worker being absent from work costs the economy less than a more productive worker being absent) and the deadweight loss (less taxes are being lost) but increases the costs of pain and suffering (as the average VSL of every person�s life is valued at the same rate regardless of their productive capacity � consequently netting out a lower loss in wages increases the net cost of pain and suffering).
TABLE 10-1 SENSITIVITY ANALYSIS
Impact on Value of BoD
Impact on Financial Cost
Impact on Total Economic Cost
Variable $b % $b % $b % VSL middle bound 22.9 79.8% - - 22.9 70.3%10% increase in the bond rate57 1.2 4.3% -0.1 -2.9% 1.1 3.4%10% decrease in AWE 0.1 0.5% -0.2 -5.9% -0.1 -0.3%
57 If the long-term nominal bond rate was discount rate was 10% higher (6.38%) then: the discount rate for income streams of future earnings becomes 2.13%; the discount rate for health costs becomes 3.18%; the discount rate for other future streams (healthy life) becomes 3.88%, which makes the lower bound VSLY increase to $176,754.