3-degree freedom network model to support release
TRANSCRIPT

International Journal of Electrical Electronics & Computer Science Engineering
Volume 4, Issue 5 (October, 2017) | E-ISSN : 2348-2273 | P-ISSN : 2454-1222
Available Online at www.ijeecse.com
27
3-Degree Freedom Network Model to Support Release Management Using
Efficient Requirements Engineering
Indranil Nath Chartered Fellow, BCS, The Chartered Institute for IT, London, United Kingdom
Abstract: This paper will discuss the multi degree-of-freedom
Software Engineering model, underlying formalisms of
software life - cycle and software metrics that will form the
basis of the Software Re-Engineering approach, underlying
formalisms of Release Management using efficient
Requirement Engineering, tying it all together, An
application of software re-engineering approach, research
results, followed by conclusions.
Keywords: Release Planning, Software Economics, Software
Requirements Management, Software Engineering, Software
Development Process, Requirements Specification Lifecycle
Model.
I. INTRODUCTION
Developing software product line [1] face complex
challenges when determining requirements for
upcoming releases. Often the wish list of requirements
extends the capacity of available resources,
requirements may not be unambiguous, they may be
difficult to prioritize, etc. As a matter of fact, many
aspects influence the definition of an optimal set of
requirements for a next release. Several scholars have
presented lists of such aspects including: importance or
business value, personal preference of certain customers
and other stakeholders, penalty if not developed, cost of
development in man days, development lead-time,
requirement volatility, requirement dependencies,
ability to reuse, and requirements quality.
II. RELEASE RE ENGINEERING USING
REQUIRMENTS ANALYSIS
For software vendors, the process to determine the
requirements for the next release of a software product
is often difficult. In this paper the mathematical
formalization of release composition with a
corresponding optimization tool that aims to support
product managers and development project managers
during release planning is discussed. The tool is based
on integer linear programming and assumes that an
optimal set of requirements is the set with maximum
projected revenue against available resources in a given
time period. The input for the optimization is twofold.
Input data like the list of candidate requirements,
estimated revenue and required team resources per
requirement, whether or not a requirement is mandatory,
comprise the first type of input. Secondly, several
managerial steering mechanisms provide flexibility in
the optimization environment: SE-CUBE (SE3) View of
Requirements, team composition, permitting of team
transfers, extension of deadlines, and hiring external
resources. Through experiments based on real-life data
make a sound case for the applicability of this
methodology.
III. THE SE-CUBE MODEL FOR SOFTWARE
ENGINEERING (SE3)
The development of commercial software is managed
by splitting it up into suitable logical units in order to
divide the various development tasks into logical units
of manageable size, example, the Software Process
[2][3]; The System’s logical views and The Software
Architecture [4]. The importance of all three of these
domains of concern is reflected by the numerous
approaches, models, and specification techniques
currently being available and worked on by research
groups, and by the increasing number of specific tools
offering support to commercial software developers.
Present Software Engineering literature addresses only a
“partial” or one-dimensional model that organizes real
life software development only in a limited way,
because constraints and parameters relating different
domains of concern (dimensions in this case) are not
modelled universally, and hence, can’t be easily
enforced. Examples of such constraints, crossing
domains of concern are, “Which views are necessary to
be specified for a certain component, and which are
not? ” or “When (in which phase) has a certain
component to be specified/introduced (i.e., from scratch,
or later)?” To cope with these requirements in a
universal software engineering models, this paper
concentrates on the integration of the different domains
of concern into one comprehensive, multi-degrees-of-
freedom model. The three domains of concern
introduced in the introduction are considered as
especially important for system development, and used
representatively as fundamental structuring mechanism
for the construction of the multidimensional model.
Consequently, modelling the isolated areas of concern
will not be a purpose of its own anymore, but will
become modelling the dimensions of the multi-degrees-
of-freedom model [5]. As it presently limit to three
“degrees-of-freedom”, the resulting model will be called
SE-CUBE Model of Software Engineering (SE3) in the
rest of the paper. The phases of the process, the
components of the architecture, and the perspectives of
the view dimension are the constituents of the three
degrees-of-freedom, i.e., they are the “building blocks”
for the partial models that capture the three domains of
concern involved. Of course, software engineering
comprises many more domains of concern, but main

International Journal of Electrical Electronics & Computer Science Engineering
Volume 4, Issue 5 (October, 2017) | E-ISSN : 2348-2273 | P-ISSN : 2454-1222
Available Online at www.ijeecse.com
28
purpose of SE-CUBE is to investigate integration issues
of domains of concern in general, and on a formal basis.
Other domains of concern can be important or even
crucial for certain systems and in certain situations, too
(e.g., resource management, configuration management),
but they do not contribute in SE-CUBE to the course of
a project in a structuring way. Where important
information concerning other “degrees-of-freedom” of
software development, such as, commitment of people
to tasks, access rights to documents, and other project
related information will also be included in the SE-
CUBE, in a subordinate level, and will not contribute to
the structure of SE-CUBE models.
Fig. 1. 3-Degree of Freedom Show Software
Engineering Components SE-CUBE
A three-degree-of-freedom network is used to support
SE3. Each node of the network represents a logical
component to be called software engineering component,
which contains information about a (small) portion of
the actual software development. Each software
engineering component is identified by a unique
combination of constituents of each of the dimensions
of the SE3. The combinations of constituents determine,
coordinate of the exact position of the component within
the context of the software development project. Edges,
connecting the nodes of the network, model
relationships and constraints between the components.
Figure 1 illustrates the analogy of the three-degree-of-
freedom network containing related components. The
constituents of the degrees-of-freedom are simplified for
the purpose of clarity. Node X represents the
behavioural view of the interface component in the
analysis phase, while Node Y represents the static
structure of the control component during design.
Between the two nodes, a specific relationship exits,
that models the fact that (the specification of) node X
serves as information source when working on (the
specification of) node Y.
The relationships between the nodes of the network
constrain how (in which order, and under which
circumstances) members of a software development
team can access the software engineering components to
perform the tasks to which they have been committed.
This means that prescribing, identifying, and following
paths through the SE3 network can model the work of
the project team members.
IV. DISCUSSION
A qualitative method was used to conduct a survey
using the two sets of questionnaires - Inspection
Checklist for Software Requirements Specification and
Impact Analysis Checklist for Requirements Changes,
to clearly understand the organizational completeness,
correctness, quality attributes, and traceability of
requirements. The survey also helped pin point the
implication of changes in requirements changes, the
system elements that affected by the proposed changes
and effort estimation for the requirement changes. The
root cause of incidents or defects over the software
lifecycle phase was understood and documented.
Defect/Incident Root Cause Code Listing provided the
details of the root cause of the incident. The phase
where the root causes was found and who the owners
were in the lifecycle were carefully studied and
documented. Few of the major root causes that was
identified are as follows
1. Presented Requirements was incorrect, submitted
subject/items to input/output was incorrect
2. Inaccurate impact analysis
3. Inaccurate define design
4. Inappropriate DB, File, Screen, Components
5. Incorrect Coding
6. Lack of verification
7. Lack of test cases of system interface test
8. Lack of migration test cases
9. Incorrect recovery operations
10. Incorrect release activities
Table I. Defects Due to Requirements Management
Miss in a Year
The complete list of Defect Rate by incident - Root
Cause, Effort, Turn-Around Time and Cost, this data
was collected over a period of 9 months. The raw data
International Journal of Electrical Electronics & Computer Science Engineering
Volume 4, Issue 5 (October, 2017) | E-ISSN : 2348-2273 | P-ISSN : 2454-1222
Available Online at www.ijeecse.com
29
collected here is the basis for all analysis and
extrapolation done during the research for this paper.
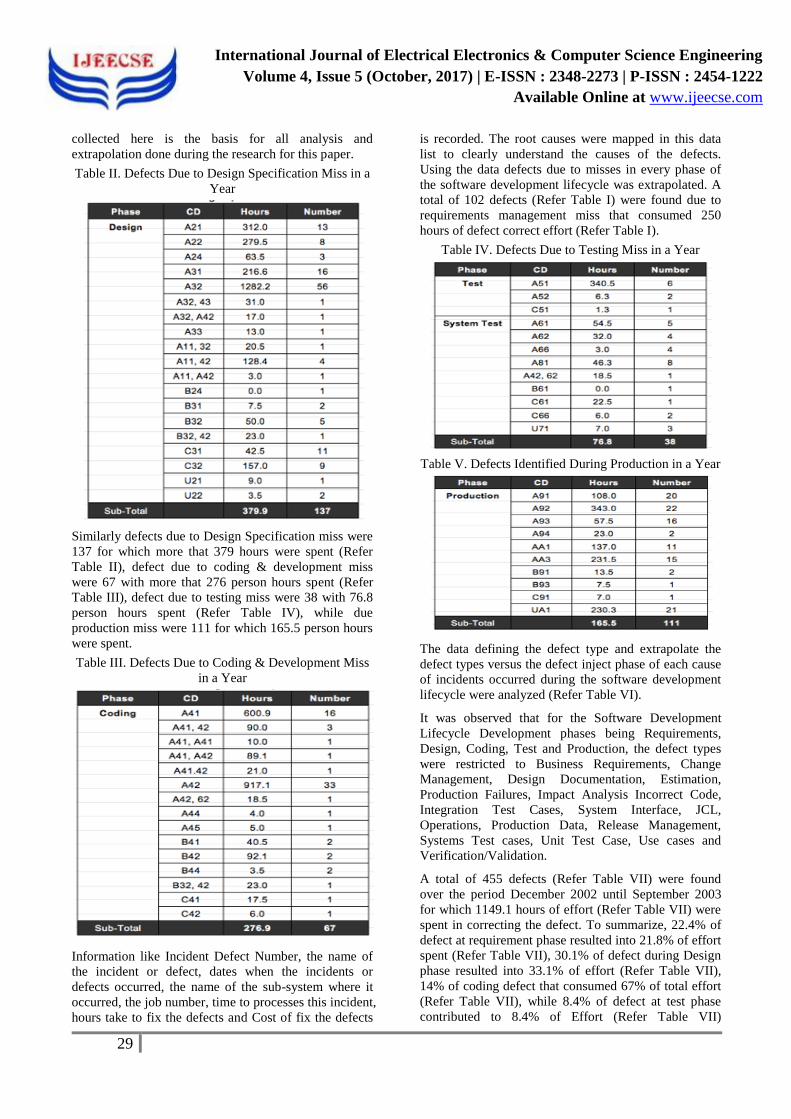
Table II. Defects Due to Design Specification Miss in a
Year
Similarly defects due to Design Specification miss were
137 for which more that 379 hours were spent (Refer
Table II), defect due to coding & development miss
were 67 with more that 276 person hours spent (Refer
Table III), defect due to testing miss were 38 with 76.8
person hours spent (Refer Table IV), while due
production miss were 111 for which 165.5 person hours
were spent.
Table III. Defects Due to Coding & Development Miss
in a Year
Information like Incident Defect Number, the name of
the incident or defect, dates when the incidents or
defects occurred, the name of the sub-system where it
occurred, the job number, time to processes this incident,
hours take to fix the defects and Cost of fix the defects
is recorded. The root causes were mapped in this data
list to clearly understand the causes of the defects.
Using the data defects due to misses in every phase of
the software development lifecycle was extrapolated. A
total of 102 defects (Refer Table I) were found due to
requirements management miss that consumed 250
hours of defect correct effort (Refer Table I).
Table IV. Defects Due to Testing Miss in a Year
Table V. Defects Identified During Production in a Year
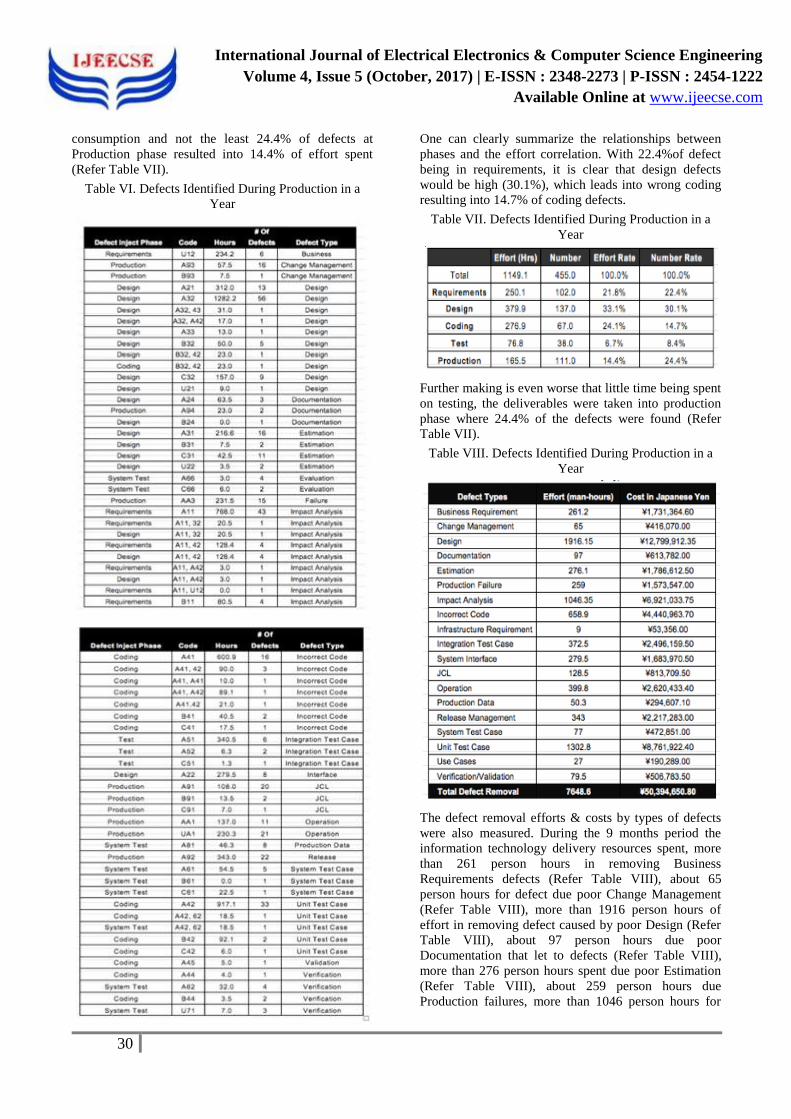
The data defining the defect type and extrapolate the
defect types versus the defect inject phase of each cause
of incidents occurred during the software development
lifecycle were analyzed (Refer Table VI).
It was observed that for the Software Development
Lifecycle Development phases being Requirements,
Design, Coding, Test and Production, the defect types
were restricted to Business Requirements, Change
Management, Design Documentation, Estimation,
Production Failures, Impact Analysis Incorrect Code,
Integration Test Cases, System Interface, JCL,
Operations, Production Data, Release Management,
Systems Test cases, Unit Test Case, Use cases and
Verification/Validation.
A total of 455 defects (Refer Table VII) were found
over the period December 2002 until September 2003
for which 1149.1 hours of effort (Refer Table VII) were
spent in correcting the defect. To summarize, 22.4% of
defect at requirement phase resulted into 21.8% of effort
spent (Refer Table VII), 30.1% of defect during Design
phase resulted into 33.1% of effort (Refer Table VII),
14% of coding defect that consumed 67% of total effort
(Refer Table VII), while 8.4% of defect at test phase
contributed to 8.4% of Effort (Refer Table VII)
International Journal of Electrical Electronics & Computer Science Engineering
Volume 4, Issue 5 (October, 2017) | E-ISSN : 2348-2273 | P-ISSN : 2454-1222
Available Online at www.ijeecse.com
30
consumption and not the least 24.4% of defects at
Production phase resulted into 14.4% of effort spent
(Refer Table VII).
Table VI. Defects Identified During Production in a
Year
One can clearly summarize the relationships between
phases and the effort correlation. With 22.4%of defect
being in requirements, it is clear that design defects
would be high (30.1%), which leads into wrong coding
resulting into 14.7% of coding defects.
Table VII. Defects Identified During Production in a
Year
Further making is even worse that little time being spent
on testing, the deliverables were taken into production
phase where 24.4% of the defects were found (Refer
Table VII).
Table VIII. Defects Identified During Production in a
Year
The defect removal efforts & costs by types of defects
were also measured. During the 9 months period the
information technology delivery resources spent, more
than 261 person hours in removing Business
Requirements defects (Refer Table VIII), about 65
person hours for defect due poor Change Management
(Refer Table VIII), more than 1916 person hours of
effort in removing defect caused by poor Design (Refer
Table VIII), about 97 person hours due poor
Documentation that let to defects (Refer Table VIII),
more than 276 person hours spent due poor Estimation
(Refer Table VIII), about 259 person hours due
Production failures, more than 1046 person hours for

International Journal of Electrical Electronics & Computer Science Engineering
Volume 4, Issue 5 (October, 2017) | E-ISSN : 2348-2273 | P-ISSN : 2454-1222
Available Online at www.ijeecse.com
31
defects removal due poor impact analysis during the
requirement phase (Refer Table VIII).
All these resulted into poor design which resulted into
spending more than 658 person hours to remove defects
caused due Incorrect Code. More than 372 person hours
were spent to remove defects caused by poor Integration
Test, while more than 279 hours spent due poor design
of system interfaces (Refer Table VIII). It was also
understood that more than 1302 hours were spent
correcting defects caused by lack of good Unit Test
Cases (Refer Table VIII). The company spent roughly
$500,000 (United States Dollars) to fix a total of 455
defects, that worth 7648.6 man-hours (Refer Table VIII).
The Level 3 Capability Maturity define that 20% of the
defect should be detected as one crosses the coding
stage, while 80% of the defects should be detected until
the System Test Phase to achieve a Process Change
Base of Level 3. Where as for Level 5 (highest level of
the CMMI) defines that 85% of the defects should be
detected until the Functional Test Phase (Unit Test
Phase).
A 3-degree-of-freedom network that is introduced
earlier is a model to support requirements management
within the software process along with a mathematical
model of release management, which incorporates
progressive software release with requirements being
added or changed were mapped for the sake of analysis
in this section.
Each node of the 3-D network represented the logical
component, which contains information about a (small)
portion of the actual software development along with
the requirements for the work-products within that
portion are mapped. Each component is identified by a
unique combination of constituents of each of the
dimensions of the 3D model.
To plot the 3D model using the collected data, the
number of defects caused during each of the Software
Development Life Cycle phases (Requirements
Definition, Design, Coding, Test and Production) was
tabled. This was tabled below the Development Process
Column, which is one of the axes to the 3-degree-
freedom network (Refer Table IX). Defect/Incident
Root Cause Code List helped extrapolate the defects
types by Systems components (Repository, Process,
Control, Interface) and the Systems Views
(Functionality, Behaviour and Functionality). Number
of Defect due each of the axes were extrapolated and
tabled (Refer Table IX).
Table IX. 3-Degree of Freedom Network (SE-CUBE)
Table X. Requirements Management Cost (#s: 74
Stakeholders were Interviewed to Extrapolate
Stakeholder Priority)

International Journal of Electrical Electronics & Computer Science Engineering
Volume 4, Issue 5 (October, 2017) | E-ISSN : 2348-2273 | P-ISSN : 2454-1222
Available Online at www.ijeecse.com
32
Table XI. Defect/Incident Root Cause Code Listing
A three-dimensional graph representing the Software
Engineering three-degree-of free Network was plotted
for the three axes (Refer Fig 2) to help learn the
software release management strategy using SE-CUBE.
The CD numbers A11, A13, U21, etc. was to reflect the
type of defect that occurred during the phases. Careful
study of the mapping could help optimize the release
management efforts model to support requirement
management which can be integrated with a release-
planning approach to achieve innovative way to capture,
control, and evolve the user requirements or releases in
an evolutionary life-cycle process.
Requirements management considered in this way could
be unique to each organization and could be considered
as a corporate asset. Hence a study on the 3-Degree-of-
Freedom network to understand on what constraints the
developer in the company assessed the software
engineering components to perform the tasks to which
they had committed and show how requirement
development and management could be integrated with
a release-planning approach which could be an
innovative way to capture, control and evolve the user
requirements. This was the underlying formalism of
Release Management concept.
Further, the Requirements Management Cost due each
types of defects were calculated by determining the
Weight of the Requirements Management or
Requirements Dependencies (D) against each type of
defects occurred in the software development lifecycle.
Also the Stakeholder priority (S) was determined by
interviewing 74 stakeholders from different parts of the
company’s’ businesses. The Defect Removal Efficiency
was also calculated. All were tabulated in Table X.
Fig. 2. 3-Degree of Freedom Network (SE-CUBE)
A Pearson Correlation test was done to determine if
there was any kind of relationship between the Effort
Constraints incurred during the software development
cycle and the cost of Requirements Management. The
test proved (refer Fig 3) the two variables Effort
Constraints and Requirements Management Cost during
the software development lifecycle had some degree of
positive correlation as we notice the cluster in Figure 3.
In this case the sample correlation coefficient of 0.98
implies a relatively strong positive relationship between
RMC and Effort Constraints.

International Journal of Electrical Electronics & Computer Science Engineering
Volume 4, Issue 5 (October, 2017) | E-ISSN : 2348-2273 | P-ISSN : 2454-1222
Available Online at www.ijeecse.com
33
Finally a test to understand the sensitivity of
Requirements over the Requirements Management Cost
was studied. To do this the Solver option in EXCEL
was used to solve linear and nonlinear optimization
problems with certain constraints placed on the decision
variables. Up to 17 decision variables, 6 explicit
constraints in terms of Stakeholder priority (where 74
stakeholders were interviewed to extrapolate
stakeholder priority) were used to solve the problem
with an objective to maximize the Defect Removal
Efficiency (DRE) while minimizing the Requirements
Management Cost (RMC) and minimizing the number
of defects (n). Refer to Table X and Table XI for three
Linear Models.
Fig. 3. Pearson Correlation: Effort Constraints vs. RM
Cost
The LPP performed as a part of this paper provided a
more convincing argument to support this paper. The
LPP formulated under the following objective functions
and constraint conditions:
Maximizing Defect Removal Efficiency
Minimizing Requirement Management Cost
Minimize Defects
The Objective functions were designed to support the
Release Management, a derived metrics as a
measurement to support efficient requirements analysis
and release management [6], for efficient requirement
analysis as described. For a software release, the
stakeholder prioritization S is formulated as:
Set of stakeholder: 𝑆 = {𝑠1 , 𝑠2 , …… , 𝑠𝑚 }
Weight of each stakeholder 𝑠𝑘 ∈ 𝑆: 𝑤(𝑠𝑘)
Each stakeholder S assigns a priority to the situation that
ri is assigned to the option 𝑘 ∶ 𝑃(𝑠, 𝑟 𝑖 , 𝑘)
Thus, in the evolutionary life cycle, a software release is
defined as:
Release ℛ = 𝑓(ℛ, 𝐶, 𝐷, Ω, 𝑆)
Where
ℛ = Set of requirements
C = Assigned ℛ into an evolutionary life cycle release
categories
D = Requirement Dependencies and requirement
precedence within the domain ℛ
Ω = Effort constraints, and
S = Stakeholders Prioritization
Which is considered as a weightage that is given by the
stakeholder on the requirements to be dealt with, at the
time of progressive software releases.
The total numbers of stakeholders were 74 and the
number of stakeholder that voted for certain
Requirements in a certain Release was considered as
constraints, and answer report, sensitivity report and
limit report were generated.
Table XIII. Linear Models for Maximizing DRE,
Minimizing RMC and Minimizing Defect
The interpretation of the data and the interpretation of
the findings are described in Section V.
International Journal of Electrical Electronics & Computer Science Engineering
Volume 4, Issue 5 (October, 2017) | E-ISSN : 2348-2273 | P-ISSN : 2454-1222
Available Online at www.ijeecse.com
34
V. SIGNIFICANT FINDINGS
This research has focused on investing how modelling
areas of concern of software engineering, from the point
of Requirement Analysis, from a conceptual approach
that could enhance software development and assist in
re-engineering them into a comprehensive software
engineering framework which can be adapted and used
for wide range of software development projects.
The research studied the representation; capture learning,
re-use and re-engineering of domain specific software
design and requirements analysis knowledge including
the task environment in form of Requirements, Schedule,
Resources, Skills, Technology and finally Release Plans
that of a given software engineering problem in order to
help engineers and developers to formulate the goals
and constraints. The research has exhibited the multi-
degree-freedom Software Engineering Model (Software
Engineering CUBE), underlying formalisms of software
life cycle and software metric as a derived metric to
allow efficient Requirements Analysis and bi-
directional requirements traceability for Release Re-
engineering.
On careful examination it can understand the results of
the LPP solver and interpret these results to show how it
confirms to this projected research output. As stated
earlier the objective here was always to maximize the
Defect Removal Efficiency (DRE) while minimizing the
Requirements Management Cost (RMC) and
minimizing the number of defects (n). Referring to
Table XII (DRE formulation) where an equal weight is
distributed to each stakeholder (that is all linear
constraint coefficients defined as 1) it can interpret the
results in as “Change Management’ having the most
significant effect is Defect Removal Efficiency.
This simply means that when normalizing the effect of
all other factors, that is normalizing the value of all
other Decision Variables and the data presented, one
can safely say that there is a direct and significant
correlation in Change Management to Defect
proliferation in each Software Release, which leads to
believe that Requirement Management can be
significantly improved if matured Change Management
procedures are strictly followed while Release
Management continues to have exactly same
Stakeholder priorities. As are minimizing the Defects,
while Minimizing the Requirement Management Costs,
showed the final values of these as 0.
It also showed the sensitivity and other criteria for the
LPP solver results and from these we can safely
interpret Change Management is the most significant
process area while implementing efficient Requirement
Analysis. The data presented is of a software
development instant for a large financial protection
company but that it is representative enough to model
real life Requirement Analysis and make generalized
interpretations. Also “Weight on RM (D)” is a
generalized weight-age. This could change on different
software project types and software project domains. An
interesting line of further investigation would be to
change these RM significance weights (D) and re-run
the solver.
Also it would be interesting to change the weight on
each stakeholder priority adding another dimension to
the problemwhere executive decision-making power of
each stakeholder could be also reflected within the
problem formulation.
VI. CONCLUSIONS
This research introduced the 3-Degree-Freedom
network model to support Requirements Management
with in the software process and the mathematical
model of Release Management. Although each node of
the Three-Degree network as logical components as
work-products were mapped there is a room for further
research and analysis of static and dynamic structure of
the Software Engineering 3-Degree-Of-Freedom and
study the pattern evolution out of it.
As mentioned further study of Requirements
Management significance while change the Weight on
Requirements Management by each stakeholder priority
could be another area of further research and pattern
investigation. This could also include further study of
coefficient relation to defects
VII. REFERENCES
[1] Klaus Pohl, “Requirements Engineering-
Fundamental, Priciples, Techniques”, Part VIII-37
Reuirements Engineering for Software Product Line.
[2] Roger S. Pressman, “Software Enginnering-A
Practioner’s Approach”, Software Enginnering
Series, Chapter 2, The Process.
[3] Pankaj Jalote, “CMM in Practice – Processes for
Executing Softwre Projects at Infosys”, chapter 5-
Process Database and Process Capability Baseline.
[4] Mark Richards, “Software Architecture Patterns-
Understanding Common Architecture Patterns and
When to Use them”. O’Reilly Books.
[5] I. Nath, S Kundu, “Is Software Requirements a
Corporate Asset?” Fig.2. Degrees of Freedom in the
Software Engineering Components of SE-CUBE,
IEEE International Engineering Maangement
Conference Proceedigs, Innovation and
Entrepreneurship for Sustainable Development,
Volune 1, 2004.
[6] I. Nath, “A Derived Metrics as a Measurement to
Support Efficient Requirements Analysis and
Release Management”, Advances in Science,
Technology and Engineering Systems Journal Vol 2.
No. 3, 36-40 (2017), ASTESJ ISSN:2415-669.