3-d numerical simulation of particle concentration effect ... · pdf file3-d numerical...
TRANSCRIPT

Proc. ESA Annual Meeting on Electrostatics 2010,Paper A4
3-D Numerical Simulation of Particle Concentration Effect on a Single-Wire ESP Performance for Collecting Poly-dispersed
Particles
N. Farnoosh, K. Adamiak and G. S. P. Castle
Dept. of Electrical and Computer Engineering
University of Western Ontario
phone: (1) 519-661-2111(83758)
e-mail: [email protected], [email protected], [email protected]
Abstract—In this paper a simple one stage wire-plate electrostatic precipitator is analyzed to predict particle transport and charging, and airflow
patterns under the influence of EHD and external flows, assuming various particle concentrations. The investigated numerical model includes the
governing equations describing the motion of ions, gas, solid particles and the effect of particle space charge. The complicated mutual interaction
mechanisms between the three coexisting fields of gas flow, particle trajectories and electrostatic field, which affect an industrial ESP process, have
been implemented using the User Defined Functions (UDFs) in commercial FLUENT 6.2 software. The electrostatic field and ionic space charge
density due to corona discharge are computed by numerical solution of Poisson and current continuity equations using a hybrid Finite Element - Flux
Corrected method. The model takes into account the particle space charge density effect on the ionic charge injected from the corona wire. The
airflow equations are solved inside FLUENT using the Finite Volume Method and the turbulence effect is included by using the k-ε model. The
Lagrangian random walk approach was used to determine particle motion, as affected by EHD flows and turbulence effects. This part was performed
with the aid of Discrete Phase Model (DPM) in FLUENT. The performance of the discussed ESP in the removal of particulates and the effect of
different particle concentration on gas flow pattern and corona discharge current was evaluated numerically assuming poly-dispersed particles with
lognormal particle size distribution.
I. INTRODUCTION
Electrostatic precipitators (ESPs) are widely employed in particulate control devices for collecting fly ash emissions in different industrial
processes, in which the overall mass based collection efficiencies should exceed 99%. However, for very small particles the collection efficiency is as low as 70%-80% due to the decreasing charge, carried by particles of smaller size, and the increase of particles mobility. Even though most of the basic phenomena related to particle collection in an ESP are understood, extensive research is still being done on many detailed aspects of electrostatic precipitation, such as electrostatics, fluid dynamics, charging mechanism and particle dynamics.
In order to investigate the fundamental phenomena affecting the ESP process, a basic configuration of the single-stage ESP with two grounded parallel flat electrodes, used as collection plates, and a cylindrical high-voltage wire, suspended in the mid-plane of the duct, is often considered. In this model, the particles are electrically charged in a non-uniform ionized electric field, move in combined electro- and hydrodynamic fields and are separated from the gas under the influence of electrostatic force. Accurate evaluation of fluid mechanics and particle transport parameters, including EHD flow interaction with the turbulent flow field and turbulent particle transport, is necessary to optimize precipitator operation.
The secondary EHD flow is generated due to momentum transfer from moving charged species (ions and particles) and, in addition to primary flow and electric field, it depends on the particle properties such as particle size and concentration. Because of complex stochastic nature of this flow, many contradictory conclusions on its influence on particle collection efficiency were reported in literature. Some researchers believe that the particle collection efficiency could be significantly improved, if the EHD flow were eliminated [1]. In 2000, Soldati showed that the superposition of EHD flows on to the turbulent channel flow significantly modifies the turbulent structure in the wall region resulting in drag reduction, which changes the local behaviour of particles to be separated by an ESP [2]. He also pointed out that EHD flow not only contributes to re-entrainment of particles in the central region of the channel, but also to sweeping the particles to the collecting walls, thus having negligible influence on overall collection efficiency. According to our simulation [3], the EHD flow only had a negligible effect on the collection efficiency of very small particles.
The effect of turbulence on particle motion in precipitators was investigated by many authors, who used various analysis techniques; the two main ones were the Eulerian approach and the Lagrangian, or particle-tracking, approach. Even though some investigators used the Eulerian approach to predict the ESP operation [4], [5], others believed that this calculation method has some deficiencies when it is applied to a single-stage ESP, because the charge acquired on a particle in a non-uniform electric field is determined by the actual, not a mean, path the particle traverses. In [2], Soldati presented the Lagrangian simulation of the turbulent particle dispersion in a plate–plate precipitator using a direct numerical simulation (DNS) algorithm for turbulent flow in a channel. Schmid and Vogel developed a model in which a Lagrangian continuous random walk model was compared with the Eulerian approach for a number of test cases and the strong coupling between the fluid

Proc. ESA Annual Meeting on Electrostatics 2010 2
flow and the electric field was extensively examined [6]. Schmid pointed out that even though the Lagrangian particle tracking is still superior in terms of physical modeling of EHD particulate flows, the Eulerian approach may lead to reasonable results with substantially reduced numerical effort [7]. In 2006, Skodras et al. also made a similar comparison between the two approaches, Eulerian and Lagrangian, showing that the Lagrangian approach is superior, and confirmed the significant turbulence effect on the electric field [8]. In their study, particle trajectories and collection efficiency in turbulent air flow for a range of particle diameter, inlet velocity and applied voltage to corona wires were computed using a 2-D analysis in the commercial FLUENT software. Goo and Lee applied the Lagrangian particle tracking method coupled with the 2-D Monte-Carlo method for simulating particle motion in turbulent flow fields [9]. Afterwards, Lei et al. used the same technique to simulate particle charging and motion in a 3-D ESP model. They also investigated in detail the effect of different forces acting on the particles along their trajectories for a range of particle sizes showing that electric field and drag forces are the key forces in ESP [10].
In addition to mono-disperse particle analysis, some authors investigated poly-dispersed particles movement and collection in ESP. In 1998, Lu and Haung proposed a sectional model approximating the continuous particle size distribution to study the performance of a wire-plate precipitator for collecting poly-dispersed particles. The continuous evolution of particle size distribution along the precipitator and its effect on the ESP performance was quantitatively determined and the model performance was validated by comparing its predictions with the existing experimental data in literature [11]. Kim and Lee designed and built a laboratory-scale eight wire single-stage electrostatic precipitator operating in a wind tunnel for simulating poly-dispersed aerosols [12]. They pointed out that the size distribution of most poly-dispersed aerosols is very close to the lognormal distribution. Later, the same authors developed a modified moment-lognormal model to predict the continuous change of particle size distribution for considering flow convection, electrostatic force and particle diffusion process in a wire-plate ESP [13]. Their proposed model could predict both the overall mass and number efficiencies of poly-dispersed particles without computing the grade efficiency of each size regime. The effects of lognormal particle size distribution parameters such as geometric mean particle radius and standard deviation on the ESP performance were examined and quantitatively determined.
Some authors investigated experimentally the poly-dispersed particle behavior in ESP. In [14], Nobrega et al. experimentally evaluated the performance of a wire-plate ESP in the removal of a wide range of particle diameters and investigated the effect of channel width on precipitator performance. Improvement in particle removal for wider precipitators, but also a larger energy consumption, has been shown. In [15], Ivancsy and Suda considered a special case of poly-dispersed dust load particles, with the same diameter and different relative permittivities. Mizeraczyk and his collaborators carried out PIV measurements to obtain dust-particle flow velocity patterns for various densities of submicron dust, in which the particle size distribution had a maximum at a particle diameter of 0.4µm [16]. According to their results, increasing the dust density not only significantly modifies the mean flow pattern (which is the effect of EHD secondary flow), but also increase the flow turbulence in the downstream ESP region and decreases the average discharge current. In 2009, Adamiak and Atten implemented a 2-D FE-MoC numerical method along with FLUENT software to simulate the gas flow and particle trajectories of submicron particles in a single-wire ESP [17]. The effect of particle concentration on gas flow streamlines, particle distribution pattern and current-voltage characteristics was also investigated. A full coupling between electric field, space charge and flow fields was assumed in their study and both corona discharge and particles charge influence on generating the secondary EHD flow were taken into account. They concluded that the flow pattern is modified by the secondary EHD flow, which strongly depends on the particle concentration.
In the present study, a 3-D numerical simulation is performed to accurately predict the electrostatic field, EHD flow, particle charging and turbulent motion, and their mutual interaction in a simple wire-plate ESP model. Electric field and ionic space charge density distributions are calculated by a FCT-FEM hybrid technique, gas flow by FVM in FLUENT and particle charge and trajectories are computed using DPM in FLUENT, along with the UDFs. Section II briefly describes the mathematical model and numerical method used for calculating the electric field, flow field and particle behavior in the ESP model. The computational model and operating parameters are explained in Section III. The numerical results are discussed in Section IV. The effect of various particle concentrations on the particle trajectories and airflow pattern are demonstrated for poly-dispersed particles with lognormal particle size distribution.
II. MATHEMATICAL MODEL AND COMPUTATIONAL PROCEDURE
The ion charge density and the electric potential distribution inside the ESP model are obtained from the numerical solution of the Poisson and current continuity equations using the FEM-FCT hybrid method. Furthermore, the effects of particulate space charge have been included in the calculation of the electric field and the current density distribution considering two space charge components in the Poisson equation; gaseous ion and the charged particles, which do not have the same spatial distribution [17].
The airflow is assumed to be incompressible and turbulent, and the mass conservation equation and momentum conservation equations are solved using FVM in FLUENT. The k-ε turbulent model was implemented considering 5% turbulent intensity at the inlet. The secondary EHD flow effect due to the electrostatic body forces is taken into account using UDFs in FLUENT. The superposition of the EHD flow on to the turbulent channel flow significantly modifies the turbulence structure in the ESP. However, due to the high ionic drift velocity, the convection current is very small and the moving air does not noticeably modify the electrostatic fields. The solution of the fluid flow equations provides the hydrodynamic conditions for the calculation of particle motion.
Particles in the precipitation channel experience locally varying electric field and ion concentration, so they are simultaneously charged by combined field and diffusion charging mechanisms. The charging rate of the spherical particle by both mechanisms is given in [3]; the particle charge at any instant of time can be calculated by integrating the charging rate with time along the real particle trajectory. The particle motion is coupled with the particle charging process. The particle charge increases along its entire trajectory, which affects the particle movement due to the electrostatic forces. In general, particles are subject to the combined effects of gravitational and the electrostatic body forces, and the forces due to interaction between the fluid and particles along their trajectory. In this simulation the gravitational forces are neglected, but inertial, electrical and air drag forces are considered as the key factors [10]. As a results, the particles trajectories deflect toward the ground plate; a smaller particle size usually leads to a smaller deflection level. However, not all of the particles are collected at the collecting plates -

Proc. ESA Annual Meeting on Electrostatics 2010 3
some manage to escape. In this study, the particles reaching the collecting plates are assumed to be removed and don’t come back to the system again.
The presence of charged particles also contribute to the generation of EHD flow and these patterns are not symmetric with respect to the vertical plane: upstream the corona wire the particle are not fully charged yet, so in this region the electrical body force is much smaller than in the downstream region, where the particles are fully charged and much stronger EHD flow can be expected. The heavy load of particles increases particle charge density, which subsequently change the electrical potential and the ion charge density distribution.
The mathematical model presented in this paper takes into account the strong coupling between all these phenomena to accurately predict the particle motion in the precipitators. The governing equations for calculating the electric potential, charge density, particle charge and motion, airflow, definition of all boundary conditions at the domain boundaries and the complete description of FEM-FCT numerical algorithm could be found in [3].
III. MODEL DESCRIPTION
The 3-D computation model of a simple wire-duct ESP used in this paper is shown in Figure 1; it can be treated as a single element to study a complete model of multi-wire electrostatic precipitator. The computational domain has been discretized by non-uniform grids of 148615 tetrahedral elements and 28520 nodes with fine elements near the corona wire and much larger elements in the inlet and outlet regions. A 30 kV voltage is applied to the corona wire. When the particle charge was neglected, the total discharge current of I≈108μA corresponding to the charge density of 187.0μC/m3 on the corona electrode surface was obtained, which is in a good agreement with the experimental data [17]. Neutral particles are injected in the x direction between the collecting plates at the precipitator entrance with the same initial velocity as the gas stream (1 m/s) and they are charged as they move through the channel and cross the ionic space charge zone. The total particle mass flow rate is expressed in terms of the reference value of c0 = 1.0e-5 kg/s. Moreover, the particles are assumed to be spherical and their density (ρ=998.2 kg/m3) and shape remains unchanged during their motion. Collision and coagulation between particles and particle-particle interaction due to either inertial force or electrostatic repulsion are also neglected.
Figure 1: Three-dimensional computational model of a wire-plate ESP
IV. RESULTS AND DISCUSSION
A wide range of particle sizes (0.3μm-90μm) at the inlet is considered, which gives a good representation of poly-dispersed particle movement in an ESP. Particle size distribution is assumed to be lognormal, as given by Herdan [18]:
]ln2
)ln(lnexp[
)2(ln1)( 2
2
5.0g
g
g
ddd
df
(1)
where
0
1d)( ddf , the geometric mean diameter dg=5.03μm and the geometric standard deviation σg=1.73 (Figure 2), which results from
the measured data [12]. The lognormal size distribution function is divided into 18 fractions and integrated to obtain the mass flow rate percentage of each discrete particle size distribution as shown in Figure 3.
In the poly-dispersed model, the initial particle velocity, mean diameter and mass flow rate values of each fraction are determined separately in the DPM model of FLUENT. The governing equations of particle charge and motion for each fraction are solved simultaneously and the total particle space charge density is obtained by superposition of the charge amount of different fractions. This simulation is carried out for a range of particle concentrations: 0.5c0, 2c0, 10c0 and 20c0 kg/s at the constant primary flow velocity (1m/s) and the corona wire voltage (30 kV).
0.1 m
Wire electrode
Airflow
Collecting plates 0.1 m
0.5 m
Outflow
x z
y

Proc. ESA Annual Meeting on Electrostatics 2010 4
0 10 20 30 40 50 60 705 15 250
0.02
0.04
0.06
0.08
0.1
0.12
0.14
0.16
Particle diameter (m)
Frac
tiona
l num
ber o
f par
ticle
s
0 10 20 30 40 50 60 70 80 905 15 25 35 45 55 650
5
10
15
20
25
30
35
40
Particle diameter (m)M
ass f
low
rate
per
cent
age(
%)
Figure 2: Lognormal particle size distribution. Figure 3: Distribution of mass flow rate versus particle size at inlet.
At the lowest particle concentration (c=0.5c0), the flow velocity contours and the corresponding flow streamlines in a plane placed perpendicularly to the wire electrode at its half length (Figures 4a and 4b) show the laminar pattern, which could be expected from the values of Reynolds and EHD numbers (Re(wire)=63.69, EHD(wire)=4202.77 [19]). The average streamlines in Figure 4b are nearly parallel to the walls with tiny von Karman vortices behind the corona wire which are too small to be visible. It is clearly visible that the particle space charge hardly modifies the airflow pattern in this case and the effect of particle presence on flow turbulence could be ignored.
Figure 4: Air velocity patterns in z=0 symmetry plane of electrostatic precipitator (a) velocity magnitude contours (b) flow streamlines (particle mass flow rate c=0.5c0, corona wire voltage 30kV).
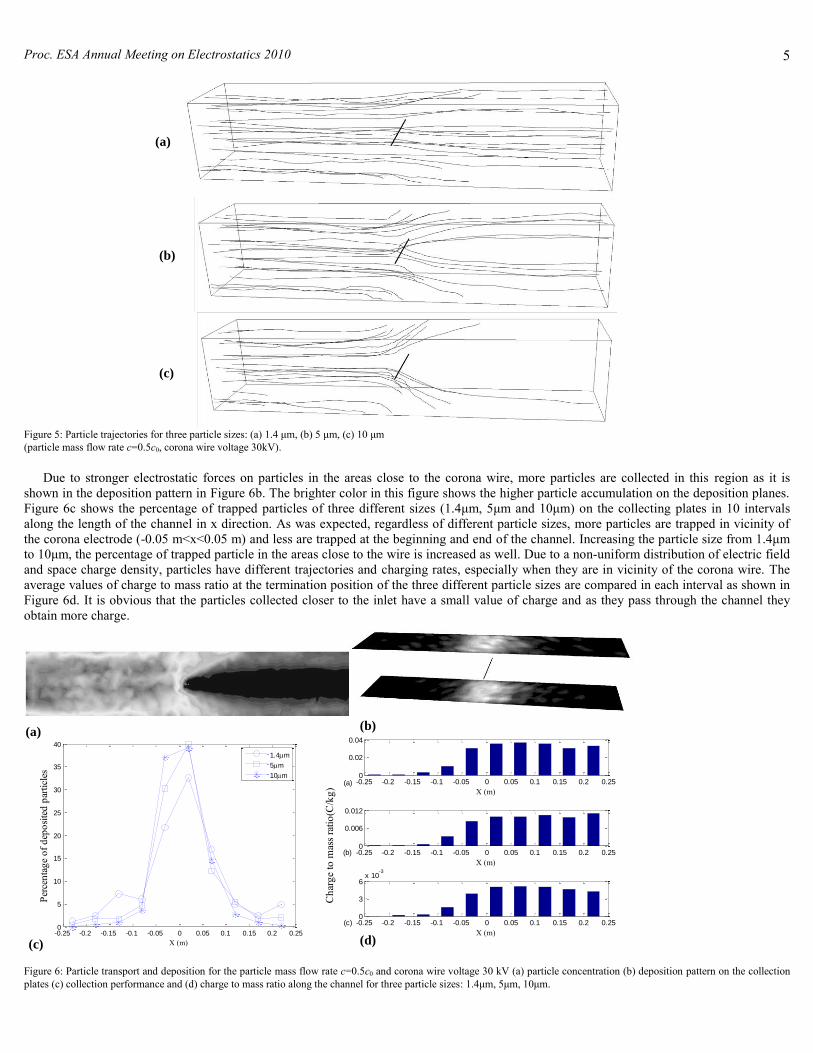
Figures 5a - 5c show a selected number of particle trajectories released from the same starting point for three different particle sizes: 1.4 µm, 5 µm, and 10µm, assuming c=0.5c0 as the total mass flow rate of particles. Note that the shown paths are mean tracks, while in the calculations a stochastic calculator is activated to take into consideration the turbulence oscillations of individual paths around an average route. For very small particles (1.4 µm - Figure 5a), air drag forces have a stronger effect than electrostatic forces, so they mostly follow the flow paths moving first toward the corona wire and then are slightly pushed back to the collecting plates. However, the bigger particles (5 µm and 10 µm - Figures 5b and 5c) obtain more charge and are driven to the deposition planes with stronger electrostatic forces especially in the areas close to the corona wire. In this case the particle trajectories are much shorter, most particles are trapped and only a few of them escaped from the outlet.
The particle concentration pattern in z=0 symmetry plane is shown in Figure 6a, where the dark color indicates areas with low particle concentration and the bright color shows areas with a relatively high particle concentration. Behind the wire in the downstream direction, the particles are driven toward the collecting plates by the electric forces and a narrow dark trail with bright borders is produced in this region, which confirms the experimental results obtained by Mizeraczyk and his co-workers [16].
(a) (b)
Proc. ESA Annual Meeting on Electrostatics 2010 5
Figure 5: Particle trajectories for three particle sizes: (a) 1.4 μm, (b) 5 μm, (c) 10 μm (particle mass flow rate c=0.5c0, corona wire voltage 30kV).
Due to stronger electrostatic forces on particles in the areas close to the corona wire, more particles are collected in this region as it is shown in the deposition pattern in Figure 6b. The brighter color in this figure shows the higher particle accumulation on the deposition planes. Figure 6c shows the percentage of trapped particles of three different sizes (1.4μm, 5μm and 10μm) on the collecting plates in 10 intervals along the length of the channel in x direction. As was expected, regardless of different particle sizes, more particles are trapped in vicinity of the corona electrode (-0.05 m<x<0.05 m) and less are trapped at the beginning and end of the channel. Increasing the particle size from 1.4μm to 10μm, the percentage of trapped particle in the areas close to the wire is increased as well. Due to a non-uniform distribution of electric field and space charge density, particles have different trajectories and charging rates, especially when they are in vicinity of the corona wire. The average values of charge to mass ratio at the termination position of the three different particle sizes are compared in each interval as shown in Figure 6d. It is obvious that the particles collected closer to the inlet have a small value of charge and as they pass through the channel they obtain more charge.
-0.25 -0.2 -0.15 -0.1 -0.05 0 0.05 0.1 0.15 0.2 0.250
5
10
15
20
25
30
35
40
X (m)
Perc
enta
ge o
f dep
osite
d pa
rticl
es
1.4m
5m
10m-0.25 -0.2 -0.15 -0.1 -0.05 0 0.05 0.1 0.15 0.2 0.250
0.02
0.04
X (m)
-0.25 -0.2 -0.15 -0.1 -0.05 0 0.05 0.1 0.15 0.2 0.250
0.006
0.012
X (m)
Cha
rge
to m
ass r
atio
(C/k
g)
-0.25 -0.2 -0.15 -0.1 -0.05 0 0.05 0.1 0.15 0.2 0.250
3
6x 10
-3
X (m)
(a)
(b)
(c)
Figure 6: Particle transport and deposition for the particle mass flow rate c=0.5c0 and corona wire voltage 30 kV (a) particle concentration (b) deposition pattern on the collection plates (c) collection performance and (d) charge to mass ratio along the channel for three particle sizes: 1.4μm, 5μm, 10μm.
(a)
(b)
(c)
(a) (b)
(c) (d)

Proc. ESA Annual Meeting on Electrostatics 2010 6
After a four times increase in the particle concentration (c=2c0), no dramatic changes can be observed in the velocity contours and the generated flow turbulences are weak (Figure 7).
Figure 7: Velocity contours in z=0 symmetry plane (particle flow mass rate c=2c0, corona wire voltage 30kV).
Comparing the particle concentration pattern in Figure 8a with Figure 6a, the dark trail is getting slightly wider, pushing more particles towards the deposition planes in the downstream direction. Figure 8b also shows a higher particle collection in the intervals close to the corona wire. The higher percentage of deposited particles of 1.4μm at the beginning and end of the channel verify the random movement of small particles with less inertia in the turbulent flow in the channel. The average values of charge to mass ratio for the three different sizes of particles are also shown in Figure 8c which follows the same trend as that shown in Figure 6c.
-0.25 -0.2 -0.15 -0.1 -0.05 0 0.05 0.1 0.15 0.2 0.250
5
10
15
20
25
30
35
40
45
X (m)
Perc
enta
ge o
f dep
osite
d pa
rticl
es
1.4m
5m
10m
-0.25 -0.2 -0.15 -0.1 -0.05 0 0.05 0.1 0.15 0.2 0.250
0.02
0.04
X (m)
-0.25 -0.2 -0.15 -0.1 -0.05 0 0.05 0.1 0.15 0.2 0.250
0.006
0.012
X (m)
Cha
rge
to m
ass r
atio
(C/k
g)
-0.25 -0.2 -0.15 -0.1 -0.05 0 0.05 0.1 0.15 0.2 0.250
3
6x 10
-3
X (m)
(a)
(b)
(c)
Figure 8: Particle transport and deposition for the particle mass flow rate c=2c0 and corona wire voltage 30 kV (a) Particle concentration (b) collection performance and (c) charge to mass ratio along the channel for three particle sizes: 1.4μm, 5μm, 10μm.
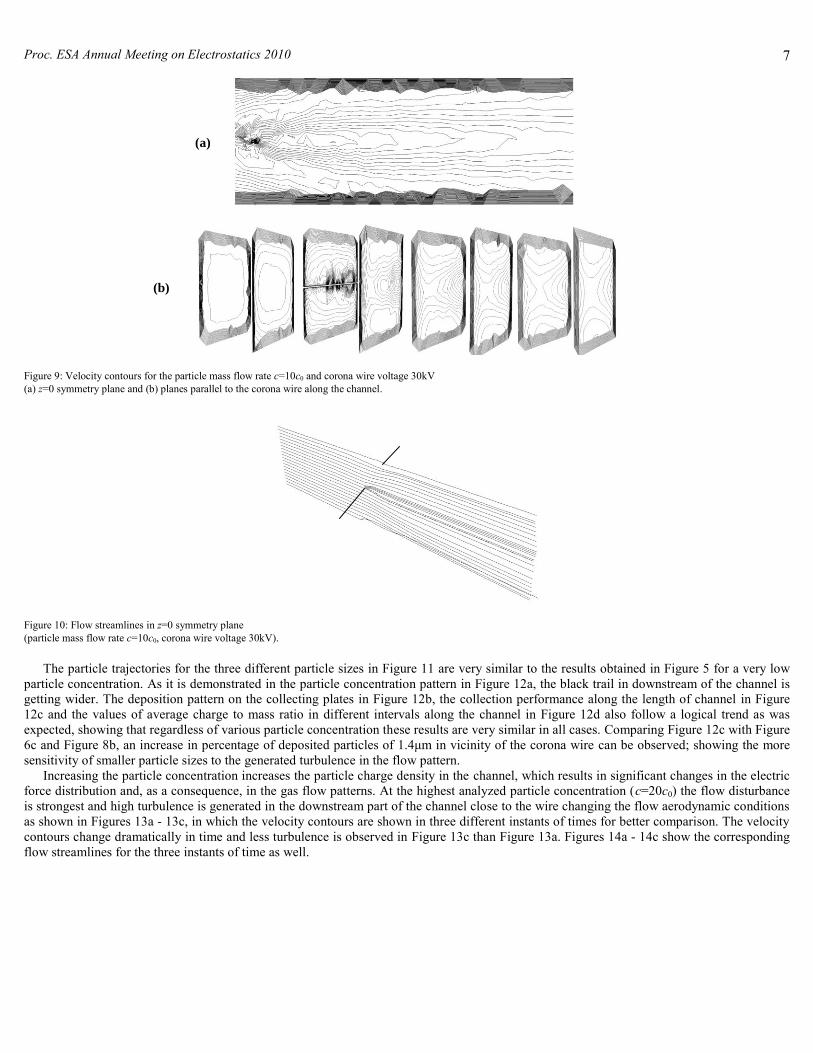
After the particle concentration has been increased 20 times (c=10c0), some flow turbulences start to appear in the downstream direction. In order to show this effect better the velocity contours are shown not only in z=0 symmetry plane, but in several planes parallel to the corona wire along the length of the channel as well (Figure 9a and 9b). Figure 10 shows that the flow streamlines in z=0 symmetry plane are mostly parallel to the walls in upstream direction and a very narrow oscillating wake is generated behind the wire in downstream direction, which expands slightly toward the channel outflow end.
(a) (b)
(c)
Proc. ESA Annual Meeting on Electrostatics 2010 7
Figure 9: Velocity contours for the particle mass flow rate c=10c0 and corona wire voltage 30kV (a) z=0 symmetry plane and (b) planes parallel to the corona wire along the channel.
Figure 10: Flow streamlines in z=0 symmetry plane (particle mass flow rate c=10c0, corona wire voltage 30kV).
The particle trajectories for the three different particle sizes in Figure 11 are very similar to the results obtained in Figure 5 for a very low particle concentration. As it is demonstrated in the particle concentration pattern in Figure 12a, the black trail in downstream of the channel is getting wider. The deposition pattern on the collecting plates in Figure 12b, the collection performance along the length of channel in Figure 12c and the values of average charge to mass ratio in different intervals along the channel in Figure 12d also follow a logical trend as was expected, showing that regardless of various particle concentration these results are very similar in all cases. Comparing Figure 12c with Figure 6c and Figure 8b, an increase in percentage of deposited particles of 1.4μm in vicinity of the corona wire can be observed; showing the more sensitivity of smaller particle sizes to the generated turbulence in the flow pattern.
Increasing the particle concentration increases the particle charge density in the channel, which results in significant changes in the electric force distribution and, as a consequence, in the gas flow patterns. At the highest analyzed particle concentration (c=20c0) the flow disturbance is strongest and high turbulence is generated in the downstream part of the channel close to the wire changing the flow aerodynamic conditions as shown in Figures 13a - 13c, in which the velocity contours are shown in three different instants of times for better comparison. The velocity contours change dramatically in time and less turbulence is observed in Figure 13c than Figure 13a. Figures 14a - 14c show the corresponding flow streamlines for the three instants of time as well.
(a)
(b)

Proc. ESA Annual Meeting on Electrostatics 2010 8
Figure 11: Particle trajectories for three particle sizes: (a) 1.4 μm, (b) 5 μm, (c) 10μm (particle mass flow rate c=10c0, corona wire voltage 30kV).
-0.25 -0.2 -0.15 -0.1 -0.05 0 0.05 0.1 0.15 0.2 0.250
5
10
15
20
25
30
35
40
X (m)
Perc
enta
ge o
f dep
osite
d pa
rticl
es
1.4m
5m
10m
-0.25 -0.2 -0.15 -0.1 -0.05 0 0.05 0.1 0.15 0.2 0.250
0.02
0.04
X (m)
-0.25 -0.2 -0.15 -0.1 -0.05 0 0.05 0.1 0.15 0.2 0.250
0.006
0.012
X (m)
Cha
rge
to m
ass r
atio
(C/k
g)
-0.25 -0.2 -0.15 -0.1 -0.05 0 0.05 0.1 0.15 0.2 0.250
6
3
x 10-3
X (m)
(a)
(b)
(c)
Figure 12: Particle transport and deposition for the particle concentration c=10c0 and corona wire voltage 30 kV (a) particle concentration (b) deposition pattern on the collection plates (c) collection performance and (d) charge to mass ratio along the channel for three particle sizes: 1.4μm, 5μm, 10μm.
(a)
(b)
(c)
(a) (b)
(c) (d)

Proc. ESA Annual Meeting on Electrostatics 2010 9
Figure 13: Velocity contours in z=0 symmetry plane for three different instants of time (particle mass flow rate c=20c0, corona wire voltage 30 kV).
The flow streamlines in Figure 14a demonstrate a very unsteady turbulent flow with violent oscillations along the channel. The flow streamlines are modified in time as shown in Figure 14b and 14c and represents less turbulent behavior.
Figure 14: Flow streamlines in z=0 symmetry plane for three different instants of time (particle mass flow rate c=20c0, corona wire voltage 30 kV).
By increasing the particle concentration, the dark area (particle free region) in particle flow pattern spreads out more widely due to flow
turbulence and cover almost the whole height of the ESP, as was also experimentally reported in [16], strongly driving the particles towards the deposited planes (Figure 15). For three different instants of time, significant changes in the particle concentration patterns is also observed as shown in Figure 15a - 15c, which corresponds to changes in time of the flow pattern.
(a)
(b)
(c)
(a) (b) (c)

Proc. ESA Annual Meeting on Electrostatics 2010 10
Figure 15: Particle concentrations in z=0 symmetry plane for three different instants of time (particle mass flow rate c=20c0, corona wire voltage 30 kV).
The results of total mass transfer efficiency and collection efficiency for individual particle sizes of: 0.3μm, 1.4μm, 5.0μm, 10μm and 15μm, and for different particle mass flow rates are shown in Table I. For the smallest particle size (0.3μm) the collection efficiency is very low; increasing the particle size to 10μm, the collection efficiency also increases and for particles of 15μm and larger, all of the particles are theoretically trapped on the deposited planes. The effect of different particle concentration on collection efficiency of small particle sizes is also shown in Table I. Increasing the particle concentration from c=0.5c0 to c=20c0, the collection efficiency for small particles of: 0.3μm, 1.4μm and 5μm rise by 47.06%., 26.51% and 8.82%, respectively. Because of greater flow turbulence intensity in the case of higher particle concentration, very small particles are directed towards the collecting electrodes increasing their chances of being trapped there. According to Figure 3, 54.74% of the total mass flow at the precipitator inlet is in the form of large particles (15-90μm) and these particles are fully trapped. On the other hand, 10μm particles contribute almost 38% of the total mass flow at the inlet, having high collection efficiency as well. Therefore, the small particles (0.3-5μm) with low collection efficiency occupy only a small portion of the total mass at the inlet (approximately 7.26%), having negligible effect on the total mass transfer efficiency. The above reasons justify the high and almost the same value of total mass collection efficiency obtained for different particle mass flow rates.
Table I: ESP performance for different particle mass flow rates.
Total mass flow rate
(kg/s)
Collection efficiency Total mass transfer efficiency 0.3μm 1.4μm 5μm 10μm 15μm
c=0.5c0 8.50% 20.75% 59.50% 98.50% 100% 96.71%
c=2c0 10.00% 19.50% 58.50% 98.50% 100% 96.65%
c=10c0 10.75% 22.50% 60.00% 97.75% 100% 96.46%
c=20c0 12.50% 26.25% 64.75% 96.75% 100% 96.38%
The two curves in Figure 16a show the mass percentage of the whole particle size distribution at the inlet and outlet assuming c=10c0 as the total mass flow rate in ESP entrance. Integrating the area under the outlet curve, the percentage of total escaped mass regarding to the total mass released from the inlet could be obtained, which is 3.54% for this case. Similar curves can be obtained for different particle mass flow rate. Figure 16b shows the escaped mass percentage of different particle sizes regarding to the total mass flow rate at the outlet for different particle mass flow rates. For all particle mass flow rates the maximum portion of mass at the outlet is due to 5μm particles and no particles of
(a)
(b)
(c)

Proc. ESA Annual Meeting on Electrostatics 2010 11
greater than 15μm can be observed in this region. For high particle concentrations (c=10c0 and c=20c0) the mass percentage of 10μm particles at the outlet is increased; showing that the particles motion is mostly affected by the turbulent flow drag forces with a weak contribution of electric force. Although the electrostatic forces drive these particles to the collecting plates, the turbulence flow push them back to the middle of the channel again; thus decreasing the collection efficiency.
0 10 20 30 40 50 60 70 80 900
5
10
15
20
25
30
35
40
d(m)
Mas
s flo
w ra
te p
erce
ntag
e(%
)
Inlet
Outlet
0 2 4 6 8 10 12 14 16 18 200
10
20
30
40
50
60
70
80
d(m)M
ass
flow
rate
per
cent
age(
%) i
n O
utle
t
c=0.5c0
c=2c0
c=10c0
c=20c0
Figure 16: Distribution of mass flow rate versus particle diameter (a) at inlet and outlet for the particle concentration c=10c0 (b) at outlet for different mass flow rates. (corona wire voltage 30 kV).
The effect of the particle mass flow rate on the total corona current is shown in Figure 17. The particle concentration increase causes a decrease in the average discharge current from 108μA for very low particle concentration to 63μA for very high particle concentration. Increasing the particle concentration increases the charge density due to particles in Poisson equation leading to the electric field intensity decrease on the corona wire surface [17]. Therefore the total discharge current depending on ionic charge density and electric field intensity on the corona surface is decreased.
0 2 4 6 8 10 12 14 16 18 200.55
0.6
0.65
0.7
0.75
0.8
0.85
0.9
0.95
1
Relative Particle concentration
Rela
tive c
urr
ent
Figure 17: Relative current versus relative particle concentration
V. CONCLUSION
A 3-D computational model was developed to investigate all involved physical phenomena in a single wire-plate electrostatic precipitator
taking into account the mutual interactions between electrostatic field, flow field, particle charging and their turbulent motion. Particle size distribution at the inlet was approximated with lognormal distribution. The proposed computational model was used to simulate the particle transport of different sizes, particle concentration patterns and the average charge to mass ratio for each particle sizes on the collecting planes. The results confirm that regardless of a particle size, a high percentage of the deposited particles are trapped in the areas close to the corona wire on the collecting planes and the larger particles always have the highest collection efficiency due to stronger electrostatic forces acting on them. The influence of increasing particle concentration on the airflow and particle flow pattern was investigated as well. It was shown that increasing particle concentration significantly changes the airflow structure behind the wire and makes it more turbulent leading to higher collection efficiency for very small particles. The particle flow patterns obtained for different inlet mass flow rate verify that the particle free
(a) (b)

Proc. ESA Annual Meeting on Electrostatics 2010 12
region in the downstream direction behind the corona wire spreads out as the concentration increases. A similar value of mass collection efficiency was obtained for different mass flow rates due to the dominant portion of large particles injected at the inlet. No particle size of 15μm and greater was observed at outlet and 5μm particles had the highest mass percentage at the outlet for various particle concentrations. About 42% decrease in the total average discharge current was observed by increasing the mass flow rate from c=0.5c0 to c=20c0.
Acknowledgments
This project was in part financially supported by the Natural Sciences and Engineering Research Council of Canada (NSERC). This work was made possible by the facilities of the Shared Hierarchical Academic Research Computing Network (SHARCNET: www.sharcnet.ca) and Compute/Calcul Canada.
REFERENCES
[1] U. Kogelschatz, W. Egli and E.A. Gerteisen, Advanced computational tools for electrostatic precipitators, ABB Rev. 4, 1999, pp. 33-42. [2] A. Soldati, “On the effects of electro-hydrodynamic flows and turbulence on aerosol transport and collection in wire-plate electrostatic precipitators,” J. Aerosol Sci., vol. 31, no. 3, pp. 293-305, 2000. [3] N. Farnoosh, K. Adamiak, P.G. Castle,”3-D Numerical analysis of EHD turbulent flow and mono-disperse charged particle transport and collection in a wire-plate ESP”, submitted to J. Electrostat., Dec. 2009. [4] A.A. Varonos, J.S. Anagnostopoulos and G.C. Bergeles, “Prediction of the cleaning efficiency of an electrostatic precipitator,” J. Electrostat., vol. 55, no. 111, 2002. [5] K.S.P. Nikas, A.A. Varonos and G.C. Bergeles, “Numerical simulation of the flow and the collection mechanisms inside a laboratory scale electrostatic precipitator,” J. Electrostat., vol. 63, no. 423, 2005. [6] H.J. Schmid and L. Vogel, “On the modeling of the particle dynamics in electrohydrodynamics flow fields: I. Comparison of Eulerian and Lagrangian modeling approach,” Powder Technol., vol. 135&136, pp. 118-135, 2003. [7] H.J. Schmid, “On the modeling of the particle dynamics in electrohydrodynamics flow fields: II. Influences of inhomogeneities on electrostatic precipitation,” Powder Technol., vol. 135&136, pp. 136-149, 2003. [8] G. Skodras, S.P. Kaldis, D. Sofialidis, O. Faltsi, P. Grammelis and G.P. Sakellaropoulos, “Particle removal via electrostatic precipitators-CFD simulation,” Fuel Processing Technology, vol. 87, pp. 623-631, 2006. [9] J.H. Goo and J.W. Lee,”Stochastic simulation of particle charging and collection characteristics for a wire-plate electrostatic precipitator of short length,” J. Aerosol. Sci., vol. 28, no. 5, pp. 875-893, 1997. [10] H. Lei, L.-Z. Wang and Z.-N. Wu, “EHD turbulent flow and Monte-Carlo simulation for particle charging and tracing in a wire-plate electrostatic precipitator,” J. Electrostat., vol. 66, pp. 130-141, 2008. [11] C. Lu and H. Huang, “A sectional model to predict performance of a plate-wire electrostatic precipitator for collecting polydisperse particles, ” J. Aerosol.Sci., vol. 29, no. 3, pp. 295-308, 1998. [12] S.H. Kim and K.W. Lee, “Experimental study of electrostatic precipitator performance and comparison with existing theoretical prediction models,” J. Electrostat., vol. 48, pp. 3-25, 1999. [13] S.H. Kim, H.S. Park and K.W. Lee,” Theoretical model of electrostatic precipitator performance for collecting polydisperse particles,” J. Electrostat., vol. 50, pp.177-190, 2001. [14] S.W. Nóbrega1, M.C.R. Falaguasta and J.R. Coury,”A study of a wire-plate electrostatic precipitator operating in the removal of polydispersed particles,” Brazilian Journal of Chem. Eng., vol. 21, no.2, pp.275-284, 2004. [15] T. Ivancsy and J.M. Suda, ”Behavior of polydisperse dust in electrostatic precipitators,” J. Electrostat., vol. 63, pp. 923-927, 2005. [16] J. Podlinski, A. Niewulis , J. Mizeraczyk and P. Atten, “ESP performance for various dust densities,” J. Electrostat., vol. 66, pp. 246-253, 2008. [17] K. Adamiak and P. Atten, “Numerical simulation of the 2-D gas flow modified by the action of charged fine particles in a single-wire ESP,” IEEE Trans. on Diel. and Electr. Insul., vol. 16, no. 3, pp. 608-614, 2009. [18] G. Herdan, Small particle statics,2nd ed., Academic Press, New York, 1980. [19] L. Zhao and K. Adamiak, “Numerical simulation of the electrohydrodynamic flow in a single wire-plate electrostatic precipitator,” IEEE Trans. Ind. Appl., vol. 44, no. 3, pp. 683-691, 2008.