#3 classical test theory - michigan · introduction to classical test theory ... item difficulty...
TRANSCRIPT

Introduction to Classical Test Theory
Ji Zeng and Adam WysePsychometricians
Michigan Department of EducationOffice of Educational Assessment and
Accountability

9/25/20092
Topics to Cover
• What is Test Theory? • What is Classical Test Theory
(CTT)?• What are the common statistics
used by MDE in the CTT framework?
• What are the general guidelines for the use of these statistics?

9/25/20093
What is Test Theory?
Test theory is essentially the collection of mathematical concepts that formalize and clarify certain questions about constructing and using tests, and then provide methods for answering them (McDonald, 1999, p. 9).

9/25/20094
What is CTT?
• The main components of Classical Test Theory (CTT) (McDonald, 1999, pp. 4-8) are:
--Classical true-score theory--Common factor theory
(not discussed in detail in this presentation)

9/25/20095
Basic Statistics
• Sample Mean: The arithmetic average.
-- Mini Example: What is the mean of the following scores?10, 20, 30, 50, 90
1
N
ii
XX
N==∑

9/25/20096
Basic Statistics (Cont.)
• Sample Variance: One common way of measuring the spread of data.
2
2 1( )
1
N
ii
X
X XS
N=
−=
−
∑

9/25/20097
Basic Statistics (cont.)
• Sample Standard Deviation: Square-root of sample variance, in the same unit of measurement as the original variable.
-- Mini Example: What is the sample variance and sample standard deviation of the data shown on slide 5?

9/25/20098
Basic Statistics (cont.)
• Sample Covariance: Summarizes how two variables X and Y are linearly related (or vary together).
1( )( )
1
N
i ii
XY
X X Y YS
N=
− −=
−
∑

9/25/20099
Basic Statistics (cont.)
• Sample Correlation: The covariance rescaled, and is completely independent of the unit of measurement in which either X or Y is measured. It ranges from -1 to +1.
1
2 2
1 1
( )( )
( ) ( )
N
i ii
XY N N
i ii i
X X Y Yr
X X Y Y
=
= =
− −=
− −
∑
∑ ∑

9/25/200910
Common Statistics in CTT
• The four major statistics MDE examines or reports in the framework of CTT are:(1) item difficulty(2) item-test correlation (3) reliability coefficient (4) standard error of
measurement (SEM)

9/25/200911
Classical True-Score Theory
X T E= +Where X represents an observed score, T represents a true score, and E represents an error, with the population
mean 0.
iii ETY += iii ETY += iii ETY +=

9/25/200912
Reliability Coefficient
• Reliability is the precision with which the test score measures achievement.
• Higher reliability is desired. Why?• Generally, we would like to have
reliability estimates >=0.85 for high stakes tests. For classroom assessment, it should be >=0.7.
9/25/200913
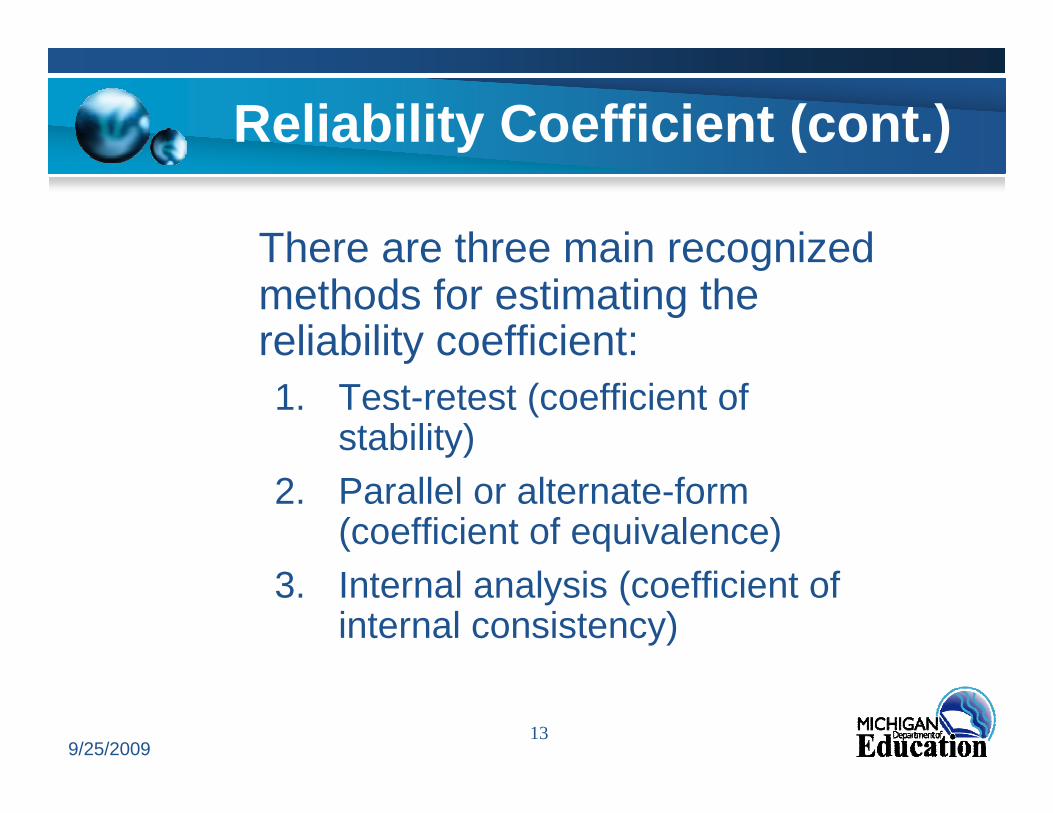
Reliability Coefficient (cont.)
There are three main recognized methods for estimating the reliability coefficient:1. Test-retest (coefficient of
stability)2. Parallel or alternate-form
(coefficient of equivalence)3. Internal analysis (coefficient of
internal consistency)

9/25/200914
Reliability Coefficient (cont.)
• The reliability coefficient reported by MDE in the framework of CTT is Coefficient Alpha. The estimation of Coefficient Alpha is:
2
12
ˆ 11
where is the number of items on the test
N
ii
X
Sk
k S
k
α =
⎛ ⎞⎜ ⎟⎛ ⎞⎜ ⎟= −⎜ ⎟− ⎜ ⎟⎝ ⎠⎜ ⎟⎝ ⎠
∑

9/25/200915
Reliability Coefficient (cont.)
• Coefficient alpha can be used as an index of internal consistency.
• Coefficient alpha can be considered as the lower bound to a theoretical reliability coefficient.
• Why is this lower bound useful? The actual reliability may be higher!

9/25/200916
Standard Error of Measurement
• The Standard Error of Measurement(SEM) is a number expressed in the same units as the corresponding test score and indicates the accuracy with which a single score approximates the true score for the same examinee. In other words, SEM is the standard deviation of the error component in the true-score model shown on slide 11.

9/25/200917
SEM (cont.)
• Mathematically, SEM can be computed using sample data as follows:
where represents the sample standard deviation of test scores,ˆ represents the estimated reliability coefficient.
ˆ1XS
E XS S
α
α= −

9/25/200918
SEM (cont.)
• Only one estimated SEM value for all examinees’ scores in the given group.
• Given a fixed value of sample standard deviation of test scores, the higher the reliability of the test, the smaller the SEM.

9/25/200919
SEM (cont.)
• Sometimes, the students’ obtained score is reported on a score band, with the end of the score band computed using the value of estimated SEM.
• If the score band is composed by subtracting or adding one estimated SEM, then there is about 68% chance that the score band covers the student’s true score. If we constructed the band by subtracting or adding two estimated SEM, then there is about 95% chance that the score band covers the student’s true score.

9/25/200920
Item Difficulty
• For dichotomously scored items (1 for correct answer and 0 for incorrect answer), item difficulty (or p-value) for item j is defined as
Number of examinees with a score of 1 on item Number of Examineesj
jp =
-- Mini Example:
What is the item difficulty if 85 out of 100 examinees answered the item correctly?

9/25/200921
Item Difficulty (cont.)
• Item difficulty is actually the item mean of 0/1 type of data.
• Item difficulty ranges from 0 to 1.• The higher the value of item
difficulty, the easier the item.• Item difficulty is sample dependent.

9/25/200922
Item Difficulty (cont.)
• Adjusted p-value for polytomously scored items (this is computed so that the result will be on the similar scale as that of the dichotomous items):
Item mean for item Difference between the possible maximum and minimum score points for item j
jpj
=
-- Mini Example:
What is the adjusted p-value if an item has mean of 3.5 and the possible maximum score is 5, possible minimum score is 0?

9/25/200923
Item Difficulty (cont.)
• MDE scrutinizes MEAP items if(1) For MC 4 options, p-value
<0.3 or >0.9(2) For MC 3 options, p-value
<0.38 or >0.9(3) For CR items, p-value <0.1
or >0.9
9/25/200924
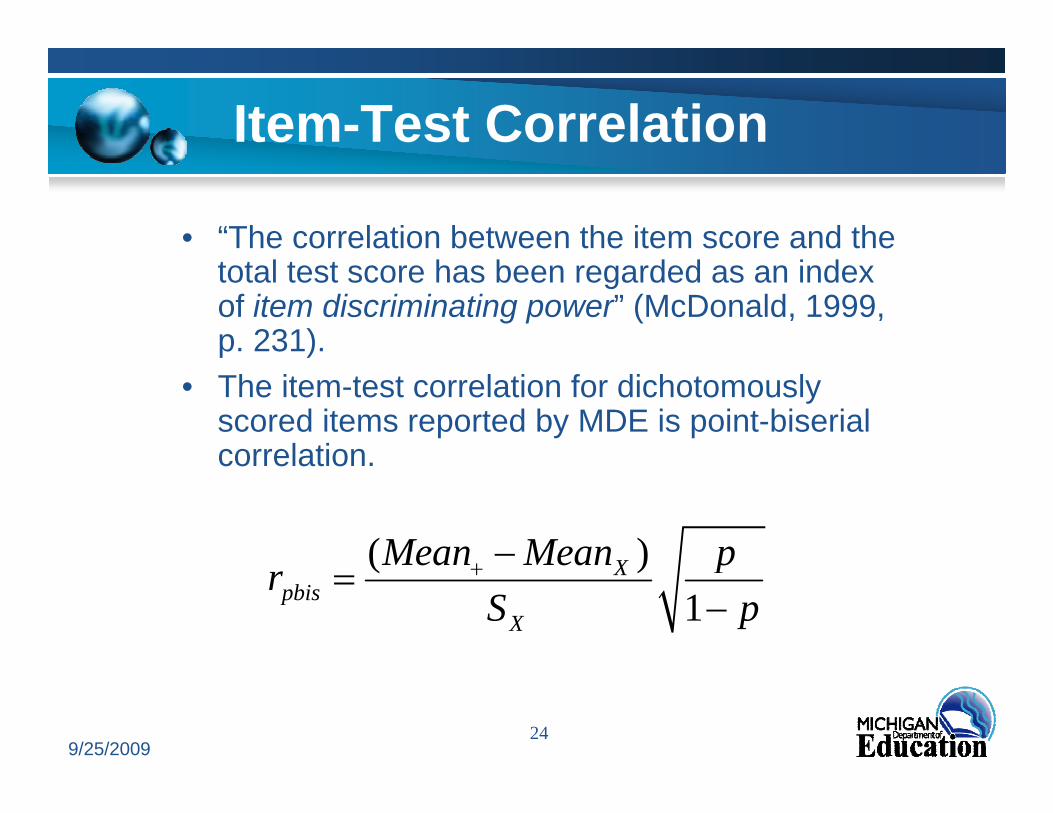
Item-Test Correlation
• “The correlation between the item score and the total test score has been regarded as an index of item discriminating power” (McDonald, 1999, p. 231).
• The item-test correlation for dichotomously scored items reported by MDE is point-biserialcorrelation.
( )1
Xpbis
X
Mean Mean prS p
+ −=−

9/25/200925
Item-Test Correlation (cont.)
• Point-biserial correlation indicates the relation between students’ performance on an 0/1 scored item and their performance on the total test.

9/25/200926
Item-Test Correlation (cont.)
• For polytomously scored items, Pearson Product Moment Correlation Coefficient is used by MDE. The computation formula using sample data is shown before.

9/25/200927
Item-Test Correlation (cont.)
• The corrected formula (each item score is correlated to the total score with the item in question removed) is (McDonald, 1999, pp. 236-237):
( )( )
( )
( )
( )
where is the sample variance of item
is the sample variance of the total score excluding item
i X ii X i
i X i
i
X i
i X i iX i
Sr
S S
S iS i
S S S
−−
−
−
−
=
= −

9/25/200928
Item-Test Correlation (cont.)• Higher item-test correlation is desired,
which indicates that high ability examinees tend to get the item correct and low ability examinees tend to get the item incorrect.
• Obviously, a negative correlation is not desired. Why?
• MDE scrutinizes items with corrected item-test correlation less than 0.25 (e.g., MEAP).

9/25/200929
Item-Test Correlation (cont.)
• Item-test correlation tends to be sensitive to item difficulty.
• Item discrimination indices (such as point-biserialcorrelation) plays an more important role in item selection than item difficulty.

9/25/200930
Limitations of CTT and Relation between CTT and IRT
• Sample dependent• Test dependent• Item Response Theory is
essentially a nonlinear common factor model (McDonald, 1999, p.9).

9/25/200931
References
• Crocker, L., & Algina, J. (1986). Introduction to classical & modern test theory. Orlando, FL: Holt, Rinehart and Winston
• McDonald, R. P. (1999). Test theory: A unified treatment. Mahwah, NJ: Lawrence Erlbaum Associates.

9/25/200932
Contact Information
Ji Zeng(517)241-3105
Adam Wyse(517)373-2435
Michigan Department of Education608 W. Allegan St.Lansing, MI 48909