3. a spatial analysis of residential land values in kaithal
TRANSCRIPT

ISSN 2321–8355 IJARSGG (2015) Vol.3, No.2, 1-15
Research Article
International Journal of Advancement in Remote Sensing, GIS and
Geography
A SPATIAL ANALYSIS OF RESIDENTIAL LAND
VALUES IN KAITHAL CITY,
HARYANA, INDIA
Ravinder Jangra* and S. P. Kaushik
Department of Geography, Kurukshetra University Kurukshetra, Haryana (India)-136119 ( *[email protected])
----------------------------------------------------------------------------------------------------------------------------------------------
ABSTRACT: The aim of this study is the contextualization of land values experienced in the residential areas
of Kaithal city. Land value is one of the major determinants of the morphology of cities. Study attempt to
explore the comparison between collector (authority’s rate) and actual rates (it is current sale/purchase rate at
market) in residential land values during 2013-14. The land value data of collector rate is used which was
generated by revenue department and market rate is collected from field survey of property advisers through
stratified random sampling technique. Inverse Distance Weighted (IDW), physical expansion and buffer
analysis is used in GIS environment to establish a framework for this assessment. Noticeably, the higher land
value of residential properties are observed mainly towards north-east part in planned sectors developed by
government agency such as sector 19-I, II and sector 20 developed by Haryana Urban Development Authority
(HUDA) as well as private developer i.e. Sun City (Private developer). The characteristics of the housing unit,
its location with respect to social and environmental amenities, as well as access to jobs, services and other
economic opportunities are the contributing factors to the value of a given location.
KEYWORDS: Physical Expansion, Land Values and Inverse Distance Weighted ----------------------------------------------------------------------------------------------------------------------------------------------
1. INTRODUCTION: In the present day scenario, cities are becoming hub of almost all human activities. This has
resulted in ever-growing size of cities, squeezing open spaces available within the city and has started exerting
pressure on civic amenities (1). Cities are also a part of artificial environment where humans are formed and molded
with its own culture and the physical structure of modern towns represents the existence or the absence of social spirit
(2). Land is an important resource for accommodating various activities within the residential areas of a city. There
has always been a demand with the aim of accommodation and/or making investments. Land and housing values vary
in space, whatever the spatial scale of analysis [(3), (4)]. Urbanization is a development oriented sign of economic
prosperity in any country. Expansion of cities economic base (such as higher per capita income, increase in number of
working persons) creates demand for new housing or more housing space for individuals (5). Physical space is a
requirement of all types of economic activities from residence to manufacturing and service production which makes
the value of land an important feature of any economy. The price of land in an urban area is a fundamental measure of
the area‟s attractiveness. Residential land use among the various competing urban land uses is the largest consumer of
land in urban areas. Consequently, it is usually the focus of urban research (6). It is also important for an urban
planner to monitor the physical expansion of a city because it is an indicator of development and economic growth.
Cities expansion does not only provides information regarding changes taken place between two time periods but it
also helps in establishing a trend of changes in urban growth over a period of time (7). In many developing countries,
residents of the core city lack sufficient living space. This encourages countryside development for more living space.
People can buy more living space in the countryside than in the inner city (8). Most of these studies show that urban
areas are of enormous political, social, economic and cultural importance to the countries in which they are located.
Land value is one of the major determinants of the morphology of these cities. The importance of cities in societal
development is due to their unique role as centers of innovation, adoption and diffusion and growth points (9). Large
cities have experienced rapid spatial growth because of higher growth rates of urban population and changing in
residential land use due to uncontrolled developments. Land use changes are increasingly known as the consequence
of „actors and factors‟ interactions (10). Regarding the extraction of built-up land, many researchers have been used
time-series remote sensing data in various studies and applied several techniques and methods to differentiate
continuous built-up land in urban environment. These methods included supervised classification, (11); unsupervised
classification (12); NDVI-differencing (13); integration of road density layer with spectral bands (14); Normalized
Difference Built-up Index (NDBI) [(15), (16)]. These studies revealed that, due to complex urban form and spatio-
temporal variation in time-series remote sensing data, there was heterogeneous spectral reflectance which restricted

Jangra & Kaushik/International Journal of Advancement in Remote Sensing, GIS and Geography, Vol.3, No. 2 2
the accuracy from 70-85%. Hence there is need of better techniques/methods to improve the accuracy. In briefly,
residential lands are the most extensive and bulky elements of the built environment. Services in the residential areas
and transport network which link them to each other play a key role in the formation of the built environment and give
the city a basic identity. The value of a land not only depends on the physical characteristics of a building but also it
depends on surrounding environment of that building and a significant difference between market performance (actual
rate) and the authority‟s view (collector rate).
2. RESEARCH AREA: Kaithal city is situated on 29042‟9” north latitude and 76
0 23‟ 49” east longitude (Fig. I). The
general topography of the city is flat. General slope of the city is from north-east to south- west, in which directions
most of the canals/drains flow down. The main city is situated on an elevated land but it is surrounded by several
ponds and mounds in the west and north-west including an extensive "Bidkiyar Lake" covering the major potential
area in the vicinity of the city. NH- 65 passing through the main city connecting the state capital Chandigarh to Hisar.
City has municipal council and it is a class-I city with a total population of 1,44,915 persons as per Census, 2011.
Kaithal emerged as the center of commercial business and educational activities after becoming a district headquarter
in November, 1989. Kaithal is also known for one of the largest food grain market in the state of Haryana. According
to study by town and country planning department, the primary factors responsible for this tremendous increase in the
population are in-migration from surrounding villages of the district for better facilities and job opportunities, the
influx of in-migrants from Punjab during the days of terrorism and various small and medium scale agro-based
industries, up-gradation of its administrative status to district headquarter with all government and semi-government
establishment, acquisition and development of the residential sectors by HUDA, development of new grain market and
installation of sugar mill and the like led to formal and informal sector development.
Fig. I: Study Area
3. OBJECTIVES: A temporal study helps in understanding the growth direction of the city and their effects on land
rates. In the light of the above discussion the main objective of the present study are:-
1. To analyze the physical expansion of city from 1971-2010.
2. To compare residential land rates (collector and actual) and identify gaps between the two rates in the year
2013-14.
4. DATABASE AND METHODS 4.1. DATA USED: For urban expansion studies, synoptic view of the urban area is prerequisite; hence, in order to
assess and map the time-series urban expansion, various types of data have been used irrespective of common scale
and resolution. Survey of India (SOI) topographic map (53c/5) on scale 1:50,000 are used to delineate city‟s built-up
expansion till year 1971. Open source data including Landsat-3 MSS (79m), Landsat-5 TM (30m) and Landsat-7 ETM

Jangra & Kaushik/International Journal of Advancement in Remote Sensing, GIS and Geography, Vol.3, No. 2 3
(30m) have used for the period 1981, 1991and 2001respectively. Physical expansion and land use mapping for the
year 2010 was done using satellite imagery made available by digital globe on Google Earth. Details description of the
data used in this study is shown in Table.1.
.Sr.
No
Satellite and
path/row
Sensor Year of
Acquisition
Spatial
Resolution
Spectral Resolution Temporal
Resolution
1
LANDSAT 3
p147/r039
MSS
1981 79m Band 4 0.5-0.6 (Green)
Band 5 0.6-0.7 (Red)
Band 6 0.7-0.8 (NIR)
Band 7 0.8-1.1 (NIR)
18 days
LANDSAT 5
p147/r039
TM 1991 30m Band 2 0.52-0.60
Band 3 0.63-0.69
Band 4 0.76-0.90
18 days
LANDSAT 7
p147/r039
ETM+ 2001 30m Band 2 0.52-0.60
Band 3 0.63-0.69
Band 4 0.76-0.90
16 days
2 Google Earth, Digital Globe coverage 2010
3 Topographical Map
4 Collector rate of land for the period 2013-14
Source:
1. http://glcf.umd.edu/; 2. Google earth; 3. Survey of India; 4. Revenue Department, Kaithal Table I: Specifications and Sources of Data used
4.2. METHODOLOGY: Present study is based on both primary and secondary data sources. The approach and
methods used in this study are presented in fig. II.
Fig. II: Block Diagram of Methodology
4.2.1 DEMARCATION OF PHYSICAL EXPANSION: In order to achieve first objective, assessment of physical
expansion for the period 1971, 1981, 1991, 2001 and 2010 all the satellite imageries and other scanned maps were
geo-referenced with reference to survey of India toposheet (scale 1:50000) and put on a common scale. Despite
different resolution of satellite images few base ground features such as roads/railway crossing etc. identified as
common Ground Control Points (GCPs) as presented in Fig. III. These GCPs were used for geo-referencing all the
Landsat imageries.

Jangra & Kaushik/International Journal of Advancement in Remote Sensing, GIS and Geography, Vol.3, No. 2 4
Fig.III: Landsat Imagery-1991 (left) and Landsat Imagery 2001 (right),
Highlighted Blue Tone as Indication of Built-up Area
A standard False Color Composite (FCC) images were produced by combining bands 4 (near infrared), 3 (red)
and 2 (green) for the period 1981, 1991 and 2011 respectively. In this FCC image vegetation appears in shades of red
and urban areas are cyan blue as shown in Fig. III. Considering cyan blue tone as primary evidence of built-up
expansion, other information including municipality boundary map and other secondary information were also
incorporated for the demarcation of physical expansion corresponding to respective period. In view of heterogeneous
spectral reflectance, in this process some irregular/patched built development was also considered as integral part of
city‟s continuous physical expansion. Physical expansion delineation and land use mapping for the period 2010 is
completed using satellite imagery of 1m. resolution made available by digital globe on Google Earth.
4.2.2. LAND USE ASSESSMENT: In this study land use assessment is done for the period 2010 only. Since satellite
imagery of year 2010 has very high resolution (1m) so detail land use features were digitized manually by employing
major image interpretation indications such as shape, size, tone, pattern and association. Taking the advantage of
author‟s local knowledge, land use accuracy was achieved up to 80 % prior to ground validation. This land use was
verified by ground survey and accuracy was improved to 95% and final land use was classified in line with Urban
Development Plans Formulation and Implementation (UDPFI) guidelines.
4.2.3 LAND VALUE ASSESSMENT: Regarding to achieve second objective of this study both primary and
secondary data were collected. Primary data involved collection of residential land value data from the various
residential localities and this process is done by randomly selected 75 sample points. These sample points were
identified in such a way so that each separate residential division (ward, colony, sector etc.) demarcated by urban local
body could be cover. The land value rates as prevailing in market corresponding to these 75 survey locations were
collected from the city‟s well known property advisors. On the other side, the collector rates for the same samples
were collected from the district revenue department, Kaithal. In order to interpolate/assign land values to unknown
location (not covered in samples), based on sample points, an Inverse Distance Weighting (IDW) method is used in
GIS for both collector rates and actual rates. A comparative analysis is done and tried to associate these land rates
variation with the existing land use and other characteristics of the city.
5. RESULT AND DISCUSSION: To analyze the spatial variation in land values within the city, the study of physical
expansion/pattern, local and regional transport linkages, level of physical infrastructure, utility and facilities and land
use etc. is inevitable. Hence, present study briefly analyzed these factors to attain the study objectives.
5.1. PHYSICAL EXPANSION: The physical expansion of the Kaithal city takes place in five different periods.
City‟s built-up area was only 834.90 acres with a population of 45,199 persons in 1971 which increased to 5844.57
acres with a population of 1,44,915 persons in 2010. The growth rate consistently increased with time. The lowest
growth rate was in 1971-81 decades (49.84 percent), followed by 1981-91(57.62 percent) and 1991-2001(69.50
percent). The highest growth rate was achieved during the last decade i.e. 2001-2010 (74.85 percent). City expansion
has attained momentum with the up-gradation of the administrative setup of the city as a district headquarters in 1989.
During the decade 2001-2010, the city shows a sizable growth of population as well as physical growth, 2530.36 acres

Jangra & Kaushik/International Journal of Advancement in Remote Sensing, GIS and Geography, Vol.3, No. 2 5
of agriculture land has been added to built-up area during this period (Table II and Fig. IV).City had grown
organically more or less in radial shape up to 1990 and grows in linear shape, thereafter, built up area has expanded in
all directions but it is more pronounced in the north-east direction mainly towards Karnal and Ambala roads. The
linear growth is also noticed along the major roads mainly towards north-east, east and south-east directions and still
continues with the same pattern.
Table II: Physical Expansion, 1971-2010
Fig. IV: Physical Expansion, 1971-2010
Considering proposed development plan for year 2021 prepared by the department of town and country
planning and existing physical growth pattern, it is expected that the future growth and direction of city will be mainly
governed by existing transport corridors, existing and future industrial and planned residential developments in the
outskirt of the city.
5.2.LAND USE/LAND COVER: The total area of Kaithal city in 2010 was 9895.64 acres in 2010 (Table III).The
main category of our concern is residential which occupied 2561.56 acres (25.89 percent of total municipal area of the

Jangra & Kaushik/International Journal of Advancement in Remote Sensing, GIS and Geography, Vol.3, No. 2 6
city), because of its natural growth of population and migration from the surrounding rural areas. Most of the old
residential areas like walled city are unplanned but the newly planned areas like HUDA sectors and other private
sectors developed on the both side of national highway-65 and nearby bye-pass of the city. Kaithal is a big Mandi
(Market) of manufacturing parts of machine and city has 6.37 percent of the total area under industries which includes
large manufacturing units as well as household units. Industries are located on Jind road such as rice sellers, oil mills,
spinning and weaving mills, flour mills and chemicals industries etc.
Fig. V: Land Use/Land Cover, 2010
Commercial areas are mainly along the major roads and in the central part of the city, it occupies 2.40 percent
of the total urban land use. Main clusters of commercial activities are Sadar Bazaar, Old Sabji Mandi, Chatrawas
Road, Tractor-Truck Market, Nota Chowk and commercial market of HUDA sectors which also make the C.B.D. of
Kaithal city. The largest area is under agricultural use i.e. 50.15 percent, it is because the latest municipal boundary is
extended in recent years and it covers huge area of periphery which is mainly under agricultural uses (Fig. V).The area
which covers transport and communications account 3.81 percent of total land area. National highway- 65 passes
through the main city connecting the state capital, Chandigarh to Hisar. Other land use categories have small

Jangra & Kaushik/International Journal of Advancement in Remote Sensing, GIS and Geography, Vol.3, No. 2 7
proportion of area which includes public and semi-public (3.79 percent), recreational (1.65 percent), water bodies
(2.10 percent) and vacant zone (3.84 percent).
Table III: Land Use Categories, 2010
5.3. LAND VALUES: The basic premise of this paper is analysis of the value of residential locations in Kaithal city,
2013-14.Huge variations in land and residential values can be observed at the scale of a country [(3), (4)]. It has been
demonstrated that the land-price gradient is steeper than the housing-price gradient (17). Knowledge of the
determinants of land prices has recently been improved by careful analyses of the role of “green” amenities in
residential choice modeling and especially in estimating hedonic prices [(18)-(22)]. The analyses that consider a set of
agglomerations are often quite general about the spatial pattern of land prices within each agglomeration [(3), (4)].
Residential area is perceptibly the main kind of urban land use in Indian cities. Likewise, it is the main land use in
Kaithal city too. The area under residential use is approximately 2561.56 acres.
5.3.1 COLLECTOR AND ACTUAL RATE: Figure V demonstrates the collector and actual land prices of different
sample locations with their specific land use in the city. Collector land rates are usually defined by the local state
government‟s revenue departments or the local development authorities. There may be difference between collector
and actual rates, but any such bias is assumed to be independent on location. The advantage of this database is that it is
available for the entire country using the same methodology and it appears every year. As expected, land rates are high
in communes encompassing city center (C.B.D.) and decreases with distance from this commune (23). On the other
hand, market/actual rates are determined by the seller‟s expectation of price and the buyer‟s inclination to pay. Across
all property markets in India, the collector rates are invariably much lower than the actual market rates. This is
because: a) Collector rates are not reviewed regularly to bring them in line with the market prices and b) They do not
represent the actual indicator of ground realities. Most real estate transactions are registered at the minimum collector
rates or slightly above, which may be lower than the actual transaction price. The result is a loss to the exchequer in
terms of the applicable stamp duty.
5.3.2. SPATIAL ANALYSIS OF RESIDENTIAL LAND VALUES: Figure VI (a) shows the spatial variations in
the collector rate as per the revenue department. The highest rates appears in north-east direction nearby along the new
bye-pass road, mainly in HUDA (Sector 18, 19, 20 and 21) and private sectors (Sun city and Gulmohar city) which is
highly accessible area. It is a well-known fact that land rates in sector areas always remains higher than the other
residential areas since these are planned localities and thus have better amenities in comparison with other locality.
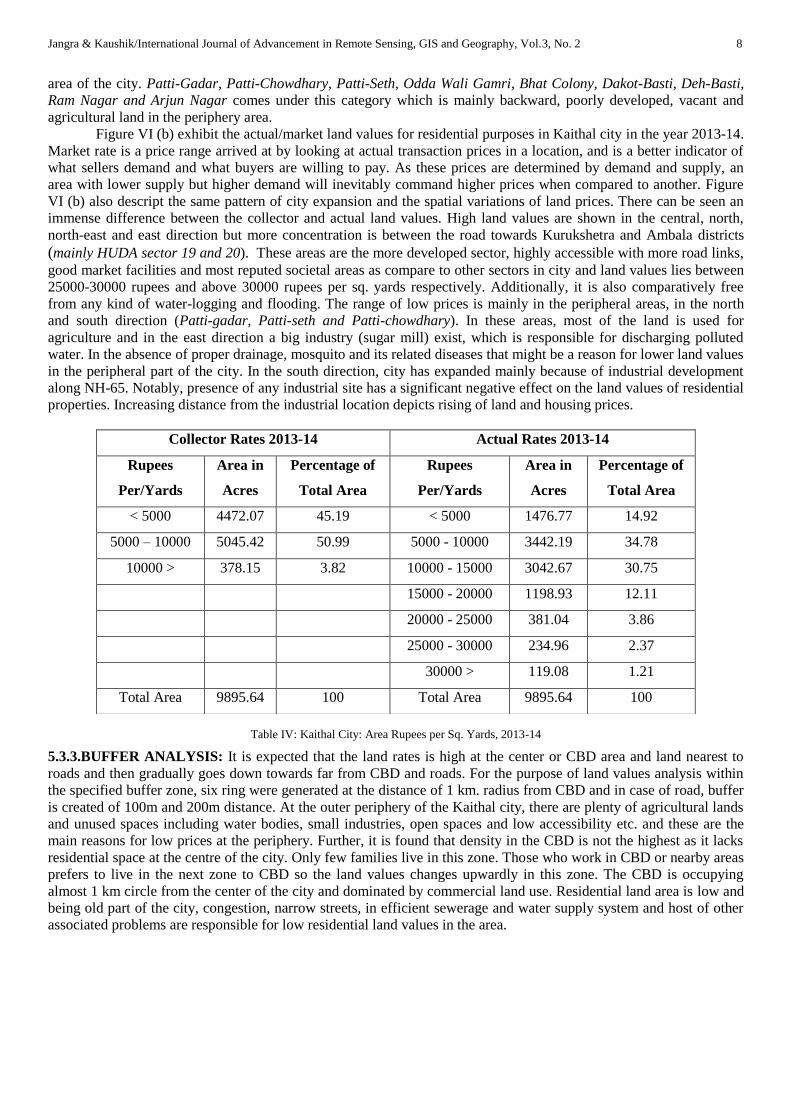
The dark shade in the figure VI (a) represents the area having more than 10,000 rupees per sq. yard land prices and
this patch is under the HUDA sectors or private sectors. It occupied 378.15 acres (3.82 percent) of the total area of the
city. The average prices (5000-10000 rupees per sq. yards) are presently prevails in the north-east direction and area of
this land values category is 5045.42 acres which is more than half (50.99 percent) of the city‟s geographical area.
Amar Garh Colony, Guru Teg-bhahdur Colony, Ashoka Garden, Govind Nagar, Janak-puri, Maya-puri, Friends
Colony, Vashno Colony, Bank Colony, MITC Colony and Model Town are come under this land value category.City‟s
major facilities (public and semi-public) such as main bus stand, colleges, secretariat and government hospital etc.
have been providing an environment of reasonable prices in these directions. The south, south-west and north-west
directions has very low prices (below 5000 rupees per sq. yards) due to poor residential development caused by the
risk of waterlogging, flooding and proximity to industrial zone. It covers 4472.07 acres (45.19 percent) of the total
Land Use Categories Total Area(acre) Percentage (%) of Total
Area
Residential 2561.56 25.89
Commercial 237.06 2.40
Industrial 630.23 6.37
Agriculture 4963.20 50.15
Public and Semi pubic use 375.23 3.79
Transport and Communication Zone 377.22 3.81
Recreational 162.86 1.65
Water bodies 208.19 2.10
Vacant 380.09 3.84
Total 9895.64 100
Jangra & Kaushik/International Journal of Advancement in Remote Sensing, GIS and Geography, Vol.3, No. 2 8
area of the city. Patti-Gadar, Patti-Chowdhary, Patti-Seth, Odda Wali Gamri, Bhat Colony, Dakot-Basti, Deh-Basti,
Ram Nagar and Arjun Nagar comes under this category which is mainly backward, poorly developed, vacant and
agricultural land in the periphery area.
Figure VI (b) exhibit the actual/market land values for residential purposes in Kaithal city in the year 2013-14.
Market rate is a price range arrived at by looking at actual transaction prices in a location, and is a better indicator of
what sellers demand and what buyers are willing to pay. As these prices are determined by demand and supply, an
area with lower supply but higher demand will inevitably command higher prices when compared to another. Figure
VI (b) also descript the same pattern of city expansion and the spatial variations of land prices. There can be seen an
immense difference between the collector and actual land values. High land values are shown in the central, north,
north-east and east direction but more concentration is between the road towards Kurukshetra and Ambala districts
(mainly HUDA sector 19 and 20). These areas are the more developed sector, highly accessible with more road links,
good market facilities and most reputed societal areas as compare to other sectors in city and land values lies between
25000-30000 rupees and above 30000 rupees per sq. yards respectively. Additionally, it is also comparatively free
from any kind of water-logging and flooding. The range of low prices is mainly in the peripheral areas, in the north
and south direction (Patti-gadar, Patti-seth and Patti-chowdhary). In these areas, most of the land is used for
agriculture and in the east direction a big industry (sugar mill) exist, which is responsible for discharging polluted
water. In the absence of proper drainage, mosquito and its related diseases that might be a reason for lower land values
in the peripheral part of the city. In the south direction, city has expanded mainly because of industrial development
along NH-65. Notably, presence of any industrial site has a significant negative effect on the land values of residential
properties. Increasing distance from the industrial location depicts rising of land and housing prices.
Table IV: Kaithal City: Area Rupees per Sq. Yards, 2013-14
5.3.3.BUFFER ANALYSIS: It is expected that the land rates is high at the center or CBD area and land nearest to
roads and then gradually goes down towards far from CBD and roads. For the purpose of land values analysis within
the specified buffer zone, six ring were generated at the distance of 1 km. radius from CBD and in case of road, buffer
is created of 100m and 200m distance. At the outer periphery of the Kaithal city, there are plenty of agricultural lands
and unused spaces including water bodies, small industries, open spaces and low accessibility etc. and these are the
main reasons for low prices at the periphery. Further, it is found that density in the CBD is not the highest as it lacks
residential space at the centre of the city. Only few families live in this zone. Those who work in CBD or nearby areas
prefers to live in the next zone to CBD so the land values changes upwardly in this zone. The CBD is occupying
almost 1 km circle from the center of the city and dominated by commercial land use. Residential land area is low and
being old part of the city, congestion, narrow streets, in efficient sewerage and water supply system and host of other
associated problems are responsible for low residential land values in the area.
Collector Rates 2013-14 Actual Rates 2013-14
Rupees
Per/Yards
Area in
Acres
Percentage of
Total Area
Rupees
Per/Yards
Area in
Acres
Percentage of
Total Area
< 5000 4472.07 45.19 < 5000 1476.77 14.92
5000 – 10000 5045.42 50.99 5000 - 10000 3442.19 34.78
10000 > 378.15 3.82 10000 - 15000 3042.67 30.75
15000 - 20000 1198.93 12.11
20000 - 25000 381.04 3.86
25000 - 30000 234.96 2.37
30000 > 119.08 1.21
Total Area 9895.64 100 Total Area 9895.64 100

Jangra & Kaushik/International Journal of Advancement in Remote Sensing, GIS and Geography, Vol.3, No. 2 9
Fig. VI: Residential Land Values, 2013-14
a) b)

Jangra & Kaushik/International Journal of Advancement in Remote Sensing, GIS and Geography, Vol.3, No. 1 10
Fig. VII: Buffer Analysis
Figure VII depicts that the highest land values both of collector and actual are found in the second ring from the CBD.
The values are continuously increasing towards north-east direction up to 3 km distance from CBD because of the
presence of HUDA and private residential sectors and thereafter it gradually declines towards the periphery due to non-
urban land uses and absence of urban infrastructure. Average rate of each km. radius distance from CBD is displayed in
figure VIII. Further, land rates are analyzed by road buffer as well. Buffer of 100m and 200m from major roads have
maximum land rates thereafter it declines sharply.
Fig. VIII: Average Rate of Residential Areas Using Buffer

Jangra & Kaushik/International Journal of Advancement in Remote Sensing, GIS and Geography, Vol.3, No. 1 11
Fig. IX: Gap between Collector and Actual Residential Land Rates, 2013-14
5.3.4.GAP BETWEEN COLLECTOR AND ACTUAL RATE: The gap between collector and actual rate helps in to
observe the seller‟s expectation of price and the buyer‟s inclination to pay and it indications the area of demand in city.
The premier gap in land rates appears in north-east direction mainly HUDA sector 19 and 20 and it is also high land
values location. Low gap in land values (below 5000 rupees per sq. yards) have been seen in south, south-west, north-west
and east directions due to scattered residential development in agriculture periphery areas, risk of water-logging, flooding
and proximity to industrial zone.
6. CONCLUSION: Present study has identified the spatial variation in residential land rates and gaps between the
collector and actual rates. Study results shows that the north-eastern parts of the city are the high residential land value
zone. Gap between the collector rate and market rate follow the same trend of actual residential land values zone and
south, south-west and north-west directions depicts the low gap in land prices. Though collector rates and market rates are
connected, they have a limited impact on each other. While, the market rate can never be below the collector rate, a
significantly higher difference between them indicates a lag between market performance and the authority‟s view of it.
Wider gaps between actual and market land rate generate black money (house taxes and registry income etc.) which is
highly rampant throughout the country in all size urban settlements. Hence, in order to tackle the black money risk and to
provide fair compensation to the affected families whose land to be acquired, GIS based digital property data base can
well assist to revise and update the market value of the land on the basis of the prevalent market rate in that area before
initiation of any land acquisition proceedings.
REFERENCES:
1. Rajeshwari, 2006, Management of the Urban Environment Using Remote Sensing and Geographical Information Systems, J. Hum. Ecol., vol. 20(4), p. 269-277.
2. Hough, M., 1990, Out of Place, Boston, Yale University Press. 3. Davis, M.A. and Palumbo, M.G., 2008, The Price of Residential Land in Large US Cities, Journal of Urban Economics, vol. 63, p.
352–384.
Jangra & Kaushik/International Journal of Advancement in Remote Sensing, GIS and Geography, Vol.3, No. 1 12
4. Holly, S., Pesaran, M.H., and Yamagata, T., 2009, A Spatio-Temporal Model of House Prices in the US, IZA Discussion, paper no. 2338.
5. Bhatta, B., 2010, Analysis of Urban Growth and Sprawl from Remote Sensing Data, vol. 20, p. 172. 6. Park, R.E., Burgess, W, and the City University of Chicago, 5th Impression, Environmental Sanitation in Urban Areas in Nigeria,
Nigerian Geographical Journal, vol. 20, no. 1. 7. Donnay Jean-Paul, Barnsley Michael J. and Longley Paul A. (Eds.), 2001, Remote Sensing and Urban Analysis, Taylor and
Francis, London, p. 228-239. 8. Acioly, C. C., Jr. and Davidson, F., 1996, Density in Urban Development, in Building Issues, 3(8), Lund Centre for Habitat Studies,
Lund University, Sweden. 9. Olayiwola, L. M., Adeleye, O. and Oduwaye, O., 2006, Spatial Variation in Residential Land Value Determinants in Lagos, Nigeria,
Promoting Land Administration and Good Governance 5th FIG Regional Conference, March 8-11, Accra, Ghana. 10. Bakker, M. M. and Van Doorn, A. M., 2009, Farmer-Specific Relationships between Land Use Change and Landscape Factors:
Introducing Agents in Empirical Land Use Modelling, Land Use Policy, vol. 26(3), p. 809–817. 11. Xu, H., X. Wang, and G. Xiao, 2000, A Remote Sensing and GIS Integrated Study on Urbanization with its Impact on Arable Lands:
Fuqing City, Fujian Province, China, Land Degradation and Development, vol. 11(4), p. 301–314. 12. Xian, G., and M. Crane, 2005, Assessment of Urban Growth in the Tampa Bay Watershed using Remote Sensing Data, Remote
Sensing of Environment, vol. 97(2), p. 203–205. 13. Masek, J.G., F.E. Lindsay, and S.N. Goward, 2000,Dynamics of Urban Growth in the Washington Dc Metropolitan Area, 1973–
1996, from Landsat Observations, International Journal of Remote Sensing, vol. 21(18), p. 3473–3486. 14. Zhang, Q., J. Wang, X. Peng, P. Gong, and P. Shi, 2002,Urban Built-Up Land Change Detection with Road Density and Spectral
Information from Multi-Temporal Landsat TM Data, International Journal of Remote Sensing, vol. 23(15), p. 3057–3078. 15. Wu, H., J. Jiang, J. Zhou, H. Zhang, L. Zhang, and L. Ai, 2005,Dynamics of Urban Expansion in Xi’an City using Landsat Tm/Etm
Data,ActaGeographicaSinica, vol. 60(1), p. 143–150. 16. Zha, Y., J. Gao, and S. Ni, 2003,Use of Normalized Difference Built-Up Index in Automatically Mapping Urban Areas from TM
Imagery, International Journal of Remote Sensing, vol. 24(3), p. 583–594.
17. Fujita, M., 1989, Urban Economic Theory, Cambridge, Cambridge University Press. 18. Geoghegan, J., Wainger, L.A., and Bockstael, N.E., 1997, Spatial Landscape Indices in a Hedonic Framework: An Ecological
Economics Analysis Using GIS, Ecological Economics, vol. 23, p. 251–264. 19. Tyrvainen, L. and Miettinen, A., 2000, Property Prices and Urban Forest Amenities, Journal of Environmental Economics and
Management, vol. 39, p. 205–23. 20. Irwin, E.G., and Bockstael, N.E., 2001, The Problem of Identifying Land Use Spillovers: Measuring the Effects of Open Space on
Residential Property Values, American Journal of Agricultural Economics, vol. 83, p. 698–704. 21. Kestens, Y., Thériault, M. and Des Rosiers, F., 2004, The Impact of Surrounding Land Use and Vegetation on Single-family House
Prices, Environment and Planning B, vol.31, p. 539–567. 22. Roe, B., Irwin, E.G., and Morrow-Jones, H.A., 2004, The Effects of Farmland, Farmland Preservation, and Other Neighborhood
Amenities on Housing Values and Residential Growth, Land Economics, vol.80, p. 55–75. 23. Nagot, F. G., Reginster, I. and Thomas, I., 2009, A Spatial Analysis of Residential land Prices in Belgium: Accessibility, Linguistic
Border and Environmrntal Amenities, Groupe d’ Analyseet de Theorie Economique (GATE).