2q 2016 results - listed companydigi.listedcompany.com/misc/presentation/presentation2q16.pdf ·...
TRANSCRIPT

1
2Q 2016 RESULTS Albern Murty, CEO 11 JUL 2016

2
Disclaimer
This presentation and the following discussion may contain forward looking statements by Digi.com Berhad (Digi) related to financial trends for future periods. Some of the statements contained in this presentation or arising from this discussion which are not of historical facts are statements of future expectations with respect to financial conditions, results of operations and businesses, and related plans and objectives. Such forward looking statements are based on Digi’s current views and assumptions including, but not limited to, prevailing economic and market conditions and currently available information. These statements involve known and unknown risks and uncertainties that could cause actual results, performance or achievements to differ materially from those in the forward looking statements. Such statements are not and, should not be construed, as a representation as to future performance or achievements of Digi. In particular, such statements should not be regarded as a forecast or projection of future performance of Digi. It should be noted that the actual performance or achievements of Digi may vary significantly from such statements.

3
Key Highlights Performance Review 2016 Outlook Q&A

4
2Q 2016 Resilient performance anchored on solid postpaid growth
SOLID POSTPAID REVENUE GROWTH
RESILIENT SERVICE REVENUE
STRONGER SEQUENTIAL EBITDA
6.0% q-q and 9.8% y-y
RM1,557 m
Up 4.4% to RM735 m or 44% margin
Key Highlights
62.0% Smart- phones
LTE-A @ KMCs
76% 4G LTE
~ 8 m Internet
Subs
3.3 m LTE Subs
HIGHER SHAREHOLDERS RETURN
5.4 sen dividend per share equivalent to RM420 million or almost 100% payout ratio
Note: KMCs refer to key market centers

5
2Q 2016 Sprinting ahead with 4G LTE-A deployment
Network
• Lead the market with deployment of LTE-A network in key market centres (KMCs)
– Twice the internet speed of 4G LTE covering more than 34% of population nationwide
• Rapid expansion of 4G LTE network coverage to 76% of the
population – Available in 191 major towns and cities, supported by
6,500 LTE sites and 7,000 km of fiber network – Higher efficiency and quality of data services with
increasing traffic delivery on 4G LTE network from to 27%, from 6% a year ago
• Proliferate growth of LTE subscribers to 3.3 million with consistent high speed internet experience on their 4G LTE capable smartphones and devices
• Highly committed on strengthening 4G LTE network while leveraging on efficient technology and fiber rollout to support customers growing digital lifestyle

6
Digital Businesses
2Q 2016 Putting skin in the game towards digital transformation
Digital Innovations
• Revolutionise and digitise as a next step of digital transformation
• Appointment of Chief Digital Officer and empower dedicated digital teams to develop digitally adjacent businesses, digital innovations and unlock new business partnerships
• Digitise core mobile business across products, channels, marketing and delivery
– Intuitive digital channels for dealer distribution and customer self-serve functions
– Enable nimble and agile operations with significantly improved speed to execution and to serve more customers nationwide efficiently
• Leverage on Telenor’s scale and opportunities on
– Acquisitions of global platforms and capabilities – Strategic partnerships with global digital players – Adjacent digital businesses opportunities such as
financial services and cloud storage
Accelerate digital transformation
Digital Products / Channels
Digital Marketing
Digital Engineering and Delivery
Leverage on Telenor’s digital businesses and partnerships
Opportunities via global platforms and capabilities
1
2
Partnerships / Digital Startups
Digital Innovation
CDO (Digi-X)
Adjacent digital opportunities
DIGITISING OF CORE BUSINESS

7
2Q 2016 Making “sens” on MyDigi lifestyle app
Digital Innovations
MyDigi - one stop digital platform for intuitive self-care, customer support, rewards and primary distribution channel to customers
• One view of all Digi accounts
• Convenience of instant bill payment and purchase reload
• Personalise setting such as internet sharing, change of plans
• Purchase Add-Ons and services
• In-app customer support and rewards coming soon!
• > 750K monthly active users and growing
• Positive NPS score since MyDigi launch. App rating of 4 for both Android and iOS
• 4-5 folds increase in bill payment transactions.

8
Digi Incub8
• Pre-accelerator program for idea stage startups
• 6-day intensive bootcamp
• Access to business support, mentorship, capital and the network to build and grow digital business opportunities
2Q 2016 Fuelling digital innovations and opportunities amongst budding entrepreneurs
Digital innovations
Digi Accelerator
• 360' launchpad to fast track startup businesses
• 4-month bootcamp with regional and global exposure, seed funding, as well as commercialisation support
• 1st batch of winners: Vase, Local Usher and GrabGas
Telenor - Digi Ignite
• Global startup program for budding intrapreneurs with great ideas on digital products or services
• 1st batch of 8 winners from across 10 countries - Digi’s ALFRED team
among the winning team
ENGAGEMENT WITH START-UP COMMUNITIES

9
2Q 2016 Bringing the best choices, convenience and value for Digi’s customers
Products and Marketing
• Actively designed and shaped postpaid value propositions relevant to changes in customers’ behaviour and lifestyle
– Sharpened focus on internet, digital services, flexible internet sharing propositions
– Embarked on nationwide 4G LTE carnival with affordable 4G bundles
– Launched quota top up campaigns and promotions on higher tiered subscriptions
– Continued to tap on prepaid to postpaid migration
• Targeted campaigns with stronger prepaid mobile internet proposition on the back of rationalised IDD prices
– Introduced internet centric reload voucher – Bundled internet subscriptions with promotional
quota upsizing and complimentary off-peak quotas – 360° Ramadan prepaid campaigns in conjunction with
Hari Raya festive
• Relentlessly innovate to make life easier for customers such as the flexibility of charging in-app and game purchases to Digi postpaid and prepaid account via Google Play Store
Internet sharing
4G LTE carnival and Internet campaigns

10
Key Highlights Performance Review 2016 Outlook Q&A

11
2Q 2016 Resilient service revenue performance against relatively weaker industry development
Performance Review
1.3%
-1.8% -2.0% -1.9%
-4.8% -8.0%-6.0%-4.0%-2.0%0.0%2.0%4.0%6.0%8.0%
10.0%12.0%
2Q15 3Q15 4Q15 1Q16 2Q16
Postpaid Prepaid
Service revenue Industry
Relatively steady y-y service revenue development consistent with preceding quarter
0.1%
-1.7% -0.2%
-1.7% -3.7%
-6.0%
-4.0%
-2.0%
0.0%
2.0%
4.0%
6.0%
8.0%2Q15 3Q15 4Q15 1Q16 2Q16
Postpaid Prepaid
Service revenue Industry
Sustained service revenue q-q amid month-long Ramadhan effects in 2Q16
Y-Y Q-Q
Effects from significant shift in market conditions
• Industry refers to mobile service revenue from the 3 leading mobile operators in Malaysia • Ramadhan month usually observes moderated voice traffic and revenue on prepaid • Post 2Q16 Y-Y comparison will be more comparable with similar market conditions

12
• Steady subscriber base at 12.3 million although challenged by lower daily active subscribers and high rotational churn
– Internet subscribers increased to almost 8.0 million or 64.5% of total subscribers
– Smartphone penetration rose to 62.0%
• Robust growth development on postpaid continued to bolster decline on prepaid service revenue from prolonged price war and IDD price rationalisation
• Service revenue sustained q-q on the back of steady ARPU and subscriber base with increasing contribution from postpaid
– Internet revenue grew 4.3% q-q and 10.8% y-y, contributing to 36.1% of service revenue for the quarter
• Steadily strengthened service revenue market share
market although y-y development continued to be distorted by significant shift in market conditions since 2H 2015
11,815 11,675 12,125 12,336 12,347
6,843 7,024 7,502 7,917 7,965
2Q15 3Q15 4Q15 1Q16 2Q16
1,589 1,584 1,587 1,560 1,557
Subscribers (‘000)
Service revenue (RM m)
45 45 44 42 42 ARPU (RM)
Internet
Blended
Non-Internet
2Q 2016 Well-fought quarter with sustained service revenue at RM1.56 billion
Performance Review

13
• Successfully translated robust 4G LTE network built into stronger postpaid opportunities
– Postpaid subscriber base strengthened 2.7% q-q and 10.3% y-y to almost 2.0 million
• Solid postpaid ARPU development fuelled by
– Positive take-up on higher tiered plans – Steady increase in postpaid internet subscribers
to 1.6 million or 81.7% – Strong postpaid internet revenue growth of 15.5%
q-q and 26.5% y-y to RM239 million
• Postpaid service revenue surged 6.0% q-q and 9.8% y-y to RM492 million
– Contributed to 31.6% of total service revenue
• Innovative postpaid propositions and tactical campaigns coupled with incremental boost from digital self service capabilities spurred positive growth opportunity for postpaid
Postpaid
1,771 1,776 1,840 1,902 1,954
1,351 1,400 1,442 1,527 1,596
2Q15 3Q15 4Q15 1Q16 2Q16
448 443 450 464 492
82 81 80 80 82
Subscribers (‘000)
Service revenue (RM m)
ARPU (RM)
Internet
Non-Internet
2Q 2016 Solid postpaid growth supported by stronger subscriber base and ARPU
Performance Review

14
• Launched a series of targeted prepaid campaigns to improve data monetisation through prepaid mobile internet subscriptions and recalibrated IDD pricing
• Prolonged price war continued to hamper immediate growth
– Prepaid subscriber base relatively flat at 10.4 million on the back of higher rotational churns and more targeted acquisition efforts
– Prepaid ARPU dipped marginally to RM34
• Stronger data monetisation and IDD margin uplifts but prepaid service revenue levelled 2.8% q-q and 6.7% y-y mainly due to lower IDD traffic post rationalisation and also effects from continued migration to postpaid plans
• Effects from continued migration to postpaid diluted incremental revenue from prepaid internet subscriptions for the quarter
– Prepaid internet revenue moderated 2.7% sequentially but 1.6% higher y-y to RM323 million
Prepaid
10,044 9,899 10,285 10,434 10,393
5,493 5,624 6,060 6,390 6,369
2Q15 3Q15 4Q15 1Q16 2Q16
1,141 1,141 1,137 1,096 1,065
38 38 38 35 34
Subscribers (‘000)
Service revenue (RM m)
ARPU (RM)
Internet
Non-Internet
2Q 2016 Modest prepaid service revenue but substantiated by stronger data monetisation
Performance Review
15
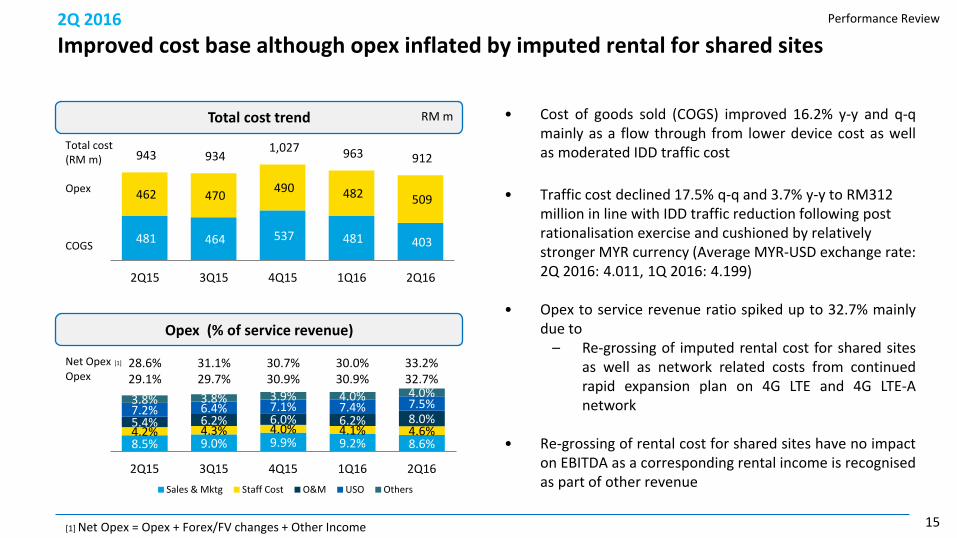
8.5% 9.0% 9.9% 9.2% 8.6% 4.2% 4.3% 4.0% 4.1% 4.6% 5.4% 6.2% 6.0% 6.2% 8.0% 7.2% 6.4% 7.1% 7.4% 7.5% 3.8% 3.8% 3.9% 4.0% 4.0%
2Q15 3Q15 4Q15 1Q16 2Q16Sales & Mktg Staff Cost O&M USO Others
28.6% 31.1% 30.7% 30.0% 33.2% 29.1% 29.7% 30.9% 30.9% 32.7%
2Q 2016 Improved cost base although opex inflated by imputed rental for shared sites
Total cost trend
481 464 537 481 403
462 470 490 482 509
943 934 1,027 963 912
2Q15 3Q15 4Q15 1Q16 2Q16
Opex (% of service revenue)
RM m • Cost of goods sold (COGS) improved 16.2% y-y and q-q mainly as a flow through from lower device cost as well as moderated IDD traffic cost
• Traffic cost declined 17.5% q-q and 3.7% y-y to RM312 million in line with IDD traffic reduction following post rationalisation exercise and cushioned by relatively stronger MYR currency (Average MYR-USD exchange rate: 2Q 2016: 4.011, 1Q 2016: 4.199)
• Opex to service revenue ratio spiked up to 32.7% mainly due to
– Re-grossing of imputed rental cost for shared sites as well as network related costs from continued rapid expansion plan on 4G LTE and 4G LTE-A network
• Re-grossing of rental cost for shared sites have no impact
on EBITDA as a corresponding rental income is recognised as part of other revenue
[1] Net Opex = Opex + Forex/FV changes + Other Income
Net Opex [1]
Opex
Performance Review
Total cost (RM m) Opex COGS

16
2Q 2016 EBITDA and PAT strengthened sequentially
PAT and margin
788 719 701 704 735
46% 43% 41% 43% 44%
0%20%40%60%80%100%
- 200 400 600 800
1,000
2Q15 3Q15 4Q15 1Q16 2Q16
EBITDA and margin RM m
RM m
• EBITDA improved 4.4% sequentially to RM735 million or 44% margin anchored by notable uplifts from IDD margins and stronger data monetisation
• Narrowed y-y EBITDA decline to 6.7% from 9.2% in the preceding quarter
• Depreciation for the quarter improved 8.3% q-q to RM143 million (1Q 2016: RM156 million)
– Adjusted for RM20 million reversal of over-accrued depreciation relating to prior years
– Identified after the completion of a comprehensive asset register review undertaken as part of good governance
• PAT increased to RM421 million, up 5.5% q-q as a flow
through from stronger EBITDA and lower depreciation for the quarter
464 397 382 399 421
27% 24% 22% 24% 25% -10%
10%
30%
50%
70%
90%
-
200
400
600
800
2Q15 3Q15 4Q15 1Q16 2Q16
+4.4% -6.7%
+5.5% -9.3%
Performance Review
17
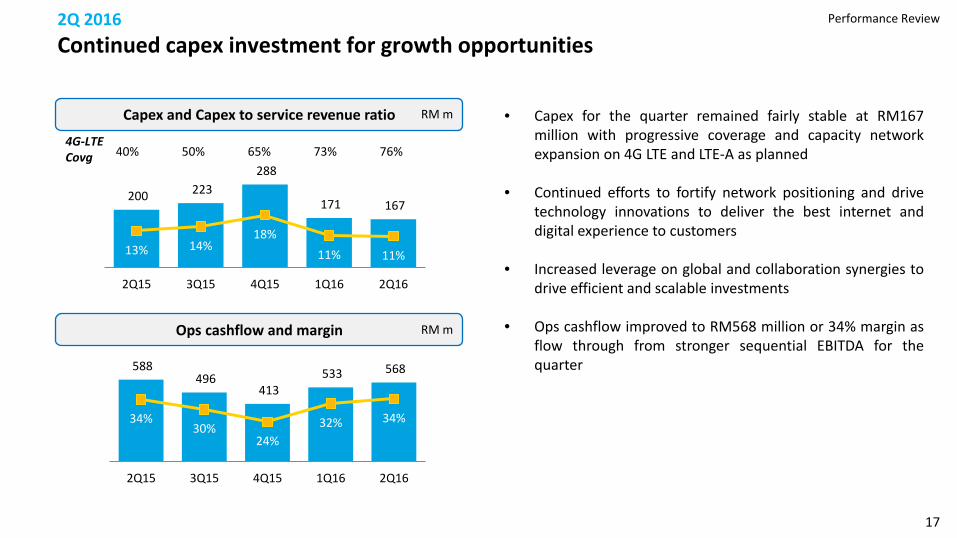
200 223 288
171 167
13% 14% 18%
11% 11% 0%
10%
20%
30%
-
100
200
300
2Q15 3Q15 4Q15 1Q16 2Q16
2Q 2016 Continued capex investment for growth opportunities
Ops cashflow and margin
Capex and Capex to service revenue ratio RM m
RM m
• Capex for the quarter remained fairly stable at RM167 million with progressive coverage and capacity network expansion on 4G LTE and LTE-A as planned
• Continued efforts to fortify network positioning and drive technology innovations to deliver the best internet and digital experience to customers
• Increased leverage on global and collaboration synergies to drive efficient and scalable investments
• Ops cashflow improved to RM568 million or 34% margin as flow through from stronger sequential EBITDA for the quarter
4G-LTE Covg 40% 50% 65% 73% 76%
588 496
413 533 568
34% 30%
24% 32% 34%
0%
10%
20%
30%
40%
50%
(100)
100
300
500
700
2Q15 3Q15 4Q15 1Q16 2Q16
Performance Review

18
5.9 5.1 4.9 5.1 5.4
6.0 5.1 4.9 5.1 5.4
99% 100% 100% 100% 100%
0%
20%
40%
60%
80%
100%
120%
(2.0)
3.0
8.0
13.0
2Q15 3Q15 4Q15 1Q16 2Q16DPS EPS
2Q15 3Q15 4Q15 1Q16 2Q16 Total Assets 4,441 4,449 4,662 4,922 4,708
Total Equity 596 534 519 537 562
Interest-bearing debts
1,246 1,296 1,294 1,631 1,424
Cash & cash equivalents
303 306 234 503 366
2Q 2016 Healthy shareholders’ returns
• Earnings per share (EPS) improved to 5.4 sen, up 5.9% q-q
• 2nd interim dividend at 5.4 sen per share (net) equivalent to RM420 million or almost 100% payout, payable to shareholders on 30 September 2016
• Total assets moderated to RM4,708 million mainly due to lower cash balances after repayment of RM400 million revolving credit (RC) facility
• Interest-bearing debts moderated to RM1.4 billion net of repayment RC and drawdown of additional term loan of RM200 million during the quarter
• Balance sheet remained robust on the back of prudent net debt to EBITDA ratio at 0.4x with continued investments on network and IT infrastructure capabilities to drive growth opportunities
EPS and DPS
Balance sheet
Payout Ratio
sen
RM m
Performance Review

19
Key Highlights Performance Review 2016 Outlook Q&A

20
• Our competitive network, growing digital capabilities and relentless drive to become customers’ favourite partner in digital life will provide Digi with strong resilience against competition headwinds while unlocking growth opportunities from postpaid and digital services
• Focus for the next 6 months will be to – Capitalise on growing data demand to drive data
monetisation and profitable growth – Deliver on the building blocks on digital
transformation journey – Coordinate efforts to strengthen operational
efficiency
• 2016 financial guidance as follows:
2Q 2016 Exciting journey into 2H 2016 with more choices and flexibility for customers
2016 Outlook
2016 Guidance 1H16
Service revenue Sustain at 2015 level
3,117
EBITDA margin 43.5%
Capex 13% -14% of service revenue (revised) 10.8%

21
Q&A


23
Appendix

24
2Q 2016 Stronger data monetisation with 4.3% sequentially higher internet revenue
281
134 102
66
109
2Q15 3Q15 4Q15 1Q16 2Q16
No. of smartphones & devices sold
‘000
57.9% 60.2% 61.9% 64.2% 64.5%
57.1% 58.4% 59.2% 61.3% 62.0%
Appendix
507 530 535 539 562
115 112 119 117 110 51 49 42 38 36
673 691 696 694 708
2Q15 3Q15 4Q15 1Q16 2Q16
Penetration and data revenue
Data Rev (RM m) VAS Messaging Internet
% of internet subscribers % smartphone subscribers

25
2Q 2016 Key operating performance KPIs
(RM m) 2Q16 1Q16 4Q15 3Q15 2Q15 1Q15 4Q14 3Q14 2Q14 Q-o-Q Y-o-Y
Subscribers (‘000) 12,347 12,336 12,125 11,675 11,815 11,691 11,421 11,345 10,903 0.1% 4.5% Internet subscribers (‘000) 7,965 7,917 7,502 7,024 6,843 6,624 6,452 6,011 5,384 0.6% 16.4%
MOU 203 217 221 226 240 235 248 252 251 -6.5% -15.4% Revenue 1,655 1,653 1,725 1,675 1,723 1,791 1,799 1,756 1,746 0.1% -3.9% Service revenue 1,557 1,560 1,587 1,584 1,589 1,588 1,627 1,584 1,568 -0.2% -2.0%
EBITDA 735 704 701 719 788 775 801 789 795 4.4% -6.7%
EBITDA margin 44% 43% 41% 43% 46% 43% 45% 45% 46% 1.8pp -1.3pp Depreciation & Amortisation (143) (156) (169) (170) (150) (140) (132) (127) (115) -8.3% -4.7%
EBIT 592 548 532 549 638 635 669 662 680 8.0% -7.2% Net finance (costs)/income (16) (14) (13) (12) (12) (9) (9) (5) (6) 14.3% 33.3%
Profit Before Tax 576 534 519 537 626 626 660 657 674 7.9% -8.0% Taxation 155 135 137 140 162 147 100 170 175 14.8% -4.3%
Profit After Tax 421 399 382 397 464 479 560 487 499 5.5% -9.3%
EPS (sen) 5.4 5.1 4.9 5.1 6.0 6.2 7.2 6.3 6.4 5.9% -10.0%
Prepaid ARPU (RM) 34 35 38 38 38 39 41 41 41 -2.9% -10.5% Postpaid ARPU (RM) 82 80 80 81 82 81 83 82 83 2.5% 0.0% Blended ARPU (RM) 42 42 44 45 45 46 47 47 48 0.0% -6.7%
Appendix
26
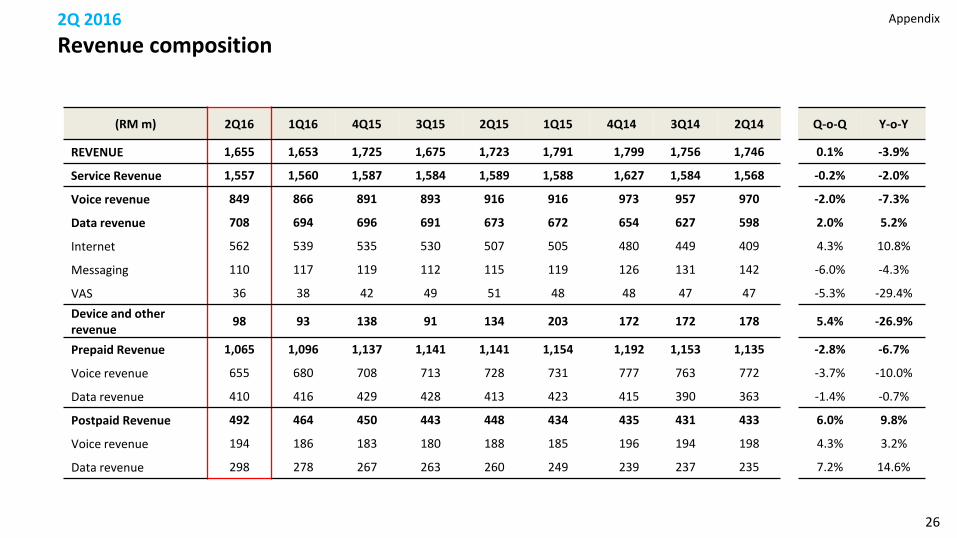
2Q 2016 Revenue composition
(RM m) 2Q16 1Q16 4Q15 3Q15 2Q15 1Q15 4Q14 3Q14 2Q14 Q-o-Q Y-o-Y
REVENUE 1,655 1,653 1,725 1,675 1,723 1,791 1,799 1,756 1,746 0.1% -3.9%
Service Revenue 1,557 1,560 1,587 1,584 1,589 1,588 1,627 1,584 1,568 -0.2% -2.0%
Voice revenue 849 866 891 893 916 916 973 957 970 -2.0% -7.3%
Data revenue 708 694 696 691 673 672 654 627 598 2.0% 5.2%
Internet 562 539 535 530 507 505 480 449 409 4.3% 10.8%
Messaging 110 117 119 112 115 119 126 131 142 -6.0% -4.3%
VAS 36 38 42 49 51 48 48 47 47 -5.3% -29.4% Device and other revenue 98 93 138 91 134 203 172 172 178 5.4% -26.9%
Prepaid Revenue 1,065 1,096 1,137 1,141 1,141 1,154 1,192 1,153 1,135 -2.8% -6.7%
Voice revenue 655 680 708 713 728 731 777 763 772 -3.7% -10.0%
Data revenue 410 416 429 428 413 423 415 390 363 -1.4% -0.7%
Postpaid Revenue 492 464 450 443 448 434 435 431 433 6.0% 9.8%
Voice revenue 194 186 183 180 188 185 196 194 198 4.3% 3.2%
Data revenue 298 278 267 263 260 249 239 237 235 7.2% 14.6%
Appendix

27
2Q 2016 COGS and OPEX
(RM m) 2Q16 1Q16 4Q15 3Q15 2Q15 1Q15 4Q14 3Q14 2Q14 Q-o-Q Y-o-Y
COGS 403 481 537 464 481 551 525 536 524 -16.2% -16.2%
Cost of materials 91 103 156 98 157 228 197 177 183 -11.7% -42.0%
Traffic charges 312 378 381 366 324 323 328 359 341 -17.5% -3.7%
OPEX 509 482 490 470 462 463 473 428 432 5.6% 10.2%
Sales & marketing 134 144 157 142 135 145 140 133 133 -6.9% -0.7%
Staff costs 72 64 63 68 67 64 72 58 58 12.5% 7.5%
Operations & maintenance 124 96 96 98 85 86 85 76 81 29.2% 45.9%
Other expenses 179 178 174 162 175 168 176 161 160 0.6% 2.3%
USP fund and license fees 116 116 112 102 115 113 112 107 107 0.0% 0.9%
Credit loss allowances 13 14 14 12 8 8 9 10 6 -7.1% 62.5%
Others 50 48 48 48 52 47 55 44 47 4.2% -3.8%
TOTAL 912 963 1,027 934 943 1,014 998 964 956 -5.3% -3.3%
Appendix

28
(RM m) 2Q16 1Q16 4Q15 3Q15 2Q15 1Q15 4Q14 3Q14 2Q14 Q-o-Q Y-o-Y Cash at start 503 234 306 303 357 526 259 403 372 115.0% 40.9%
Cashflow from operations 728 546 535 523 744 551 524 780 770 33.3% -2.2% Changes in working capital (103) (77) 72 98 (327) 29 1 93 (65) 33.8% -68.5%
Cashflow used in investing activities (162) (168) (280) (218) (198) (189) (226) (271) (191) -3.6% -18.2%
Cashflow used in financing activities (599) (31) (396) (409) (277) (561) (37) (746) (483) 1832.3% 116.2%
Net change in cash (136) 270 (69) (6) (58) (170) 262 (144) 31 -150.4% 134.5%
Effect of exchange rate changes on cash and cash equivalents
(1) (1) (3) 9 4 1 5 0 0 0.0% -125.0%
Cash at end 366 503 234 306 303 357 526 259 403 -27.2% 20.8%
Capex 167 171 288 223 200 193 233 276 193 -2.3% -16.5% Ops cashflow (EBITDA – Capex) 568 533 413 496 588 582 568 513 602 6.6% -3.4%
2.1 0.2pp Ops cashflow margin 34% 32% 24% 30% 34% 32% 32% 29% 34%
2Q 2016 Cashflow
Appendix